 Yuqi Han1,2,3†
 Fan Chai4†
 Jingwei Wei2,3†
 Yali Yue5,6†
 Jin Cheng4Dongsheng Gu2,3Yinli Zhang7
 Tong Tong5,6
 Weiqi Sheng6,8
 Nan Hong4
 Yingjiang Ye9
 Yi Wang4*
 Jie Tian2,3,10,11*
- 1School of Life Science and Technology, Xidian University, Xi'an, China
- 2Key Laboratory of Molecular Imaging, Institute of Automation, Chinese Academy of Sciences, Beijing, China
- 3Beijing Key Laboratory of Molecular Imaging, Beijing, China
- 4Department of Radiology, Peking University People's Hospital, Beijing, China
- 5Department of Radiology, Fudan University Shanghai Cancer Center, Shanghai, China
- 6Department of Oncology, Shanghai Medical College, Fudan University, Shanghai, China
- 7Department of Pathology, Peking University People's Hospital, Beijing, China
- 8Department of Pathology, Fudan University Shanghai Cancer Center, Shanghai, China
- 9Department of Gastrointestinal Surgery, Peking University People' Hospital, Beijing, China
- 10Beijing Advanced Innovation Centre for Big Data-Based Precision Medicine, School of Medicine, Beihang University, Beijing, China
- 11Engineering Research Centre of Molecular and Neuro Imaging of Ministry of Education, School of Life Science and Technology, Xidian University, Xi'an, China
Purpose: Developing an MRI-based radiomics model to effectively and accurately predict the predominant histopathologic growth patterns (HGPs) of colorectal liver metastases (CRLMs).
Materials and Methods: In this study, 182 resected and histopathological proven CRLMs of chemotherapy-naive patients from two institutions, including 123 replacement CRLMs and 59 desmoplastic CRLMs, were retrospectively analyzed. Radiomics analysis was performed on two regions of interest (ROI), the tumor zone and the tumor-liver interface (TLI) zone. Decision tree (DT) algorithm was used for radiomics modeling on each MR sequence, and fused radiomics model was constructed by combining the radiomics signature of each sequence. The clinical and combination models were developed through multivariate logistic regression method. The performance of the developed models was assessed by receiver operating characteristic (ROC) curves with indicators of area under curve (AUC), accuracy, sensitivity, and specificity. A nomogram was constructed to evaluate the discrimination, calibration, and usefulness.
Results: The fused radiomicstumor and radiomicsTLI models showed better performance than any single sequence and clinical model. In addition, the radiomicsTLI model exhibited better performance than radiomicstumor model (AUC of 0.912 vs. 0.879) in internal validation cohort. The combination model showed good discrimination, and the AUC of nomogram was 0.971, 0.909, and 0.905 in the training, internal validation, and external validation cohorts, respectively.
Conclusion: MRI-based radiomics method has high potential in predicting the predominant HGPs of CRLM. Preoperative non-invasive identification of predominant HGPs could further explore the ability of HGPs as a potential biomarker for clinical treatment strategy, reflecting different biological pathways.
Introduction
The inter- and intra-lesion heterogeneities of genetic, epigenetic, phenotypic, and morphologic characteristics leads to differences in overall survival response to systemic treatment in patients with colorectal liver metastasis (CRLM) (1). One of these heterogeneities appears as histopathological growth patterns (HGPs) and corresponding microvasculatures (2, 3). According to the different interface between tumor cells and adjacent liver parenchyma, CRLM mainly has two types of HGPs: the desmoplastic and the replacement; other infrequent types include the pushing and mixed HGPs (4). In the desmoplastic HGP, tumor cells and liver parenchyma are separated by a fibrous rim with lymphocytic infiltration and have a microvasculature of sprouting angiogenesis (3). In the replacement HGP, the tumor cells forming the cell plate are continuous with the hepatocyte plate, with microvasculature of vessel co-option and without angiogenesis (3). The diversity of these biological microenvironments leads to different responses to treatment, especially to the anti-angiogeneic agent (5, 6) and to different long-term prognosis (3, 7, 8). The replacement HGP is identified as a poor predictor of Bevacizumab treatment in patients with CRLMs (9).
The gold standard for HGP diagnosis of CRLMs is the histopathological analysis of the chemo-naïve resected specimen (3). Due to the low percentage of initially resectable lesions and the wide use of preoperative systemic treatment, clinical relevance is seriously limited. Therefore, a preoperative and non-invasive surrogate method is needed to predict different HGP in CRLMs, so as to improve the prognosis and facilitate the treatment strategy. In addition, a non-invasive method to assess the HGPs would also allow for longitudinal follow-up of the response of a lesion to a certain treatment by switch of the HGP.
Heightened soft-tissue resolution, multiparameter acquisition, and functional imaging enable the MRI to be an invaluable imaging method for patients with CRLMs (10). Although there is no direct evidence that the qualitative and quantitative MRI features can predict HGP of CRLMs, preliminary data have provided some clues. In a very limited cohort of seven patients with liver metastases, Semelka et al. demonstrated that the transient enhancement around the lesion on MR images was related to the desmoplastic reaction, inflammatory cell infiltration, and vascular proliferation around the tumor (11). Based on dynamic contrast enhanced (DCE) MRI, O'Connor and Jayson revealed the microvascular heterogeneity is a prognostic and predictive biomarker before bevacizumab containing therapy (12). However, dedicated acquisition and analysis protocol of DCE-MRI also limits clinical relevance (13).
Compared with qualitative gross imaging features, radiomics transforms digital images into quantitative data, analyzes the spatial heterogeneity, and generates imaging biomarkers that can be used as an assistant tool for clinical decision-making (14). It develops rapidly in cancer detection, diagnosis, and therapeutic strategy selection, prediction of prognosis, therapeutic response, and surveillance (15–18). Our previous study showed multidetector CT based radiomics analysis could effectively identify HGP of CRLMs (19). Nevertheless, as far as we know, radiomics model for predicting HGP of CRLMs based on MR images has not been established.
In this study, we aim to develop and validate an MRI-based radiomics model for predicting HGP of CRLMs, so as to effectively screen patients and develop appropriate treatment strategies.
Materials and Methods
Two institutional review boards supported this study and waived the informed consent requirements due to retrospective analysis. The flowchart of this study is showed in Figure 1.
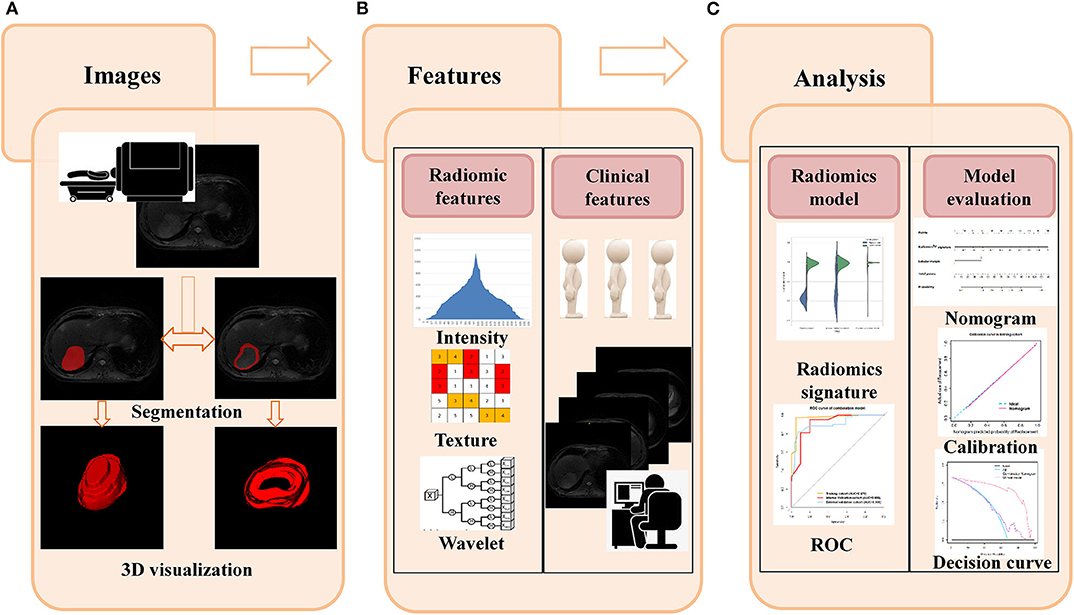
Figure 1. Flowchart for this study. (A) The T2W images were used as an example to illustrate the segmentation process, and slicer-to-slicer delineation obtained two sets of ROI. (B) Multiple radiomic features were extracted from two sets of ROI. Clinical features were obtained from medical records, and qualitative gross imaging features were evaluated by two board-certified radiologists. (C) Intra-/inter-observer coefficients were used to select the stability features, and decision tree were used to construct the radiomics model in each sequence. The best performed sequences and related clinical features were used to form the final classification model. The ROC, calibration curve, and decision curve were used to evaluate the performance of models.
Patient Population
Patients were retrospectively searched in both institutions' histopathological electronic information systems (HIS) from November 2007 and June 2018. The inclusion criteria were as follows: (1) partial hepatectomy was performed; (2) CRLM was proved by histopathological analysis; and (3) a contrast-enhanced abdominal MRI examination was performed within 4 weeks before surgery. The exclusion criteria were as follows: (1) pre-operative systemic and/or regional treatments were performed; (2) MR image quality was inadequate for analysis; and (3) hematoxylin- and eosin-stained (H&E) sections of the tumor-liver interface (TLI) areas of the resected CRLM specimen were inadequate for analysis.
Several clinical characteristics, including age, sex, classification of the CRLMs (synchronous vs. metachronous), time interval from MR scanning to hepatectomy, number of resected lesions per patient, location of primary lesions (left-sided: from the splenic flexure to the rectum vs. right-sided: from the ileocecal junction to the transverse colon) (20), histopathological type and tumor differentiation (high-/moderate- vs. low-differentiated adenocarcinoma) of the primary lesion were derived.
Histopathological Analysis
For all resected specimens, two experienced pathologists (YLZ, 10 years of experience; WQS, 15 years of experience), who were ignorant to the clinical data, reviewed the H&E-stained section from four formalin-fixed paraffin-embedded blocks according to the international consensus guidelines (3). Any subjective disagreement between the two readers was discussed until consensus was reached.
Lesions were categorized according to the 50% cut-off value of the consensus guidelines. Lesions were categorized as desmoplastic, replacement, or pushing HGP when >50% of the interface was scored (i.e., >50% desmoplastic appearance would be classified into desmoplastic HGP; same as the replacement and the pushing HGP). Lesion was considered to be mixed HGP if none of the three HGP was present at >50% of the interface.
MRI Acquisition and Qualitative Feature Analysis
MRI Acquisition
The MRI examinations were performed by 750 W system (GE Healthcare, Milwaukee, WI, USA) and 8-channel phased array torso coils in both institutions. All patients were positioned supine and feet-first. Images used in this study included (i) T2-weighted image (T2WI) of fast recovery fast spin-echo with fat saturation, (ii) Diffusion-weighted imaging and the Apparent diffusion coefficient (ADC) quantification, (iii) T1-weighted image (T1WI), (iv) arterial phase (AP), and (v) portal venous phase (PVP) image of the dynamic contrast-enhanced T1-weighted liver acquisition volume acceleration (LAVA) with chemically selective fat saturation. The conventional abdominal MRI protocol is shown in Table E1. The enhanced images were acquired after the intravenous administration of gadopentetate dimeglumine (Magnevist; Bayer HealthCare Pharmaceuticals, Berlin, Germany) in the arterial phase (46 s after contrast injection) and portal venous phases (79 s after contrast injection).
Qualitative Feature Analysis
Two board-certified abdominal radiologists (FC, 2 years of experience; JC, 10 years of experience), who were ignorant to the histopathologic information and the original MR imaging reports, evaluated the MR image retrospectively and independently. Any subjective disagreement between the two readers was discussed until consensus was reached.
The following features were evaluated and recorded: (1) the location of the tumor: segment I–IV vs. segment V–VIII, based on the Couinaud criteria (21); (2) the contour of the tumor: lobular (defined as a tumor with one or more indentation with an acute angle) or non-lobular (no indentations with an acute angle) (22); (3) the presence or absence of enhanced rim on AP or PVP appearing as a peritumoral, complete ring with higher intensity relative to adjacent liver parenchyma, as well as the solid component of the lesion (11); and (4) the maximum diameter of the tumor (in millimeters) in the axial PVP images.
Model Construction and Assessment
All of these characteristics were further investigated by developing of three models, specifically (1) a radiomics model, including the selected radiomic features; (2) a clinical model, including the clinical and qualitative imaging features; and (3) a combination model, including the selected clinical, qualitative imaging, and radiomic features. Lesions from the first institution were divided into a training cohort and a time-independent internal validation cohort with the ratio of 2:1. Lesions from the second institution were included as an external validation cohort. We evaluated the identification ability of each model by using the receiver operating characteristic (ROC) curve with area under curve (AUC). DeLong tests were used to evaluate the differences of predictive performance among models.
Radiomics Model Construction
Image segmentation
The region of interest (ROI) was manually delineated using ITK-SNAP software (version 2.2.0; www.itksnap.org) on the five sequences (T1W, T2W, AP, PVP, and ADC) images. We constructed two sets of ROIs. The first set of ROIs was delineated along the edge of each target tumor on each consecutive imaging slice to cover the whole tumoral volume. The second set of ROIs was restricted to the TLI zone, which was obtained by subtracting an inner segmentation from an outer segmentation. The outer segmentation was drawn ~2 mm outside the tumor boundary, and the inner segmentation was ~2 mm inside the tumor boundary.
Radiomic features extraction
Radiomic features were respectively extracted from the two sets of ROIs, including 18 first-order statistical features and 74 texture features. The first-order statistical features describe the distribution of voxel intensities in MR images. Textural features that describe the internal heterogeneity of ROI are calculated based on five textural matrices (Appendix E1). Additionally, the three-dimensional coiflets wavelet transformation was applied to decouple texture information for all patient data. Radiomic features were derived from the original image and eight wavelet decompositions for each patient both in TLI and tumor zone. The detailed illustration of these features is shown in Table E2.
Feature selection
The intra/interclass correlation coefficient of each feature was calculated to select the stable feature with the threshold of 0.8 (23) (Figures E1, E2). After pre-screening, we used the robust feature selection (RFS) method to select radiomic features. The RFS method emphasizes the minimization of joint l2,1-norm in loss function and regularization, and selects the features of joint sparsity on all data points (24). We ranked the coefficients of all features and top best features were selected as the effective predictors for later decision tree classifier.
Radiomics signature construction
The decision tree was applied to evaluate the ability of each of the five sequences for predicting HGP. We implemented this algorithm by tuning two parameters, the maximum sample of leaf and the maximum node, in the training process based on the selected features. We obtained five signatures after separately applying this algorithm on the five sequences both in the TLI and in the tumor zone. The forward stepwise regression method was used to select the desired sequences from five signatures, and the final radiomics signature was generated based on the desired sequences through logistics regression method. The decision tree algorithm was implemented by using the Python, version 3.6.5 “scikit-learn” package.
Cross validation
In order to elude the effect of a training/validation cohort split, we performed cross-validation between institutions. Lesions from the second institution were also divided into a training cohort and a time-independent internal validation cohort with the ratio of 2:1, and radiomics analysis was repeated in the final selected sequences. Lesions from the second institution were used as an external validation cohort.
Clinical and Combination Model Construction
Univariate analysis was used to evaluate the significance of clinical and qualitative imaging features in predicting HGPs of CRLMs. The forward stepwise was used to select desired features and construct the clinical model. In order to explore the complementarity between radiomics signature and clinical and qualitative imaging features, a combination model that incorporated the selected clinical and qualitative imaging features and radiomics signature was developed through logistic regression method. The forward stepwise was also used to selected the optimal factors for combination model.
Nomogram Establishment
To offer a quantitative tool to investigate the ability of the combination model for HGP differentiation, we built a nomogram based on the multivariable logistic regression in the training cohort. Plotting calibration curves to evaluate the degree of deviation between the predictions and observed outcomes with Hosmer–Lemeshow test. Moreover, the decision curve analysis (DCA) was carried out to appraise its clinical usefulness by quantifying the net benefit under all threshold probabilities.
Statistical Analysis
The differences of clinical factors between training and validation cohorts were verified by Student's t or Chi-square test. The quantitative variables were displayed by mean and standard deviation (SD). For categorical variables, number (n) and percentage (%) were used. These analyses were carried out on PASW Statistics version 25.0 (SPSS Inc., Chicago, IL, USA).
Results
Clinical and Histopathologic Characteristics
Based on the inclusion and exclusion criteria, a total of 107 patients were involved, including 43 women (40.2%) and 64 men (59.8%), with a median age of 59.79 years (interquartile range, 52–67 years). The median interval between MRI examination and hepatectomy was 17.02 days (interquartile range, 6.75–27.75 days).
Finally, a total of 195 CRLMs were recognized. The average number of lesions of each patient was 1.84 (range, 1–12); 38 patients had multiple CRLMs. There were 59 (30.3%) lesions with desmoplastic HGP (Figure E3a), 123 (63.1%) lesions with replacement HGP (Figure E3b), 10 lesions (5.1%) with pushing HGP, and three lesions (1.5%) with mixed HGP based on the international guidelines for scoring HGPs of liver metastases (3). Only one patient had both replacement and mixed CRLMs. Because of the low prevalence of pushing and mixed HGP, they were excluded from the study. This study finally analyzed 59 desmoplastic HGPs and 123 replacement HGPs.
The lesions from the first institution were grouped into training (n = 61) and internal validation (n = 31) cohort based on the surgery date. The external validation cohort was consisted of 90 lesions from the second institution. Baseline characteristics of these three cohorts are summarized in Table 1. No significant differences were observed for baseline clinical and qualitative imaging characteristics between the training and internal validation cohort (all p > 0.05). Compared with the training cohort, the external validation cohort showed significantly younger age and different occurrence time of the CRLMs; other characteristics were comparable between two cohorts.
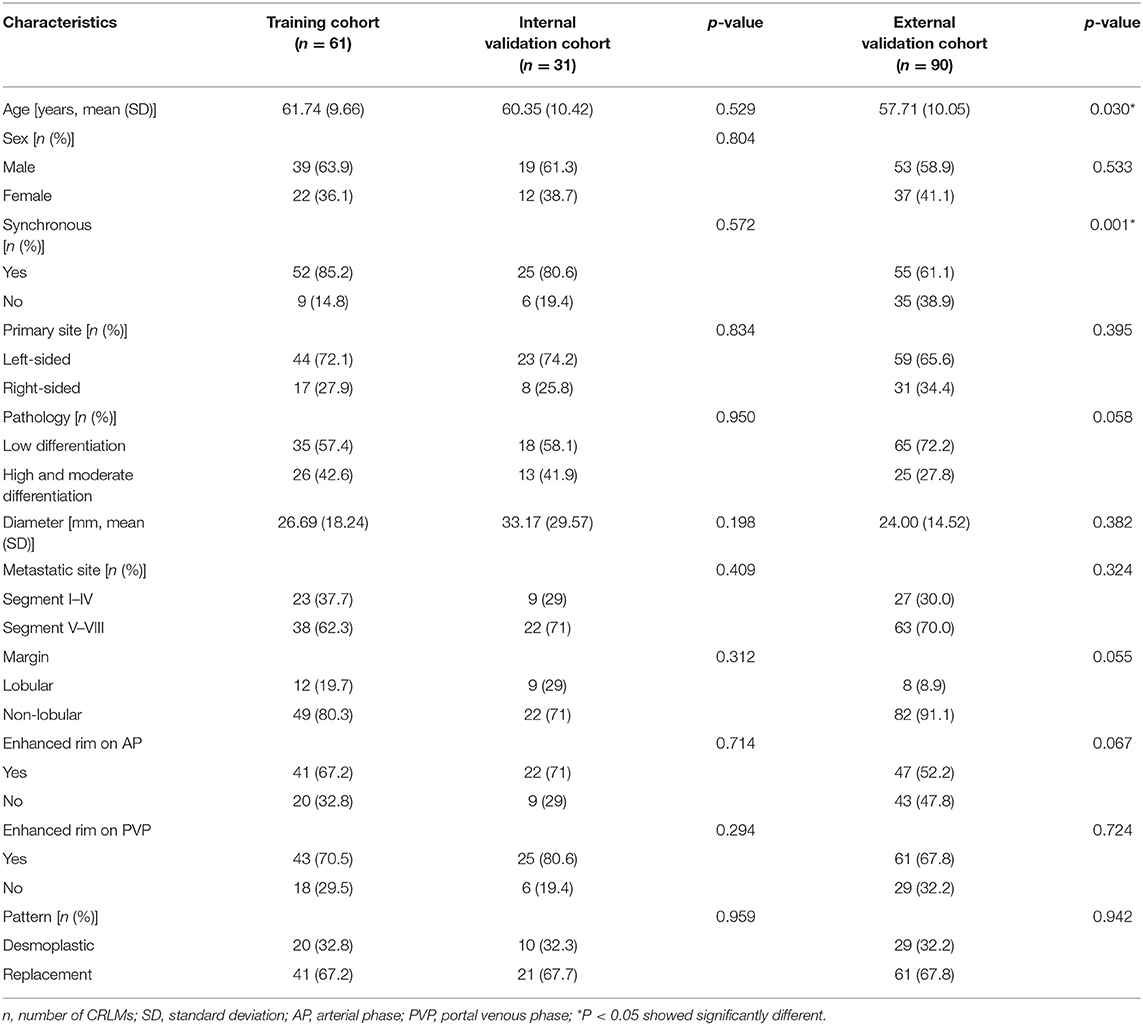
Table 1. Demographics of patients.
Performance of the Clinical Model
After univariate analysis, only lobular margin was statistically significant (P = 0.032, Table 2). The clinical model was constructed by sex, diameter, primary site, and lobular margin through forward stepwise regression. The AUC was 0.659 (95% CI: 0.514–0.803), 0.676 (95% CI: 0.484–0.869), and 0.685 (95% CI: 0.563–0.807) in three cohorts, respectively (Table 3). The ROC curves of the clinical model in all cohorts are displayed in Figure 2A.
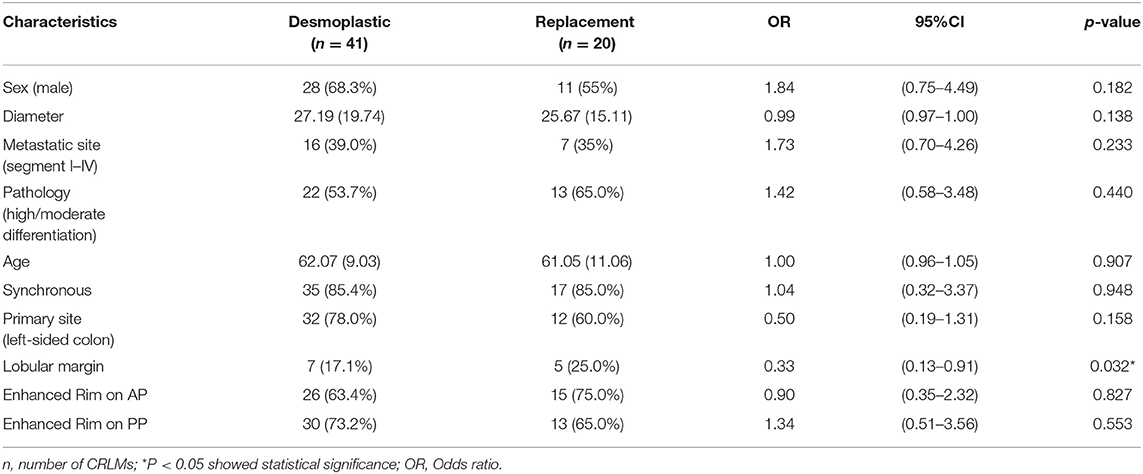
Table 2. Univariate analysis of clinical and qualitative imaging features in distinguishing HGPs of CRLMs.
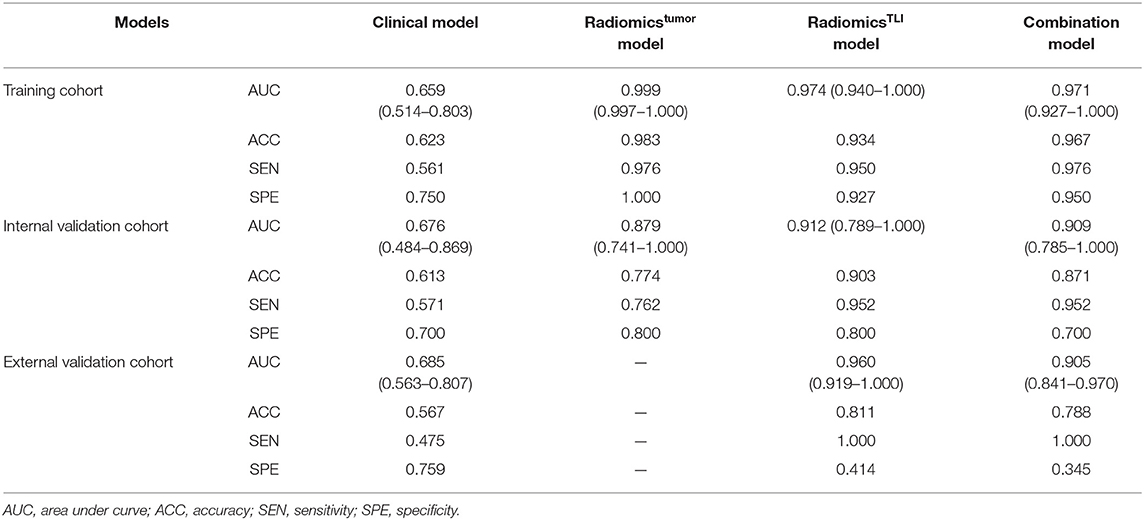
Table 3. Performance of the clinical, radiomics, and combined models in distinguishing HGPs of CRLMs.
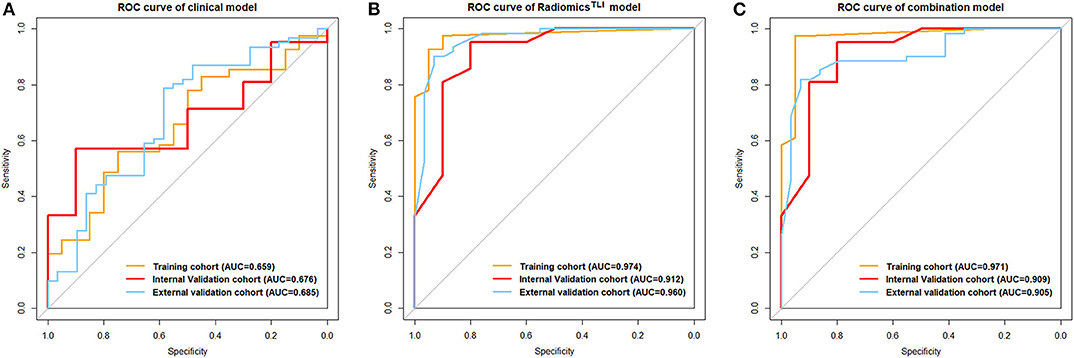
Figure 2. (A) ROC curve for the clinical model. (B) ROC curves for the radiomicsTLI model. (C) ROC curves for the combination model.
Performance of Tree-Based Radiomics Signatures
We extracted 828 features for each sequence. After inter/intra-observer agreement analysis, the dimensional of feature space was 679 for T2WI, 483 for ADC, 631 for T1WI, 737 for AP, and 691 for PVP images in TLI zone; and 652 for T2WI, 549 for ADC, 594 for T1WI, 694 for AP, and 679 for PVP images in tumor zone (Figures E1, E2). The RFS method ranked radiomic features and the top 20 most discriminative features were used to construct the decision tree classifier (25). The details of these selected features for each sequence are demonstrated in Tables E3–E12.
When comparing the ability for HGP differentiation of each single sequence in internal validation cohort, signatureAP derived from the ROI of TLI zone exhibited the best performance in all sequences, and signatureT1WI derived from the ROI of tumor zone performed the best in all sequences (Table 4). The final radiomicsTLI signature was generated by signatureT2WI, signatureAP, and signaturePVP in TLI zone through forward stepwise regression (Table E13), and the radiomicstumor signature was generated by signatureT1WI, signatureT2WI, signatureAP, and signaturePVP in tumor zone in the same way. The radiomicsTLI signature demonstrated better performance than the radiomicstumor signature in the internal validation cohort (AUC: 0.912 [95% CI: 0.789–1] vs. 0.879 [95% CI: 0.741–1], Table 3 and Figure 2B). The Delong test showed that the performance of the radiomicsTLI model was obviously better than that of the clinical model (P = 0.035), while the radiomicstumor model did not show significant better performance than the clinical model in the internal validation cohort (P = 0.051, Table 5).
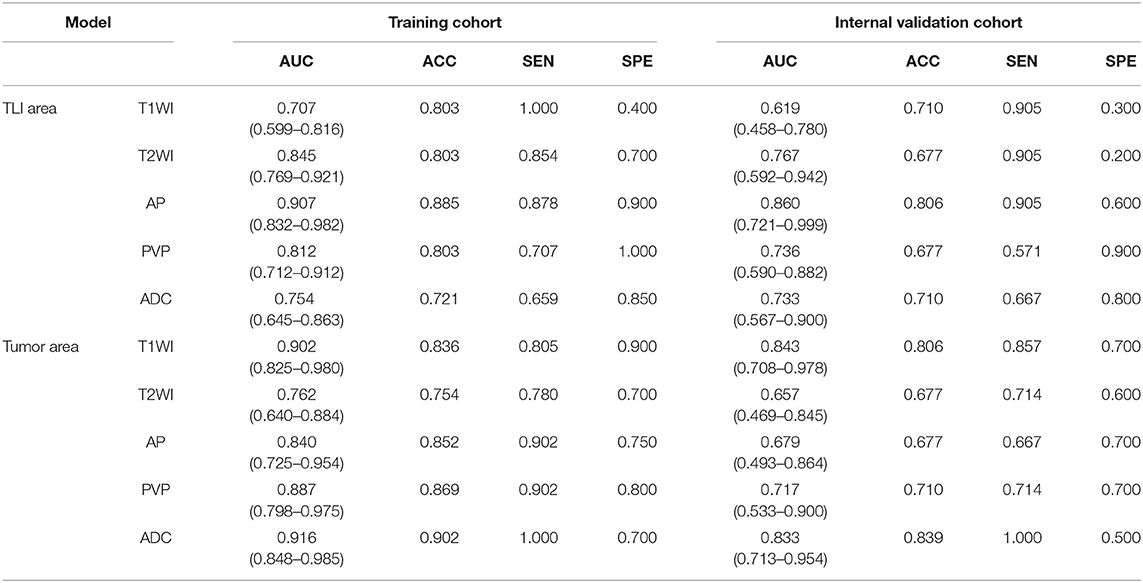
Table 4. Performance of each single sequence in distinguishing HGPs of CRLMs.
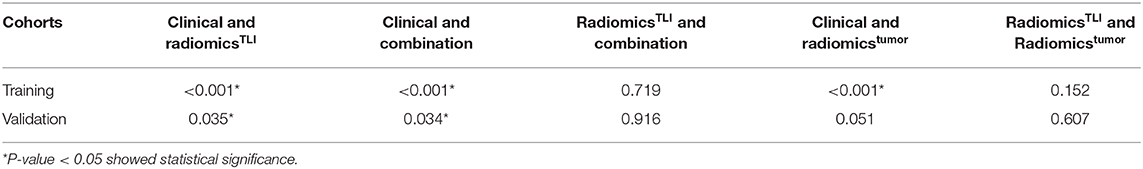
Table 5. Delong tests' results between different models.
Performance of Combination Model and Nomogram
The radiomicsTLI signature and clinical features were used to construct the combination model. The decision trees of TLI zone in T2WI, AP, and PVP images were shown in Figure E4. The formula of radiomicsTLI signature was exhibited in Appendix E2. The AUCs of combination model were 0.971, 0.909, and 0.905 in three cohorts, respectively (Table 3 and Figure 2C). According to the violin graphs (Figure 3), the distinguishing ability of combination model was much better than that of the clinical model (P = 0.034, Table 5), while there was no difference between the radiomicsTLI model and combination model (P = 0.916, Table 5). With respect to the predictive ability of each model in three cohorts, the confusion matrixes shown the sensibility, specificity, false positive and false negative by heat maps (Figure 4).
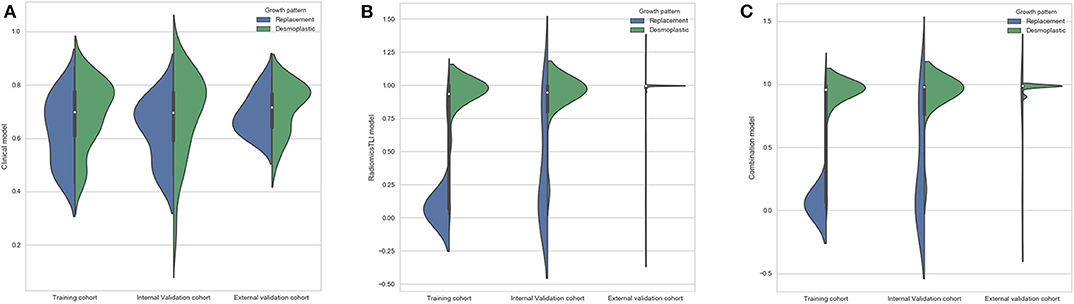
Figure 3. (A) Violin graph of distribution of clinical model between replacement and desmoplastic HGPs. (B) Violin graph of distribution of radiomicsTLI model between replacement and desmoplastic HGPs. (C) Violin graph of distribution of combination model between replacement and desmoplastic HGPs.
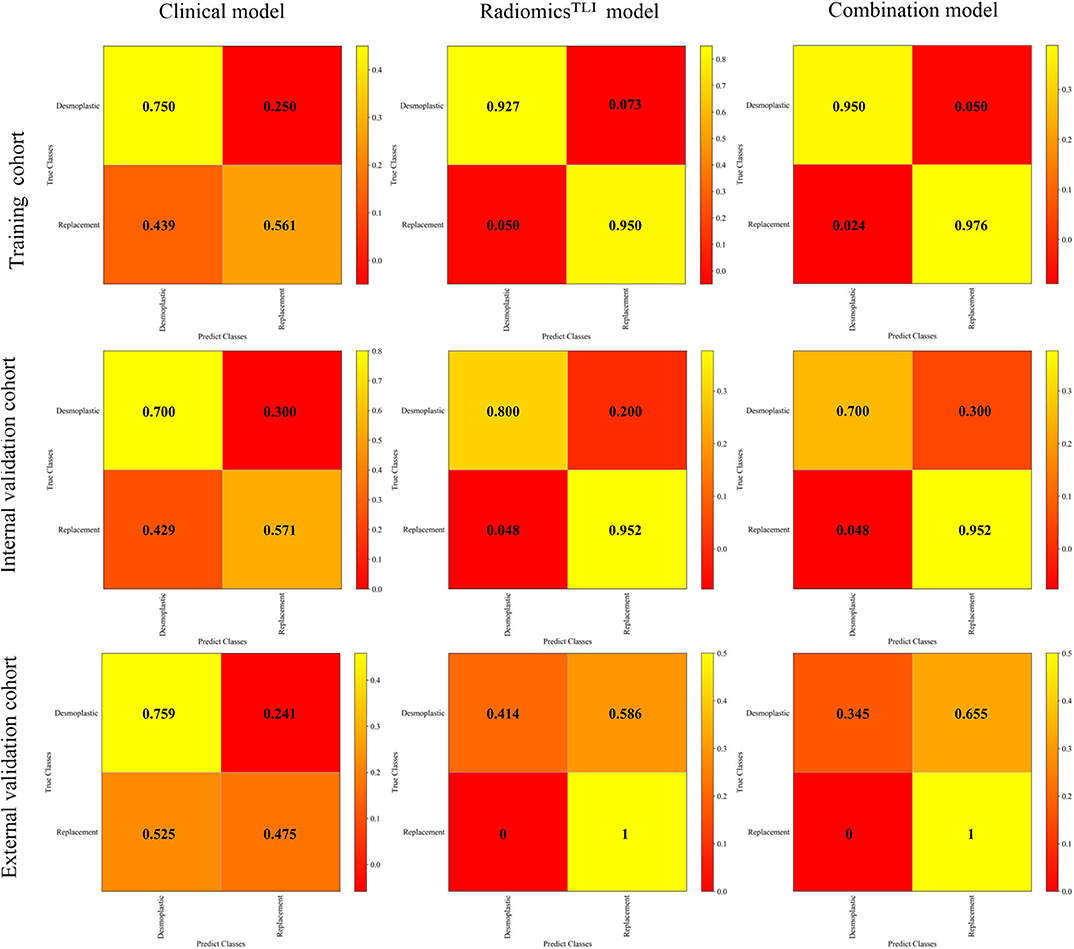
Figure 4. Confusion matrixes for clinical, radiomicsTLI, and combination model in all cohorts.
The nomogram is showed in Figure 5. The AUC of combination nomogram was 0.971, 0.909, and 0.905 in three cohorts, respectively. The calibration curves for three cohorts were shown in Figures 5B–D. The Hosmer–Lemeshow test showed the predicted HGP was in consistency with the actual HGP (P-value: training cohort, 0.874; internal validation cohort, 0.346; external validation cohort, 0.101). The decision curves showed that the combination nomogram added more benefit than clinical nomogram if the threshold probability >3% (Figure 6).
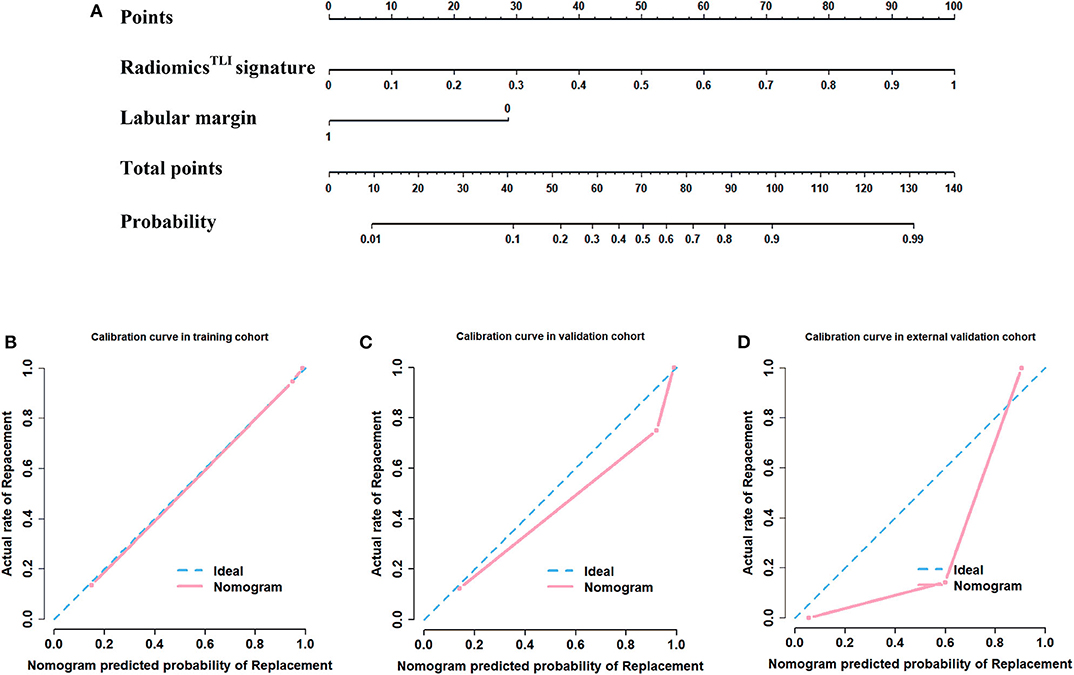
Figure 5. Development of nomogram and calibration curves. (A) Nomogram based on radiomics signatures and clinical factors. Calibration curves of the radiomics nomogram in the (B) training cohort, (C) internal validation cohort, and (D) external validation cohorts.
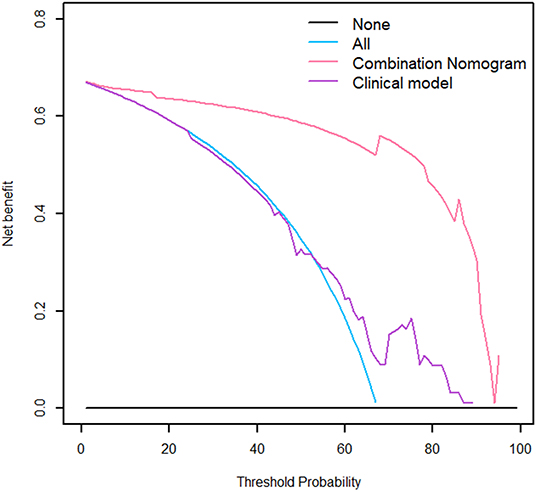
Figure 6. The decision curve of the nomogram.
Performance of Cross Validation
The results of cross validation are shown in Table E14. The final radiomicsTLI model also shown good performance with AUC of 0.888 in the training cohort, 0.906 in the internal validation cohort, and 0.788 in the external validation cohort. The decision trees that was constructed from second institution was shown in Figure E5. We noticed some radiomic features were selected in both institutions and showed them in Table E15.
Discussion
In this study, we demonstrated that a multiparameter MRI-based radiomics model could be used as a non-invasion tool to preoperatively distinguish the HGP of CRLMs. Radiomics analysis was performed on both TLI and tumor zones, and the radiomicsTLI model showed better performance than that of the radiomicstumor model. The nomogram integrating the radiomicsTLI signature and clinical factors showed satisfactory performance in all cohorts.
Based on the discrepancy of microvasculature between desmoplastic (angiogenesis) and replacement (non-angiogenesis, but vessel co-option) HGPs, previous studies only focused on the degree of tumor angiogenesis (26) and the response to anti-angiogeneic treatment by using textures analyses (26–28). Most studies suggest that the higher score reflecting textural heterogeneity corresponds to higher degree of angiogenesis (24), which may be associated with more aggressiveness (29, 30). In contrast to these results, Ravanelli found that the CRLMs with more uniform textual features on contrast enhanced CT images had a worse objective response rates and shorter long-term survivals after treatment of Bevacizumab (29). However, Ravanelli didn't reveal the association between those textual features and pathological characteristics, such as the degree of angiogenesis or even HGPs.
Unlike previous studies, we created a multiparameter MRI-based radiomics model to predict HGPs with high accuracy. With pathology as reference, the desmoplastic HGP was identified with more heterogeneous radiomic features and the replacement ones had more homogeneous radiomics features (Tables E3–E12). Four radiomic features were selected in both institution after cross validation, including wavelet.LLH_glcm_Idmn in T2WI, wavelet.HHL_glcm_Correlation, and wavelet.HLH_firstorder_Skewness in AP images, and wavelet.HHL_glcm_InverseVariance in PVP images (Table E15). According the description of these features, the uniformity, symmetry, and variation of gray value are of great significance for HGP identification. The super enhanced small areas highlighted by image filtering and quantized by the variable uniformity may be caused by the leakage of contrast agent into the extracellular space around the highly permeable and newly formed tumor microvessels (29). Apart from the angiogeneic situation, there are more tissue types in the desmoplastic HGP tumor, such as fibrosis, inflammatory, tumor and liver cells, which shows higher heterogeneity than the replacement ones. Therefore, radiomic features of desmoplastic or replacement HGPs may be used as biomarker to predict response to bevacizumab and long-term prognosis.
Compared with the radiomic features, this study showed the gross features on MRI could not distinguish HGP effectively. It suggests that the traditional image analysis may over-simplify the tumor biology (30), including the growth pattern and corresponding microvasculature. Our previous study revealed that the enhanced rim on PVP CT images was correlated with the histopathological presentation of the desmoplastic HGP (19). Furthermore, a similar feature of transit enhanced rim on AP MR images was also associated with the desmoplastic reaction (11). However, this study showed no significant difference between enhanced rim and HGP. Compared with CT, the superior soft tissue resolution of MR may cause more common enhanced rim in MRI, which may explain enhanced rim is not selected in our study. Furthermore, considering the very limited cases in Semelka's study, more profound study may be required. The lobular margin was identified as a significant feature of replacement HGP through univariate analysis in our study. It was consistent with another study, in which lobular margin was identified as a poor prognostic predictor in patient with resected CRLMs (22). It is an important observation and may reflect the irregular border on HE-stained tissue sections in the replacement growth pattern.
According to the results, we learned both the radiomicstumor and radiomicsTLI models were superior to the clinical model in all cohorts. Additionally, the Delong test showed no significant difference (P = 0.607) between the radiomicstumor and radiomicsTLI model. It suggested that radiomics analysis in each ROI could be used to identify HGP of CRLMs independently. The radiomicsTLI model had a higher AUC than the radiomicstumor model in the internal validation cohort, which could be due to the histological differences of HGPs are mainly focused on the perilesional zone, the features extracted from the whole tumor area might not reflect the differences in HGPs significantly. Therefore, the final combination model was constructed by radiomicsTLI signature and related clinical characteristics. We noticed that the performance of combination model was significantly better than that of clinical model (P < 0.05 in all cohorts), which indicated that the radiomicsTLI signature can complement the clinical characteristics. In addition, in external validation cohort, the sensitivity was higher and lesions were more likely to be predicted as a replacement HGP. However, due to the large proportion of replacement HGP, this may lead to good AUC, but poor calibration. The decision curve analysis demonstrated that the combination nomogram was superior to clinical nomogram, which enabled the evaluation of clinical relevance and verified the radiomics signature hold great potential for clinical application.
This study has some limitations. Firstly, the sample size of this study was small and it was a retrospective study. Sufficient data is the basis for performance evaluation of the predictive model in radiomics or elsewhere. Most patients with CRLMs are initially unsuitable for resection, which limits the chemo-naïve specimens. In addition, Gillies et al. suggested that although larger data sets provided more power, radiomics could be performed with as few as 100 samples (31). Although we used the external validation to reduce the impact, the prospective multi-center study was still required in the future and the survival prediction with this model could be tested. Secondly, the pushing and mixed HGPs were not evaluated because of the limited number. However, it was still consistent with the data published in the international consensus (3). Thirdly, few clinical factors were included. Considering the need for more data in machine learning, other important factors, such as disease-free interval, preoperative CEA, and genetic (BRAF/KRAS), were not included in this study. More samples and more clinical factors are essential to obtain a comprehensive model and higher accuracy in future. Finally, the radiomics model could be used to distinguish the predominant (>50% area) HGP of resectable CRLMs. Considering the inter- and intra-tumor heterogeneity of HGP types, it remains challenging whether and how the model can used in patients with unresectable CRLMs.
Conclusion
In conclusion, MRI-based radiomic approach has high potential to predict the predominant HGPs of CRLM, paving the way for further validation in larger and possibly prospective datasets. Moreover, the results suggested that MRI can not only be used as an independent prediction tool for HGP but also improve the performance of clinical factors.
Data Availability Statement
The datasets generated for this study are available on request to the corresponding author.
Ethics Statement
The studies involving human participants were reviewed and approved by Medical Ethics Committee of Peking University People's Hospital. Written informed consent for participation was not required for this study in accordance with the national legislation and the institutional requirements.
Author Contributions
YW contributed to the study concept and design. TT, WS, and NH contributed to the acquisition of clinical data. DG contributed to the data review. YH contributed to the data analysis and figures. FC, YYu, and YZ contributed to the data interpretation. FC wrote the first draft of the manuscript. JC and YH wrote the sections of the manuscript. YW, JW, and JT supervised and oversaw the study. All authors contributed to the manuscript revision, read, and approved the submitted version.
Funding
This work was supported by the Ministry of Science and Technology of China under grant numbers 2016YFC0103803, 2016YFA0201401, 2016YFC0103702, 2016YFC0103001, 2017YFC1308700, 2017YFC1309100, and 2017YFA0205200, the National Natural Science Foundation of China under grant numbers 81527805 and 81771924, Chinese Academy of Sciences under grant numbers GJJSTD20170004 and QYZDJ-SSW-JSC005, and Nature Science Foundation of Beijing under grant numbers 7172226 and 7202217.
Conflict of Interest
The authors declare that the research was conducted in the absence of any commercial or financial relationships that could be construed as a potential conflict of interest.
Acknowledgments
The authors would like to acknowledge the instrumental and technical support of Multi-modal Biomedical Imaging Experimental Platform, Institute of Automation, Chinese Academy of Sciences.
Supplementary Material
The Supplementary Material for this article can be found online at: https://www.frontiersin.org/articles/10.3389/fonc.2020.01363/full#supplementary-material
References
1. Goey KKH, Sørbye H, Glimelius B, Adams RA, André T, Arnold D, et al. Consensus statement on essential patient characteristics in systemic treatment trials for metastatic colorectal cancer: supported by the ARCAD Group. Eur J Cancer. (2018) 100:35–45. doi: 10.1016/j.ejca.2018.05.010
2. Moro CF, Béla B, Marco G. Growth patterns of colorectal cancer liver metastases and their impact on prognosis: a systematic review. BMJ Open Gastroenterol. (2018) 5:e000217. doi: 10.1136/bmjgast-2018-000217
3. van Dam PJ, Van der Stok EP, Teuwen LA, Van den Eynden GG, Illemann M, Frentzas S, et al. International consensus guidelines for scoring the histopathological growth patterns of liver metastasis. Br J Cancer. (2017) 117:1427–41. doi: 10.1038/bjc.2017.334
4. Vermeulen PB, Colpaert C, Salgado R, Royers R, Hellemans H, Van Den Heuvel E, et al. Liver metastases from colorectal adenocarcinomas grow in three patterns with different angiogenesis and desmoplasia. J Pathol. (2001) 195:336–42. doi: 10.1002/path.966
5. Frentzas S, Simoneau E, Bridgeman VL, Vermeulen PB, Foo S, Kostaras E, et al. Vessel co-option mediates resistance to anti-angiogenic therapy in liver metastases. Nat Med. (2016) 22:1294–302. doi: 10.1038/nm.4197
6. Galjart B, Nierop PMH, Van der Stok EP, Van den Braak RRJC, Höppener DJ, Daelemans S, et al. Angiogenic desmoplastic histopathological growth pattern as a prognostic marker of good outcome in patients with colorectal liver metastases. Angiogenesis. (2019) 22:355–68. doi: 10.1007/s10456-019-09661-5
7. Van den Eynden GG, Bird NC, Majeed AW, Van Laere S, Dirix LY, Vermeulen PB, et al. The histological growth pattern of colorectal cancer liver metastases has prognostic value. Clin Exp Metast. (2012) 29:541–9. doi: 10.1007/s10585-012-9469-1
8. Lazaris A, Amri A, Petrillo SK, Zoroquiain P, Ibrahim N, Salman A, et al. Vascularization of colorectal carcinoma liver metastasis: insight into stratification of patients for anti-angiogenic therapies. J Pathol Clin Res. (2018) 4:184–92. doi: 10.1002/cjp2.100
9. Eefsen RL, Van den Eynden GG, Høyer-Hansen G, Brodt P, Laerum OD, Vermeulen PB, et al. Histopathological growth pattern, proteolysis and angiogenesis in chemonaive patients resected for multiple colorectal liver metastases. J Oncol. (2012) 2012:907971. doi: 10.1155/2012/907971
10. Tirumani SH, Tirumani SH, Kim KW, Nishino M, Howard SA, Krajewski KM, et al. Update on the role of imaging in management of metastatic colorectal cancer. Radiographics. (2014) 34:1908–28. doi: 10.1148/rg.347130090
11. Semelka RC, Hussain SM, Marcos HB, Woosley JT. Perilesional enhancement of hepatic metastases: correlation between MR imaging and histopathologic findings-initial observations. Radiology. (2000) 215:89–94. doi: 10.1148/radiology.215.1.r00mr2989
12. O'Connor JP, Jayson GC. Do imaging biomarkers relate to outcome in patients treated with VEGF inhibitors? Clin Cancer Res. (2012) 18:6588–98. doi: 10.1158/1078-0432.CCR-12-1501
13. O'Connor JP, Jackson A, Parker GJM, Roberts C, Jayson GC. Dynamic contrast-enhanced MRI in clinical trials of antivascular therapies. Nat Rev Clin Oncol. (2012) 9:167–77. doi: 10.1038/nrclinonc.2012.2
14. Limkin EJ, Sun R, Dercle L, Zacharaki EI, Robert C, Reuzé S, et al. Promises and challenges for the implementation of computational medical imaging (radiomics) in oncology. Ann Oncol. (2017) 28:1191–206. doi: 10.1093/annonc/mdx034
15. Patel SH, Poisson LM, Brat DJ, Zhou Y, Cooper L, Snuderl M, et al. T2-FLAIR mismatch, an imaging biomarker for IDH and 1p/19q status in lower grade gliomas: a TCGA/TCIA project. Clin Cancer Res. (2017) 23:6078–85. doi: 10.1158/1078-0432.CCR-17-0560
16. Park H, Lim Y, Ko ES, Cho HH, Lee JE, Han BK, et al. Radiomics signature on magnetic resonance imaging: association with disease-free survival in patients with invasive breast cancer. Clin Cancer Res. (2018) 24:4705–14. doi: 10.1158/1078-0432.CCR-17-3783
17. Huang Y, Liu Z, He L, Chen X, Pan D, Ma Z, et al. Radiomics signature: a potential biomarker for the prediction of disease-free survival in early-stage (I or II) non-small cell lung cancer. Radiology. (2016) 281:947–57. doi: 10.1148/radiol.2016152234
18. Fu S, Wei J, Song J, Dong D, Li X, Gu D, et al. Selection between liver resection versus transarterial chemoembolization in hepatocellular carcinoma: a multicenter study. Clin Transl Gastroenterol. (2019) 10:e00070. doi: 10.14309/ctg.0000000000000070
19. Cheng J, Wei J, Tong T, Sheng W, Zhang Y, Han Y, et al. Prediction of histopathologic growth patterns of colorectal liver metastases with a noninvasive imaging method. Ann Surg Oncol. (2019) 26:4587–98. doi: 10.1245/s10434-019-07910-x
20. Gasser E, Braunwarth E, Riedmann M, Cardini B, Fadinger N, Presl J, et al. Primary tumour location affects survival after resection of colorectal liver metastases: a two-institutional cohort study with international validation, systematic meta-analysis and a clinical risk score. PLoS ONE. (2019) 14:e0217411. doi: 10.1371/journal.pone.0217411
21. Lebre MA, Vacavant A, Grand-Brochier M, Rositi H, Abergel A, Chabrot P, et al. Automatic segmentation methods for liver and hepatic vessels from CT and MRI volumes, applied to the Couinaud scheme. Comput Biol Med. (2019) 110:42–51. doi: 10.1016/j.compbiomed.2019.04.014
22. Nagakura S, Shirai Y, Hatakeyama K. Computed tomographic features of colorectal carcinoma liver metastases predict posthepatectomy patient survival. Dis Colon Rectum. (2001) 44:1148–54. doi: 10.1007/BF02234637
23. Leijenaar RTH, Carvalho S, Velazquez ER, van Elmpt WJC, Parmar C, Hoekstra OS, et al. Stability of FDG-PET radiomics features: an integrated analysis of test-retest and inter-observer variability. Acta Oncol. (2013) 52:1391–7. doi: 10.3109/0284186X.2013.812798
24. Nie F, Huang H, Cai X, Ding C. Efficient and robust feature selection via joint l2, 1-Norms minimization. In: Lafferty JD, Williams CKI, Taylor JS, Zemel RS, Culotta A, editors. Advances in Neural Information Processing Systems. Vancouver: Curran Associates, Inc. (2010). p. 1813–21.
25. Rios VE, Parmar C, Liu Y, Coroller TP, Cruz G, Stringfield O, et al. Somatic mutations drive distinct imaging phenotypes in lung cancer. Cancer Res. (2017) 77:3922–30. doi: 10.1158/0008-5472.CAN-17-0122
26. Yin Q, Huang S, Wang L, Lin W, Fielding JR, Rathmell WK, et al. Associations between tumor vascularity, vascular endothelial growth factor expression and PET/MRI radiomic signatures in primary clear-cell-renal-cell-carcinoma: proof-of-concept study. Sci Rep. (2017) 7:43356. doi: 10.1038/srep43356
27. Grossmann P, Narayan V, Chang K, Rahman R, Abrey L, Reardon DA, et al. Quantitative imaging biomarkers for risk stratification of patients with recurrent glioblastoma treated with bevacizumab. Neuro Oncol. (2017) 19:1688–97. doi: 10.1093/neuonc/nox092
28. Kickingereder P, Götz M, Muschelli J, Wick A, Neuberger U, Shinohara RT, et al. Large-scale radiomic profiling of recurrent glioblastoma identifies an imaging predictor for stratifying anti-angiogenic treatment response. Clin Cancer Res. (2016) 22:5765–71. doi: 10.1158/1078-0432.CCR-16-0702
29. Ravanelli M, Agazzi GM, Tononcelli E, Roca E, Cabassa P, Baiocchi G, et al. Texture features of colorectal liver metastases on pretreatment contrast-enhanced CT may predict response and prognosis in patients treated with bevacizumab-containing chemotherapy: a pilot study including comparison with standard chemotherapy. Radiol Med. (2019) 124:877–86. doi: 10.1007/s11547-019-01046-4
30. O'Connor JP, Rose CJ, Jackson A, Watson Y, Cheung S, Maders F, et al. DCE-MRI biomarkers of tumour heterogeneity predict CRC liver metastasis shrinkage following bevacizumab and FOLFOX-6. Br J Cancer. (2011) 105:139–45. doi: 10.1038/bjc.2011.191
Keywords: colorectal cancer, liver metastasis, magnetic resonance, histopathologic growth patterns, radiomics
Citation: Han Y, Chai F, Wei J, Yue Y, Cheng J, Gu D, Zhang Y, Tong T, Sheng W, Hong N, Ye Y, Wang Y and Tian J (2020) Identification of Predominant Histopathological Growth Patterns of Colorectal Liver Metastasis by Multi-Habitat and Multi-Sequence Based Radiomics Analysis. Front. Oncol. 10:1363. doi: 10.3389/fonc.2020.01363
Received: 09 December 2019; Accepted: 29 June 2020;
Published: 14 August 2020.
Edited by:
Amit Sethi, Indian Institute of Technology Bombay, IndiaReviewed by:
Peter Vermeulen, GZA, BelgiumNeeraj Kumar, Alberta Machine Intelligence Institute, University of Alberta, Canada
Swapnil Rane, Tata Memorial Hospital, India
Cornelis Verhoef, Erasmus Medical Center, Netherlands
Copyright © 2020 Han, Chai, Wei, Yue, Cheng, Gu, Zhang, Tong, Sheng, Hong, Ye, Wang and Tian. This is an open-access article distributed under the terms of the Creative Commons Attribution License (CC BY). The use, distribution or reproduction in other forums is permitted, provided the original author(s) and the copyright owner(s) are credited and that the original publication in this journal is cited, in accordance with accepted academic practice. No use, distribution or reproduction is permitted which does not comply with these terms.
*Correspondence: Yi Wang, wangyi@pkuph.edu.cn; Jie Tian, tian@ieee.org
†These authors have contributed equally to this work