 Peipei Zhang
 Zhaoyan Feng
 Wei Cai
 Huijuan You
 Chanyuan Fan1
 Wenzhi Lv
 Xiangde Min
 Liang Wang
- 1Department of Radiology, Tongji Hospital, Tongji Medical College, Huazhong University of Science and Technology, Wuhan, China
- 2Julei Technology, Wuhan, China
Objective: To evaluate the performance of a T2-weighted image (T2WI)-based radiomics signature for differentiating between seminomas and nonseminomas.
Materials and Methods: In this retrospective study, 39 patients with testicular germ-cell tumors (TGCTs) confirmed by radical orchiectomy were enrolled, including 19 cases of seminomas and 20 cases of nonseminomas. All patients underwent 3T magnetic resonance imaging (MRI) before radical orchiectomy. Eight hundred fifty-one radiomics features were extracted from the T2WI of each patient. Intra- and interclass correlation coefficients were used to select the features with excellent stability and repeatability. Then, we used the minimum-redundancy maximum-relevance (mRMR) and the least absolute shrinkage and selection operator (LASSO) algorithms for feature selection and radiomics signature development. Receiver operating characteristic curve analysis was used to evaluate the diagnostic performance of the radiomics signature.
Results: Five features were selected to build the radiomics signature. The radiomics signature was significantly different between the seminomas and nonseminomas (p < 0.01). The area under the curve (AUC), sensitivity, and specificity of the radiomics signature for discriminating between seminomas and nonseminomas were 0.979 (95% CI: 0.873–1.000), 90.00 (95% CI: 68.3–98.8), and 100.00 (95% CI: 82.4–100.0), respectively.
Conclusion: The T2WI-based radiomics signature has the potential to non-invasively discriminate between seminomas and nonseminomas.
Introduction
Testicular cancer represents 1% of neoplasms and 5% of urological tumors in males. However, testicular cancer is the most common malignancy among men aged between 14 and 44 years (1, 2). Statistics show that there were 71,105 new cases and 9,507 deaths of testicular cancer worldwide in 2018 (3). Approximately 90–95% of testicular cancers are testicular germ cell tumors (TGCTs), which are split into two broad categories: seminomas and nonseminomas (4).
Radical orchiectomy is the main treatment for testicular tumors and can be supplemented by radiotherapy and chemotherapy (4, 5). In view of the different sensitivities of seminomas and nonseminomas to radiotherapy and chemotherapy, characterizing the histologic type of testicular tumors is of great importance (6–8). For patients undergoing orchidectomy, the differentiation of seminomas from nonseminomas would not affect patient management. However, the information gained preoperatively might help physicians to explain the patient's condition and tumor prognosis before surgery, which would help decrease the patient's anxiety. However, for patients who are unwilling to undergo orchiectomy, the seminomas, and nonseminomas must be identified by other non-invasive means, such as imaging examinations, because the guidelines do not recommend that patients with suspected testicular tumors undergo punctures in order to avoid tumor spread and metastasis (5). Therefore, several studies have evaluated the value of sonography or magnetic resonance imaging (MRI) for the non-invasive differentiation of seminomas from nonseminomas (4, 9–11).
Currently, ultrasonography (US) is the initial imaging method for confirming the existence of a testicular mass (5, 12). MRI has emerged as a valuable modality that can be an alternative diagnostic tool, especially in cases of non-diagnostic or equivocal sonographic findings (13). Compared to US, MRI can provide more abundant anatomical and functional information and is less dependent on operator technique. Some MRI features of TGCTs have been found to closely correlate with histopathologic characteristics (4, 9). T2-weighted imaging (T2WI) is an essential component of MRI in oncology. Some previous studies reported that seminomas and nonseminomas have different features on T2WI (8, 9). Most of the previous studies only used qualitative features or limited quantitative features, which may not fully explore the potential value of MRI.
Radiomics uses advanced image processing techniques to extract a large number of quantitative features from imaging data (14–16). It has been applied to various diseases such as lung and head-and-neck cancer (17), gastric cancer (18), colorectal cancer (19), liver fibrosis (20), and prostate cancer (21), etc., and remarkably encouraging results have been reported. However, to date, no study has applied radiomics to the evaluation of testicular diseases.
The purpose of our study was to investigate whether a T2WI-based radiomics signature could differentiate seminomas from nonseminomas.
Materials and Methods
Patient Information
Our institutional review board approved this retrospective study. From February 2014 to March 2019, patients were included according to the following inclusion criteria (Figure 1): (a) had scrotal lesions on sonography or physical examination, (b) underwent a preoperative 3T MRI examination, (c) underwent radical orchiectomy, and (d) had pathologically confirmed TGCTs. Patients were excluded if apparent susceptibility or movement artifacts existed on the MR images. A total of 39 men (age range, 18–61 years; median age, 29 years) with 39 lesions were included. Nineteen tumors were pathologically confirmed as seminomas, and 20 tumors were pathologically confirmed as nonseminomas. The patients with nonseminomas had embryonal carcinomas (n = 8), teratomas (n = 4), yolk sac tumor (n = 1), and mixed germ cell tumors (n = 7) [embryonal carcinomas and teratomas (n = 3), seminoma and embryonal carcinoma (n = 1), teratoma, yolk sac tumor and embryonal carcinoma (n = 1), seminoma, teratoma and yolk sac tumor (n = 1), and seminoma, embryonal carcinoma, teratoma, and yolk sac tumor (n = 1)]. The classification of the tumor types in the current study was based on the NCCN guideline (22).
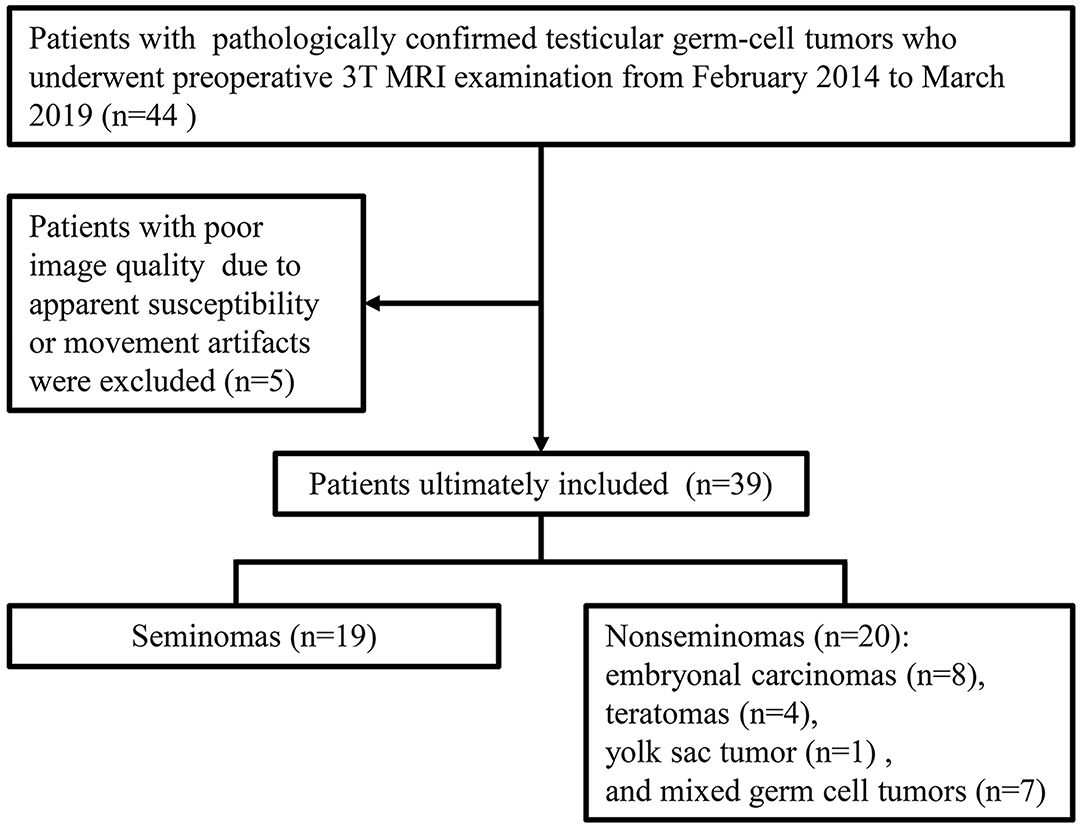
Figure 1. Flow chart of patients' inclusion and exclusion.
MRI Protocol
All the MR images were acquired with a 3T MR scanner (MAGNETOM Skyra, Siemens Healthcare, Erlangen, Germany) and an 18-element body matrix coil in combination with a 32-channel spine coil. The patients were positioned in a feet-first supine position. Transverse, sagittal and coronal T2-weighted turbo spin-echo sequences with the following parameters were used: repetition time/echo time (TR/TE) range 6500-6870/104 ms, slice thickness of 3~5 mm, interslice gap of 0~0.5 mm, field of view (FOV) of 180 × 180 mm2, and a matrix of 384 × 320. Transverse T1-weighted turbo spin-echo sequences were acquired with the following parameters: TR of 750 ms, TE of 13 ms, slice thickness of 3~5 mm, interslice gap of 0~0.5 mm, FOV of 300×300 mm2, and matrix of 320 × 240. Diffusion-weighted imaging (DWI) and dynamic contrast enhanced (DCE) sequences were performed for some patients, but these images were not included in the analysis due to the limited number of scans.
MRI Segmentation and Radiomics Feature Extraction
ITK-SNAP software (version 3.4.0; www.itksnap.org) was used for manual segmentation. Preoperative transverse T2WI was obtained for image analysis. A three-dimensional volume of interest (VOI) covering the tumor was delineated by stacking regions of interest slice-by-slice on the transverse T2WI. Manual segmentation of the tumors on the images was initially performed by a radiologist (Reader 1). Twenty patients were randomly selected from the study cohort. One month later, Reader 1 performed a second segmentation of the 20 patients to assess the intraobserver reproducibility. Another radiologist (Reader 2) performed a manual segmentation of these patients independently to assess the interobserver reproducibility. Both readers were blinded to the histologic results.
The radiomics features were extracted using the PyRadiomics library (https://github.com/Radiomics/pyradiomics.git, version 2.1.2) in Python (version 3.7.0). PyRadiomics is a flexible open-source platform capable of extracting a large panel of engineered features from medical images (23). For the feature extraction method, please reference the PyRadiomics documentation (https://pyradiomics.readthedocs.io/en/latest/). All MRI data were subjected to images normalization and resampled to the same resolution (0.46875 × 0.46875 × 3 mm) before feature extraction. A total of 851 radiomics features were extracted, including the following four groups: 14 shape features, 18 first-order intensity statistics features, 75 texture features [Gray Level Co-occurrence Matrix (24), Gray Level Size Zone Matrix (16), Gray Level Run Length Matrix (16), Neighboring Gray Tone Difference Matrix (5), and Gray Level Dependence Matrix (14)], and 744 wavelet features.
Statistical Analysis
As high-dimensional features were extracted in the current study, we performed a feature dimension reduction process to select the most relevant features for the classification of testicular lesions to construct a radiomics signature. Features selection included the following steps. First, we used the intra- and interclass correlation coefficient (ICC) to assess the effects of the manual segmentation variations on the value of the features. The ICC was calculated for each radiomics feature. Features with good agreement (ICC ≥ 0.8) were regarded as robust features and selected for the following analyses. Second, we compared all the features between seminomas and nonseminomas using the Mann-Whitney U test for non-normally distributed features or the independent t-test for normally distributed features. Features with p < 0.05 were considered significant variables and selected. To control the false-positive rate in multiple comparisons, the false discovery rate-adjusted p-value was used in the Mann-Whitney U test and the independent t-test (24). Third, spearman's correlation coefficient was used to compute the relevance and redundancy of the features. Redundant features indicated by a Spearman's correlation coefficient ≥ 0.8 were eliminated. Fourth, we applied the maximum relevance minimum redundancy (mRMR) algorithm to assess the relevance and redundancy of the remaining features (25). The mRMR algorithm was used to select the most relevant features for the classification of testicular lesions, avoiding redundancy between features. By using the mRMR method, the features were ranked according to their relevance-redundancy scores (mRMR scores). The mRMR score of a feature is defined as the mutual information between the status of the lesions and this feature minus the average mutual information of previously selected features and this feature. The top 10 features with high-relevance and low-redundancy were selected for the following analyses. Fifth, the 10 features selected by the above steps were applied to least absolute shrinkage and selection operator (LASSO) logistic regression model (26). The LASSO logistic regression model with 5-fold cross-validation was adopted for further features selection and radiomics signature construction. LASSO is a regression analysis method that performs feature selection and regularization to improve the mode prediction accuracy and interpretability. Some candidate features coefficients were shrunk to zero and the remaining variables with non-zero coefficients were selected by LASSO. Then, the selected features were linearly combined to construct a radiomics signature.
The differences in the radiomics signature between seminomas and nonseminomas were compared using the Mann-Whitney U test. The diagnostic performance of the radiomics signature was evaluated using the receiver operating characteristic (ROC) curve. The area under the curve (AUC), sensitivity, and specificity were calculated. In addition, the diagnostic performance of the top 10 features selected from mRMR was also evaluated using ROC curve analysis. An overview of the radiomics signature development process is presented in Figure 2.
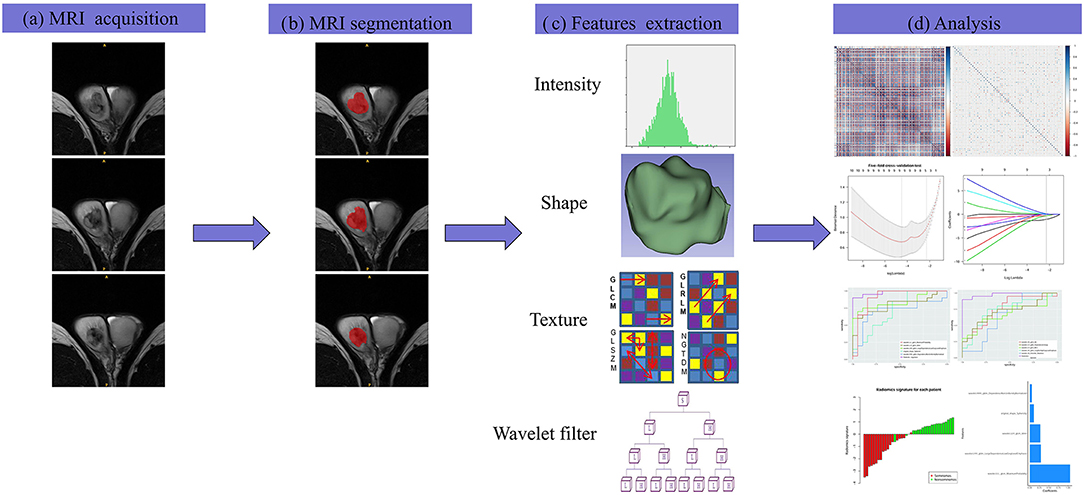
Figure 2. The framework for the radiomics workflow. (a) All patients were scanned with preoperative MRI. (b) Tumors were delineated by stacking regions of interest slice-by-slice on the transverse T2WI. (c) Radiomics features were extracted from the T2WI in a high-throughput manner. (d) Data analysis for the features selection and a radiomics signature construction.
The statistical analyses were performed using R software (version 3.3.4; https://www.r-project.org). The following R packages were used: the “corrplot” package was used to calculate Spearman's correlation coefficient; the “mRMRe” package was used to implement the mRMR algorithm; the “glmnet” was used to perform the LASSO logistic regression model, and the “pROC” package was used to construct the ROC curve.
Results
In the current study, 851 radiomics features were extracted from the T2WI of each patient. Seven hundred eighty features with an ICC ≥ 0.8 were further selected. Two hundred twenty-seven non-significant features were first eliminated using univariate analysis. After removing the redundant features using a Spearman's correlation coefficient threshold value of 0.8, a total of 67 features with low correlation remained. The correlation matrix heatmaps of the features before and after correlation filtering are shown in Figure 3. The features were ranked according to their mRMR scores. The top 10 features were selected using the mRMR algorithm (Table 1). Through the 5-fold cross-validation of the LASSO algorithm, five features with non-zero coefficients were included to construct the radiomics signature. The feature selection process using the LASSO algorithm is shown in Figure 4. The calculation formula to construct the radiomics signature is shown in Table 2. The contribution of the five features to the radiomics signature is shown in Figure 5A. The radiomics signature of each patient is shown in Figure 5B.
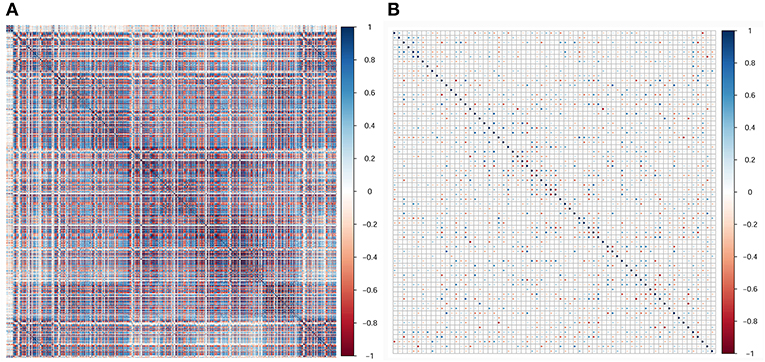
Figure 3. Correlation matrix heatmaps of the features before (A) and after (B) correlation filtering. Before correlation filtering, a mass of redundant features with high correlation coefficients existed.
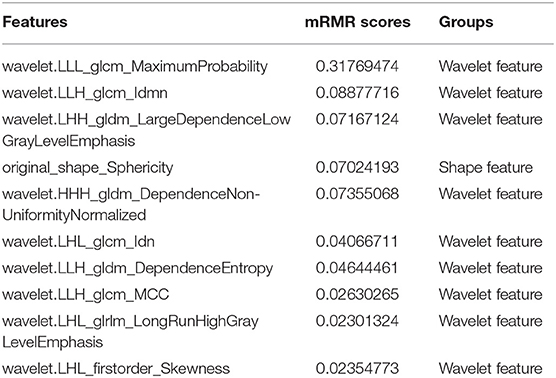
Table 1. The top 10 features selected by mRMR.
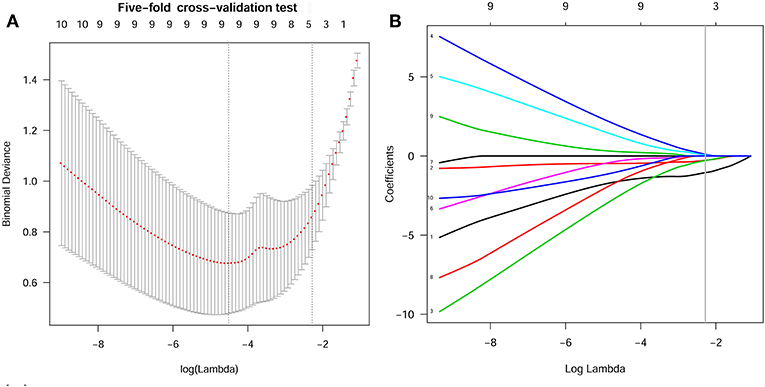
Figure 4. Features selection using the LASSO algorithm. (A) Selection of the tuning parameter (Lambda) in the LASSO model using 5-fold cross-validation. Binomial deviances from the LASSO regression cross-validation model were plotted as a function of log(Lambda). The dotted vertical line at the right was drawn at the optimal value based on the minimum criteria and the 1-standard error rule (the 1-SE criteria). An optimal Lambda value of 0.102 with log(Lambda) = −2.280 and 5 non-zero coefficients were selected. (B) LASSO coefficient profiles of the 10 texture features. A vertical line was drawn at the optimal value selected using the 5-fold cross-validation process in (A). The 5 features with non-zero coefficients were included to construct the radiomics signature.
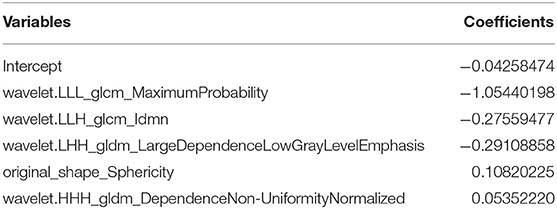
Table 2. Calculation formula for the radiomics signature.
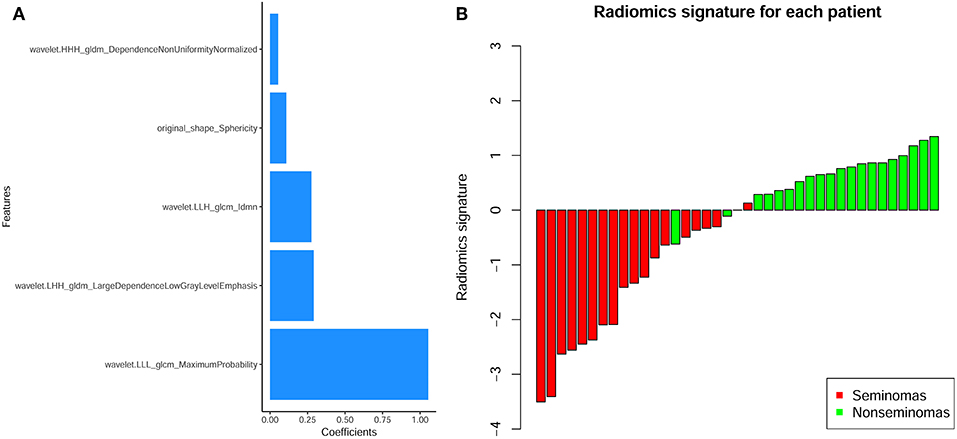
Figure 5. (A) The contribution of the features to the radiomics signature. The histogram shows the contribution of the five features with non-zero coefficients to the radiomics signature. The features that contributed to the radiomics signature are plotted on the y-axis, and their coefficients in the LASSO Cox analysis are plotted on the x-axis. (B) Bar charts of the radiomics signature for each patient. The red bars indicate the radiomics signature of seminomas, while the light green bars indicate the radiomics signature of non-seminomas.
The radiomics signature was significantly different between seminomas and nonseminomas (p < 0.01). The ROC curves of the radiomics signature and the top 10 features selected from mRMR for discriminating between seminomas and nonseminomas are shown in Figure 6 and Table 3. The AUC, sensitivity, and specificity of the radiomics signature were 0.979 (95% CI: 0.873–1.000), 90.00 (95% CI: 68.3–98.8), and 100.00 (95% CI: 82.4–100.0), respectively. The AUC of the radiomics signature was relativity higher than the AUCs of the top 10 features selected from mRMR.
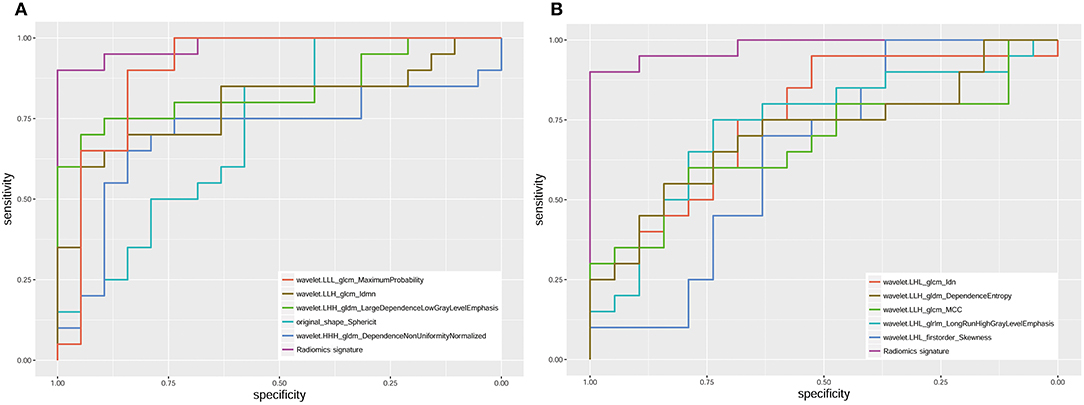
Figure 6. ROC analysis of the radiomics signature and 10 features [(A) the top 5; (B) the bottom five)] selected from mRMR. The AUC of the radiomics signature was 0.979 (95% CI: 0.873–1.000).
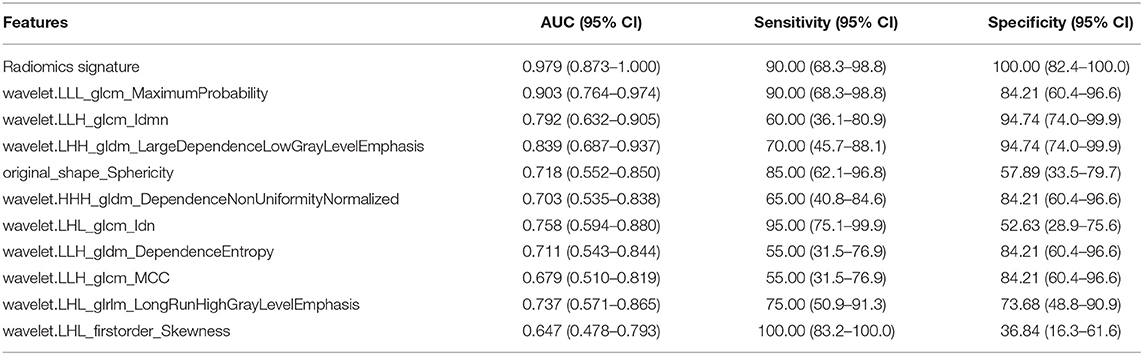
Table 3. ROC analysis of the features selected from mRMR.
Discussion
In this study, an MRI-based radiomics signature was established to preoperatively discriminate between seminomas and nonseminomas. Our results showed that the radiomics signature could provide an excellent diagnostic performance (AUC = 0.979) by employing a large number of quantitative imaging features (851 features were extracted).
Non-invasively discriminating between seminomas and nonseminomas is of great significance. MRI has been proposed as a valuable supplemental imaging technique for characterizing testicular tumors (4, 9, 11). Tsili AC et al. enrolled 21 patients (10 seminomas and 11 nonseminomas) to investigate the value of MRI for differentiating seminomas from nonseminomas (9). Their results showed that the MRI findings led to a correct histologic diagnosis in 19 (91%) of 21 cases and the researchers concluded that tumor heterogeneity on MRI is indicative of nonseminomas. Another study including 15 seminomas and 11 nonseminomas showed that the mean apparent diffusion coefficient (ADC) values of seminomas were significantly lower than those of nonseminomas, while no significant differences were observed in DCE between seminomas and nonseminomas (4). Min et al. included 14 seminomas and 10 nonseminomas to assess the value of whole-tumor ADC histogram parameters for discriminating between seminomas and nonseminomas (11). Their results showed that the 10th percentile ADC value yielded the highest diagnostic performance. Although some positive results for distinguishing seminomas from nonseminomas have been reported, most previous studies used only some qualitative features or limited quantitative features, which may not fully explore the potential information of MRI, and no established prediction model has been built. In contrast to the above studies, in our study, a large number of quantitative radiomics features were extracted from the images and the most useful features were selected to construct a radiomics signature. Moreover, the sample size included in our study was relatively larger than that in previous studies.
Medical imaging provides valuable information for the diagnosis and evaluation of diseases. The conventional methods only use some qualitative features observable by the naked eyes or basic quantitative features, which cannot fully mine potential information from the images. Radiomics may help find potentially valuable information through the high-throughput extraction of quantitative features (14, 15). The newly proposed radiomics method has been successfully applied to various diseases (17, 18, 27–30). In a recent study, Lewin et al. applied radiomics to predict the pathology of postchemotherapy retroperitoneal nodal masses in germ cell tumors (27). Their results showed that the discriminative accuracy, sensitivity, and specificity of radiomics to identify GCT/teratoma vs. fibrosis was 72, 56.2, and 81.9%, respectively. When combined with clinical variables, the accuracy improved to 88%. In another study, Dong et al. suggested that a CT-based radiomic nomogram had excellent predictive ability for occult peritoneal metastasis in advanced gastric cancer patients (18). In our study, we used radiomics analysis to extract 851 features from T2WI and constructed a radiomics signature that includes features with excellent stability and reproducibility. Our results showed that the radiomics signature provides excellent efficiency for discriminating seminomas from nonseminomas. The AUC, sensitivity, and specificity of the radiomics signature were 0.979, 90.00, and 100.00, respectively. The AUC of the radiomics signature was 7.6–33.2% higher than the AUCs of the top 10 features selected from mRMR.
In this study, we only included T2WI for analysis, because T2WI is an essential component of testicular MRI with high contrast and spatial resolution. Previous studies have reported that seminomas and nonseminomas have different characteristics on T2WI (9). The presence of a relatively homogeneous testicular mass with low signal intensity on T2WI is considered indicative of seminomas. On the other hand, tumor heterogeneity is the most valuable finding in the characterization of nonseminomas. Although some studies have demonstrated the value of DWI and DCE in the characterization of testicular tumors (4, 11), these sequences have their limitations. The geometric distortion, susceptibility, and signal intensity dropout of DWI on tissue-air boundaries, such as the prostate, scrotum, and thyroid gland, are remarkable. Moreover, the DWI sequence usually has a low spatial resolution. These factors will limit the application and efficiency of DWI in characterizing testicular tumors. In recent years, some new techniques have been applied to DWI sequence to reduce geometric distortion and susceptibility artifacts, as well as to improve image resolution. However, few of these techniques had been used in testes; we will explore the value of new DWI techniques in testes in future studies (31–33). DCE-MRI usually requires the injection of a gadolinium-based contrast agent, which may increase the patient's risk for nephrogenic systemic fibrosis. Considering the above reasons and the limited sample size, we did not include DWI and DCE in the analysis.
There are some limitations in this study. First, our sample size was small. Although the number of patients included was higher than that of most previous studies, the sample size was still relatively small due to the low morbidity of testicular tumors. Further large-scale and multicenter studies are therefore warranted to obtain high-level evidence for clinical application. Second, rather than an independent validation cohort, internal validation was used in the current study, because there is insufficient data available to create an independent training cohort and a validation cohort. In this case, a fair way to accurately estimate the diagnostic performance of the radiomics signature is to use cross-validation (34). Third, the MRI sequences employed similar parameters but slightly varied slice numbers and thicknesses to cover some large lesions. To this end, we resampled the images before feature extraction to decrease the variability of the radiomics features extracted from the MRI sequences (35).
In conclusion, in the present study, we established a radiomics signature based on the features extracted from T2WI to characterize TGCTs. The radiomics signature provides a non-invasive and quantitative method to differentiate between seminomas from nonseminomas. Further studies are warranted to validate our initial results.
Data Availability Statement
The raw data supporting the conclusions of this manuscript will be made available by the authors, without undue reservation, to any qualified researcher.
Ethics Statement
The studies involving human participants were reviewed and approved by Tongji Hospital, Tongji Medical College, Huazhong University of Science and Technology institutional review board. The patients/participants provided their written informed consent to participate in this study.
Author Contributions
LW, XM, and PZ conception and design. PZ, ZF, WC, HY, CF, and WL acquisition of data. PZ and XM data processing. PZ, ZF, and XM analysis and interpretation of data. LW and XM supervision. PZ and ZF drafting the article. LW, XM, WC, HY, CF, and WL revising article critically for important intellectual content. All authors final approval of the manuscript.
Funding
This research was supported by the National Natural Science Foundation of China (Grant numbers: 81671656, 81801668).
Conflict of Interest
WL was employed by company Julei Technology.
The remaining authors declare that the research was conducted in the absence of any commercial or financial relationships that could be construed as a potential conflict of interest.
References
1. Cheng L, Albers P, Berney DM, Feldman DR, Daugaard G, Gilligan T, et al. Testicular cancer. Nat Rev Dis Primers. (2018) 4:29. doi: 10.1038/s41572-018-0029-0
2. Batool A, Karimi N, Wu XN, Chen SR, Liu YX. Testicular germ cell tumor: a comprehensive review. Cell Mol Life Sci. (2019) 76:1713–27. doi: 10.1007/s00018-019-03022-7
3. Bray F, Ferlay J, Soerjomataram I, Siegel RL, Torre LA, Jemal A. Global cancer statistics 2018: GLOBOCAN estimates of incidence and mortality worldwide for 36 cancers in 185 countries. CA Cancer J Clin. (2018) 68:394–424. doi: 10.3322/caac.21492
4. Tsili AC, Sylakos A, Ntorkou A, Stavrou S, Astrakas LG, Sofikitis N, et al. Apparent diffusion coefficient values and dynamic contrast enhancement patterns in differentiating seminomas from non-seminomatous testicular neoplasms. Eur J Radiol. (2015) 84:1219–26. doi: 10.1016/j.ejrad.2015.04.004
5. Albers P, Albrecht W, Algaba F, Bokemeyer C, Cohn-Cedermark G, Fizazi K, et al. Guidelines on testicular cancer: 2015 update. Eur Urol. (2015) 68:1054–68. doi: 10.1016/j.eururo.2015.07.044
6. Boujelbene N, Cosinschi A, Boujelbene N, Khanfir K, Bhagwati S, Herrmann E, et al. Pure seminoma: a review and update. Radiat Oncol. (2011) 6:90. doi: 10.1186/1748-717X-6-90
7. Oldenburg J, Fossa SD, Nuver J, Heidenreich A, Schmoll HJ, Bokemeyer C, et al. Testicular seminoma and non-seminoma: ESMO Clinical Practice Guidelines for diagnosis, treatment and follow-up. Ann Oncol. (2013) 24 (Suppl. 6):vi125–32. doi: 10.1093/annonc/mdt304
8. Tsili AC, Sofikitis N, Stiliara E, Argyropoulou MI. MRI of testicular malignancies. Abdom Radiol. (2019) 44:1070–82. doi: 10.1007/s00261-018-1816-5
9. Tsili AC, Tsampoulas C, Giannakopoulos X, Stefanou D, Alamanos Y, Sofikitis N, et al. MRI in the histologic characterization of testicular neoplasms. AJR Am J Roentgenol. (2007) 189:W331–7. doi: 10.2214/AJR.07.2267
10. Dikici AS, Er ME, Alis D, Samanci C, Ustabasioglu FE, Demirdag C, et al. Is there any difference between seminomas and nonseminomatous germ cell tumors on shear wave elastography? A preliminary study. J Ultrasound Med. (2016) 35:2575–80. doi: 10.7863/ultra.15.12067
11. Min X, Feng Z, Wang L, Cai J, Yan X, Li B, et al. Characterization of testicular germ cell tumors: whole-lesion histogram analysis of the apparent diffusion coefficient at 3T. Eur J Radiol. (2018) 98:25–31. doi: 10.1016/j.ejrad.2017.10.030
12. Dogra VS, Gottlieb RH, Oka M, Rubens DJ. Sonography of the scrotum. Radiology. (2003) 227:18–36. doi: 10.1148/radiol.2271001744
13. Tsili AC, Bertolotto M, Turgut AT, Dogra V, Freeman S, Rocher L, et al. MRI of the scrotum: recommendations of the ESUR scrotal and penile imaging working group. Eur Radiol. (2018) 28:31–43. doi: 10.1007/s00330-017-4944-3
14. Lambin P, Rios-Velazquez E, Leijenaar R, Carvalho S, van Stiphout RG, Granton P, et al. Radiomics: extracting more information from medical images using advanced feature analysis. Eur J Cancer. (2012) 48:441–6. doi: 10.1016/j.ejca.2011.11.036
15. Lambin P, Leijenaar RTH, Deist TM, Peerlings J, de Jong EEC, van Timmeren J, et al. Radiomics: the bridge between medical imaging and personalized medicine. Nat Rev Clin Oncol. (2017) 14:749–62. doi: 10.1038/nrclinonc.2017.141
16. Gillies RJ, Kinahan PE, Hricak H. Radiomics: images are more than pictures, they are data. Radiology. (2016) 278:563–77. doi: 10.1148/radiol.2015151169
17. Aerts HJ, Velazquez ER, Leijenaar RT, Parmar C, Grossmann P, Carvalho S, et al. Decoding tumour phenotype by non-invasive imaging using a quantitative radiomics approach. Nat Commun. (2014) 5:4006. doi: 10.1038/ncomms5644
18. Dong D, Tang L, Li ZY, Fang MJ, Gao JB, Shan XH, et al. Development and validation of an individualized nomogram to identify occult peritoneal metastasis in patients with advanced gastric cancer. Ann Oncol. (2019) 30:431–8. doi: 10.1093/annonc/mdz001
19. Huang YQ, Liang CH, He L, Tian J, Liang CS, Chen X, et al. Development and validation of a radiomics nomogram for preoperative prediction of lymph node metastasis in colorectal cancer. J Clin Oncol. (2016) 34:2157–64. doi: 10.1200/JCO.2015.65.9128
20. Park HJ, Lee SS, Park B, Yun J, Sung YS, Shim WH, et al. Radiomics analysis of gadoxetic acid-enhanced MRI for staging liver fibrosis. Radiology. (2019) 292:269. doi: 10.1148/radiol.2019194012
21. Wang J, Wu CJ, Bao ML, Zhang J, Wang XN, Zhang YD. Machine learning-based analysis of MR radiomics can help to improve the diagnostic performance of PI-RADS v2 in clinically relevant prostate cancer. Eur Radiol. (2017) 27:4082–90. doi: 10.1007/s00330-017-4800-5
22. Motzer RJ, Agarwal N, Beard C, Bhayani S, Bolger GB, Buyyounouski MK, et al. Testicular cancer. J Natl Compr Canc Netw. (2012) 10:502–35. doi: 10.6004/jnccn.2012.0050
23. van Griethuysen JJM, Fedorov A, Parmar C, Hosny A, Aucoin N, Narayan V, et al. Computational radiomics system to decode the radiographic phenotype. Cancer Res. (2017) 77:e104–e7. doi: 10.1158/0008-5472.CAN-17-0339
24. Huynh E, Coroller TP, Narayan V, Agrawal V, Romano J, Franco I, et al. Associations of radiomic data extracted from static and respiratory-gated CT scans with disease recurrence in lung cancer patients treated with SBRT. PLoS ONE. (2017) 12:e0169172. doi: 10.1371/journal.pone.0169172
25. De Jay N, Papillon-Cavanagh S, Olsen C, El-Hachem N, Bontempi G, Haibe-Kains B. mRMRe: an R package for parallelized mRMR ensemble feature selection. Bioinformatics. (2013) 29:2365–8. doi: 10.1093/bioinformatics/btt383
26. Sauerbrei W, Royston P, Binder H. Selection of important variables and determination of functional form for continuous predictors in multivariable model building. Stat Med. (2007) 26:5512–28. doi: 10.1002/sim.3148
27. Lewin J, Dufort P, Halankar J, O'Malley M, Jewett MAS, Hamilton RJ, et al. Applying radiomics to predict pathology of postchemotherapy retroperitoneal nodal masses in germ cell tumors. JCO Clin Cancer Inform. (2018) 2:1–12. doi: 10.1200/CCI.18.00004
28. Song J, Shi J, Dong D, Fang M, Zhong W, Wang K, et al. A new approach to predict progression-free survival in stage IV EGFR-mutant NSCLC patients with EGFR-TKI therapy. Clin Cancer Res. (2018) 24:3583–92. doi: 10.1158/1078-0432.CCR-17-2507
29. Peng H, Dong D, Fang MJ, Li L, Tang LL, Chen L, et al. Prognostic value of deep learning PET/CT-based radiomics: potential role for future individual induction chemotherapy in advanced nasopharyngeal carcinoma. Clin Cancer Res. (2019) 25:4271–9. doi: 10.1158/1078-0432.CCR-18-3065
30. Min X, Li M, Dong D, Feng Z, Zhang P, Ke Z, et al. Multi-parametric MRI-based radiomics signature for discriminating between clinically significant and insignificant prostate cancer: cross-validation of a machine learning method. Eur J Radiol. (2019) 115:16–21. doi: 10.1016/j.ejrad.2019.03.010
31. Kim YJ, Kim SH, Kang BJ, Park CS, Kim HS, Son YH, et al. Readout-segmented echo-planar imaging in diffusion-weighted mr imaging in breast cancer: comparison with single-shot echo-planar imaging in image quality. Korean J Radiol. (2014) 15:403–10. doi: 10.3348/kjr.2014.15.4.403
32. Kim LH, Lee EH, Galvez M, Aksoy M, Skare S, O'Halloran R, et al. Reduced field of view echo-planar imaging diffusion tensor MRI for pediatric spinal tumors. J Neurosurg Spine. (2019) 5:1–9. doi: 10.3171/2019.4.SPINE19178
33. Corrias G, Raeside MC, Agostini A, Huicochea-Castellanos S, Aramburu-Nunez D, Paudyal R, et al. Pilot study of rapid MR pancreas screening for patients with BRCA mutation. Eur Radiol. (2019) 29:3976–85. doi: 10.1007/s00330-018-5975-0
34. LeCarpentier GL, Roubidoux MA, Fowlkes JB, Krucker JF, Hunt KA, Paramagul C, et al. Suspicious breast lesions: assessment of 3D Doppler US indexes for classification in a test population and fourfold cross-validation scheme. Radiology. (2008) 249:463–70. doi: 10.1148/radiol.2492060888
35. Larue R, van Timmeren JE, de Jong EEC, Feliciani G, Leijenaar RTH, Schreurs WMJ, et al. Influence of gray level discretization on radiomic feature stability for different CT scanners, tube currents and slice thicknesses: a comprehensive phantom study. Acta Oncol. (2017) 56:1544–53. doi: 10.1080/0284186X.2017.1351624
Keywords: magnetic resonance imaging, T2-weighted imaging, testicular neoplasms, testicular germ cell tumors, radiomics
Citation: Zhang P, Feng Z, Cai W, You H, Fan C, Lv W, Min X and Wang L (2019) T2-Weighted Image-Based Radiomics Signature for Discriminating Between Seminomas and Nonseminoma. Front. Oncol. 9:1330. doi: 10.3389/fonc.2019.01330
Received: 23 July 2019; Accepted: 14 November 2019;
Published: 28 November 2019.
Edited by:
Rong Tian, Sichuan University, ChinaReviewed by:
Di Dong, Institute of Automation (CAS), ChinaZhenyu Shu, Chinese Academy of Medical Sciences and Peking Union Medical College, China
Copyright © 2019 Zhang, Feng, Cai, You, Fan, Lv, Min and Wang. This is an open-access article distributed under the terms of the Creative Commons Attribution License (CC BY). The use, distribution or reproduction in other forums is permitted, provided the original author(s) and the copyright owner(s) are credited and that the original publication in this journal is cited, in accordance with accepted academic practice. No use, distribution or reproduction is permitted which does not comply with these terms.
*Correspondence: Xiangde Min, minxiangde0129@126.com; Liang Wang, wang6@tjh.tjmu.edu.cn