 Minjeong Yeon1
 Hyun Suk Jung
 Youngmi Kim
 Dooil Jeoung
- 1Department of Biochemistry, Kangwon National University, Chuncheon-si, South Korea
- 2College of Medicine, Institute of New Frontier Research, Hallym University, Chuncheon-si, South Korea
Although the cancer/testis antigen CAGE has been implicated in tumorigenesis, the molecular mechanisms of CAGE-promoted tumorigenesis remain largely unknown. CT26Flag−CAGE cells, CT26 (mouse colon cancer cells) cells stably expressing CAGE, were established to investigate CAGE-promoted tumorigenesis. Down-regulation of CAGE led to decreased autophagic flux in CT26Flag−CAGE cells. CAGE interacted with Beclin1, a mediator of autophagy. The CT26Flag−CAGE cells showed enhanced autophagosome formation and displayed greater tumor spheroid-forming potential than CT26 cells. MicroRNA array analysis revealed that CAGE decreased the expression of various microRNAs, including miR-140-5p, in CT26 cells. CAGE was shown to bind to the promoter sequences of miR-140-5p. MiR-140-5p inhibition increased the tumorigenic potential of and autophagic flux in CT26 cells. A miR-140-5p mimic exerted negative effects on the tumorigenic potential of CT26Flag−CAGE cells and autophagic flux in CT26Flag−CAGE cells. MiR-140-5p was predicted to bind to the 3′-UTR of Wnt1. CT26Flag−CAGE cells showed higher expression of Wnt1 than CT26 cells. Down-regulation of Wnt1 decreased autophagic flux. Luciferase activity assays showed the direct regulation of wnt1 by miR-140-5p. Tumor tissue derived from the CT26Flag−CAGE cells revealed higher expressions of factors associated with activated mast cells and tumor-associated macrophages than tumor tissue derived from CT26 cells. Culture medium from the CT26Flag−CAGE cells increased autophagic flux in CT26 cells, mast cells and macrophages. Culture medium from the CT26Flag−CAGE cells increased CD163 and autophagic flux in CT26 cells, mast cells, and macrophages in a Wnt1-dependent manner. Exosomes from CT26Flag−CAGE cells increased autophagc flux in CT26 cells, mast cells, and macrophages. Exosomes from CT26Flag−CAGE cells increased the tumorigenic potential of CT26 cells. Wnt1 was shown to be present within the exosomes. Recombinant Wnt1 protein increased autophagic flux in CT26, mast cells, and macrophages. Recombinant wnt1 protein mediated interactions between the CT26 cells, mast cells, and macrophages. Our results showed novel roles for the CAGE-miR-140-5p-Wnt1 axis in autophagic flux and cellular interactions mediated by exosomes.
Introduction
CAGE, a cancer/testis antigen, is present in the sera of patients with various cancers (1, 2). Furthermore, CAGE predominantly reacts with sera from cancer patients, but not with healthy control (3).
CAGE displays tumor-promoting potential and promotes cell cycle progression by inducing expression of cyclin D1 and E in AP-1 and E2F-dependent manner (4). CAGE stimulates angiogenesis (5, 6) and interacts with HDAC2 and confers resistance to anti-cancer drugs (7). The CAGE-miR-200b negative feedback loop regulates anti-cancer drug-resistance and tumorigenic potential (5).
Phthalate enhances cancer cell metastasis and anti-drug resistance by increasing cancer cell stemness (8). Autophagy promotes cancer stem cell (CSC) characteristics such as self-renewal, tumor initiation, and drug resistance (9). The prosurvival autophagy pathway is critical for CSC maintenance (10). The inhibition of autophagic flux enhances apoptosis and anti-cancer effects in hepatocellular carcinoma cells (11). Autophagic flux is closely related to multiple myeloma stem cell-like properties (12). Cisplatin resistance results from the inhibition of apoptosis and autophagy (13). These reports suggest that CAGE may regulate autophagy and CSC-like properties.
CSCs educate monocytes/macrophages toward tumor associated macrophages (TAMs) and the CSCs and TAMs interact and reciprocally promote stem cell-like properties of CSCs such as self-renewal and anti-cancer drug-resistance (9). TLR2 stimulation of human mast cells promotes the growth of colon cancer spheroids (14). Mast cell-derived mediators activate STAT3 signaling via the down-regulation of GSK3β expression, which in turn inhibits glioma cell proliferation and migration (15). Exosomes from bone marrow stromal macrophages regulate CSC-like properties, by either inducing or reversing dormancy (16). These reports suggest role for exosomes in mediating cellular interactions involving cancer cells and stromal cells within the tumor microenvironment.
We investigated the mechanisms of CAGE-promoted tumorigenesis in detail. We identified miR-140-5p as a direct target of CAGE. We present evidence that the CAGE-miR-140-5p axis regulates autophagic flux, CSC-like properties, and tumorigenic potential. MiR-140-5p acted as a negative regulator of Wnt1. Wnt1 was present within exosomes derived from mouse colon cancer cells expressing CAGE. We present evidence that the CAGE-miR-140-5p-Wnt1 axis regulated cellular interactions within the tumor microenvironment mediated by exosomes. We suggest that CAGE can serve as a target for the development of anti-cancer drugs.
Materials and Methods
Materials
An enhanced chemiluminescence (ECL) kit was purchased from Amersham Biosciences. Lipofectamine and Plus™ reagent were purchased from Invitrogen. SiRNAs, miRNA inhibitors, and miRNA mimics were purchased from Bioneer Company (Daejeon, Korea). Goat anti-rabbit IgG (conjugated with HRP) was purchased from Enzo Company (ADI-SAB-300-J), Goat anti-mouse IgG (conjugated with HRP) was purchased from Thermo Fisher Company (31430), and Donkey anti-goat IgG (conjugated with HRP) was purchased from Thermo Fisher Company (A15999). Recombinant wnt1 protein was purchased from R&D systems.
Cell Lines and Cell Culture
Cancer cell lines used in this study were cultured in Dulbecco's modified minimal essential medium (Invitrogen) supplemented with heat-inactivated 10% fetal bovine serum (Invitrogen) and antibiotics at 37°C in a humidified incubator with a mixture of 95% air and 5% CO2. Mouse CT26Flag−CAGE cells that stably express CAGE were established by selection in medium containing G418 (400 μg /ml). CT26Flag−CAGE1 cells and CT26Flag−CAGE2 cells stably express CAGE. These cells are separate independent clone. CT26 cells were purchased from Korea Cell Line Bank (KCLB 80009). Lung mast cells and lung macrophages were isolated according to standard procedures (17).
Immunoblot
For PAGE and Western blot, cell or tissues lysates were prepared using lysis buffer (62.5 mm Tris-HCl, pH 6.8, 2% (w/v) SDS, 10% (v/v) glycerol, 50 mm dithiothreitol, 0.01% (w/v) bromphenol blue, 10 mm NaF, 1% (v/v) protease inhibitor mixture, 1 mm sodium orthovanadate). The samples were boiled for 5 min, and equal amounts of protein (20 μg/well) were analyzed on a 10% SDS-PAGE. After electrophoresis, proteins were transferred onto a PVDF membrane (Amersham, Cat.10600023) and subjected to immunoblotting. The membranes are blocked with 2% BSA (Gendepot, Cat.A0100-050) in Tris buffered saline with 0.1% Tween-20 (TBS-T) for 30 min. The membranes were incubated with each primary antibody on a shaker at 4°C overnight. The dilution of each primary antibody was empirically determined. After extensive washing, blots were further incubated with an anti-mouse or anti-rabbit IgG-horseradish peroxidase-conjugated antibody at a 1:3,000 dilution for 1 h at room temperature and were developed using an enhanced chemiluminescence kit (ELPIS, 1073).
Immunoprecipitation
Cells (1 × 10⁷) were lysed in immunoprecipitation buffer (50 mmol/l HEPES, pH 7.6, 150 mmol/l NaCl, 5 mmol/l EDTA, 0.1% Nonidet P-40). After centrifugation (10 min at 15,000× g) to remove particulate material, the supernatant was incubated with each antibody (2 μg/ml) with constant agitation at 4°C. The immunocomplexes were precipitated with protein A/G-Sepharose (Santa Cruz, sc-2003) and analyzed by Western blot. Two hundred microgram of cell lysates or tissue lysates were subjected to immunoprecipitation.
Immunofluorescence Staining
Cells were fixed with 4% paraformaldehyde (v/v) and then permeabilized with 0.4% Triton X-100. Cells were incubated with primary antibody specific to LC3 (Cell Signaling, 12741, 1:200), CD163 (AbCam, Ab 182422, 1:100), iNOS (Cell Signaling, 13120, 1:100) or Flag (Sigma, sc-398254, 1:500) for 2 h. Anti-rabbit Alexa Fluor 488 (for detection of LC3 and CD163, 1:500) or anti-goat Alexa Fluor 546 (for detection of iNOS) secondary antibody (Molecular Probes, 1:500) was added to cells and incubated for 1 h. For immunofluorescence staining of exosomes, Exosomes in PBS were applied to fibronectin-coated chamber slides (10 μg/ml) for 24 h at 4°C to allow binding exosomes to the slide surface. Immunofluorescence staining employing anti-TSG101 antibody (Santa Cruz Biotechnology, sc-7964, 1:100) or CD63 (Cusabio, CSB-PA259468, 1:100) was performed as previously described.
Chemo Invasion and Migration Assays
Invasion and migration potential of cancer cells were determined according to the standard procedures employing transwell chamber system (5, 18). Results were analyzed for statistical significance using the Student's t-test. Differences were considered significant when p < 0.05.
MicroRNA Array
MicroRNA array analysis was performed according to the protocols provided by the manufacturer (Koma Biotech).
RNA Extraction and Quantitative Real Time PCR
Total miRNA was isolated using the mirVana miRNA isolation kit (Ambion). CDNA was synthesized from miRNA with poly (A) tail using a poly (T) adaptor primer and qScript™ reverse transcriptase (Quanta Biogenesis). Expression levels of miR-140-5p was quantified with a SYBR Green qRT-PCR kit (Ambion) using a miRNA-specific forward primer and a universal poly (T) adaptor reverse primer.
Transfection
Transfections were performed according to the manufacturer's instructions (Invitogen). For miR-140-5p knockdown, cells were transfected with 10 nM oligonucleotide (inhibitor) with Lipofectamine 2000 (Invitrogen), according to the manufacturer's protocol. The sequences used were 5′-CAGUGGUUUUACCCUAUGGUAG-3′ (miR-140-5p inhibitor) and 5′-TAACACGTCTATACGCCCA-3′ (control inhibitor).
In vivo Tumorigenic Potential
Cancer cells (1 × 10⁶) were injected subcutaneously into the dorsal flank area of the BALB/c mice to induce formation of tumors. After tumors reach certain size, control mimic or miR-140-5p mimic (each at 100 nM) was injected five times to determine the effect of miR-140-5p on the tumorigenic potential of CT26Flag−CAGE cells. Control inhibitor or miR-140-5p inhibitor (each at 100 nM) was also injected five times to determine the effect of miR-140-5p on the tumorigenic potential of CT26. To examine whether exosomes would affect the tumorigenic potential, CT26 cells (5 × 10⁶) in 1:1 ratio of exosomes:Matrigel (Growth Factor Reduced; BD Biosciences) were injected subcutaneously in flanks of 8-week-old male nude mice. All animal experiments were performed according to the guide lines of the Korean Council for the Care and Use of Animals in Research and approved by the Institutional Animal Care and Use Committee (IACUC) of Kangwon National University (KIACUC-160329-2).
Immunohistochemical Staining
The immunohistochemical staining was performed according to the protocols provided by the manufacturer (Vector Laboratories Inc., Burlingame, CA). Tissues were fixed in 10% (v/v) buffered formalin, embedded in paraffin, sectioned at 4–6 μm, Immunohistochemistry staining of tissues was performed by using the avidin-biotin detection method (Vectastain ABC kit, Vector Laboratories Inc., Burlingame, CA). Briefly, 4–6-μm-thick sections of the paraffin-embedded tissue blocks were cut, mounted on positively charged glass slides, and dried in an oven at 56°C for 30 min. The sections were deparaffinized in xylene and then rehydrated in graded ethanol and water. Endogenous peroxidase was blocked by incubation in 3% (v/v) hydrogen peroxide for 15 min. Antigen retrieval was accomplished by pretreatment of the sections with citrate buffer at pH 6.0 for 20 min at 56°C in a microwave oven and then allowing the sections to cool for 30 min at room temperature. Non-specific endogenous protein binding was blocked using 2.5% normal horse serum (Vector, S-2012). The sections were then incubated with primary antibodies overnight at 4°C. The following primary antibodies were used: Flag (Sigma, F31645, 1: 1,000), pAMPKThr172 (R&D Systems, 2535, 1:200), p62 (Santa Cruz, sc-25575, 1:500), tryptase (Santa Cruz, sc-59587,1:100), chymase (Santa Cruz, sc-25575, sc-59586, 1:200), Wnt1 (Abcam, ab-15251, 1:500), β-catenin (Santa Cruz, sc-59737, 1:100), cyclin D1(Santa Cruz, sc-20044, 1:200), or ATG7 (Cell Signaling, 8558. 1:200). After washing, sections were treated with biotinylated secondary antibodies (Vector, MP-7500). The color was developed with diaminobenzidine (Vector, Cat.SK-4100). Sections were counterstained with Mayer's hematoxylin(Dako, S3309).
Chromatin Immunoprecipitation (ChIP) Assays
ChIP assays were performed according to the standard procedures (19). Mouse miR140-5p promoter-1 [5′-GGTTGTCCTTGGCTACGTG-3′ (forward) and 5′-TAGAAGGAAAGCCAGGGG-3′ (reverse)], miR-140-5p promoter-2 [5′-TATGTGATGCAGCCAGAGCA-3′ (forward) and 5′-CCAGCAAGCAGGGTCAGA-3′ (reverse)] were used.
Tumor Sphere-Forming Potential Assay
For tumor spheroid forming assay, cells were plated (5 × 10⁴ cells/well) in ultralow attachment plates (Corning Inc.) in DMEM/F12 stem cell medium. Cells were maintained at 37°C in a humidified 5% CO2 incubator and fed with 0.2 ml of fresh stem cell medium on days 2, 4, and 6. The total number of spheres was counted after 7 days by inverted microscopy (Olympus).
Matrigel Plug Assays
Matrigel plug assays employing culture medium were performed according to the standard procedures (5, 20). All animal experiments were performed according to the guide lines of the Korean Council for the Care and Use of Animals in Research and approved by the Institutional Animal Care and Use Committee (IACUC) of Kangwon National University (KIACUC-160329-2).
Luciferase Activity Assays
A 343-bp mouse wnt1 gene segment encompassing 3′-UTR of wnt1 was PCR-amplified and subcloned into the (XbaI) site of pGL3 luciferase plasmid. The mutant pGL3-3′-UTR-wnt1 construct was made with the QuikChange site-directed mutagenesis kit (Stratagene). Luciferase activity assay was performed according to the standard procedures (19).
Electron Microscopic Observation of Autophagosomes
Electron microscopic observation of autophagosomes was performed according to the standard procedures (19). Briefly, the cells were dehydrated with a graded acetone series, and embedded into Spurr medium (Electron Microscopy System). The samples were sectioned (60 nm) with an ultra-microtome (RMC MTXL, Arizona, USA), and double-stained with 2% uranyl acetate for 20 min and lead citrate for 10 min. The sections were then viewed under a Tecnai G2 (FEI, USA) TEM at 200 kV.
Isolation and Characterization of Exosomes
Isolation of the exosomes was performed according to the manufacturer's instructions (System Biosciences, Mountain View, CA). Exosomes were observed under a Tecnai T10 transmission electron microscope (FEI, USA).
Labeling and Internalization of Exosomes
Exosomes from CT26Flag−CAGE1 cells were labeled using PKH67 Fluorescent Cell Linker kits (Sigma-Aldrich, St. Louis, MO). Uptake of exosomes was determined according to the standard procedures (19). Cells were visualized under a confocal laser scanning microscope LX70 FV300 05-LPG-193 (Olympus).
The Presence of wnt1 in the Exosomes of CT26Flag-CAGE Cells
In order to precipitate exosomes, exosomes extractions purified from CT26Flag−CAGE cells were subjected to centrifugation at 60,000 g for 30 min. Precipitated exosomes were collected and cross-linked by 0.1% glutaraldehyde and 2% paraformaldehyde in phosphate buffer (pH 7.4) for 1 h (4°C), then post-fixed in 2% osmium tetroxide for 30 min (4°C). They were dehydrated with a graded series of ethanol and embedded into epoxy resin (PELCO, USA). Ultrathin sections (~80 nm) were prepared from Ultracut UCT (Leica, Germany) and the sections were mounted on copper grids. Followed to the sectioning, it has stained with 1% uranyl acetate for 20 min, and lead citrate for 10 min for the subsequent TEM observations. For immune-gold labeling electron microscopy, ultrathin sections on the grids were treated with 3% sodium (meta) periodate for 30 min for etching and it was treated with 0.02 M glycine (10 min) for quenching the reaction of free aldehyde group. Sections were then washed in deionized water, floated for 1 h in PBS containing 1% BSA. Etching specimens were incubated directly in the primary rabbit or/and mouse antibodies (Anti-Wnt1 or/and Anti-TSG101 antibodies) at 1:20 dilutions for overnight at 4°C. The grid were washed five time with 0.1% BSA in PBS, incubated in secondary antibodies, anti- Rabbit IgG conjugated to 10 nm and anti-mouse IgG conjugated to 25 nm (AURION, Holland) diluted 1:20 in 0.1% BSA-PBS. The sample grids were stained with uranyl acetate and lead citrate. The sectioned and immune-gold labeled grids were examined using a Tecnai T10 (FEI, USA) operated at 100 kV and JEOL-2100F (JEOL, USA) operated at 200 KV.
Statistical Analysis
Data were analyzed and graphed using GraphPad Prism statistics program (GraphPad Prism software). Results are presented as means ± S.E. Statistical analysis was performed using one way t-tests with differences between means considered significant when p < 0.05.
Results
CAGE Regulates Autophagic Flux and Cancer Stem Cell-Like Properties
Anti-cancer drug-resistance is closely related to autophagy (18, 21). The effect of CAGE on autophagic flux was investigated. For this, we established mouse colon cancer cells stably expressing CAGE. CT26Flag−CAGE1 and CT26Flag−CAGE2 cells showed higher autophagic flux, such as p62, pBeclin1Ser14, LC3II, ATG7, and pAMPKαT172 than the parental CT26 cells (Figure 1A). CAGE displayed binding to Beclin1, a mediator of autophagy, in the CT26Flag−CAGE1 and CT26Flag−CAGE2 cells (Figure 1A). These cells also displayed higher expression of LC3 puncta than the CT26 cells (Figure 1B). The CT26Flag−CAGE1 and CT26Flag−CAGE2 cells showed higher migration and invasion potential than the parental CT26 cells (Figure 1C). CAGE showed both cytoplasmic and nuclear localization (Figure 1D). CAGE increased autophagosomes formation in the CT26 cells (Supplementary Figure 1). Down-regulation of CAGE led to decreased autophagic flux in the CT26Flag−CAGE1 and CT26Flag−CAGE2 cells (Figure 2A). Down-regulation of CAGE led to decreased expression of LC3 puncta (Figure 2B) and decreased the migration and invasion potentials of the CT26Flag−CAGE1 cells (Figure 2C). Autophagy regulates the expression of pluripotency-associated proteins (PA), such as SOX2, in cervical CSCs (10). Calpain-6 promotes autophagy and maintains the tumor-initiating cell population in sarcoma stem cells (22). We examined the effect of CAGE on CSC-like properties. The CT26Flag−CAGE1 and CT26Flag−CAGE2 cells showed higher tumor spheroid-forming potential than the CT26 cells (Figure 2D). CAGE was necessary for the tumor spheroid forming potential of CT26Flag−CAGE1 cells (Figure 2E). The CT26Flag−CAGE1 and CT26Flag−CAGE2 cells showed higher expression of CD133 and SOX2, markers of cancer stemness (23), than CT26 (Figure 2F). CAGE interacted with SOX2 (Figure 2F). SOX2 did not affect the expression of CAGE, but decreased autophagic flux in CT26Flag−CAGE1 cells (Figure 2G). Thus, CAGE regulates autophagic flux and CSC-like properties.
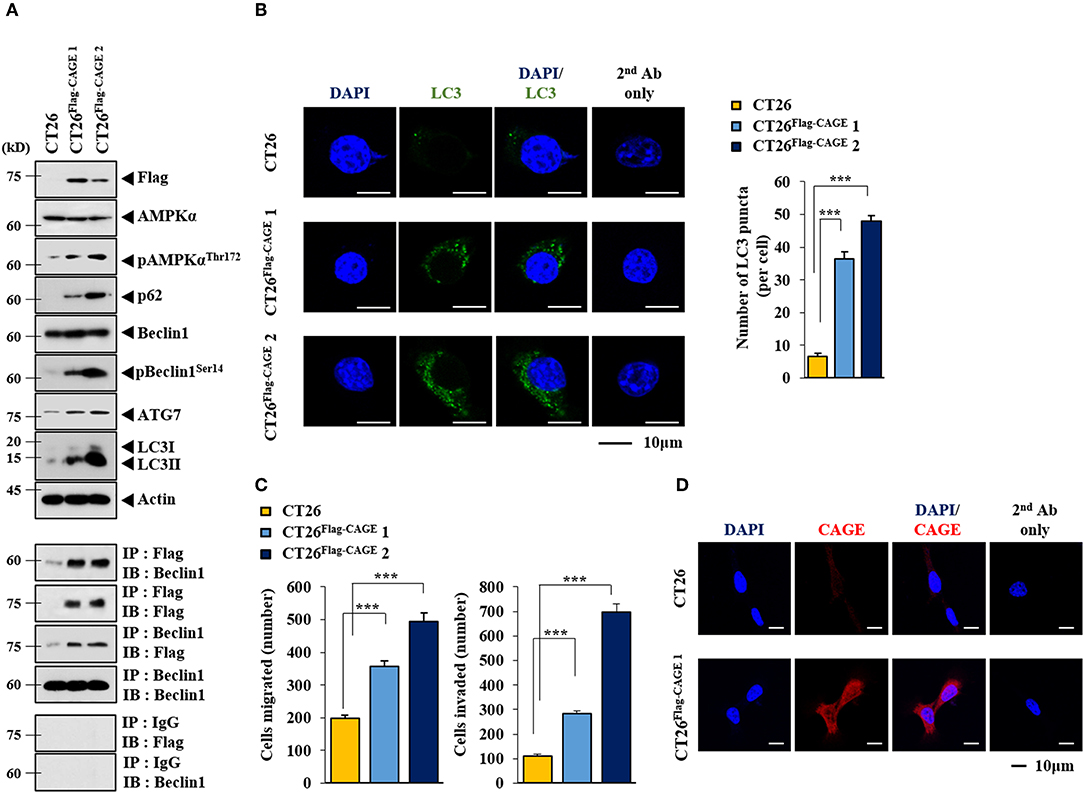
Figure 1. CAGE increases the expression of autophagic flux. (A) Cell lysates from the indicated cancer cells were subjected to immunoblot (upper panel) and immunoprecipitation (lower panel). Each blot is a representative of three independent experiments. (B) LC3 puncta expression was determined as described. ***p < 0.0005. (C) The indicated cancer cells were subjected to migration and invasion assays. ***p < 0.0005. (D) Immunofluorescence staining was performed to examine the localization of CAGE.
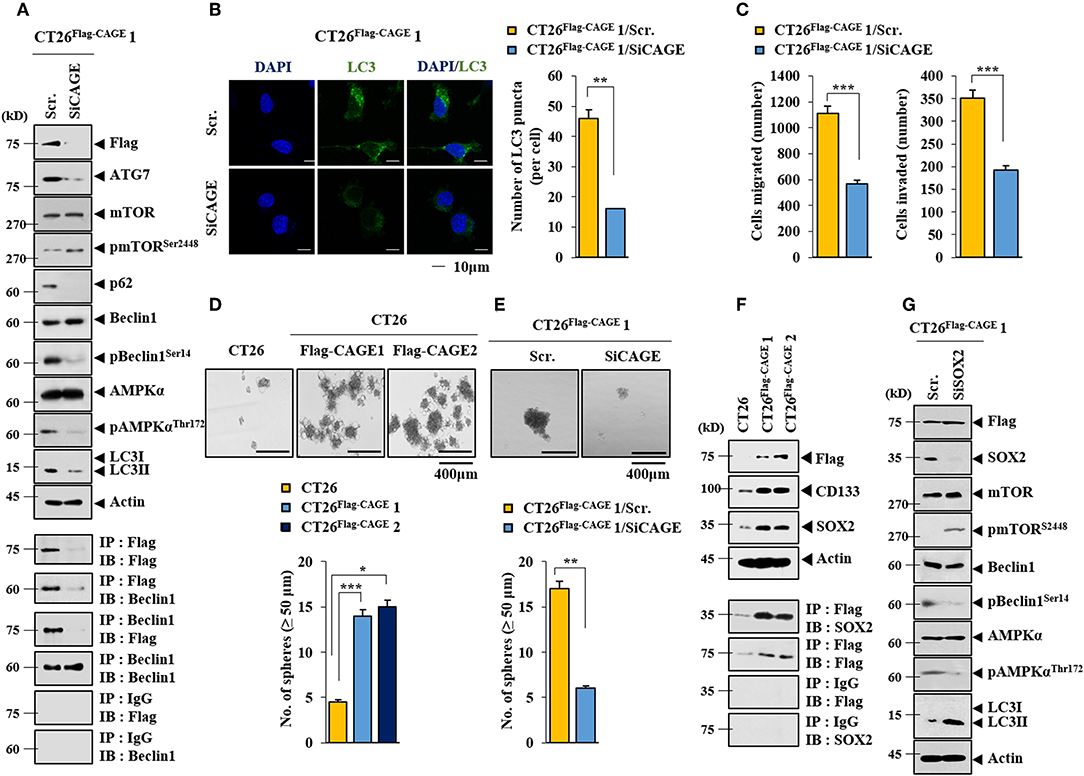
Figure 2. Down-regulation of CAGE decreases autophagic flux, and CSC-like properties. (A) The indicated cancer cells were transfected with the indicated siRNA (each at 10 nM) for 48 h, followed by immunoblot (upper) and immunoprecipitation (lower). (B) Same as A except that LC3 puncta expression was determined. **p < 0.005. (C) The indicated cancer cells were transfected with the indicated siRNA (each at 10 nM) for 48 h, followed by migration and invasion potential assays. ***p < 0.0005. (D) Tumor spheroid forming potentials of the indicated cancer cells were determined as described. *p < 0.05; **p < 0.005; ***p < 0.0005. (E) Cells were transiently transfected with the indicated siRNA (each at 10 nM) for 48 h. Cells were then subjected to tumor spheroid forming potential assays. **p < 0.005. (F) Cell lysates from the indicated cancer cells were subjected to immunoblot (upper) and immunoprecipitation (lower). (G) The indicated cancer cells were transiently transfected with the indicated siRNA (each at 10 nM) for 48 h, followed by immunoblot.
CAGE-Beclin1 Interaction Is Necessary for Autophagy
CQ (Figure 3A) and 3-MA (Figure 3B), inhibitors of autophagy, decreased autophagic flux and inhibited the interaction between CAGE and Beclin1 in CT26Flag−CAGE1 cells. CQ and 3-MA decreased the tumor spheroid-forming potential (Figure 3C) and the expression of SOX2 in CT26Flag−CAGE1 cells (Figure 3D). CQ and 3-MA negatively regulated the migration and invasion potential of CT26Flag−CAGE1 cells (Figure 3E). These results suggest that CAGE-Beclin1 interaction is necessary for autophagic flux.
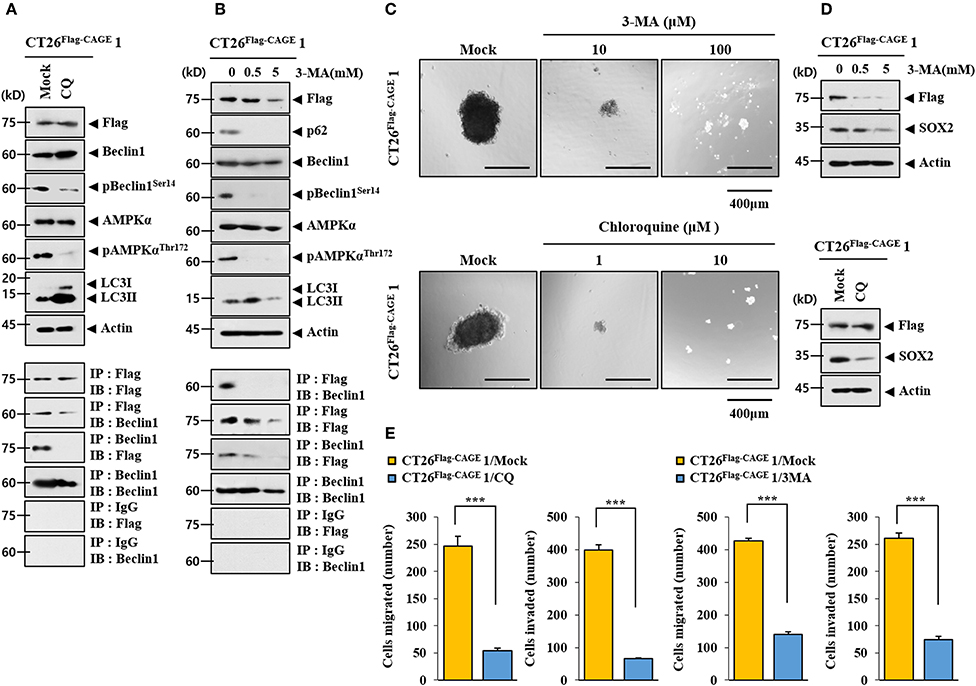
Figure 3. CAGE-Beclin1 interaction is necessary for autophagy. (A) The indicated cancer cells were treated with CQ (50 μM) for 12 h, followed by immunoblot and immunoprecipitation. (B) The indicated cancer cells were treated with various concentrations of 3-MA for 12 h, followed by immunoblot and immunoprecipitation. (C) The indicated cancer cells were treated with CQ or 3-MA at the indicated concentration, followed by tumor spheroid forming potential assays. (D) The indicated cancer cells were treated with 3-MA at the indicated concentration for 12 h or treated with CQ (50 μM) for 12 h, followed by immunoblot. (E) The indicated cancer cells were treated with CQ (50 μM) for 12 h or with 3-MA (0.5 mM) for 12 h, followed by invasion and migration potential assays. ***p < 0.0005.
CAGE Enhances the Tumorigenic Potential of CT26
CT26Flag−CAGE1 and CT26Flag−CAGE2 cells showed higher tumorigenic potential than the CT26 cells (Figure 4A). Immunoblots of tumor tissue lysates showed that CAGE increased autophagic flux and demonstrated binding to Beclin1 (Figure 4B). Immunohistochemical staining showed that CAGE increased autophagic flux (Figure 4C). Thus, CAGE enhances the tumorigenic potential of CT26 by increasing autophagic flux.
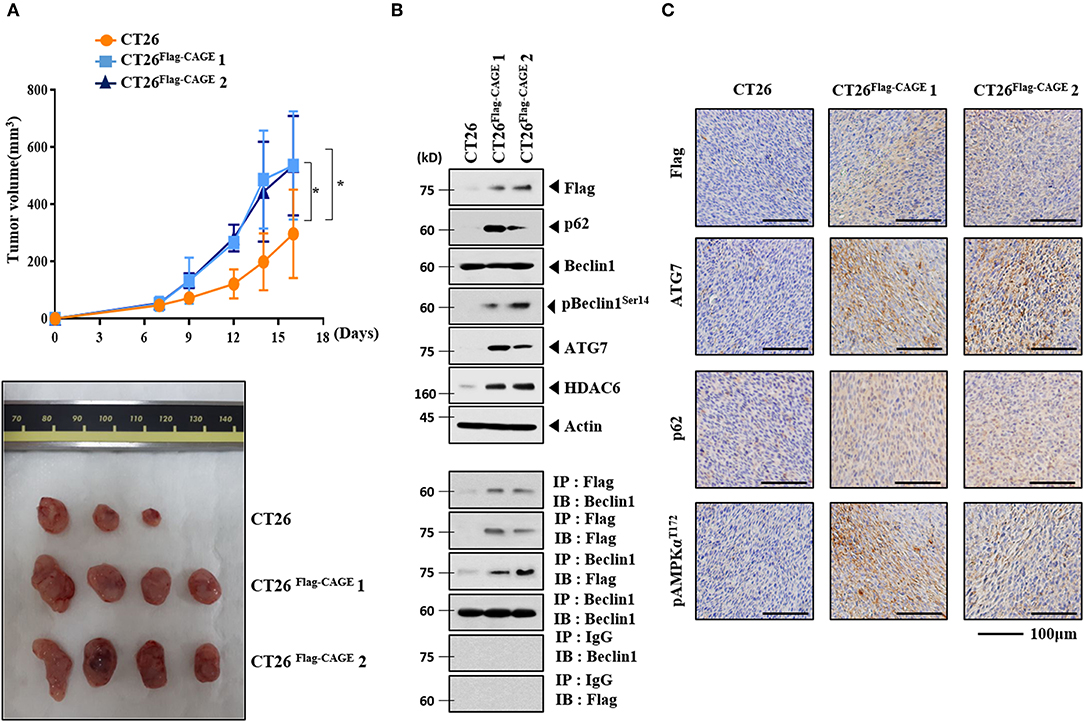
Figure 4. CAGE enhances the tumorigenic potential of CT26 cells. (A) The indicated cancer cells (each at 1 × 10⁶) were injected into the dorsal flanks of BALB/C mice. Each value represents an average obtained from BALB/C mice of each group. Data are expressed as a mean ± S.D. Tumor volumes were measured as described. *p < 0.05. Each experimental group consisted of four BALB/C mice. (B) Lysates from the indicated tumor tissues were subjected to immunoblot and immunoprecipitation. (C) Immunohistochemical staining of tumor tissue employing the indicated antibody (2 μg/ml) was performed. Scale bar represents 100 μm.
Identification of miRNAs Regulated by CAGE
To identify the miRNAs regulated by CAGE, miRNA array analysis was performed. The CT26Flag−CAGE1 and CT26Flag−CAGE2 cells showed lower expressions of miRNAs, such as miR-140-5p, than the CT26 cells (Figure 5A). QRT-PCR analysis confirmed the microRNA analysis (Figure 5B). CAGE negatively regulated the expression of miR-140-5p (Figure 5C). The miR-140-5p promoter sequences served as binding sites for transcription factors (Figure 5D, upper). CAGE displayed binding to the promoter sequences of miR-140-5p (Figure 5D, lower). This indicates direct regulation of miR-140-5p by CAGE. Thus, miR-140-5p, a direct target of CAGE, may inhibit autophagic flux.
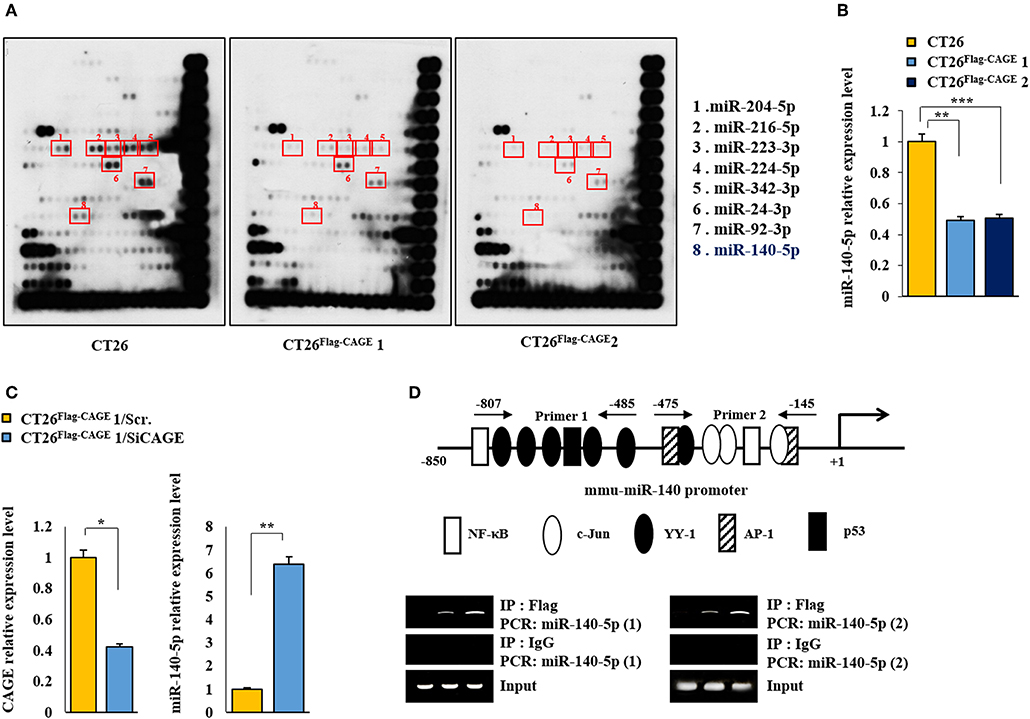
Figure 5. MiR-140-5p serves as a target of CAGE. (A) MicroRNA array analysis was performed as described. (B) QRT-PCR analysis of the indicated cancer cells was performed. **p < 0.005; ***p < 0.0005. (C) CT26 Flag−CAGE1 cells were transfected with the indicated siRNA (each at 10 nM). At 48 h after transfection, cells were subjected to qRT-PCR analysis. *p < 0.05; **p < 0.005. (D) Shows potential binding sites for various transcriptional factors in the promoter sequences of miR-140-5p (upper). ChIP assays employing the indicated antibody (2 μg/ml) was performed as described (lower panel).
MiR-140-5p Regulates Autophagic Flux
The miR-140-5p inhibitor increased autophagic flux while decreasing the expression of pmTORSer2448, an inhibitor of autophagy, in CT26 cells (Figure 6A). The miR-140-5p mimic exerted the opposite effects on autophagic flux and the interaction between CAGE and Beclin1 in CT26Flag−CAGE1 cells (Figure 6B). The miR-140-5p inhibitor increased LC3 puncta expression (Figure 6C) and enhanced the migration and invasion potential of the CT26 cells Figure 6D). The miR-140-5p mimic decreased the expression of LC3 puncta in CT26Flag−CAGE1 cells (Figure 6E). MiR-140-5p mimic decreased the migration and invasion potentials of the CT26Flag−CAGE1 cells (Figure 6F). Thus, miR-140-5p regulates autophagic fluxes.
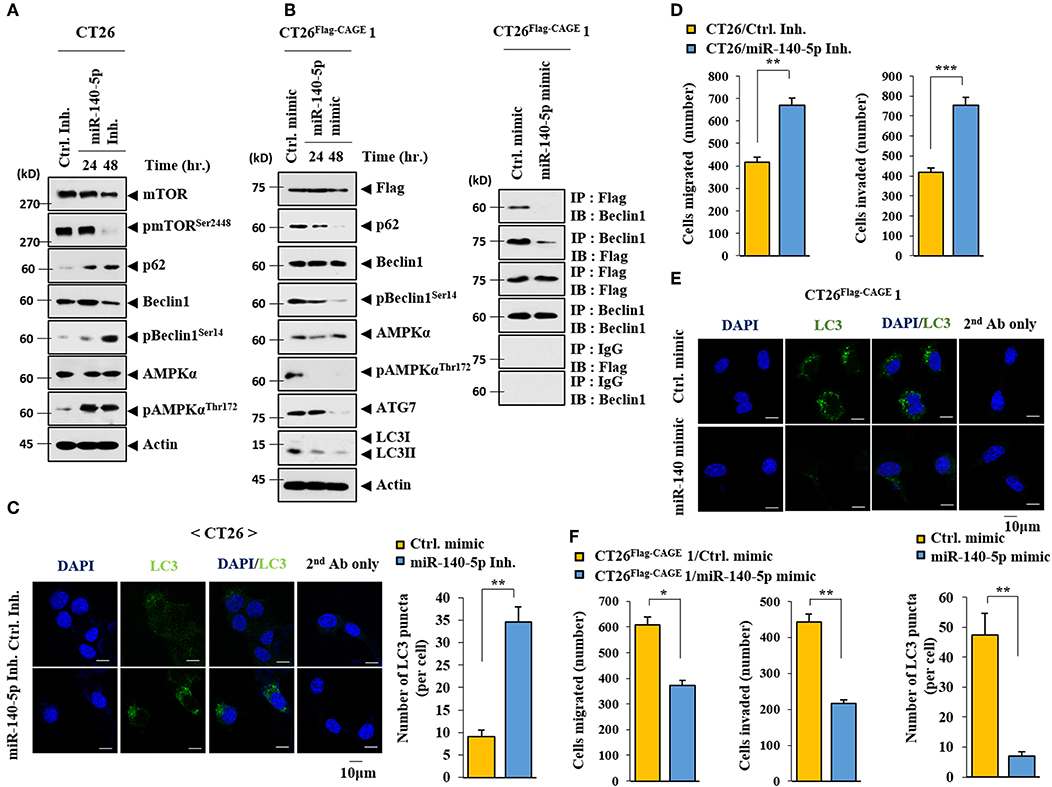
Figure 6. MiR-140-5p regulates autophagic flux. (A) CT26 cells were transfected with control inhibitor (10 nM) for 48 h or with miR-140-5p inhibitor (10 nM) for various time intervals. Immunoblot was performed. (B) The indicated cancer cells were transfected with control mimic (10 nM) for 48 h or with miR-140-5p mimic (10 nM) for various time intervals, followed by immunoblot (left). The indicated cancer cells were transfected with the indicated mimic (each at 10 nM) for 48 h, followed by immunoprecipitation. (C) CT26 cells were transfected with control inhibitor (10 nM) or with miR-140-5p inhibitor (10 nM) for 48 h. LC3 puncta expression was determined. **p < 0.005. (D) CT26 cells were transfected with the indicated inhibitor (each at 10 nM) for 48 h, followed by migration or invasion potential assay. **p < 0.005; ***p < 0.0005. (E) The indicated cancer cells were transfected with control mimic (10 nM) or with miR-140-5p mimic (10 nM) for 48 h intervals. LC3 puncta expression was determined. **p < 0.005. (F) Same as E except that CT26 cells were subjected to migration and invasion assays. *p < 0.05; ***p < 0.005.
MiR-140-5p Regulates the Tumorigenic Potential of CT26
The effect of the miR-140-5p inhibitor on the tumorigenic potential of the CT26 cells was examined. The miR-140-5p inhibitor enhanced the tumorigenic potential of the CT26 cells (Figure 7A). MiR-140-5p inhibitor increased autophagic flux while decreasing the expression of pmTORSer2448 in the CT26 cells (Figure 7B). The miR-140-5p mimic decreased the tumorigenic potential of the CT26Flag−CAGE1 cells (Figure 7C). QRT-PCR showed the expression of miR-140-5p in tumor tissue lysates (Figure 7C). The miR-140-5p mimic decreased autophagic flux and inhibited the interaction between CAGE and Beclin1 (Figure 7D). Thus, miR-140-5p regulates tumorigenic potential and autophagic flux.
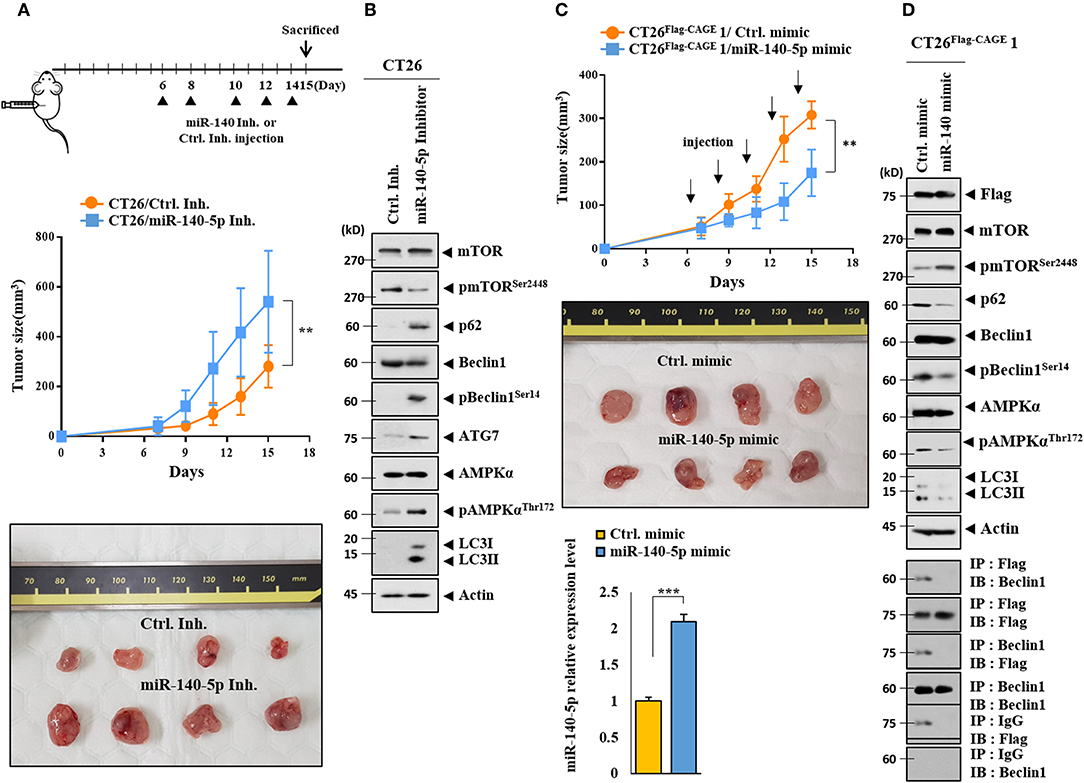
Figure 7. MiR-140-5p regulates the tumorigenic potential. (A) CT26 cells (1 × 10⁶) were injected into the dorsal flanks of BALB/C mice. Following the establishment of sizeable tumor, the indicated inhibitor (each at 100 nM) was injected at the indicated day. Each value represents an average obtained from BALB/C mice of each group. Data are expressed as a mean ± S.D. **p < 0.005. Each experimental group consisted of four BALB/C mice. (B) Tumor tissue lysates were subjected to immunoblot. (C) CT26 Flag−CAGE1 cells (1 × 10⁶) were injected into the dorsal flanks of BALB/C mice. Following the establishment of sizeable tumor, the indicated mimic (each at 100 nM) was intravenously injected five times in a total of 15 days. Tumor tissue lysates were subjected to qRT-PCR analysis (lower). **p < 0.005; ***p < 0.0005. Each experimental group consisted of four BALB/C mice. (D) Tumor tissue lysates were subjected to immunoblot (upper) and immunoprecipitation (lower).
MiR-140-5p Directly Targets Wnt1
TargetScan analysis predicted that Wnt1 would be a target of miR-140-5p (Figure 8A). It is reasonable that miR-140-5p may directly regulate Wnt1 expression level. Both the wild type and mutant 3′-UTR of Wnt1 showed luciferase activities in CT26Flag−CAGE1 cells (Figure 8B). The miR-140-5p mimic inhibited the luciferase activity associated with the Luc-3′-wild type UTR of wnt1, but not the luciferase activity associated with the Luc-3′-mutant UTR of Wnt1 (Figure 8B). Wnt 1 may act as a direct target of miR-140-5p to regulate autophagic flux. CAGE increases the expression of cyclinD1 in an AP1-dependent manner (4). Prodigiosin decreases the tumorigenic potential and expression of cyclin D1 in breast cancer cells by inhibiting the Wnt/β-catenin pathway (24). The CT26Flag−CAGE1 cells and CT26Flag−CAGE2 cells showed higher expression of Wnt1 mRNA than the CT26 cells (Figure 8C). CT26Flag−CAGE1 cells showed higher expressions of Wnt1, pGSK3βSer9 (an inactive form of GSK3β), and cyclinD1 than the CT26 cells (Figure 8D). Inhibition of Wnt1 prevents leptin-stimulated GSK3β phosphorylation (25). Down-regulation of CAGE led to the decreased expression of Wnt1, pGSK3βSer9, and cyclinD1 in the CT26Flag−CAGE1 cells (Figure 8E). CAGE also regulated the expression of Wnt1 at the transcription level (Figure 8F). The miR-140-5p inhibitor increased the expression of Wnt1, pGSK3βSer9, and cyclinD1 in the CT26 cells (Figure 8G) while the miR-140-5p mimic exerted the opposite effect on the expression of these proteins in the CT26Flag−CAGE1 cells (Figure 8H). The down-regulation of Wnt1 decreased autophagic flux, pGSK3βSer9, and cyclinD1 in the CT26Flag−CAGE1 cells (Figure 8I). Tumor tissue lysates of the CT26Flag−CAGE1 cells showed higher expression of Wnt1, β-catenin, pGSK3βSer9, and cyclin D1 than the tumor tissue lysates of the CT26 cells (Supplementary Figure 2A). The autophagic degradation of β-catenin by p62 led to a decreased self-renewal capacity of the colonospheres (26). Immunohistochemical staining showed the same results as the immunoblot (Supplementary Figure 2B). Thus, CAGE and miR-140-5p exerted opposite effects on the expression of Wnt1 to regulate autophagic flux.
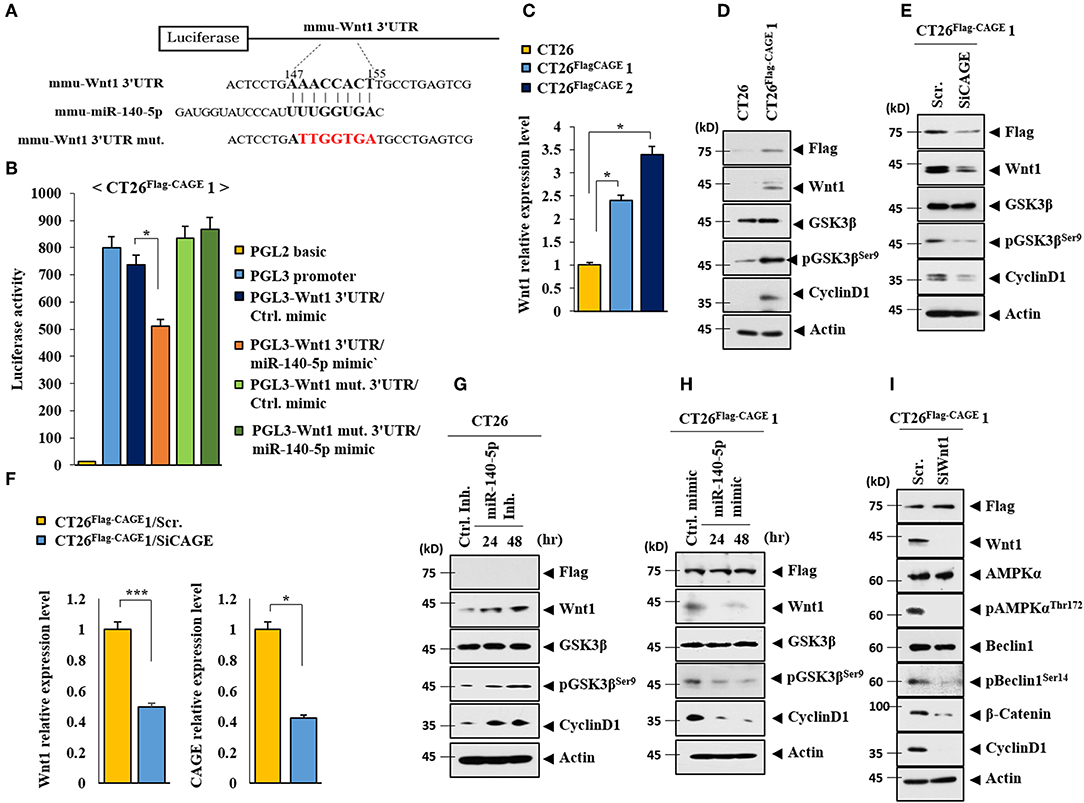
Figure 8. CAGE and miR-140-5p regulate the expression of wnt1. (A) Potential binding of miR-140-5p to 3′-UTR of wnt1. (B) Wild type Luc-p62-3′-UTR or mutant Luc-p62-3′-UTR was transfected along with control mimic or miR-135-5p mimic (each at 10 nM) into the indicated cell line. At 48 h after transfection, luciferase activity assays were performed. *p < 0.05. (C) Cell lysates from the indicated cancer cells were subjected to qRT-PCR analysis. *p < 0.05. (D) Cell lysates from the indicated cancer cells were subjected to immunoblot. (E) The indicated cancer cells were transfected with the indicated siRNA (each at 10 nM) for 48 h, followed by immunoblot. (F) Same as E except that qRT-PCR analysis was performed. *p < 0.05; ***p < 0.0005. (G) The indicated cancer cells were transfected with control inhibitor (10 nM) for 48 h or miR-140-5p inhibitor (10 nM) for various time intervals. (H) The indicated cancer cells were transfected with control mimic (10 nM) for 48 h or miR-140-5p mimic (10 nM) for various time intervals, followed by immunoblot. (I) The indicated cancer cells were transfected with the indicated siRNA (each at 10 nM) for 48 h, followed by immunoblot analysis.
CAGE May Mediate Cellular Interactions Within the Tumor Microenvironment
Cancer cells interact with various stromal cells, such as mast cells, within the tumor microenvironment (27). Thus, we examined whether CAGE would affect cellular interactions within the tumor microenvironment. Tumor tissue derived from CT26Flag−CAGE1 cells showed higher expression of CD163, tryptase, and chymase but lower expression of iNOS than the tumor tissue derived from the CT26 cells (Figure 9A). CD163 and iNOS are makers of TAM and M1 macrophages, respectively. Tryptase and chymase are hallmarks of allergic inflammation. Tumor tissue lysates of the CT26Flag−CAGE1 cells showed higher expression of autophagic flux, tryptase, chymase, and CD163 but lower expression of iNOS than CT26 tumor tissue lysates (Figure 9B). Tumor tissue lysates of the CT26Flag−CAGE1 cells showed the interaction of FcϵRIβ with HDAC3 and SOCS1 (Figure 9B). Tumor tissue lysates of the CT26Flag−CAGE1 cells showed more activated mast cells than the tumor tissue lysates of CT26 cells (Figure 9C). Thus, CAGE may mediate cellular interactions within the tumor microenvironment.
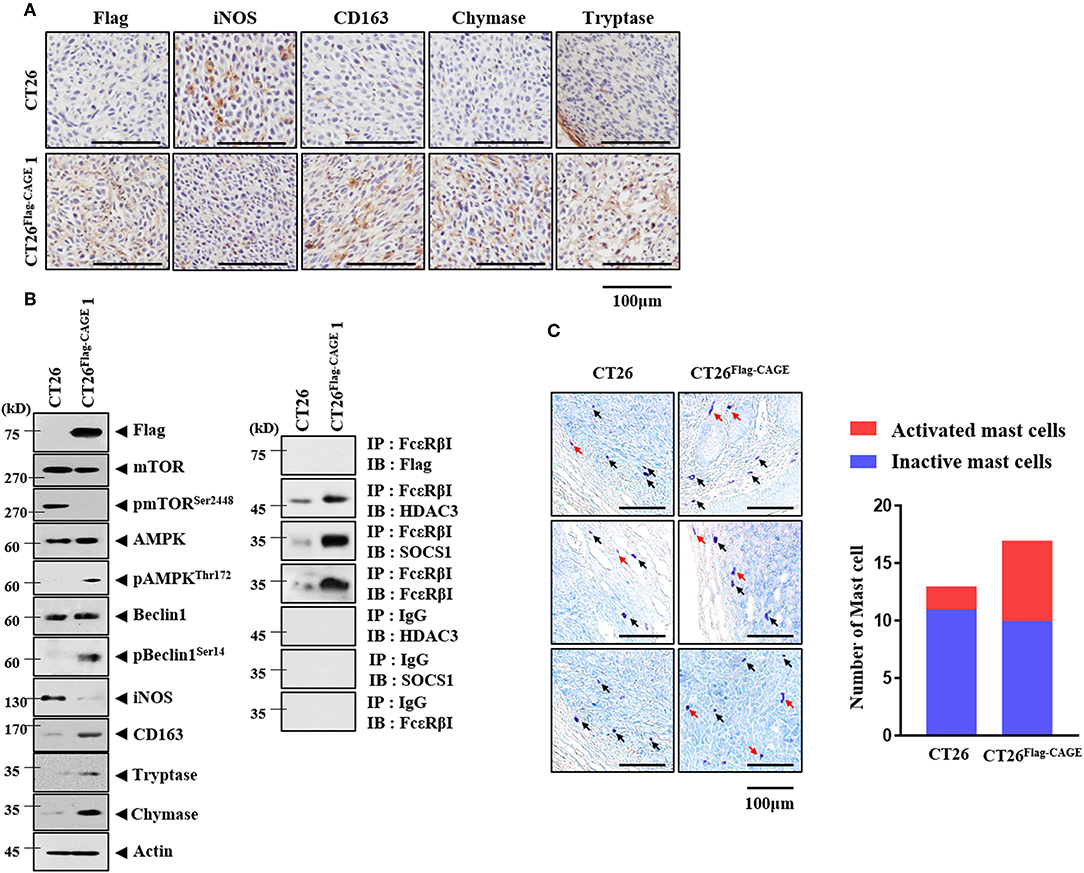
Figure 9. CAGE may promote activation of macrophages and mast cells. (A) Tumor tissues were subjected to immunohistochemical staining as described. (B) Tumor tissue lysates were subjected to immunoblot (left) and immunoprecipitation (right). (C) Tumor tissues were subjected to toluidine blue staining. Red arrows represent activated mast cells. Black arrows represent mast cells.
Exosomes Mediate Cellular Interactions
We examined whether CAGE would mediate cellular interactions. Culture medium from the CT26Flag−CAGE1 and CT26Flag−CAGE2 cells increased autophagic flux in the CT26 cells (Figure 10A). Culture medium from the CT26Flag−CAGE1 cells treated with GW4869, an inhibitor of exosomes formation, did not increase autophagic flux in the CT26 cells (Figure 10B). It is probable that exosomes from the CT26Flag−CAGE1 cells may have increased autophagic flux in the CT26 cells. Culture medium from the CT26Flag−CAGE1 cells increased LC3 puncta expression in the CT26 cells (Figure 10C). Immunofluorescence staining of the exosomes showed the co-localization of Wnt1 with TSG101, an exosomal marker (Supplementary Figure 3A). Wnt1 was detected in the lumen of the exosomes, whereas TSG101, a known membrane marker of exosomes, was detected in the outer membrane of the exosomes based on immunogold staining of Wnt1 (as shown by 10 nm golds located in the inner of the vesicles) and TSG101 (as shown by 25 nm golds located in the outer membrane of the vesicles) (Supplementary Figure 3B). Exosomes from the CT26Flag−CAGE1 cells enhanced the migration and invasion potential of the CT26 cells (Figure 10D). Immunofluorescence staining showed that the PKH67-labeled exososmes from CT26Flag−CAGE1 cells could be transferred to the CT26 cells (Figure 10E). Immunoblot showed the expression of Wnt1 within exosomes from the CT26Flag−CAGE1 cells (Figure 10F). Exosomes from the CT26Flag−CAGE1 cells also showed the presence of CXCL10 and IL-27 (Figure 10F). Rapamycin, an inducer of autophagy, enhanced the cytotoxic effect of NK cells by increasing the expression of IL-27 in uterine endometrial cancer cells (28). Exosomes from the CT26Flag−CAGE1 cells also increased autophagic flux in lung mast cells (Figure 10G). It is probable that the exosomes mediate the effects of CAGE on autophagic flux and cellular interactions. These results suggest that Wnt1 may mediate cellular interactions within the tumor microenvironment.
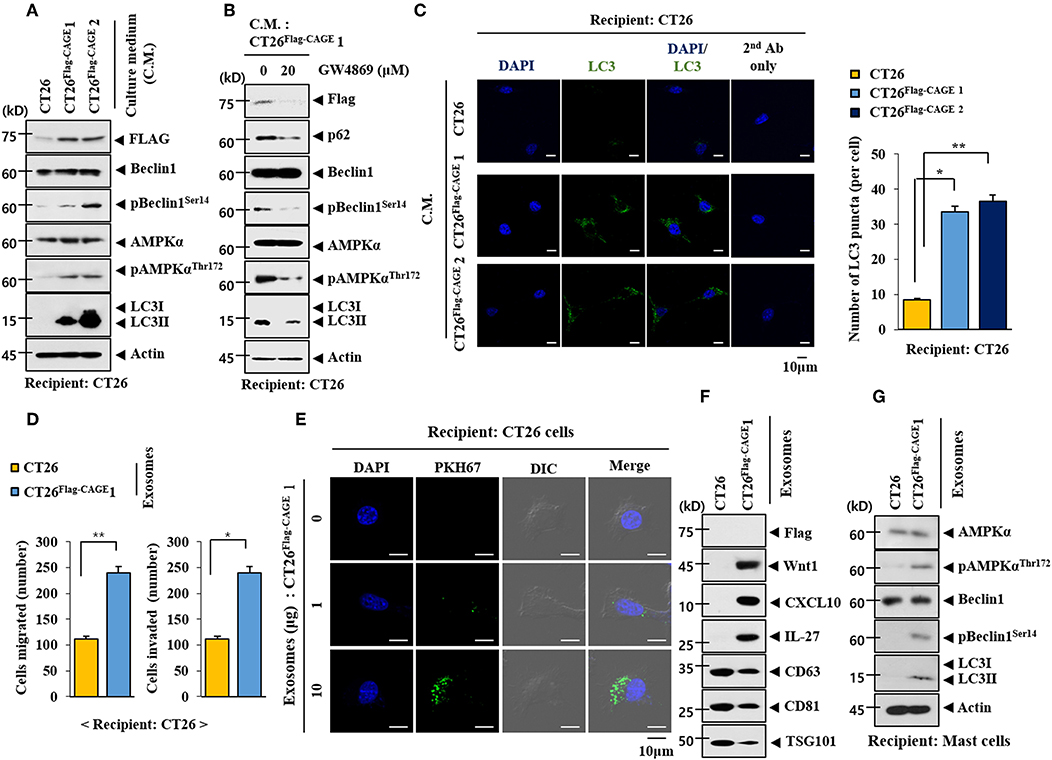
Figure 10. Exosomes of CT26Flag−CAGE1 cells increase autophagic flux. (A) Culture medium of the indicated cancer cells was added to CT26 cells for 24 h, followed by immunoblot. (B) CT26Flag−CAGE1 cells were treated without or with GW4869 (10 μM) for 24 h. Culture medium was then added to CT26 cells for 24 h, followed by immunoblot. (C) Same as A except that LC3 puncta expression was determined. *p < 0.05; **p < 0.005. (D) Exosomes (10 μg) from the indicated cancer cells were added to CT26 cells for 24 h, followed by invasion and migration potential assays. *p < 0.05; **p < 0.005. (E) Exosomes (10 μg) from CT26Flag−CAGE1 cells were labeled with PKH67 and added to CT26 for 24 h. Cells were visualized under a confocal laser scanning microscope. (F) Exosomes (10 μg) from the indicated cancer cells were subjected to immunoblot. (G) Exosomes (10 μg) from the indicated cancer cells were added to lung mast cells for 24 h, followed by immunoblot.
Exosomes From CT26Flag-CAGE Cells Activate Macrophages
Exosomes form the CT26Flag−CAGE1 cells increased the expression of CD163, but decreased the expression of iNOS in lung macrophages (Figure 11A). Exosomes from the CT26FlagG−CAGE 1 cells also increased the expression of autophagic flux in macrophages (Figure 11A). Immunofluorescence staining showed that exosomes from the CT26Flag−CAGE1 cells increased the expression of CD163 (Figure 11B) and LC3 (Figure 11C) and decreased the expression of iNOS (Figure 11B). PKH67-labedled exosomes from the CT26Flag−CAGE1 cells were transferred to the lung macrophages (Figure 11D). Thus, exosomes mediated the activation of macrophages by CT26Flag−CAGE1 cells.
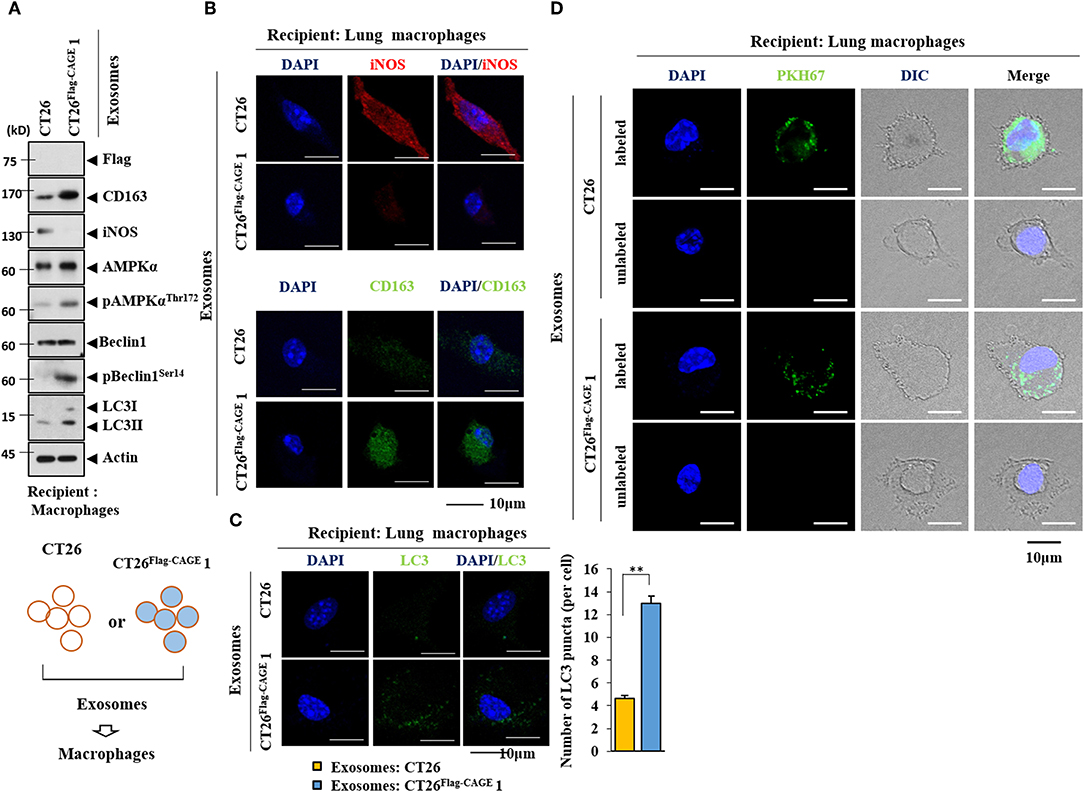
Figure 11. Exosomes mediate the effect of CAGE on the activation of macrophages. (A) Exosomes (10 μg) from the indicated cancer cells were added to lung macrophages for 24 h, followed by immunoblot. (B,C) Same as A except that immunofluorescence staining employing the indicated antibodies (2 μg/ml) was performed. **p < 0.005. (D) Exosomes (10 μg) from the indicated cancer cells were labeled with PKH67 and added to lung macrophages for 24 h. Cells were visualized under a confocal laser scanning microscope.
Exosomes From CT26Flag-CAGE Cells Enhance the Tumorigenic Potential of CT26 Cells
Exosomes from the CT26Flag−CAGE1 cells enhanced the tumorigenic potential of CT26 cells (Figure 12A), but those of the CT26 cells did not affect the tumorigenic potential of CT26. Tumor tissue lysates of CT26 cells that received exosomes from the CT26Flag−CAGE1 cells displayed higher expressions of Wnt1, β-catenin, cycinD1, pGSK3βSer9, and autophagic flux than tumor tissue lysates from the CT26 cells that received CT26 exosomes (Figure 12B). Tumor tissue lysates from CT26 cells that received exosomes from the CT26Flag−CAGE1 cells displayed increased FcεRIβ expression, and interactions of FcεRIβ with SOCS1 and Lyn (Figure 12B) compared to the tumor tissue lysates of CT26 cells that received CT26 exosomes. Immunohistochemical staining confirmed the immunoblot results (Supplementary Figure 4). The CT26 tumor that received exosomes from the CT26Flag−CAGE1 cells showed more activated mast cells than the CT26 tumor tissue that received CT26 exosomes (Supplementary Figure 4). Matrigel plug assays employing culture medium showed that Wnt1 was necessary for the angiogenic potential of the CT26Flag−CAGE1 cells (Supplementary Figure 5). MiR-140-5p negatively regulated the angiogenic potential of CT26Flag−CAGE1 cells (Supplementary Figure 5). This suggests that the culture medium of CT26Flag−CAGE1 cells may promote the tumorigenic potential of CT26 cells. Thus, the exosomes from the CT26Flag−CAGE1 cells enhanced the tumorigenic potential of the CT26 cells by increasing autophagic flux and promoting cellular interactions.
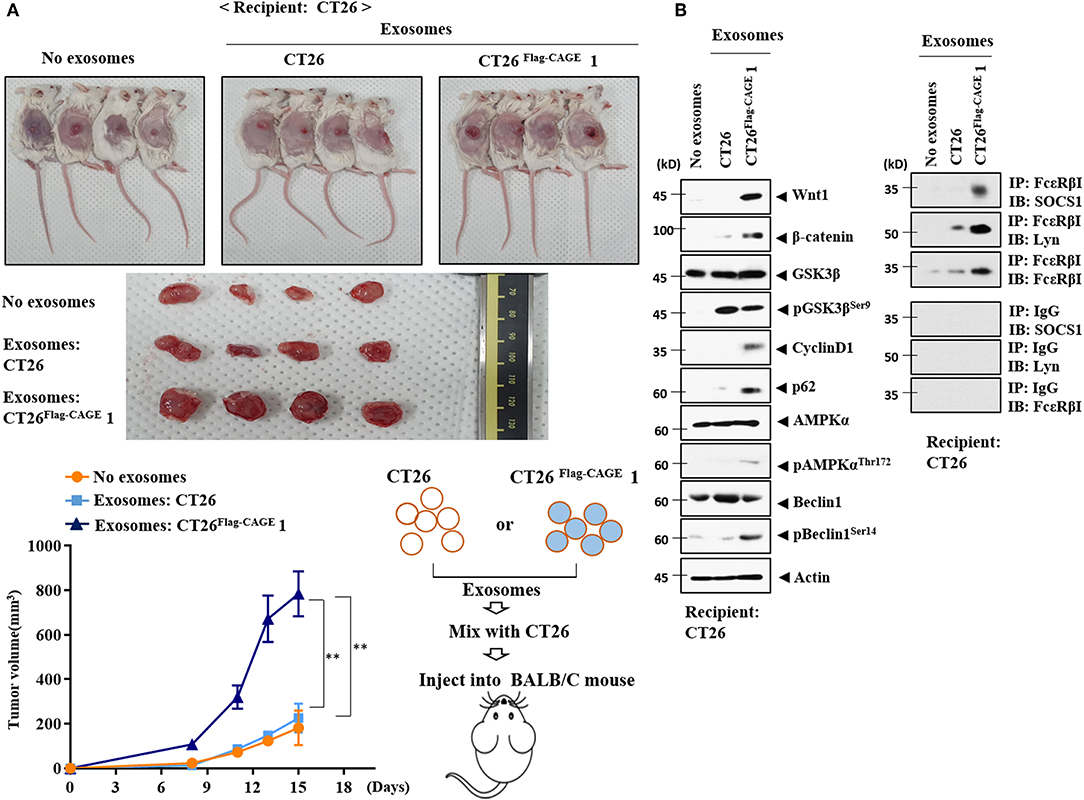
Figure 12. Exosomes of CT26Flag−CAGE1 cells enhance the tumorigenic potential of CT26 cells. (A) CT26 cells (1 × 10⁶) mixed without or with the exosomes (10 μg) of the indicated cancer cells were injected into the dorsal flanks of BALB/C mice. Each value represents an average obtained from BALB/C mice of each group. Data are expressed as a mean ± S.D. Tumor volumes were measured as described. Each experimental group consisted of four BALB/C mice. (B) Lysates from the indicated tumor tissues were subjected to immunoblot and immunoprecipitation.
MiR-140-5p-Wnt 1 Regulates Cellular Interactions
Wnt1 was necessary for the increased autophagic flux, Wnt1, β-catenin, and cyclin D1 in CT26 cells induced by the culture medium from CT26Flag−CAGE1 cells (Figure 13A). Wnt1 was necessary for the increased autophagic flux and CD163 in lung macrophages activated by the culture medium from the CT26Flag−CAGE1 cells (Figure 13A). Down-regulation of Wnt1 exerted a negative effect on the increased autophagic flux, and SOCS1, and COX2 in lung mast cell activated by the culture medium from the CT26Flag−CAGE1 cells (Figure 13A). MiR-140-5p prevented the CT26Flag−CAGE1 cell culture medium from increasing autophagic flux in the CT26 cells (Figure 13B). The overexpression of miR-140-5p prevented culture medium from the CT26Flag−CAGE1 cells from increasing autophagic flux and CD163 in lung macrophages (Figure 13B). MiR-140-5p exerted negative effects on the increased autophagic flux and hallmarks of allergic inflammation in lung mast cells activated by CT26Flag−CAGE1 cell culture medium (Figure 13B). Immunofluorescence staining showed that Wnt1 was necessary for the effects of CT26Flag−CAGE1 cell culture medium on the expression of CD163, LC3, and iNOS in macrophages (Supplementary Figure 6A). MiR-140-5p mimic or Wnt1 siRNA prevented the CT26Flag−CAGE1 cell culture medium from regulating the expression of CD163, LC3, and iNOS in lung macrophages (Supplementary Figure 6B). Thus, the miR-140-5p-Wnt1 axis regulates cellular interactions.
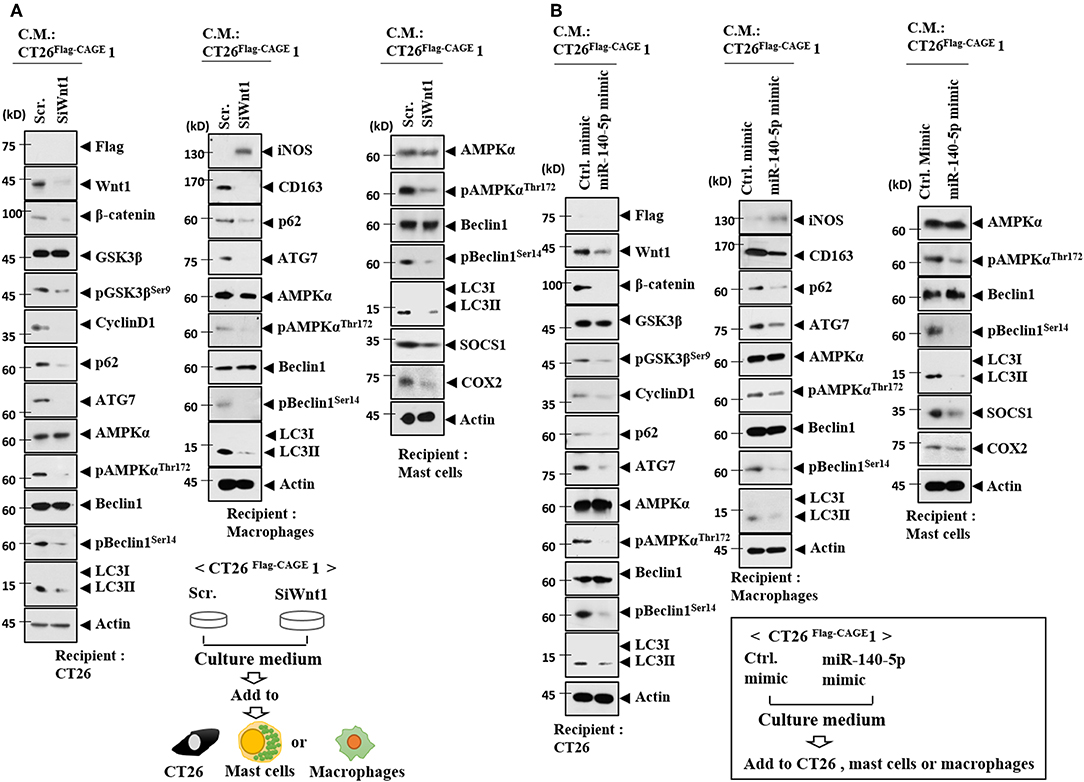
Figure 13. MiR-140-5p and wnt1 regulate cellular interactions. (A) The indicated cancer cells were transfected with the indicated siRNA (each at 10 nM) for 48 h. Culture medium was added to CT26 cells, mast cells or lung macrophages for 24 h, followed by immunoblot. (B) The indicated cancer cells were transfected with the indicated mimic (each at 10 nM) for 48 h. Culture medium was added to CT26 cells or lung macrophages for 24 h, followed by immunoblot.
Wnt1 Mediates Cellular Interactions
Because Wnt1 was present within the exosomes from the CT26Flag−CAGE1 cells (Figure 10D), the direct effects of Wnt1 on cellular interactions were investigated. Recombinant Wnt1 protein (rWnt1) increased autophagic flux, Wnt1, β-catenin, and cyclin D1 in CT26 cells (Figure 14A). Culture medium from CT26 cells treated with rWnt1 increased autophagic flux and CD163, but decreased iNOS expression in macrophages (Figure 14B). Culture medium from CT26 cells treated with rWnt1 increased autophagic flux, SOCS1, and COX2 in lung mast cells (Figure 14B). Recombinant Wnt1 protein increased autophagic flux and CD163, but decreased the expression of iNOS in macrophages (Figure 14C). Culture medium from macrophages treated with rWnt1 increased autophagic flux, Wnt1, β-catenin, and cyclin D1 in CT26 cells (Figure 14D). Culture medium of macrophages treated with rWnt1 increased autophagic flux, SOCS1, and COX2 in mast cells (Figure 14D). Immunofluorescence staining showed that culture medium from CT26 cells treated with rWnt1 protein increased the expression of CD163 and LC3, but decreased the expression of iNOS in macrophages (Supplementary Figure 7A). Recombinant Wnt1 protein increased the expression of CD163 and LC3, but decreased the expression of iNOS in macrophages (Supplementary Figure 7B). This suggests that Wnt1 may directly mediate cellular interactions.
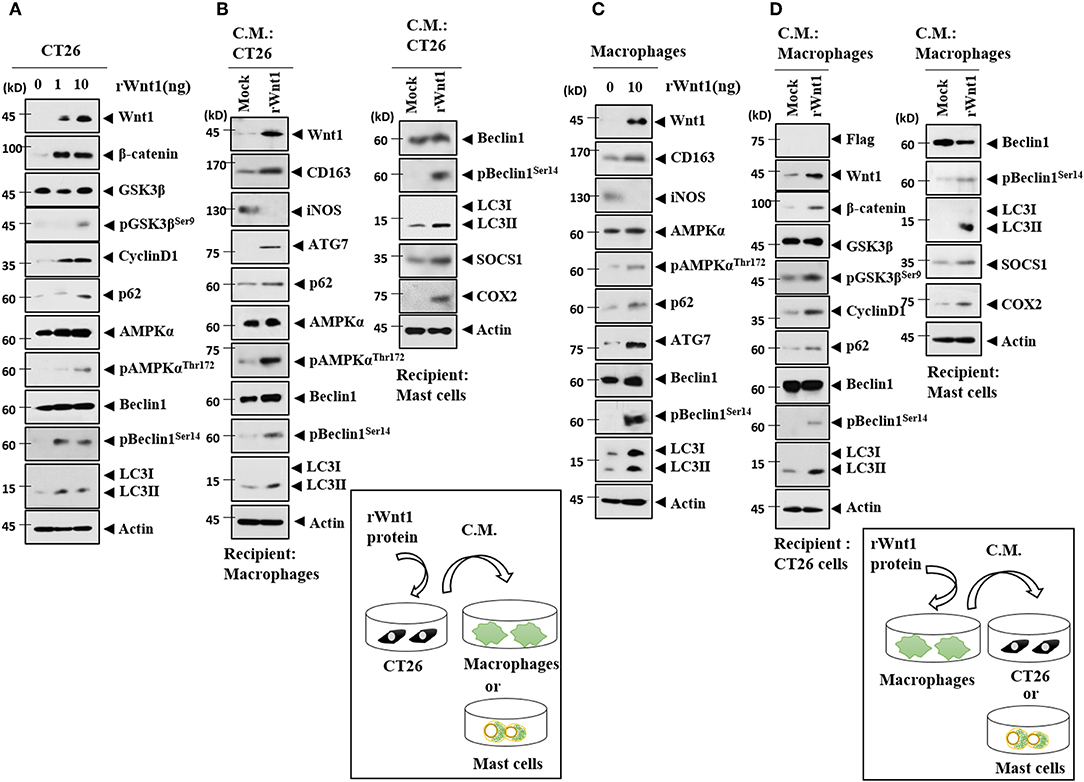
Figure 14. Wnt1 mediates cellular interactions. (A) Recombinant wnt1 protein at the indicated concentration was added to CT26 cells for 24 h, followed by immunoblot. (B) CT26 cells were treated with recombinant wnt1 protein (10 ng/ml) for 24 h. Culture medium was then added to lung macrophages or lung mast cells for 24 h, followed by immunoblot. (C) Recombinant wnt1 protein (10 ng/ml) was added to macrophages for 24 h, followed by immunoblot. (D) Macrophages were treated with recombinant wnt1 protein (10 ng/ml) for 24 h. Culture medium was then added to CT26 cells for 24 h, followed by immunoblot.
In summary, we have shown that the CAGE-miR-140-5p-Wnt1 axis regulates autophagic flux, CSC-like properties, and tumorigenic potential. By employing culture medium, we demonstrated interactions between CT26Flag−CAGE cells, mast cells, and macrophages. We also show that exosomes containing Wnt1 mediated these cellular interactions.
Discussion
EGFR signaling is necessary for the initiation and progression of the autophagic process (29). The decreased expression of HER2 by the downregualtion of Beclin1 confers sensitivity to anti-cancer drugs such as tamoxifen (30). CAGE interacts with EGFR and HER2 in human melanoma cells (31). We, therefore, hypothesized that CAGE would regulate autophagic flux. We found that the overexpression of CAGE in CT26 cells increased autophagic flux and induced an interaction between CAGE and Beclin1. The overexpression of CAGE in CT26 cells also enhanced the formation of autophagosomes. These results suggest the role of CAGE in autophagy. The identification of the CAGE domain necessary for Beclin1 interaction will provide valuable information for the development of CAGE-targeting anti-cancer drugs.
The phosphorylation of ULK1 by AMPK, a mediator of autophagy, is essential for self-renewal and pluripotency in embryonal stem cells (32). Autophagy-related gene 7 (ATG7) induces the binding of β-catenin to the promoter sequences of OCT4 to increase the expression of OCT4, which promotes self-renewal, tumor initiation, and drug resistance (9). Inhibition of NANOG decreases autophagy in tumor cells (9). We showed that the inhibition of autophagy negatively regulated CSC-like properties. CAGE increased the expression of markers of cancer stemness, such as, SOX2, and showed an interaction with SOX2 (33). Identification of the CAGE domain necessary for SOX2 interaction is necessary to better understand CAGE-prompted CSC-like properties. HDAC6 regulates the expression of pluripotency factors, such as POU5F1, NANOG, and SOX2, and is necessary for the pluripotency of CSCs (34). P62 binds to HDAC6 and regulates the deacetylase activity of HDAC6 (35). Thus, it is reasonable that HDAC6 may mediate the effects of CAGE on autophagic flux and tumorigenesis.
MicroRNA array analysis revealed that CAGE decreased the expression of miR-140-5p. MiR-140-5p/miR-140-3p-null mouse shows an increased number of Leydig cells in the developing XY gonad (36). This suggests a regulatory role for miR-140-5p/miR-140-3p in testis differentiation. CAGE, like other cancer/testis antigens, is assumed to be involved in testis development. ChIP assays revealed the direct regulation of miR-140-5p by CAGE. Vitamin D receptor increases the expression of miR-140-5p, which in turn inhibits MAPK signaling in osteoblasts (37). It is reasonable that CAGE may affect MAPK signaling in CT26.
MiR-140 regulates the parathyroid hormone (PTH)-related peptide (PTHrP)-HDAC4 pathway to control chondrocyte differentiation (38). HDAC4 is necessary for autophagy and vascular inflammation through its effect on FoxO3a (39). HDAC4 promotes autophagy and anti-apoptosis and confers resistance to cisplatin (13). Therefore, it would be interesting to examine the effect of CAGE on the expression of HDAC4.
We showed the binding of miR-140-5p to the 3′UTR of Wnt1. SOX2 regulates the expression of Wnt1 in lung cancer cells (40). Wnt1 promotes mammary tumorigenesis (41) and CSC activity by increasing mitochondrial mass (42). Downregualtion of Wnt1 inhibits the growth of hepatic cancer cells by inducing cellular apoptosis (43). Luciferase activity assays showed the direct regulation of Wnt1by miR-140-5p. We showed that CAGE increased the expression of Wnt1 in CT26 cells and the downregulation of Wnt1 led to decreased autophagic flux in CT26Flag−CAGE1 cells. Wnt1-inducible signaling pathway protein-3 (WISP-3, also termed CCN6) regulates cell proliferation, differentiation, and migration (44). It is probable that CAGE may regulate the expression of WISP-3.
MiRNA array analysis revealed that CAGE decreased the expression of miR-24-3p. MiR-24-3p was predicted to be a negative regulator of TCF7. TCF7 activates the WNT/β-catenin signaling pathway (45). MiR-24-3p and miR-92-3p, decreased by CAGE, were predicted to target WNT8B. It would be interesting to examine the effects of these miRNAs on autophagic flux in CT26Flag−CAGE cells. MiR-342-3p, decreased by CAGE, was predicted to target RICTOR. RICTOR promotes autophagy and tumor angiogenesis (46). MiR-216-5p, decreased by CAGE, was predicted to target ATG12. The knockdown of ATG12 impairs the effects of miR-1265 inhibition on gastric cancer progression and oncogenic autophagy (47).
Tumor-stromal interaction is critical for the progression of cancers (27). The conditioned medium of human mast cells increased anti-cancer drug-resistance by reducing apoptosis in human pancreatic ductal adenocarcinoma cells (27). Pancreatic cancer cells have been shown to induce mast cell migration and the culture medium of mast cells enhanced cancer cell invasion and proliferation (48). Mast cells were reported to accumulate in colorectal cancer tissues and their density was correlated with cancer progression. The interaction between mast cells and human colon cancer cells is mediated by CCL15 or SCF (14). Mast cells promote colon cancer cell growth by inducing the production of multiple cytokines from cancer cells (14). The tumor tissue lysates of CT26Flag−CAGE1 cells revealed the activation of mast cells based on the induction of interactions of FcεRIβ with HDAC3 and SOCS1.
The tumor tissue lysates of CT26Flag−CAGE1 cells revealed the activated macrophages based on the higher expression of CD163 than in CT26 tumor lysates. This suggests interactions between CT26Flag−CAGE1 cells and macrophages. Tumor-infiltrating macrophages promote glioma cell survival and stimulate angiogenesis by secreted phospho protein 1 (SPP1) (49). Alternatively activated macrophages (AAM)-derived factors utilize a JAK/STAT signaling pathway to induce ovarian cancer metastasis (50). IL-32γ has been known to mediate the effect of multiple myeloma cells on enhancing immunosuppressive function of macrophages (51). These reports suggest cancer cell-macrophage interactions lead to tumor growth.
The inhibition of phosphoinositide kinase PIKfyve increases the secretion of exosomes containing autophagy-related proteins and induces autophagy (52). Exosomes from the gefitinib-treated PC9 cells (Exo-GF) increase autophagic activity and confer resistance to cisplatin (53). Exosomes from pigment epithelium-derived factor (PEDF)-modified adipocyte-derived stem cells (ADSCs) attenuate cerebral injury by activating autophagy and modulating apoptosis (9). Thus, exosomes mediate cellular interactions by regulating autophagy.
Exosomes from AsPC-1, an ascites-derived human pancreatic ductal carcinoma (PDAC) cell line, increase the levels of M2 macrophages markers, such as CD163 (54). Macrophages treated with AsPC-1 exosomes increased the secretion of pro-tumoral, bioactive molecules including VEGF, MCP-1, IL-6, and MMP-9 (54). Exosomes from human mast cells activate KIT-SCF signal transduction and accelerate the proliferation of human lung adenocarcinoma cells (55). Exosomes from miR181-5p-adipose-derived stem cells (ADSCs) activate autophagy by decreasing the expression of Stat3 and Bcl-2 in mouse hepatic stellate (HST-T6) cells (56). These reports suggest that exosomes may mediate cellular interactions. We found that exosomes from CT26Flag−CAGE1 cells increased autophagic flux in mast cells and macrophages. Identification of exosomal cytokines and miRNAs that mediate these cellular interactions will facilitates the understanding of tumor-stroma interactions within the tumor microenvironment.
M2 macrophages, but not M1 macrophages, activate the Wnt signaling pathway in epithelial cells (57). IL-10 derived from macrophages activates cAMP response element-binding protein (CREB) and induces the secretion of the pro-repair WNT1-inducible signaling protein 1 (WISP-1) (58). These reports suggest that Wnt1 may mediate cellular interactions. We showed the presence of Wnt1 protein in the exosomes of CT26Flag−CAGE1 cells. Culture medium from CT26 cells treated with recombinant Wnt1 protein increased the expression of CD163 in lung macrophages. We showed that recombinant Wnt1 protein increased the expression of CD163 in lung macrophages. Culture medium of macrophages treated with recombinant wnt1 protein increased the expression of autophagic flux in CT26 cells. It is, therefore, probable that Wnt1 mediates cellular interactions within the tumor microenvironment. Exosomal Wnt1 protein enhances the proliferation and migration of colorectal cancer by activating non-canonicial Wnt signaling (59). Identification of cytokines and miRNAs that are regulated by exosomes is necessary for understanding of exosomal-mediated cellular interactions.
CAGE acts as an upstream direct regulator of miR-140-5p and enhances autophagic flux and tumorigenic potential. MiR-140-5p negatively regulates the expression of Wnt1, autophagic flux and tumorigenic potential. Tumor tissue derived from CAGE-expressing cancer cells shows the activation of mast cells and macrophages. We presented evidence that CAGE mediated interactions between cancer cells, mast cells, and macrophages. Wnt1 is present within the exosomes of CAGE-expressing cancer cells and we show that exosomes and Wnt1 mediate these cellular interactions. Our results suggest CAGE as a target for the development of anti-cancer drugs.
Data Availability Statement
All datasets generated for this study are included in the article/Supplementary Material.
Ethics Statement
The animal study was reviewed and approved by Institutional Animal Care and Use Committee (IACUC) of Kangwon National University (KIACUC-160329-2).
Author Contributions
DJ, YK, and HJ designed the study and provided conceptual guidance. MY and SL performed functional assays concerning CAGE-miR-140-5p-wnt1 axis. J-EL performed experiments concerning immune EM and observations of autophagosomes. DJ wrote the manuscript.
Funding
This work was supported by National Research Foundation Grants (2017R1A2A2A05001029, 2017M3A9G7072417, 2018R1D1A1B07043498), a grant from the BK21 plus Program. This work was also supported by Korea Foundation for Cancer Research (KFCR-2018-002).
Conflict of Interest
The authors declare that the research was conducted in the absence of any commercial or financial relationships that could be construed as a potential conflict of interest.
Supplementary Material
The Supplementary Material for this article can be found online at: https://www.frontiersin.org/articles/10.3389/fonc.2019.01240/full#supplementary-material
References
1. Cho B, Lim Y, Lee DY, Park SY, Lee H, Kim WH, et al. Identification and characterization of a novel cancer/testis antigen gene CAGE. Biochem Biophys Res Commun. (2002) 292:715–26. doi: 10.1006/bbrc.2002.6701
2. Cho B, Lee H, Jeong S, Bang YJ, Lee HJ, Hwang KS, et al. Promoter hypomethylation of a novel cancer/testis antigen gene CAGE is correlated with its aberrant expression and is seen in premalignant stage of gastric carcinoma. Biochem Biophys Res Commun. (2003) 307:52–63. doi: 10.1016/S0006-291X(03)01121-5
3. Iwata T, Fujita T, Hirao N, Matsuzaki Y, Okada T, Mochimaru H, et al. Frequent immune responses to a cancer/testis antigen, CAGE, in patients with microsatellite instability-positive endometrial cancer. Clin Cancer Res. (2005) 11:3949–57. doi: 10.1158/1078-0432.CCR-04-1702
4. Por E, Byun HJ, Lee EJ, Lim JH, Jung SY, Park I, et al. The cancer/testis antigen CAGE with oncogenic potential stimulates cell proliferation by up-regulating cyclins D1 and E in an AP-1- and E2F-dependent manner. J Biol Chem. (2010) 285:14475–85. doi: 10.1074/jbc.M109.084400
5. Kim Y, Park D, Kim H, Choi M, Lee H, Lee YS, et al. miR-200b and cancer/testis antigen CAGE form a feedback loop to regulate the invasion and tumorigenic and angiogenic responses of a cancer cell line to microtubule-targeting drugs. J Biol Chem. (2013) 288:36502–18. doi: 10.1074/jbc.M113.502047
6. Park D, Park H, Kim Y, Kim H, Jeoung D. HDAC3 acts as a negative regulator of angiogenesis. BMB Rep. (2014) 47:227–32. doi: 10.5483/BMBRep.2014.47.4.128
7. Kim Y, Park H, Park D, Lee YS, Choe J, Hahn JH, et al. Cancer/testis antigen CAGE exerts negative regulation on p53 expression through HDAC2 and confers resistance to anti-cancer drugs. J Biol Chem. (2010) 285:25957–68. doi: 10.1074/jbc.M109.095950
8. Chen HP, Lee YK, Huang SY, Shi PC, Hsu PC, Chang CF. Phthalate exposure promotes chemotherapeutic drug resistance in colon cancer cells. Oncotarget. (2018) 9:13167–80. doi: 10.18632/oncotarget.23481
9. Huang X, Ding J, Li Y, Liu W, Ji J, Wang H, et al. Exosomes derived from PEDF modified adipose-derived mesenchymal stem cells ameliorate cerebral ischemia-reperfusion injury by regulation of autophagy and apoptosis. Exp Cell Res. (2018) 371:269–77. doi: 10.1016/j.yexcr.2018.08.021
10. Yang Y, Yu L, Li J, Yuan YH, Wang XL, Yan SR, et al. Autophagy regulates the stemness of cervical cancer stem cells. Biologics. (2017) 11:71–9. doi: 10.2147/BTT.S134920
11. Klose J, Stankov MV, Kleine M, Ramackers W, Panayotova-Dimitrova D, Jager MD, et al. Inhibition of autophagic flux by salinomycin results in anti-cancer effect in hepatocellular carcinoma cells. PLoS ONE. 9:e95970. doi: 10.1371/journal.pone.0095970
12. Du J, Liu S, He J, Liu X, Qu Y, Yan W, et al. MicroRNA-451 regulates stemness of side population cells via PI3K/Akt/mTOR signaling pathway in multiple myeloma. Oncotarget. (2015) 6:14993–5007. doi: 10.18632/oncotarget.3802
13. Zhang X, Qi Z, Yin H, Yang G. Interaction between p53 and Ras signaling controls cisplatin resistance via HDAC4- and HIF-1alpha-mediated regulation of apoptosis and autophagy. Theranostics. (2019) 9:1096–114. doi: 10.7150/thno.29673
14. Yu Y, Blokhuis B, Derks Y, Kumari S, Garssen J, Redegeld F. Human mast cells promote colon cancer growth via bidirectional crosstalk: studies in 2D and 3D coculture models. Oncoimmunology. (2018) 7:e1504729. doi: 10.1080/2162402X.2018.1504729
15. Attarha S, Roy A, Westermark B, Tchougounova E. Mast cells modulate proliferation, migration and stemness of glioma cells through downregulation of GSK3beta expression and inhibition of STAT3 activation. Cell Signal. (2017) 37:81–92. doi: 10.1016/j.cellsig.2017.06.004
16. Walker ND, Elias M, Guiro K, Bhatia R, Greco SJ, Bryan M, et al. Exosomes from differentially activated macrophages influence dormancy or resurgence of breast cancer cells within bone marrow stroma. Cell Death Dis. 10:59. doi: 10.1038/s41419-019-1304-z
17. Noh K, Kim M, Kim Y, Kim H, Kim H, Byun J, et al. miR-122-SOCS1-JAK2 axis regulates allergic inflammation and allergic inflammation-promoted cellular interactions. Oncotarget. (2017) 8:63155–76. doi: 10.18632/oncotarget.19149
18. Yeon M, Byun J, Kim H, Kim M, Jung HS, Jeon D, et al. CAGE binds to Beclin1, regulates autophagic flux and CAGE-derived peptide confers sensitivity to anti-cancer drugs in non-small cell lung cancer cells. Front Oncol. (2018) 8:599. doi: 10.3389/fonc.2018.00599
19. Kim M, Park Y, Kwon Y, Kim Y, Byun J, Jeong MS, et al. MiR-135–5p-p62 axis regulates autophagic flux, tumorigenic potential, and cellular interactions mediated by extracellular vesicles during allergic inflammation. Front Immunol. (2019) 10:738. doi: 10.3389/fimmu.2019.00738
20. Kim Y, Kim H, Park H, Park D, Lee H, Lee YS, et al. miR-326-histone deacetylase-3 feedback loop regulates the invasion and tumorigenic and angiogenic response to anti-cancer drugs. J Biol Chem. (2014) 289:28019–39. doi: 10.1074/jbc.M114.578229
21. Tan Q, Joshua AM, Wang M, Bristow RG, Wouters BG, Allen CJ, et al. Up-regulation of autophagy is a mechanism of resistance to chemotherapy and can be inhibited by pantoprazole to increase drug sensitivity. Cancer Chemother Pharmacol. (2017) 79:959–69. doi: 10.1007/s00280-017-3298-5
22. Andrique C, Morardet L, Linares LK, Cisse MY, Merle C, Chibon F, et al. Calpain-6 controls the fate of sarcoma stem cells by promoting autophagy and preventing senescence. JCI Insight. (2018) 3:e121225. doi: 10.1172/jci.insight.121225
23. Chien CS, Wang ML, Chu PY, Chang YL, Liu WH, Yu CC, et al. Lin28B/Let-7 regulates expression of Oct4 and Sox2 and reprograms oral squamous cell carcinoma cells to a stem-like state. Cancer Res. (2015) 75:2553–65. doi: 10.1158/0008-5472.CAN-14-2215
24. Wang Z, Li B, Zhou L, Yu S, Su Z, Song J, et al. Prodigiosin inhibits Wnt/beta-catenin signaling and exerts anticancer activity in breast cancer cells. Proc Natl Acad Sci USA. (2016) 113:13150–5. doi: 10.1073/pnas.1616336113
25. Yan D, Avtanski D, Saxena NK, Sharma D. Leptin-induced epithelial-mesenchymal transition in breast cancer cells requires beta-catenin activation via Akt/GSK3- and MTA1/Wnt1 protein-dependent pathways. J Biol Chem. (2012) 287:8598–612. doi: 10.1074/jbc.M111.322800
26. Panda PK, Naik PP, Praharaj PP, Meher BR, Gupta PK, Verma RS, et al. Abrus agglutinin stimulates BMP-2-dependent differentiation through autophagic degradation of beta-catenin in colon cancer stem cells. Mol Carcinog. (2018) 57:664–77. doi: 10.1002/mc.22791
27. Porcelli L, Iacobazzi RM, Di Fonte R, Serrati S, Intini A, Solimando AG, et al. CAFs and TGF-beta signaling activation by mast cells contribute to resistance to gemcitabine/nabpaclitaxel in pancreatic cancer. Cancers. (2019) 11:E330. doi: 10.3390/cancers11030330
28. Zhou WJ, Chang KK, Wu K, Yang HL, Mei J, Xie F, et al. Rapamycin synergizes with cisplatin in antiendometrial cancer activation by improving IL-27-stimulated cytotoxicity of NK cells. Neoplasia. (2018) 20:69–79. doi: 10.1016/j.neo.2017.11.003
29. De Iuliis V, Marino A, Caruso M, Capodifoglio S, Flati V, Marynuk A, et al. Autophagy processes are dependent on EGF receptor signaling. Oncotarget. (2018) 9:30289–303. doi: 10.18632/oncotarget.25708
30. Gu Y, Chen T, Li G, Xu C, Xu Z, Zhang J, et al. Lower Beclin 1 downregulates HER2 expression to enhance tamoxifen sensitivity and predicts a favorable outcome for ER positive breast cancer. Oncotarget. (2017) 8:52156–77. doi: 10.18632/oncotarget.11044
31. Kim H, Kim Y, Goh H, Jeoung D. Histone Deacetylase-3/CAGE axis targets EGFR signaling and regulates the response to anti-cancer drugs. Mol Cells. (2016) 39:229–41. doi: 10.14348/molcells.2016.2244
32. Gong J, Gu H, Zhao L, Wang L, Liu P, Wang F, et al. Phosphorylation of ULK1 by AMPK is essential for mouse embryonic stem cell self-renewal and pluripotency. Cell Death Dis. (2018) 9:38. doi: 10.1038/s41419-017-0054-z
33. Kim Y, Yeon M, Jeoung D. DDX53 Regulates cancer stem cell-like properties by binding to SOX-2. Mol Cells. (2017) 40:322–30. doi: 10.14348/molcells.2017.0001
34. Sharif T, Martell E, Dai C, Ghassemi-Rad MS, Hanes MR, Murphy PJ, et al. HDAC6 differentially regulates autophagy in stem-like versus differentiated cancer cells. Autophagy. (2019) 15:686–706. doi: 10.1080/15548627.2018.1548547
35. Yan J, Seibenhener ML, Calderilla-Barbosa L, Diaz-Meco MT, Moscat J, Jiang J, et al. SQSTM1/p62 interacts with HDAC6 and regulates deacetylase activity. PLoS ONE. 8:e76016. doi: 10.1371/journal.pone.0076016
36. Rakoczy J, Fernandez-Valverde SL, Glazov EA, Wainwright EN, Sato T, Takada S, et al. MicroRNAs-140–5p/140–3p modulate Leydig cell numbers in the developing mouse testis. Biol Reprod. (2013) 88:143. doi: 10.1095/biolreprod.113.107607
37. Luo W, Liu L, Yang L, Dong Y, Liu T, Wei X, et al. The vitamin D receptor regulates miR-140–5p and targets the MAPK pathway in bone development. Metabolism. (2018) 85:139–50. doi: 10.1016/j.metabol.2018.03.018
38. Papaioannou G, Mirzamohammadi F, Lisse TS, Nishimori S, Wein MN, Kobayashi T. MicroRNA-140 provides robustness to the regulation of hypertrophic chondrocyte differentiation by the PTHrP-HDAC4 pathway. J Bone Miner Res. (2015) 30:1044–52. doi: 10.1002/jbmr.2438
39. Yang D, Xiao C, Long F, Su Z, Jia W, Qin M, et al. HDAC4 regulates vascular inflammation via activation of autophagy. Cardiovasc Res. (2018) 114:1016–28. doi: 10.1093/cvr/cvy051
40. Chen S, Xu Y, Chen Y, Li X, Mou W, Wang L, et al. SOX2 gene regulates the transcriptional network of oncogenes and affects tumorigenesis of human lung cancer cells. PLoS ONE. (2012) 7:e36326. doi: 10.1371/journal.pone.0036326
41. Cicchini M, Chakrabarti R, Kongara S, Price S, Nahar R, Lozy F, et al. Autophagy regulator BECN1 suppresses mammary tumorigenesis driven by WNT1 activation and following parity. Autophagy. (2014) 10:2036–52. doi: 10.4161/auto.34398
42. Lamb R, Bonuccelli G, Ozsvari B, Peiris-Pages M, Fiorillo M, Smith DL, et al. Mitochondrial mass, a new metabolic biomarker for stem-like cancer cells: understanding WNT/FGF-driven anabolic signaling. Oncotarget. (2015) 6:30453–71. doi: 10.18632/oncotarget.5852
43. Zhang JG, Shi Y, Hong DF, Song M, Huang D, Wang CY, et al. MiR-148b suppresses cell proliferation and invasion in hepatocellular carcinoma by targeting WNT1/beta-catenin pathway. Sci Rep. (2015) 5:8087. doi: 10.1038/srep08087
44. Tzeng HE, Tang CH, Wu SH, Chen HT, Fong YC, Lu YC, et al. CCN6-mediated MMP-9 activation enhances metastatic potential of human chondrosarcoma. Cell Death Dis. (2018) 9:955. doi: 10.1038/s41419-018-1008-9
45. Park YL, Kim HP, Cho YW, Min DW, Cheon SK, Lim YJ, et al. Activation of WNT/beta-catenin signaling results in resistance to a dual PI3K/mTOR inhibitor in colorectal cancer cells harboring PIK3CA mutations. Int J Cancer. (2019) 144:389–401. doi: 10.1002/ijc.31662
46. Lamanuzzi A, Saltarella I, Desantis V, Frassanito MA, Leone P, Racanelli V, et al. Inhibition of mTOR complex 2 restrains tumor angiogenesis in multiple myeloma. Oncotarget. (2018) 9:20563–77. doi: 10.18632/oncotarget.25003
47. Xu Z, Li Z, Wang W, Xia Y, He Z, Li B, et al. MIR-1265 regulates cellular proliferation and apoptosis by targeting calcium binding protein 39 in gastric cancer and, thereby, impairing oncogenic autophagy. Cancer Lett. (2019) 449:226–36. doi: 10.1016/j.canlet.2019.02.026
48. Strouch MJ, Cheon EC, Salabat MR, Krantz SB, Gounaris E, Melstrom LG, et al. Crosstalk between mast cells and pancreatic cancer cells contributes to pancreatic tumor progression. Clin Cancer Res. (2010) 16:2257–65. doi: 10.1158/1078-0432.CCR-09-1230
49. Chen P, Zhao D, Li J, Liang X, Li J, Chang A, et al. Symbiotic macrophage-glioma cell interactions reveal synthetic lethality in PTEN-null glioma. Cancer Cell. (2019) 35:868–84 e866. doi: 10.1016/j.ccell.2019.05.003
50. Fogg KC, Olson WR, Miller JN, Khan A, Renner C, Hale I, et al. Alternatively activated macrophage-derived secretome stimulates ovarian cancer spheroid spreading through a JAK2/STAT3 pathway. Cancer Lett. (2019) 458:92–101. doi: 10.1016/j.canlet.2019.05.029
51. Yan H, Dong M, Liu X, Shen Q, He D, Huang X, et al. Multiple myeloma cell-derived IL-32gamma increases the immunosuppressive function of macrophages by promoting indoleamine 2,3-dioxygenase (IDO) expression. Cancer Lett. (2019) 446:38–48. doi: 10.1016/j.canlet.2019.01.012
52. Hessvik NP, Overbye A, Brech A, Torgersen ML, Jakobsen IS, Sandvig K, et al. PIKfyve inhibition increases exosome release and induces secretory autophagy. Cell Mol Life Sci. (2016) 73:4717–37. doi: 10.1007/s00018-016-2309-8
53. Li XQ, Liu JT, Fan LL, Liu Y, Cheng L, Wang F, et al. Exosomes derived from gefitinib-treated EGFR-mutant lung cancer cells alter cisplatin sensitivity via up-regulating autophagy. Oncotarget. (2016) 7:24585–95. doi: 10.18632/oncotarget.8358
54. Linton SS, Abraham T, Liao J, Clawson GA, Butler PJ, Fox T, et al. Tumor-promoting effects of pancreatic cancer cell exosomes on THP-1-derived macrophages. PLoS ONE. 13:e0206759. doi: 10.1371/journal.pone.0206759
55. Xiao H, Lasser C, Shelke GV, Wang J, Radinger M, Lunavat TR, et al. Mast cell exosomes promote lung adenocarcinoma cell proliferation - role of KIT-stem cell factor signaling. Cell Commun Signal. (2014) 12:64. doi: 10.1186/PREACCEPT-1817458803126023
56. Qu Y, Zhang Q, Cai X, Li F, Ma Z, Xu M, et al. Exosomes derived from miR-181–5p-modified adipose-derived mesenchymal stem cells prevent liver fibrosis via autophagy activation. J Cell Mol Med. (2017) 21:2491–502. doi: 10.1111/jcmm.13170
57. Cosin-Roger J, Ortiz-Masia D, Calatayud S, Hernandez C, Alvarez A, Hinojosa J, et al. M2 macrophages activate WNT signaling pathway in epithelial cells: relevance in ulcerative colitis. PLoS ONE. (2013) 8:e78128. doi: 10.1371/journal.pone.0078128
58. Quiros M, Nishio H, Neumann PA, Siuda D, Brazil JC, Azcutia V, et al. Macrophage-derived IL-10 mediates mucosal repair by epithelial WISP-1 signaling. J Clin Invest. (2017) 127:3510–20. doi: 10.1172/JCI90229
Keywords: cancer associated gene CAGE, cellular interactions, exosomes, micro RNA-140-5p, tumor microenvironment, wnt1
Citation: Yeon M, Lee S, Lee J-E, Jung HS, Kim Y and Jeoung D (2019) CAGE-miR-140-5p-Wnt1 Axis Regulates Autophagic Flux, Tumorigenic Potential of Mouse Colon Cancer Cells and Cellular Interactions Mediated by Exosomes. Front. Oncol. 9:1240. doi: 10.3389/fonc.2019.01240
Received: 08 August 2019; Accepted: 28 October 2019;
Published: 14 November 2019.
Edited by:
Rafael Fridman, Wayne State University, United StatesReviewed by:
Guang-Chao Chen, Academia Sinica, TaiwanPriyanka Gupta, University of Alabama at Birmingham, United States
Copyright © 2019 Yeon, Lee, Lee, Jung, Kim and Jeoung. This is an open-access article distributed under the terms of the Creative Commons Attribution License (CC BY). The use, distribution or reproduction in other forums is permitted, provided the original author(s) and the copyright owner(s) are credited and that the original publication in this journal is cited, in accordance with accepted academic practice. No use, distribution or reproduction is permitted which does not comply with these terms.
*Correspondence: Dooil Jeoung, jeoungd@kangwon.ac.kr