 Rongzhong Huang
 Lihong Jiang
 Yu Xu2
 Yang Sun
- 1The First People's Hospital of Yunnan Province, Kunming, China
- 2Chuangxu Institute of Life Science, Chongqing, China
- 3Second Affiliated Hospital of Chongqing Medical University, Chongqing, China
Background: We performed a network meta-analysis to compare the diagnostic accuracy of contrast-enhanced ultrasound (CEUS) and shear wave elastography (SWE) in differentiating benign and malignant lesions in different body sites.
Methods: A computerized literature search of Medline, Embase, SCOPUS, and Web of Science was performed using relevant keywords. Following data extraction, we calculated sensitivity, specificity, positive likelihood ratio (LR), negative LR, and diagnostic odds ratio (DOR) for CEUS, and SWE compared to histopathology as a reference standard. Statistical analyses were conducted by MetaDiSc (version 1.4) and R software (version 3.4.3).
Results: One hundred and fourteen studies (15,926 patients) were pooled in the final analyses. Network meta-analysis showed that CEUS had significantly higher DOR than SWE (DOR = 27.14, 95%CI [2.30, 51.97]) in breast cancer detection. However, there were no significant differences between CEUS and SWE in hepatic (DOR = −6.67, 95%CI [−15.08, 1.74]) and thyroid cancer detection (DOR = 3.79, 95%CI [−3.10, 10.68]). Interestingly, ranking analysis showed that CEUS achieved higher DOR in detecting breast and thyroid cancer, while SWE achieved higher DOR in detecting hepatic cancer. The overall DOR for CEUS in detecting renal cancer was 53.44, 95%CI [29.89, 95.56] with an AUROC of 0.95, while the overall DOR for SWE in detecting prostate cancer was 25.35, 95%CI [7.15, 89.89] with an AUROC of 0.89.
Conclusion: Both diagnostic tests showed relatively high sensitivity and specificity in detecting malignant tumors in different organs. Network meta-analysis showed that CEUS had higher diagnostic accuracy than SWE in detecting breast and thyroid cancer, while SWE had higher accuracy in detecting hepatic cancer. However, the results were not statistically significant in hepatic and thyroid malignancies. Further head-to-head comparisons are needed to confirm the optimal imaging technique to differentiate each cancer type.
Introduction
Ultrasound (US) has been used for decades in differentiating benign and malignant lesions because of its low cost, ease of access, and non-invasiveness. For example, it belongs to the triad (physical examination, mammography and US), commonly used to assess the risk of breast cancer (1). Moreover, it can detect thyroid nodules as small as 2 mm in size and predicts malignancy based on features like irregular border, hypo-echogenicity, and calcification (2, 3). However, none of these features can individually predict malignancy and conventional US alone has shown moderate accuracy in detecting malignant lesions (4). Therefore, improvements to US technique have been sought.
The introduction of contrast agents (contrast-enhanced US/CEUS) allows for visibility of blood flow within the lesion, which improves its characterization (5). The current in-use contrast media are second-generation agents as SonoVue. These agents remain within the intravascular space, which increases their safety and allows for continuous imaging over the enhancement period (6). Several studies have reported high sensitivity and specificity for CEUS in differentiating malignant lesions with the breast, thyroid, liver and kidneys (5, 7–9). A recent meta-analysis showed no significant difference between CEUS and contrast-enhanced computed tomography (CECT) and magnetic resonance imaging (CEMRI) in terms of the diagnostic accuracy in characterizing focal liver lesions (FLLs) (8).
Shear wave elastography (SWE) relies on the degree of lesion stiffness when subjected to external pressure. Malignant nodules have harder consistency (less elasticity) than benign ones due to the uncontrolled proliferation of cancer cells (10). Therefore, SWE has been investigated for differentiating benign and malignant nodules. Compared to conventional US, SWE is more quantitative and is less operator-dependent, allowing more effective detection of malignant tumors (11). Recent diagnostic test accuracy (DTA) studies and meta-analyses showed high sensitivity and specificity for SWE in detecting malignant lesions within the breast and hepatic tissues (11–13).
According to our knowledge, data are lacking on the direct comparison between CEUS and SWE; therefore, we performed a meta-analysis to evaluate the diagnostic accuracy of CEUS and SWE in differentiating malignant tumors in the breast, liver, thyroid, kidneys, and prostate tissues in comparison to histopathology as a reference test. Moreover, we used network meta-analysis (NMA) to compare the diagnostic accuracy of both tests in malignant tumor differentiation.
Materials and Methods
This meta-analysis has been conducted and reported in accordance with the Preferred Reporting Items for a Systematic Review and Meta-analysis of Diagnostic Test Accuracy Studies (The PRISMA-DTA Statement) (14); Supplementary File I.
Literature Search
We searched Medline (via PubMed), Embase, SCOPUS and Web of Science for diagnostic accuracy studies that evaluated the use of CEUS and SWE in the differentiation of malignant tumors in different body organs. The following search terms were used with different combinations in different databases: Contrast-enhanced Ultrasound OR CEUS OR Ultrasound OR SonoVue OR Shear Wave Elastography OR SWE OR Sonoelastography OR Elastosonography AND Malignant OR Cancer OR Tumor OR Benign OR Adenoma OR Adenocarcinoma OR Carcinoma OR Nodule. No search filters of any sort were used during the search. All retrieved search results from database search (including bibliographic data and abstracts) were imported into EndNote (X7) for duplicate removal and then were transferred to a Microsoft Excel Sheet for screening.
Study Screening
For a study to be eligible for inclusion, it must have matched all the following criteria: (1) Population: Patients, suspected or diagnosed with malignancy in any body organ, (2) Intervention: CEUS or SWE [no specifications by US system or probe type], (3) Comparator: Histopathology, (4) Outcomes: Sensitivity, specificity, positive predictive value [PPV], and negative predictive value [NPV], and (5) Study type: Diagnostic accuracy study. Two independent authors reviewed the title and abstract of retrieved records against our eligibility criteria and classified them into: eligible, non-eligible, or requires further screening (seems to fit the inclusion criteria, but further confirmation is required). The full-text articles of the latter type were retrieved and underwent a second wave of screening. Any discrepancy between the two reviewers' decisions was solved by a senior reviewer (with a 15-year experience in secondary analysis and evidence synthesis methods) after reviewing the debated studies in reference to the pre-specified PICO criteria.
Data Extraction and Quality Assessment
An extraction sheet (in Microsoft Excel) was formatted and pilot-tested before final extraction. The sheet was customized to extract the baseline data of the imaging device, enrolled patients, as well as the raw diagnostic data of each included study. For pilot testing, two reviewers extracted these data from 5 included studies and the datasets were matched and compared with the original studies by a third reviewer. Each set of data was extracted by two reviewers and discordant decisions were resolved by discussion. These discussions included re-examining the studies, inspecting their available additional data sources and re-evaluating the former decisions. When the discrepancies remained, a senior reviewer examined the studies and settled the differences. The extracted data included (I) baseline characteristics of enrolled participants, (II) study design, (III) diagnostic test parameters: Parameters, cutoff value and US system for SWE and contrast agent, US technique, probe and mechanical index for CEUS, and (IV) Outcome data: true positive (TP), true negative (TN), false positive (FP), and false negative (FN) values. When these values were not directly given, they were calculated from the processed data as sensitivity, specificity, PPV, and NPV, using the statistical calculator on RevMan software (Version 5.3 for Windows). We used the Quality Assessment of Diagnostic Accuracy Studies (QUADAS) score to assess the quality of included studies. It consists of 14 (yes/no/unclear) questions to assess different forms of bias within DTA studies (15).
Data Analysis
Pairwise meta-analyses were done under the random-effects model when two or more studies investigated the same predefined research question with the same laboratory test. We extracted the sensitivity, specificity, positive likelihood ratio (LR), negative LR, and diagnostic odds ratio (DOR) values for CEUS and SWE compared to histopathology as a reference standard. The DOR is calculated as (TP X TN)/ (FP X FN) and defined as the odds of having a positive test result in a patient with disease compared with the odds of a positive test result in a patient without disease. Moreover, summary receiver operating characteristic (SROC) curves were constructed to examine diagnostic accuracy. All statistics were reported as absolute values with their 95% confidence interval (95% CI). A p-value < 0.05 was considered statistically significant. The Chi-square and I-square statistics were calculated in order to assess heterogeneity. Significant heterogeneity was considered to be present if the chi-square p-value was < 0.1 (as per the Cochrane Handbook for Systematic Reviews of Intervention). Data were presented into five subgroups according to cancer site: breast, liver, thyroid, kidneys, and prostate. Network meta-analyses were conducted to compare the diagnostic accuracy of CEUS vs. SWE in malignancy detection. Heterogeneity and inconsistency were checked by the I2 and the corresponding p-value. All statistical analyses were conducted on MetaDiSc (version 1.4) and R software (version 3.4.3).
Results
Literature Search and Study Characteristics
Database search retrieved 5896 unique citations. Following title and abstract screening, 422 full-text articles were retrieved for further scrutiny. Finally, 114 diagnostic accuracy studies (65 on SWE and 50 on CEUS; one study by 4 assessed both modalities), reporting data from 15926 patients (5680 for CEUS and 10392 for SWE) were included in our network meta-analysis (Figure 1, Bibliographic details in Supplementary File II). According to the QUADAS score, 25 (21.5%), 30 (25.8%), 22 (18.9%), 23 (19.8%), and 16 (13.8%) studies scored 10, 11, 12, 13, and 14, respectively. The baseline data of enrolled participants, as well as the characteristics of the used US systems for SWE and CEUS tests are illustrated in Tables 1, 2, respectively.
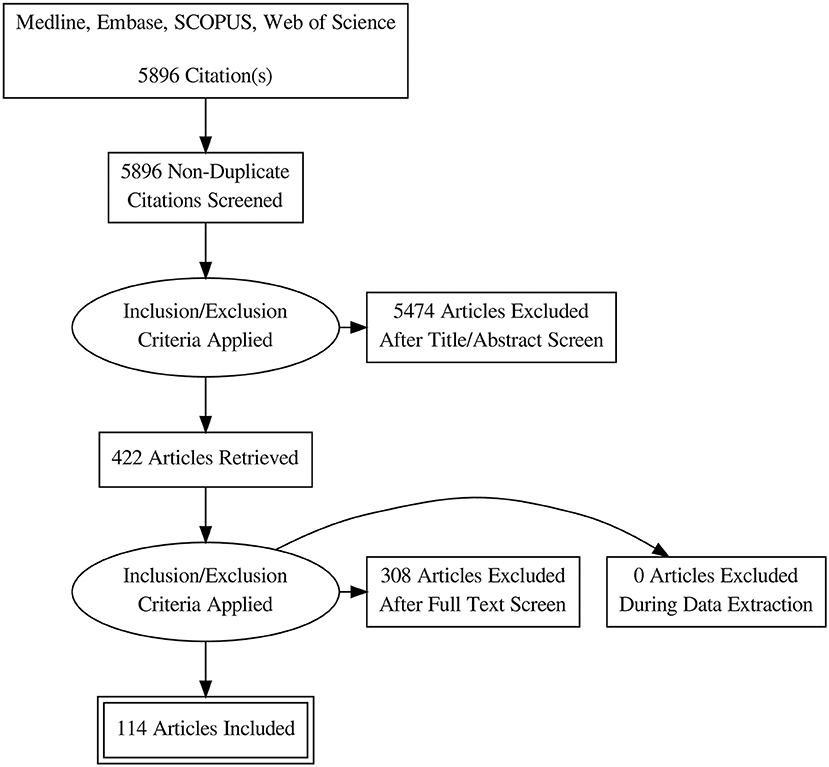
Figure 1. PRISMA flow diagram of literature search and study selection.
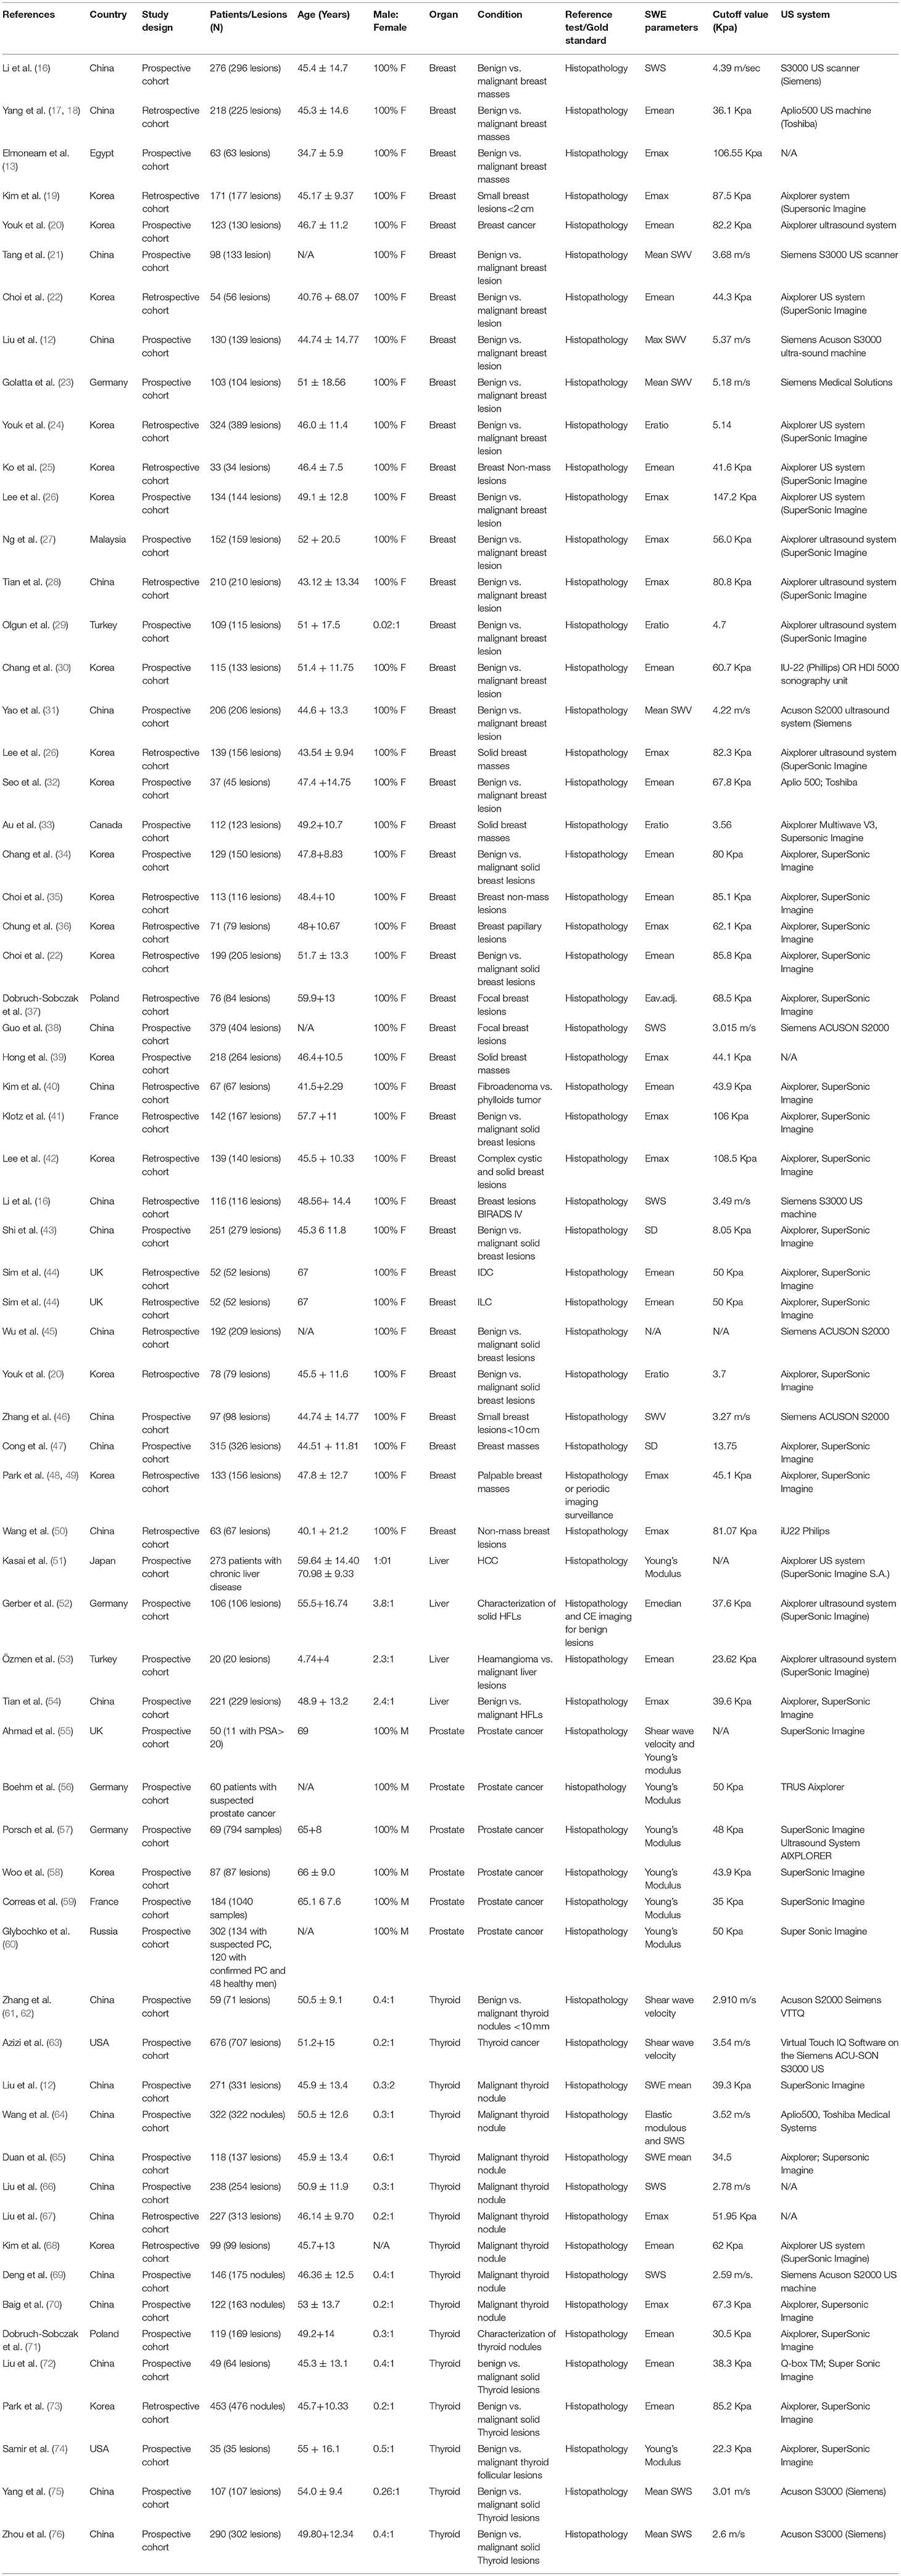
Table 1. Baseline characteristics of enrolled patients and criteria of the used SWE system.
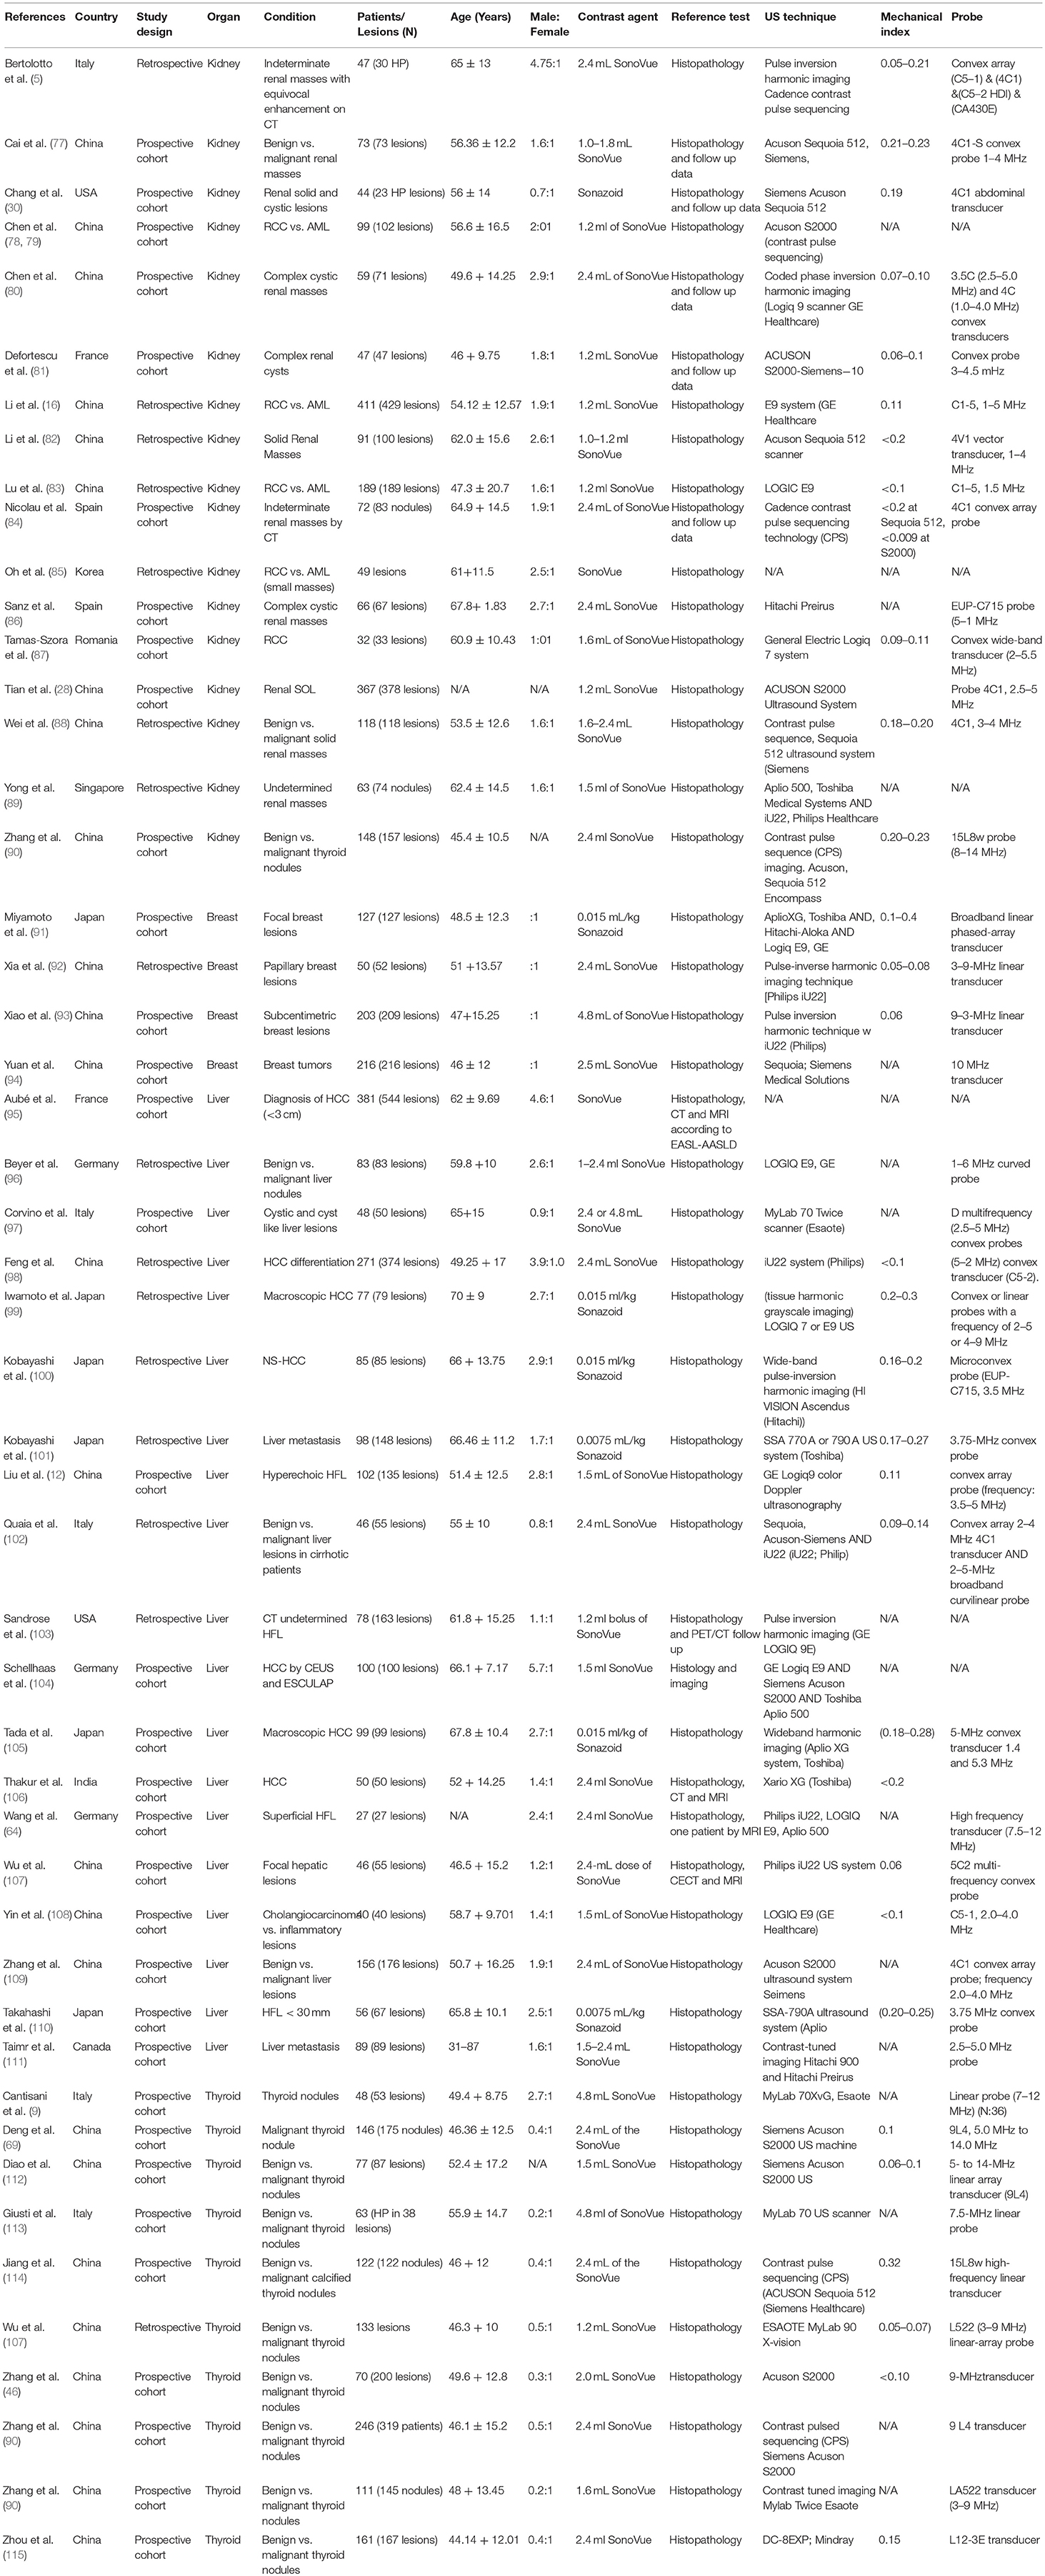
Table 2. Baseline characteristics of enrolled patients and criteria of the used CEUS system.
Outcomes of Pair-Wise Meta-Analysis
Breast Cancer
Detailed figures for pairwise meta-analysis in all five organs are illustrated in Supplementary File III. The pooled sensitivity, specificity, positive LR, and negative LR for CEUS in detection of breast malignant lesions were 0.89 (95% CI, 0.85, 0.92), 0.85 (95% CI, 0.81, 0.89), 6.13 (95% CI, 4.70, 8.01), and 0.12 (95% CI, 0.07, 0.21), respectively. The pooled DOR was 49.66 (95% CI, 29.42, 83.82) and the area under the receiving-operating characteristic (AUROC) curve was 0.92, Figure 2A. No heterogeneity was observed for sensitivity (p = 0.15) or specificity (p = 0.95).
Figure 2. Summary receiver operating characteristic curve of (A) Contrast Enhanced Ultrasound, and (B) Shear Weight Elastography in breast cancer diagnosis.
For SWE, the pooled sensitivity, specificity, positive LR, and negative LR were 0.84 (95% CI, 0.83, 0.86), 0.86 (95% CI, 0.85, 0.87), 7.12 (95% CI, 5.54, 9.15), and 0.18 (95% CI, 0.15, 0.22), respectively. The pooled DOR was 46.22 (95% CI, 31.33, 68.18) with an AUROC of 0.93, Figure 2B. Significant heterogeneity was observed for sensitivity (p < 0.0001) and specificity (p < 0.0001).
Hepatic Cancer
The pooled sensitivity, specificity, positive LR, and negative LR for CEUS in differentiating malignant hepatic lesions were 0.78 (95% CI, 0.76, 0.81), 0.89 (95% CI, 0.87, 0.91), 6.51 (95% CI, 3.90, 10.85), and 0.13 (95% CI, 0.06, 0.25), respectively. The overall DOR was 57.94 (95% CI, 24.78, 135.45) with an AUROC of 0.95, Figure 3A. The included studies were heterogeneous in the estimates of sensitivity (p < 0.0001) and specificity (p < 0.0001).
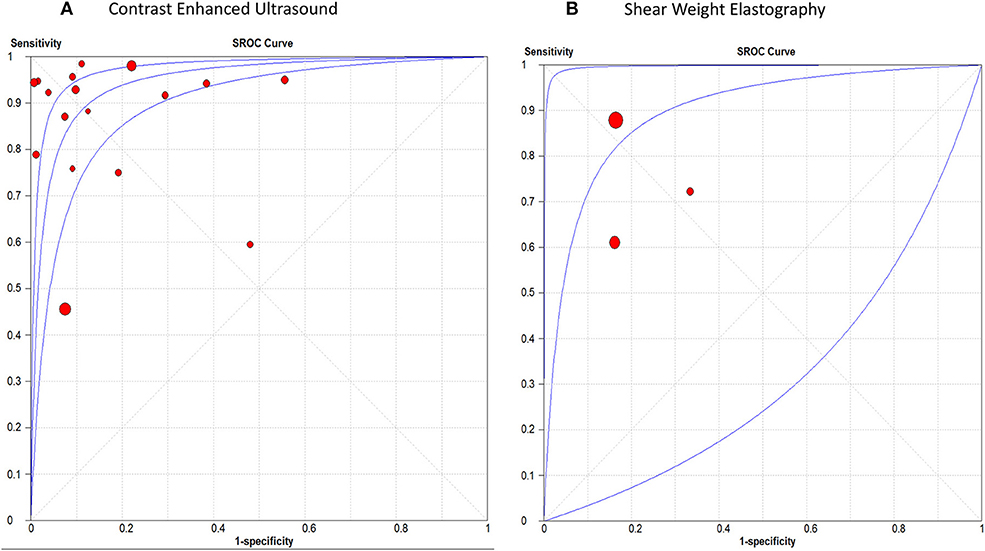
Figure 3. receiver operating characteristic curve of (A) Contrast Enhanced Ultrasound, and (B) Shear Weight Elastography in hepatic cancer diagnosis.
For SWE, the pooled sensitivity, specificity, positive LR, and negative LR were 0.82 (95% CI, 0.77, 0.87), 0.83 (95% CI, 0.76, 0.89), 4.30 (95% CI, 2.85, 6.48), and 0.29 (95% CI, 0.12, 0.71), respectively. The overall DOR was 14.46 (95% CI, 4.09, 51.04) with an AUROC of 0.90, Figure 3B. The included studies were heterogeneous in the estimates of sensitivity (p < 0.0009) and specificity (p < 0.0001).
Thyroid Cancer
The pooled sensitivity, specificity, positive LR, and negative LR for CEUS in detecting malignant thyroid nodules were 0.81 (95% CI, 0.78, 0.84), 0.88 (95% CI, 0.86, 0.90), 6.01 (95% CI, 3.88, 9.31), and 0.23 (95% CI, 0.17, 0.31), respectively. The overall DOR was 28.54 (95% CI, 16.79, 48.51) with an AUROC of 0.91, Figure 4A. Significant heterogeneity was observed for sensitivity (p = 0.001) and for specificity (p < 0.0001).
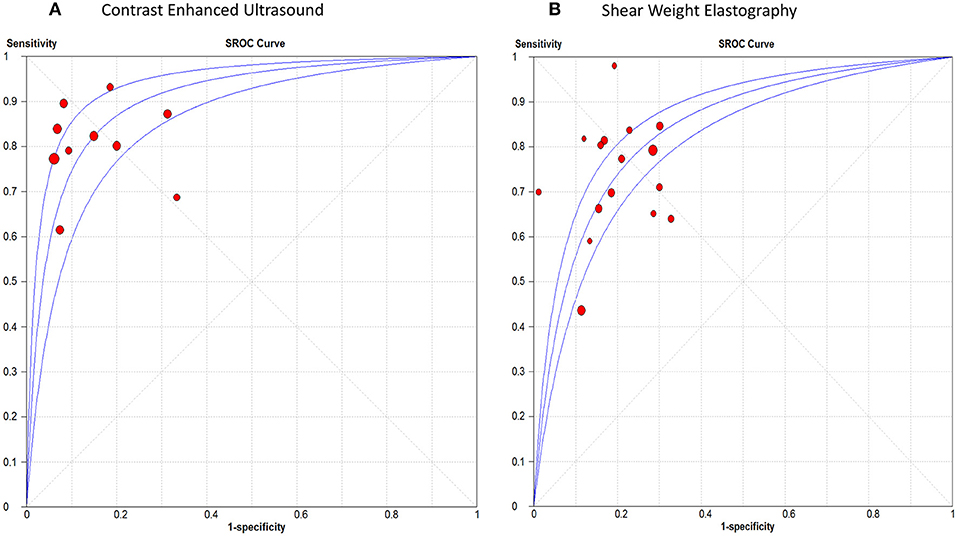
Figure 4. Summary receiver operating characteristic curve of (A) Contrast Enhanced Ultrasound, and (B) Shear Weight Elastography in thyroid cancer diagnosis.
For SWE, the pooled sensitivity, specificity, positive LR, and negative LR were 0.67 (95% CI, 0.64, 0.69), 0.77 (95% CI, 0.76, 0.79), 3.50 (95% CI, 2.93, 4.18), and 0.33 (95% CI, 0.25, 0.45), respectively. The overall DOR was 11.17 (95% CI, 8.04, 15.51) with an AUROC of 0.84, Figure 4B. Significant heterogeneity was observed for sensitivity (p < 0.0001) and specificity (p < 0.0001).
Renal Cancer
The sensitivity of CEUS ranged from 0.71 to 0.98 with a pooled sensitivity of 0.87 (95% CI, 0.85, 0.88). Specificity ranged from 0.50 to 0.97 with a pooled specificity of 0.84 (95% CI, 0.82, 0.87). The pooled positive and negative LRs were 5.55 (95% CI, 3.74, 8.22) and 0.12 (95% CI, 0.07, 0.19), respectively. The overall DOR was 53.44 (95% CI, 29.89, 95.56) with an AUROC of 0.95, Figure 5A. Significant heterogeneity was observed for sensitivity (p < 0.0001) and specificity (p < 0.0001).
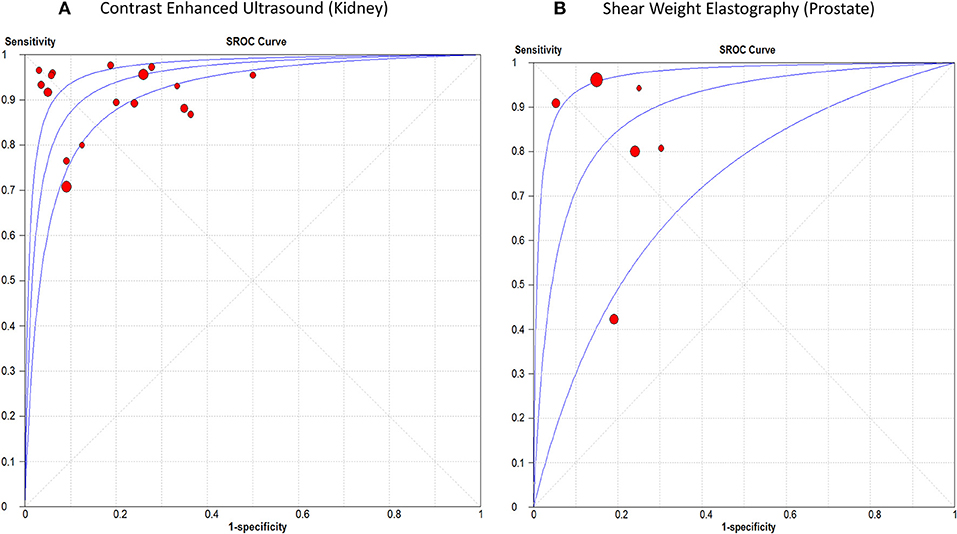
Figure 5. Summary receiver operating characteristic curve of (A) Contrast Enhanced Ultrasound in renal cancer diagnosis, and (B) Shear Weight Elastography in prostate cancer diagnosis.
Prostate Cancer
The sensitivity of SWE ranged from 0.42 to 0.96 with a pooled sensitivity of 84% (95% CI, 0.80, 0.87). Specificity ranged from 0.70 to 0.95 with a pooled specificity of 0.84 (95% CI, 0.82, 0.86). The pooled positive and negative LRs were 4.59 (95% CI, 2.68, 7.87) and 0.18 (95% CI, 0.07, 0.44), respectively. The overall DOR was 25.35 (95% CI, 7.15, 89.89) with an AUROC of 0.89 (Figure 5A). Significant heterogeneity was observed for sensitivity (p < 0.0001) and specificity (p < 0.0001) (Figure 5B). Table 3 summarizes the diagnostic results for both tests in different cancer sites.
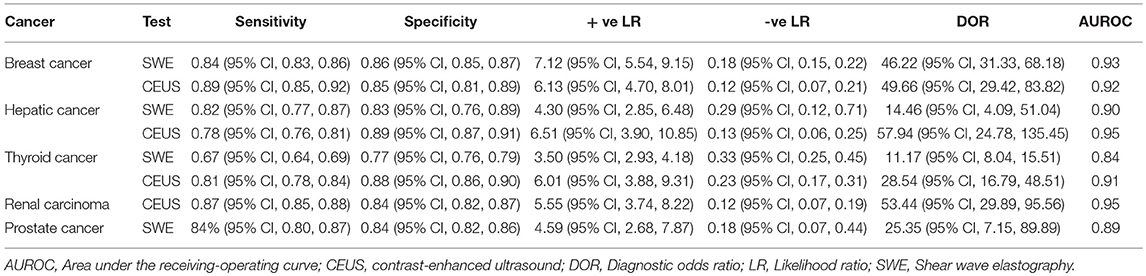
Table 3. Summary of the results of pooled sensitivity, specificity, positive, and negative likelihood ratios for SWE and CEUS in different cancers.
Outcomes of Network Meta-Analysis
Corresponding network plots and forest plots of network meta-analysis between CEUS and SWE are shown in Figure 6. In breast cancer, NMA showed that CEUS was associated with significantly higher DOR than SWE (DOR = 27.14, 95% CI [2.30, 51.97], p = 0.011). While NMA showed no significant difference between CEUS and SWE in detecting hepatic (DOR = −6.67, 95% CI [-15.08, 1.74, p = 0.61]) and thyroid malignant lesions (DOR = 3.79, 95% CI [−3.10, 10.68], p = 0.58). No significant heterogeneity or inconsistency were observed between the pooled studies for breast (I2 = 10%, p = 0.30) and hepatic cancer (I2 = 20%, p = 0.21). While a p-value of 0.05 indicated significant heterogeneity among the studies of thyroid cancer; therefore, the random-effects model was employed.
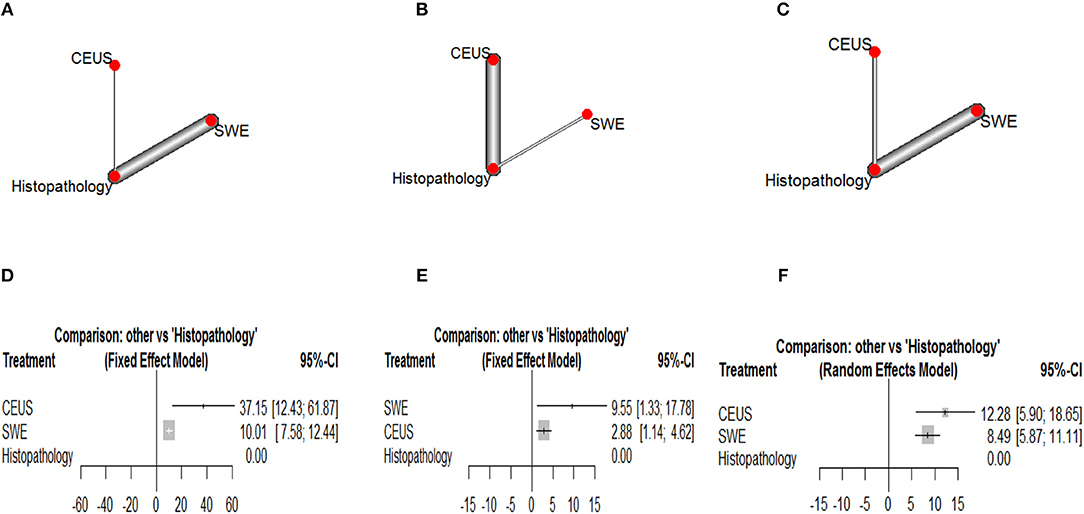
Figure 6. Network plots showing direct evidence between Contrast Enhanced Ultrasound and Shear Weight Elastography in (A) breast cancer, (B) hepatic caner, and (C) thyroid cancer. Also, forest plots of network meta-analysis between Contrast Enhanced Ultrasound and Shear Weight Elastography vs. histopathology in (A) breast cancer, (B) hepatic caner, and (C) thyroid cancer. (D) Forest plot CEUS vs. SWE of breast cancer. (E) Forest plot CEUS vs. SWE of hepatic cancer. (F) Forest plot CEUS vs. SWE of thyroid cancer.
Ranking Diagnostic Tests
According to Glas et al. (116), the DOR is considered as an indicator of ranking of competing diagnostic tests. According to our results, CEUS achieved the highest DOR in detecting breast and thyroid malignant lesions, while SWE achieved the highest DOR in detecting hepatic malignant lesions.
Discussion
This meta-analysis of DTA studies provides a comprehensive assessment and comparison of the diagnostic accuracy of two US modalities in differentiating malignant tumors in different body organs. It showed relatively high sensitivity (between 78 and 89%) and specificity (between 84 and 89%) for CEUS in identifying malignant lesions in the breast, liver, thyroid and kidneys. Moreover, it demonstrated relatively high sensitivity (between 82 and 84%) and specificity (between 83 and 86%) for SWE in differentiating malignant tumors within the breast, liver and prostate. However, it had relatively lower sensitivity (67%) and specificity (77%) in identifying malignant nodules within the thyroid gland.
Our results support some recent practice guidelines that endorse the use of CEUS and SWE in differentiating malignant lesions within the liver and the breast (117, 118). Moreover, it provides new data on a comparison that can impact the clinical practice. Through NMA, we compared the diagnostic accuracy of CEUS and SWE in three organs (where data on both tests were available in the literature). Our network and ranking analysis showed that CEUS was more accurate than SWE in differentiating breast and thyroid lesions (although the difference was not significant in thyroid malignancy according to NMA). On the other hand, SWE ranked higher in terms of diagnostic accuracy in differentiating hepatic malignant lesions (although the difference was not significant according to NMA).
Our results are in agreement with a former meta-analysis by Sadigh et al. that showed high sensitivity and specificity for SWE in differentiating breast malignant lesions [88 and 83% in comparison to 84 and 86% in our analysis; (11)]. However, our sensitivity and specificity results are quite lower than those obtained by Liu et al. in a meta-analysis on SWE accuracy in differentiating thyroid malignancy [sensitivity 81% and specificity 84%; (12)]. Likewise, another meta-analysis reported high sensitivity and specificity (93 and 90%, respectively) for CEUS in identifying hepatic malignant lesions (119). The observed discrepancy between our findings and those of the aforementioned meta-analyses may be attributed to the different sample size (being larger in our analysis) or the lesional characteristics of enrolled patients (being easier to identify in the studies included in the other meta-analysis i.e., less depth and clear contrast from the surrounding tissue).
Interestingly, a meta-analysis by Guang et al. showed comparable diagnostic accuracy for SonoVue-enhanced US with contrast-enhanced computed tomography and magnetic resonance imaging (8). Moreover, CEUS has other advantages over these modalities as ease of access, lack of radiation exposure or nephrotoxic materials; limitations that affect the use of CT and MRI in several diagnostic applications (120, 121). It is also fair to recognize that both tests have limitations as well. For example, SWE suffers from operator-dependency and manual compression, while the adverse effects of the contrast agent is a concern with CEUS use. Further technical improvements with both modalities would further enhance their clinical potential.
Strength Points
This NMA directly compares the diagnostic accuracies of CEUS and SWE in different cancer sites and using different analytic approaches as pairwise, network and ranking pooled analyses. Therefore, it provides a holistic evaluation of the comparison of both techniques in different body organs. We performed a thorough literature search and retrieved a large number of studies (relatively large sample size), which adds to the validity and generalizability of our findings. Unlike former reviews that retrieved a small number of studies and focused on one test in one organ, we aimed to provide a comprehensive assessment of both tests in different organs and a high quality comparison whenever suitable data were provided.
Limitations and Future Research Implications
Our meta-analysis has some limitations. First, the observed heterogeneity in the majority of our outcomes may be due to differences in study design and patient characteristics. Second, we could not examine the effects of lesion characteristics, such as size and depth on the diagnostic accuracy of both tests due to lack of data. Third, many of the included studies did not mention whether the results of CEUS or SWE were interpreted with blinding to the findings of histopathology or not. Future studies should report diagnostic accuracy data based on the size and depth of the lesions to allow more detailed analysis. Moreover, they should adhere to the Standards for Reporting of Diagnostic Accuracy “STRAD” checklist in reporting their methods and findings to allow a more thorough critical appraisal.
Conclusion
Both diagnostic tests (CEUS and SWE) showed relatively high sensitivity and specificity in detecting malignant tumors in different organs; CEUS had higher diagnostic accuracy than SWE in detecting breast and thyroid cancer, while SWE had higher accuracy in detecting hepatic cancer (the differences in the latter two cancer types were not statistically significant). These results endorse the use of both tests for malignancy detection and rank their accuracy in different organs. Future studies should provide more data to allow characterization of both tests in lesions of different size or depth.
Author Contributions
YS developed the concept, designed the study, and prepared the manuscript. RH acquired the data, controlled quality of the work, analyzed the data, and prepared the manuscript. LJ acquired the data. YX analyzed the data. YG acquired the data. HR acquired the data and conducted the analysis. ZW analyzed the data and prepared the manuscript.
Funding
This work was supported by funding from National Natural Science Foundation of China. Award Number 31300137 received by RH.
Conflict of Interest Statement
The authors declare that the research was conducted in the absence of any commercial or financial relationships that could be construed as a potential conflict of interest.
Acknowledgments
We are extremely thankful to authors of all the included papers for proving suitable data for analysis.
Supplementary Material
The Supplementary Material for this article can be found online at: https://www.frontiersin.org/articles/10.3389/fonc.2019.00102/full#supplementary-material
Supplementary File I PRISMA checklist for systematic reviews/meta-analysis.
Supplementary File II Bibliographic Information of Included Studies.
Supplementary File III Additional Pairwise Meta-analysis Figures.
References
1. Hatzung G, Grunwald S, Zygmunt M, Geaid AA, Behrndt PO, Isermann R, et al. Sonoelastography in the diagnosis of malignant and benign breast lesions: initial clinical experiences. Ultraschall Med. (2010) 31:596–603. doi: 10.1055/s-0029-1245526
2. Kwak JY, Han KH, Yoon JH, Moon HJ, Son EJ, Park SH, et al. Thyroid imaging reporting and data system for US features of nodules: a step in establishing better stratification of cancer risk. Radiology. (2011) 260:892–9. doi: 10.1148/radiol.11110206
3. Zhan J, Diao X-H, Chen L, Jin J-M, Chen Y. Role of contrast-enhanced ultrasound in diagnosis of thyroid nodules in acoustic radiation force impulse “Gray Zone.” Ultras Med Biol. (2017) 43:1179–86. doi: 10.1016/j.ultrasmedbio.2017.02.006
4. Cooper P. What can we learn from old wetlands? Lessons that have been learned and some that may have been forgotten over the past 20 years. Desalination. (2009) 246:11–26. doi: 10.1016/j.desal.2008.03.040
5. Bertolotto M, Cicero C, Perrone R, Degrassi F, Cacciato F, Cova MA. Renal masses with equivocal enhancement at CT: characterization with contrast-enhanced ultrasound. Am J Roentgenol. (2015) 204:W557–65. doi: 10.2214/AJR.14.13375
6. Lencioni R, Crocetti L. Radiofrequency ablation of liver cancer. Tech Vasc Interv Radiol. (2007) 10:38–46. doi: 10.1053/j.tvir.2007.08.006
7. Zhao H, Xu R, Ouyang Q, Chen L, Dong B, Huihua Y. Contrast-enhanced ultrasound is helpful in the differentiation of malignant and benign breast lesions. Eur J Radiol. (2010) 73:288–93. doi: 10.1016/j.ejrad.2009.05.043
8. Guang Y, Xie L, Ding H, Cai A, Huang Y. Diagnosis value of focal liver lesions with SonoVue®-enhanced ultrasound compared with contrast-enhanced computed tomography and contrast-enhanced MRI: a meta-analysis. J Cancer Res Clin Oncol. (2011) 137:1595. doi: 10.1007/s00432-011-1035-8
9. Cantisani V, Consorti F, Guerrisi A, Guerrisi I, Ricci P, Di Segni M, et al. Prospective comparative evaluation of quantitative-elastosonography (Q-elastography) and contrast-enhanced ultrasound for the evaluation of thyroid nodules: preliminary experience. Eur J Radiol. (2013) 82:1892–8. doi: 10.1016/j.ejrad.2013.07.005
10. Tranquart F, Bleuzen A, Pierre-Renoult P, Chabrolle C, Sam Giao M, Lecomte P. Elastosonography of thyroid lesions. J Radiol. (2008) 89:35–9. doi: 10.1016/S0221-0363(08)70367-6
11. Sadigh G, Carlos RC, Neal CH, Dwamena BA. Accuracy of quantitative ultrasound elastography for differentiation of malignant and benign breast abnormalities: a meta-analysis. Breast Cancer Res Treat. (2012) 134:923–31. doi: 10.1007/s10549-012-2020-x
12. Liu H, Zhao L-X, Xu G, Yao M-H, Zhang A-H, Xu HX, et al. Diagnostic value of virtual touch tissue imaging quantification for benign and malignant breast lesions with different sizes. Int J Clin Exp Med. (2015) 8:13118–26.
13. Elmoneam GA, Almolla RM, Ahmed AF, Al Ekrashy MA. Supersonic shear waves quantitative elastography and kinetic magnetic resonance dynamic curve in discriminating BI-RADS 4 breast masses: a comparative study. Egypt J Radiol Nuclear Med. (2016) 47:1773–82. doi: 10.1016/j.ejrnm.2016.08.004
14. McInnes MD, Moher D, Thombs BD, McGrath TA, Bossuyt PM, Clifford T, et al. Preferred reporting items for a systematic review and meta-analysis of diagnostic test accuracy studies: the PRISMA-DTA statement. JAMA. (2018) 319:388–96. doi: 10.1001/jama.2017.19163
15. Whiting P, Rutjes AW, Reitsma JB, Bossuyt PM, Kleijnen J. The development of QUADAS: a tool for the quality assessment of studies of diagnostic accuracy included in systematic reviews. BMC Med Res Methodol. (2003) 3:25. doi: 10.1186/1471-2288-3-25
16. Li D-D, Xu H-X, Guo L-H, Bo X-W, Li X-L, Wu R, et al. Combination of two-dimensional shear wave elastography with ultrasound breast imaging reporting and data system in the diagnosis of breast lesions: a new method to increase the diagnostic performance. Eur Radiol. (2016) 26:3290–300. doi: 10.1007/s00330-015-4163-8
17. Yang Y-P, Xu X-H, Guo L-H, He Y-P, Wang D, Liu B-J, et al. Qualitative and quantitative analysis with a novel shear wave speed imaging for differential diagnosis of breast lesions. Sci Rep. (2017) 7:40964. doi: 10.1038/srep40964
18. Yang Y-P, Xu X-H, Bo X-W, Liu B-J, Guo L-H, Xu JM, et al. Comparison of virtual touch tissue imaging & quantification (VTIQ) and Virtual touch tissue quantification (VTQ) for diagnosis of thyroid nodules. Clin Hemorheol Microcirc. (2017) 65:137–49. doi: 10.3233/CH-16142
19. Kim SJ, Ko KH, Jung HK, Kim H. Shear wave elastography: is it a valuable additive method to conventional ultrasound for the diagnosis of small (≤ 2 cm) breast cancer? Medicine. (2015) 94:e1540. doi: 10.1097/MD.0000000000001540
20. Youk JH, Son EJ, Park AY, Kim JA. Shear-wave elastography for breast masses: local shear wave speed (m/sec) versus Young modulus (kPa). Ultrasonography. (2014) 33:34–9. doi: 10.14366/usg.13005
21. Tang L, Xu H-X, Bo X-W, Liu B-J, Li X-L, Wu R, et al. A novel two-dimensional quantitative shear wave elastography for differentiating malignant from benign breast lesions. Int J Clin Exp Med. (2015) 8:10920–8.
22. Choi H, Sohn Y-M, Seo M. Comparison of 3D and 2D shear-wave elastography for differentiating benign and malignant breast masses: focus on the diagnostic performance. Clin Radiol. (2017) 72:878–86. doi: 10.1016/j.crad.2017.04.009
23. Golatta M, Schweitzer-Martin M, Harcos A, Schott S, Gomez C, Stieber A, et al. Evaluation of virtual touch tissue imaging quantification, a new shear wave velocity imaging method, for breast lesion assessment by ultrasound. Biomed Res Int. (2014) 2014:960262. doi: 10.1155/2014/960262
24. Youk JH, Gweon HM, Son EJ, Han KH, Kim JA. Diagnostic value of commercially available shear-wave elastography for breast cancers: integration into BI-RADS classification with subcategories of category 4. Eur Radiol. (2013) 23:2695–704. doi: 10.1007/s00330-013-2873-3
25. Ko KH, Jung HK, Kim SJ, Kim H, Yoon JH. Potential role of shear-wave ultrasound elastography for the differential diagnosis of breast non-mass lesions: preliminary report. Eur Radiol. (2014) 24:305–11. doi: 10.1007/s00330-013-3034-4
26. Lee EJ, Jung HK, Ko KH, Lee JT, Yoon JH. Diagnostic performances of shear wave elastography: which parameter to use in differential diagnosis of solid breast masses? Eur Radiol. (2013) 23:1803–11. doi: 10.1007/s00330-013-2782-5
27. Ng WL, Rahmat K, Fadzli F, Rozalli FI, Mohd-Shah MN, Chandran PA, et al. Shearwave elastography increases diagnostic accuracy in characterization of breast lesions. Medicine. (2016) 95:e3146. doi: 10.1097/MD.0000000000003146
28. Tian J, Liu Q, Wang X, Xing P, Yang Z, Wu C. Application of 3D and 2D quantitative shear wave elastography (SWE) to differentiate between benign and malignant breast masses. Sci Rep. (2017) 7:41216. doi: 10.1038/srep41216
29. Olgun DÇ, Korkmazer B, Kiliç F, Dikici AS, Velidedeoglu M, Aydogan F, et al. Use of shear wave elastography to differentiate benign and malignant breast lesions. Diagn Intervent Radiol. (2014) 20:239. doi: 10.5152/dir.2014.13306
30. Chang JY, Moon JH, Koh SH, Park SY, Lee KS. Clinical application of shear wave elastography in breast masses. Iran J Radiol. (2017) 14:e39585. doi: 10.5812/iranjradiol.39585
31. Yao M, Wu J, Zou L, Xu G, Xie J, Wu R, et al. Diagnostic value of virtual touch tissue quantification for breast lesions with different size. Biomed Res. Int. (2014) 2014:142504. doi: 10.1155/2014/142504
32. Seo M, Ahn HS, Park SH, Lee JB, Choi BI, Sohn YM, et al. Comparison and combination of strain and shear wave elastography of breast masses for differentiation of benign and malignant lesions by quantitative assessment: preliminary study. J Ultras Med. (2018) 37:99–109. doi: 10.1002/jum.14309
33. Au FWF, Ghai S, Moshonov H, Kahn H, Brennan C, Dua H, et al. Diagnostic performance of quantitative shear wave elastography in the evaluation of solid breast masses: determination of the most discriminatory parameter. Am J Roentgenol. (2014) 203:W328–36. doi: 10.2214/AJR.13.11693
34. Chang JM, Won J-K, Lee K-B, Park IA, Yi A, Moon WK. Comparison of shear-wave and strain ultrasound elastography in the differentiation of benign and malignant breast lesions. Am J Roentgenol. (2013) 201:W347–56. doi: 10.2214/AJR.12.10416
35. Choi JS, Han B-K, Ko EY, Ko ES, Shin JH, Kim GR. Additional diagnostic value of shear-wave elastography and color Doppler US for evaluation of breast non-mass lesions detected at B-mode US. Eur Radiol. (2016) 26:3542–9. doi: 10.1007/s00330-015-4201-6
36. Chung J, Lee WK, Cha E-S, Lee JE, Kim JH, Ryu YH. Shear-wave elastography for the differential diagnosis of breast papillary lesions. PLoS ONE. (2016) 11:e0167118. doi: 10.1371/journal.pone.0167118
37. Dobruch-Sobczak K, Nowicki A. Role of shear wave sonoelastography in differentiation between focal breast lesions. Ultras Med Biol. (2015) 41:366–74. doi: 10.1016/j.ultrasmedbio.2014.08.024
38. Guo X, Liu Y, Li W. Diagnostic accuracy of shear wave elastography for prediction of breast malignancy in patients with pathological nipple discharge. BMJ Open. (2016) 6:e008848. doi: 10.1136/bmjopen-2015-008848
39. Hong S, Woo OH, Shin HS, Hwang S-Y, Cho KR, Seo BK. Reproducibility and diagnostic performance of shear wave elastography in evaluating breast solid mass. Clin Imaging. (2017) 44:42–5. doi: 10.1016/j.clinimag.2017.03.022
40. Kim GR, Choi JS, Han B-K, Ko EY, Ko ES, Hahn SY. Combination of shear-wave elastography and color Doppler: feasible method to avoid unnecessary breast excision of fibroepithelial lesions diagnosed by core needle biopsy. PLoS ONE. (2017) 12:e0175380. doi: 10.1371/journal.pone.0175380
41. Klotz T, Boussion V, Kwiatkowski F, Dieu-de Fraissinette V, Bailly-Glatre A, Lemery S, et al. Shear wave elastography contribution in ultrasound diagnosis management of breast lesions. Diagn Intervent Imag. (2014) 95:813–24. doi: 10.1016/j.diii.2014.04.015
42. Lee BE, Chung J, Cha ES, Lee JE, Kim JH. Role of shear-wave elastography (SWE) in complex cystic and solid breast lesions in comparison with conventional ultrasound. Eur J Radiol. (2015) 84:1236–41. doi: 10.1016/j.ejrad.2015.04.005
43. Shi XQ, Li JL, Wan WB, Huang Y. A set of shear wave elastography quantitative parameters combined with ultrasound BI-RADS to assess benign and malignant breast lesions. Ultras Med Biol. (2015) 41:960–6. doi: 10.1016/j.ultrasmedbio.2014.11.014
44. Sim Y, Vinnicombe S, Whelehan P, Thomson K, Evans A. Value of shear-wave elastography in the diagnosis of symptomatic invasive lobular breast cancer. Clin Radiol. (2015) 70:604–9. doi: 10.1016/j.crad.2015.02.004
45. Wu S, Cui X, Huang L, Bai X. Combining virtual touch tissue imaging and BI-RADS may improve solid breast lesion evaluation. Breast Care. (2017) 12:97–100. doi: 10.1159/000456026
46. Zhang S-P, Zeng Z, Liu H, Yao M-H, Xu G, Wu R. Combination of conventional ultrasonography and virtual touch tissue imaging quantification for differential diagnosis of breast lesions smaller than 10 mm. Clin Hemorheol Microcirc. (2017) 67:59–68. doi: 10.3233/CH-170249
47. Cong R, Li J, Wang X. Comparing performance of combinations of shear wave elastography and B-mode ultrasound in diagnosing breast masses: is it influenced by mass size? Ultras Med Biol. (2017) 43:2133–43. doi: 10.1016/j.ultrasmedbio.2017.04.015
48. Park J, Woo OH, Shin HS, Cho KR, Seo BK, Kang EY. Diagnostic performance and color overlay pattern in shear wave elastography (SWE) for palpable breast mass. Eur J Radiol. (2015) 84:1943–8. doi: 10.1016/j.ejrad.2015.06.020
49. Park AY, Son EJ, Han K, Youk JH, Kim J-A, Park CS. Shear wave elastography of thyroid nodules for the prediction of malignancy in a large scale study. Eur J Radiol. (2015) 84:407–12. doi: 10.1016/j.ejrad.2014.11.019
50. Wang S, Zhong Z, Wan J, Tan W, Wu G, Chen M, et al. Oridonin induces apoptosis, inhibits migration and invasion on highly-metastatic human breast cancer cells. Am J Chin Med. (2013) 41:177–96. doi: 10.1142/S0192415X13500134
51. Kasai Y, Moriyasu F, Saito K, Hara T, Kobayashi Y, Nakamura I, et al. Value of shear wave elastography for predicting hepatocellular carcinoma and esophagogastric varices in patients with chronic liver disease. J Med Ultras. (2015) 42:349–55. doi: 10.1007/s10396-014-0603-3
52. Gerber L, Fitting D, Srikantharajah K, Weiler N, Kyriakidou G, Bojunga J, et al. Evaluation of 2D-shear wave elastography for characterisation of focal liver lesions. J Gastrointest Liver Dis. (2017) 26:283–90. doi: 10.15403/jgld.2014.1121.263.dsh
53. Özmen E, Adaletli I, Kayadibi Y, Emre S, Kiliç F, Dervişoglu S, et al. The impact of share wave elastography in differentiation of hepatic hemangioma from malignant liver tumors in pediatric population. Eur J Radiol. (2014) 83:1691–97. doi: 10.1016/j.ejrad.2014.06.002
54. Tian W-S, Lin M-X, Zhou L-Y, Pan F-S, Huang G-L, Wang W, et al. Maximum value measured by 2-D shear wave elastography helps in differentiating malignancy from benign focal liver lesions. Ultras Med Biol. (2016) 42:2156–66. doi: 10.1016/j.ultrasmedbio.2016.05.002
55. Ahmad S, Cao R, Varghese T, Bidaut L, Nabi G. Transrectal quantitative shear wave elastography in the detection and characterisation of prostate cancer. Surg Endosc. (2013) 27:3280–7. doi: 10.1007/s00464-013-2906-7
56. Boehm K, Salomon G, Beyer B, Schiffmann J, Simonis K, Graefen M, et al. Shear wave elastography for localization of prostate cancer lesions and assessment of elasticity thresholds: implications for targeted biopsies and active surveillance protocols. J Urol. (2015) 193:794–800. doi: 10.1016/j.juro.2014.09.100
57. Porsch M, Wendler JJ, Liehr U-B, Lux A, Schostak M, Pech M. New aspects in shear-wave elastography of prostate cancer. J Ultrasonogr. (2015) 15:5–14. doi: 10.15557/JoU.2015.0001
58. Woo S, Kim SY, Cho JY, Kim SH. Shear wave elastography for detection of prostate cancer: a preliminary study. Korean J Radiol. (2014) 15:346–55. doi: 10.3348/kjr.2014.15.3.346
59. Correas JM, Tissier AM, Khairoune A, Vassiliu V, Mejean A, Helenon O, et al. Prostate cancer: diagnostic performance of real-time shear-wave elastography. Radiology. (2015) 275:280–89. doi: 10.1148/radiol.14140567
60. Glybochko P, Alyaev Y, Amosov A, Krupinov G, Ganzha T, Vorobev A, et al. Prostate cancer detection by assessing stiffness of different tissues using shear wave ultrasound elastog-raphy. Urologiia. (2016) 2016:56–61.
61. Zhang H, Shi Q, Gu J, Jiang L, Bai M, Liu L, et al. Combined value of Virtual Touch tissue quantification and conventional sonographic features for differentiating benign and malignant thyroid nodules smaller than 10 mm. J Ultras Med. (2014) 33:257–64. doi: 10.7863/ultra.33.2.257
62. Zhang P, Zhou P, Tian S-M, Qian Y, Li J-L, Li RZ. Diagnostic performance of contrast-enhanced sonography and acoustic radiation force impulse imaging in solid liver lesions. J Ultras Med. (2014) 33:205–14. doi: 10.7863/ultra.33.2.205
63. Azizi G, Keller JM, Mayo ML, Piper K, Puett D, Earp KM, et al. Thyroid nodules and shear wave elastography: a new tool in thyroid cancer detection. Ultras Med Biol. (2015) 41:2855–65. doi: 10.1016/j.ultrasmedbio.2015.06.021
64. Wang W-P, Dong Y, Cao J, Mao F, Xu Y, Si Q, et al. Detection and characterization of small superficially located focal liver lesions by contrast-enhanced ultrasound with high frequency transducers. Med Ultrason. (2017) 19:349–56. doi: 10.11152/mu-1276
65. Duan S-B, Yu J, Li X, Han Z-Y, Zhai H-Y, Liang P. Diagnostic value of two-dimensional shear wave elastography in papillary thyroid microcarcinoma. Onco Targets Ther. (2016) 9:1311–7. doi: 10.2147/OTT.S98583
66. Liu R, Xing M. TERT promoter mutations in thyroid cancer. Endocr Relat Cancer. (2016) 23:R143–55. doi: 10.1530/ERC-15-0533
67. Liu B-J, Zhao C-K, Xu H-X, Zhang Y-F, Xu J-M, Li DD, et al. Quality measurement on shear wave speed imaging: diagnostic value in differentiation of thyroid malignancy and the associated factors. Oncotarget. (2017) 8:4948–59. doi: 10.18632/oncotarget.13996
68. Kim H, Kim J-A, Son EJ, Youk JH. Quantitative assessment of shear-wave ultrasound elastography in thyroid nodules: diagnostic performance for predicting malignancy. Eur Radiol. (2013) 23:2532–7. doi: 10.1007/s00330-013-2847-5
69. Deng J, Zhou P, Tian SM, Zhang L, Qian Y. Comparison of diagnostic efficacy of contrast-enhanced ultrasound, acoustic radiation force impulse imaging, and their combined use in differentiating focal solid thyroid nodules. PLoS ONE. (2014) 9:e90674. doi: 10.1371/journal.pone.0090674
70. Baig FN, Liu SY, Lam H-C, Yip S-P, Law HK, Ying M. Shear wave elastography combining with conventional grey scale ultrasound improves the diagnostic accuracy in differentiating benign and malignant thyroid nodules. Applied Sciences. 7:1103. doi: 10.3390/app7111103
71. Dobruch-Sobczak K, Zalewska EB, Guminska A, Słapa RZ, Mlosek K, Wareluk P, et al. Diagnostic performance of shear wave elastography parameters alone and in combination with conventional B-mode ultrasound parameters for the characterization of thyroid nodules: a prospective, dual-center study. Ultras Med Biol. (2016) 42:2803–11. doi: 10.1016/j.ultrasmedbio.2016.07.010
72. Liu B-X, Xie X-Y, Liang J-Y, Zheng Y-L, Huang G-L, Zhou LY, et al. Shear wave elastography versus real-time elastography on evaluation thyroid nodules: a preliminary study. Eur J Radiol. (2014) 83:1135–43. doi: 10.1016/j.ejrad.2014.02.024
73. Park SY, Seo AN, Jung HY, Gwak JM, Jung N, Cho NY, et al. Alu and LINE-1 hypomethylation is associated with HER2 enriched subtype of breast cancer. PLoS ONE. (2014) 9:e100429. doi: 10.1371/journal.pone.0100429
74. Samir AE, Dhyani M, Anvari A, Prescott J, Halpern EF, Faquin WC, et al. Shear-wave elastography for the preoperative risk stratification of follicular-patterned lesions of the thyroid: diagnostic accuracy and optimal measurement plane. Radiology. (2015) 277:565–73. doi: 10.1148/radiol.2015141627
75. Yang GC, Fried KO, Scognamiglio T. Sonographic and cytologic differences of NIFTP from infiltrative or invasive encapsulated follicular variant of papillary thyroid carcinoma: a review of 179 cases. Diagn Cytopathol. (2017) 45:533–41. doi: 10.1002/dc.23709
76. Zhou H, Zhou XL, Xu HX, Li DD, Liu BJ, Zhang YF, et al. Virtual Touch tissue imaging and quantification in the evaluation of thyroid nodules. J Ultras Med. (2017) 36:251–60. doi: 10.7863/ultra.15.12070
77. Cai Y, Du L, Li F, Gu J, Bai M. Quantification of enhancement of renal parenchymal masses with contrast-enhanced ultrasound. Ultras Med Biol. (2014) 40:1387–93. doi: 10.1016/j.ultrasmedbio.2014.02.003
78. Chen L, Wang L, Diao X, Qian W, Fang L, Pang Y, et al. The diagnostic value of contrast-enhanced ultrasound in differentiating small renal carcinoma and angiomyolipoma. Biosci Trends. (2015) 9:252–8. doi: 10.5582/bst.2015.01080
79. Chen Y, Wu N, Xue T, Hao Y, Dai J. Comparison of contrast-enhanced sonography with MRI in the diagnosis of complex cystic renal masses. J Clin Ultras. (2015) 43:203–9. doi: 10.1002/jcu.22232
80. Chen D, Ma Y, Wang X, Yu S, Li L, Dai B, et al. Clinical characteristics and disease predictors of a large Chinese cohort of patients with autosomal dominant polycystic kidney disease. PLoS ONE. (2014) 9:e92232. doi: 10.1371/journal.pone.0092232
81. Defortescu G, Cornu JN, Béjar S, Giwerc A, Gobet F, Werquin C, et al. Diagnostic performance of contrast-enhanced ultrasonography and magnetic resonance imaging for the assessment of complex renal cysts: a prospective study. Int J Urol. (2017) 24:184–9. doi: 10.1111/iju.13289
82. Li X, Liang P, Guo M, Yu J, Yu X, Cheng Z, et al. Real-time contrast-enhanced ultrasound in diagnosis of solid renal lesions. Discov Med. (2013) 16:15–25. Available online at: http://www.discoverymedicine.com/Xin-Li/2013/07/26/real-time-contrast-enhanced-ultrasound-in-diagnosis-of-solid-renal-lesions/
83. Lu Q, Xue LY, Huang BJ, Wang WP, Li CX. Histotype differentiation of hypo-echoic renal tumors on CEUS: usefulness of enhancement homogeneity and intensity. Abdom Imaging. (2015) 40:1675–83. doi: 10.1007/s00261-014-0340-5
84. Nicolau C, Buñesch L, Paño B, Salvador R, Ribal MJ, Mallofré C, et al. Prospective evaluation of CT indeterminate renal masses using US and contrast-enhanced ultrasound. Abdom Imaging. (2015) 40:542–51. doi: 10.1007/s00261-014-0237-3
85. Oh TH, Lee YH, Seo IY. Diagnostic efficacy of contrast-enhanced ultrasound for small renal masses. Korean J Urol. (2014) 55:587–92. doi: 10.4111/kju.2014.55.9.587
86. Sanz E, Hevia V, Gómez V, Álvarez S, Fabuel JJ, Martínez L, et al. Renal complex cystic masses: usefulness of contrast-enhanced ultrasound (CEUS) in their assessment and its agreement with computed tomography. Curr Urol Rep. (2016) 17:89. doi: 10.1007/s11934-016-0646-7
87. Tamas-Szora A, Socaciu M, Crisan N, Dobrota F, Prundus P, Bungardean C, et al. Investigation of renal cell carcinoma by contrast-enhanced ultrasound-predictive value of time intensity curve analysis in establishing local tumor invasion and stage: a pilot study. Urol J. (2015) 12:2173–81. doi: 10.22037/uj.v12i3.2851
88. Wei S-P, Xu C-L, Zhang Q, Zhang Q-R, Zhao Y-E, Huang PF, et al. Contrast-enhanced ultrasound for differentiating benign from malignant solid small renal masses: comparison with contrast-enhanced CT. Abdom Radiol. (2017) 42:2135–45. doi: 10.1007/s00261-017-1111-x
89. Yong C, Teo Y-M, Kapur J. Diagnostic performance of contrast-enhanced ultrasound in the evaluation of renal masses in patients with renal impairment. Med J Malaysia. (2016) 71:193–8. Available online at: http://www.e-mjm.org/2016/v71n4/contrast-enhanced-ultrasound.pdf
90. Zhang Y, Luo YK, Zhang MB, Li J, Li J, Tang J. Diagnostic accuracy of contrast-enhanced ultrasound enhancement patterns for thyroid nodules. Med Sci Monit. (2016) 22: 4755–64. doi: 10.12659/MSM.899834
91. Miyamoto Y, Ito T, Takada E, Omoto K, Hirai T, Moriyasu F. Efficacy of sonazoid (perflubutane) for contrast-enhanced ultrasound in the differentiation of focal breast lesions: phase 3 multicenter clinical trial. Am J Roentgenol. (2014) 202:W400–7. doi: 10.2214/AJR.12.10518
92. Xia H-S, Wang X, Ding H, Wen J-X, Fan P-L, Wang WP. Papillary breast lesions on contrast-enhanced ultrasound: morphological enhancement patterns and diagnostic strategy. Eur Radiol. (2014) 24:3178–90. doi: 10.1007/s00330-014-3375-7
93. Xiao X, Jiang Q, Wu H, Guan X, Qin W, Luo B. Diagnosis of sub-centimetre breast lesions: combining BI-RADS-US with strain elastography and contrast-enhanced ultrasound—a preliminary study in China. Eur Radiol. (2017) 27:2443–50. doi: 10.1007/s00330-016-4628-4
94. Yuan Z, Quan J, Yunxiao Z, Jian C, Zhu H, Liping G. Diagnostic value of contrast-enhanced ultrasound parametric imaging in breast tumors. J Breast Cancer. (2013) 16:208–13. doi: 10.4048/jbc.2013.16.2.208
95. Aubé C, Oberti F, Lonjon J, Pageaux G, Seror O, N'kontchou G, et al. EASL and AASLD recommendations for the diagnosis of HCC to the test of daily practice. Liver Int. (2017) 37:1515–25. doi: 10.1111/liv.13429
96. Beyer LP, Wassermann F, Pregler B, Michalik K, Rennert J, Wiesinger I, et al. Characterization of focal liver lesions using CEUS and MRI with liver-specific contrast media: experience of a single radiologic center. Ultr Med Eur J Ultras. (2017) 38:619–25. doi: 10.1055/s-0043-105264
97. Corvino A, Catalano O, Corvino F, Sandomenico F, Petrillo A. Diagnostic performance and confidence of contrast-enhanced ultrasound in the differential diagnosis of cystic and cysticlike liver lesions. Am J Roentgenol. (2017) 209:W119–27. doi: 10.2214/AJR.16.17062
98. Feng Y, Qin X-C, Luo Y, Li Y-Z, Zhou X. Efficacy of contrast-enhanced ultrasound washout rate in predicting hepatocellular carcinoma differentiation. Ultras Med Biol. (2015) 41:1553–60. doi: 10.1016/j.ultrasmedbio.2015.01.026
99. Iwamoto T, Imai Y, Kogita S, Igura T, Sawai Y, Fukuda K, et al. Comparison of contrast-enhanced ultrasound and gadolinium-ethoxybenzyl-diethylenetriamine pentaacetic acid-enhanced MRI for the diagnosis of macroscopic type of hepatocellular carcinoma. Dig Dis. (2016) 34:679–86. doi: 10.1159/000448855
100. Kobayashi T, Aikata H, Hatooka M, Morio K, Morio R, Kan H, et al. Usefulness of combining gadolinium-ethoxybenzyl-diethylenetriamine pentaacetic acid-enhanced magnetic resonance imaging and contrast-enhanced ultrasound for diagnosing the macroscopic classification of small hepatocellular carcinoma. Eur Radiol. (2015) 25:3272–81. doi: 10.1007/s00330-015-3725-0
101. Kobayashi K, Maruyama H, Kiyono S, Yokosuka O, Ohtsuka M, Miyazaki M, et al. Histology-based assessment of sonazoid-enhanced ultrasonography for the diagnosis of liver metastasis. Ultras Med Biol. (2017) 43:2151–8. doi: 10.1016/j.ultrasmedbio.2017.06.014
102. Quaia E, De Paoli L, Angileri R, Cabibbo B, Cova MA. Indeterminate solid hepatic lesions identified on non-diagnostic contrast-enhanced computed tomography: assessment of the additional diagnostic value of contrast-enhanced ultrasound in the non-cirrhotic liver. Eur J Radiol. (2014) 83:456–62. doi: 10.1016/j.ejrad.2013.12.012
103. Sandrose S, Karstrup S, Gerke O, Rafaelsen S. Contrast enhanced ultrasound in CT-undetermined focal liver lesions. Ultras Int Open. (2016) 2:E129. doi: 10.1055/s-0042-120272.
104. Schellhaas B, Görtz RS, Pfeifer L, Kielisch C, Neurath MF, Strobel D. Diagnostic accuracy of contrast-enhanced ultrasound for the differential diagnosis of hepatocellular carcinoma: ESCULAP versus CEUS-LI-RADS. Eur J Gastroenterol Hepatol. (2017) 29:1036–44. doi: 10.1097/MEG.0000000000000916
105. Tada T, Kumada T, Toyoda H, Ito T, Sone Y, Kaneoka Y, et al. Utility of contrast-enhanced ultrasound with perflubutane for diagnosing the macroscopic type of small nodular hepatocellular carcinomas. Eur Radiol. (2014) 24:2157–66. doi: 10.1007/s00330-014-3254-2
106. Thakur S, Jhobta A, Dhiman D, Sood R, Chauhan A, Thakur CS. Role of contrast enhanced ultrasound in characterization of focal liver lesions. Egypt J Radiol Nuclear Med. (2014) 45:7–17. doi: 10.1016/j.ejrnm.2013.11.001
107. Wu JP, Shu R, Zhao YZ, Ma GL, Xue W, He QJ, et al. Comparison of contrast-enhanced ultrasonography with virtual touch tissue quantification in the evaluation of focal liver lesions. J Clin Ultras. (2016) 44:347–53. doi: 10.1002/jcu.22335
108. Yin S, Cui Q, Yan K, Yang W, Wu W, Bao L, et al. Effect of contrast-enhanced ultrasound on differential diagnosis of intrahepatic cholangiocarcinoma and arterial phase enhanced hepatic inflammatory lesions. Chin J Cancer Res. (2017) 29:272. doi: 10.21147/j.issn.1000-9604.2017.03.13
109. Zhang F, Zhu H, Wu Y, Dou Z, Zhang Y, Kleinman N, et al. HIV, hepatitis B virus, and hepatitis C virus co-infection in patients in the China National Free Antiretroviral Treatment Program, 2010–12: a retrospective observational cohort study. Lancet Infect Dis. (2014) 14:1065–72. doi: 10.1016/S1473-3099(14)70946-6
110. Takahashi M, Maruyama H, Shimada T, Kamezaki H, Sekimoto T, Kanai F, et al. Characterization of hepatic lesions (≤ 30 mm) with liver-specific contrast agents: a comparison between ultrasound and magnetic resonance imaging. Eur J Radiol. (2013) 82:75–84. doi: 10.1016/j.ejrad.2012.05.035
111. Taimr P, Jongerius VL, Pek CJ, Krak NC, Hansen BE, Janssen HL, et al. Liver contrast-enhanced ultrasound improves detection of liver metastases in patients with pancreatic or periampullary cancer. Ultras Med Biol. (2015) 41:3063–9. doi: 10.1016/j.ultrasmedbio.2015.06.019
112. Diao X, Zhan J, Chen L, Chen Y, Liu Y. Quantification of solid hypo-echoic thyroid nodule enhancement with contrast-enhanced ultrasound. Transl Cancer Res. (2017) 6:1078–87. doi: 10.21037/tcr.2017.09.15
113. Giusti M, Orlandi D, Melle G, Massa B, Silvestri E, Minuto F, et al. Is there a real diagnostic impact of elastosonography and contrast-enhanced ultrasonography in the management of thyroid nodules? J Zhejiang Univ Sci B. (2013) 14:195–206. doi: 10.1631/jzus.B1200106
114. Jiang J, Shang X, Wang H, Xu Y-B, Gao Y, Zhou Q. Diagnostic value of contrast-enhanced ultrasound in thyroid nodules with calcification. Kaohsiung J Med Sci. (2015) 31:138–44. doi: 10.1016/j.kjms.2014.12.001
115. Zhou X, Zhou P, Hu Z, Tian SM, Zhao Y, Liu W, et al. Diagnostic efficiency of quantitative contrast-enhanced ultrasound indicators for discriminating benign from malignant solid thyroid nodules. J Ultras Med. (2018) 37:425–37. doi: 10.1002/jum.14347
116. Glas AS, Lijmer JG, Prins MH, Bonsel GJ, Bossuyt PM. The diagnostic odds ratio: a single indicator of test performance. J Clin Epidemiol. (2003) 56:1129–35. doi: 10.1016/S0895-4356(03)00177-X
117. Claudon M, Dietrich CF, Choi BI, Cosgrove DO, Kudo M, Nolsøe CP, et al. Guidelines and good clinical practice recommendations for contrast enhanced ultrasound (CEUS) in the liver-update 2012. Ultraschall Med. (2013) 34:11–29. doi: 10.1016/j.ultrasmedbio.2012.09.002
118. Lee T, Mendhiratta N, Sperling D, Lepor H. Focal laser ablation for localized prostate cancer: principles, clinical trials, and our initial experience. Rev Urol. (2014) 16:55.
119. Friedrich-Rust M, Buggisch P, De Knegt R, Dries V, Shi Y, Matschenz K, et al. Acoustic radiation force impulse imaging for non-invasive assessment of liver fibrosis in chronic hepatitis B. J Viral Hepatitis. (2013) 20:240–7. doi: 10.1111/j.1365-2893.2012.01646.x
120. Morris MJ, Akhurst T, Osman I, Nunez R, Macapinlac H, Siedlecki K, et al. Fluorinated deoxyglucose positron emission tomography imaging in progressive metastatic prostate cancer. Urology. (2002) 59:913–8. doi: 10.1016/S0090-4295(02)01509-1
Keywords: contract enhanced ultrasonography, malignant lesions benign lesions, network meta analysis, shear wave elastography, lesions
Citation: Huang R, Jiang L, Xu Y, Gong Y, Ran H, Wang Z and Sun Y (2019) Comparative Diagnostic Accuracy of Contrast-Enhanced Ultrasound and Shear Wave Elastography in Differentiating Benign and Malignant Lesions: A Network Meta-Analysis. Front. Oncol. 9:102. doi: 10.3389/fonc.2019.00102
Received: 24 August 2018; Accepted: 04 February 2019;
Published: 05 March 2019.
Edited by:
Giuseppe Esposito, MedStar Georgetown University Hospital, United StatesReviewed by:
Meiyappan Solaiyappan, Johns Hopkins University, United StatesVishwa S. Parekh, Johns Hopkins University, United States
Copyright © 2019 Huang, Jiang, Xu, Gong, Ran, Wang and Sun. This is an open-access article distributed under the terms of the Creative Commons Attribution License (CC BY). The use, distribution or reproduction in other forums is permitted, provided the original author(s) and the copyright owner(s) are credited and that the original publication in this journal is cited, in accordance with accepted academic practice. No use, distribution or reproduction is permitted which does not comply with these terms.
*Correspondence: Yang Sun, sy19850905@126.com