Comparative bioactivity evaluation and metabolic profiling of different parts of Duhaldea nervosa based on GC-MS and LC-MS
 Qian Zhao
 Yuan Li1
  Rui Gu
- 1School of Pharmacy, Chengdu University of Traditional Chinese Medicine, Chengdu, China
- 2School of Ethnic Medicine, Chengdu University of Traditional Chinese Medicine, Chengdu, China
- 3State Key Laboratory of Southwestern Chinese Medicine Resources, School of Pharmacy, Chengdu University of Traditional Chinese Medicine, Chengdu, China
Duhaldea nervosa (Wallich ex Candolle) Anderberg has been widely used as medicine and food additive in China for a long history. Its roots, known as Xiaoheiyao, are the mainly used medicinal part, while the other tissues of D. nervosa are ignored as non-medicinal parts despite their high biomass, resulting in a huge waste of resources. To mine and expand the medicinal values of different parts of D. nervosa, metabolic analysis by GC/LC-MS and bioactivity evaluation were performed. Based on the antioxidant activity and correlation analysis, a metabolite-related network was constructed. A total of 45 volatile and 174 non-volatile compounds were identified. Among them, caffeoylquinic acids and derivatives were more abundant in roots and flowers, while coumaroyltartaric acids and derivatives were mainly present in stems and leaves. By multivariate analysis, 13 volatile and 37 non-volatile differential metabolites were found, respectively. In the bioactivity evaluation of different parts, the order of antioxidant capacity was flowers > roots > leaves or stems. The flowers showed the highest FRAP value (354.47 μM TE/g DW) and the lowest IC50 values in the DPPH (0.06 mg/mL) and ABTS (0.19 mg/mL) assay, while higher inhibitory activity against α-glucosidase was exhibited by flowers and leaves. This study first established the similarities and differences of phytochemicals and bioactivities in D. nervosa, providing a scientific basis for developing non-medicinal parts and guiding the clinical application of this medicinal and edible herb.
1 Introduction
Duhaldea nervosa (Wallich ex Candolle) Anderberg is a medicinal and edible herb of Asteraceae family, and is mainly distributed in the Southwest of China. The roots of D. nervosa, known as Xiaoheiyao, have been long used as a traditional Chinese medicine (TCM) to treat stomachache and relieve rheumatism (1). Furthermore, the roots of D. nervosa have also been popularly used in cooking as food additives, such as being stewed with chicken in a soup (it is believed to relieve dizziness), which was officially approved as a new food material by the Ministry of Health of PR China in 2010 (2).
With the extensive development of new plant-derived functional foods and dietary supplements, many edible plant sources that are rich in antioxidants (such as phenolic compounds) have begun attracting the public attention (3). Studies have shown that natural plants are rich in antioxidants, which are effective, easy to be absorbed, and almost have no side effect. Therefore, screening antioxidants with potential therapeutic effects from natural plants has a promising prospect.
Previous studies have demonstrated that D. nervosa contains steroids, terpenoids, flavonoids, polysaccharides, and phenolic acids (4), which have a wide range of bioactivities including anti-inflammatory, neuroprotective, antioxidant, hepatoprotective, and anticancer properties (5). Some studies have revealed that the root extracts protect HepG2 cells from H2O2-induced oxidative stress by increasing the expression of Nrf2 and related antioxidant enzymes (6).
However, the focus of previous studies was only on the roots of D. nervosa, while the medicinal potential of other parts was unknown. Consequently, to highlight the medicinal, nutritional and edible importance of this medicinal and edible herb, it is of great significance to further develop the application potential of D. nervosa and fully explore the components and bioactivity in different parts of D. nervosa.
Metabolomics is aimed at identifying differences in total metabolite fingerprints, which has significant advantages in the detection of chemical components that are significantly different from each other. The UPLC-Q-Orbitrap HRMS (ultra-high-pressure liquid chromatography coupled with Orbitrap high-resolution mass spectrometry) based metabolomics is featured by its high sensitivity, high resolution, and specificity, And has been widely used to identify the major different chemical components in various plant samples (7). To date, there is no report about the metabolite comparison of the different parts of D. nervosa.
In this study, the metabolic profiles of roots (the traditional medicinal part) and other non-medicinal parts (including flowers, stems and leaves) of D. nervosa were analyzed by gas chromatography-mass spectrometer (GC-MS) and UPLC-Q-Orbitrap HRMS. The differential metabolites between the traditional medicinal part and other non-medicinal parts of D. nervosa based on chemometrics were then screened. In addition, the DPPH, ABTS, FRAP and α-glucosidase bioassay of different parts were performed, and by correlation analysis the relationship between differential metabolites and the biological effects of different parts were determined. These results provided guidance for clinical application and quality control of the waste parts of D. nervosa as potential medicinal sources.
2 Materials and methods
2.1 Chemicals and reagents
Duhaldea nervosa (Wallich ex Candolle) Anderberg was collected in Panzhihua, Sichuan, China. The whole plant was dried and parted into roots, stems, leaves, and flowers, separately.
MS grade acetonitrile, formic acid and methanol were obtained from Fisher Scientific (Fair Lawn, NJ, United States). Distilled water was purchased from the A. S. Watson Group (Hong Kong, China). 2-Chloro-l-phenylalanine, 2,2′-azino-bis (3-ethylbenzthiazoline-6-sulphonic acid) diammonium salt (ABTS) and 2,2-diphenyl-1-picrylhydrazyl (DPPH) and 2,4,6-tri(2-pyridinyl)-1,3,5-triazine (TPTZ) were purchased from Shanghai Yuanye Biotechnology Co., Ltd. (Shanghai, China). α-Glucosidase was purchased from Sigma (St. Louis, MO, United States). All standard compounds used in this study (3,5-dicaffeoylquinic acid, 3,4-dicaffeoylquinic acid, 4,5-dicaffeoylquinic acid, 3-caffeoylquinic acid, 4-caffeoylquinic acid, 5-caffeoylquinic acid, scopoletin and kaempferol) with a purity >98% were obtained from Chengdu Ruifensi Biotechnology Co, Ltd. (Chengdu, China).
2.2 UPLC-Q-Orbitrap HRMS analysis
2.2.1 Sample preparation
All dried samples from different parts of D. nervosa were finely ground and sieved, yielding approximately 0.5 g of pulverized powder. Ultrasonic extraction was performed by immersing the powder in 25 mL of methanol/water (7:3, v/v) for 1 h (8). Subsequently, the extracts were centrifuged at 12,000 rpm for 10 min, and then the supernatant was filtered through a 0.22 μm membrane for the UPLC-Q-Orbitrap HRMS analysis.
2.2.2 UPLC-Q-Orbitrap HRMS
Vanquish UPLC system coupled with Q Exactive Orbitrap high-resolution MS (Thermo Fisher Scientific, Waltham, United States) was used for metabolite analysis. Instrument and data acquisition were performed by Xcalibur 4.1 software. Sample separation was performed on a Thermo Scientific Accucore™ C18 column (100 mm × 3 mm, 2.6 μm) at 25°C. The flow rate was 0.3 mL min−1, and the injection volume was 3 μL. The multi-step gradient program was beneficial to improve the separation efficiency, and the elution condition was conducted according to the references with some changes (9), the comparisons of chromatograms obtained under different experimental conditions were shown in Supplementary Figure S1, we decided to use the elution condition of Supplementary Figure S1C because it has a better separation. The mobile phase consisted of 0.1% (v/v) formic acid in water (A) and acetonitrile (B) with a gradient programme: 0–12 min, 2–30% B; 12–25 min, 30% B; 25–35 min, 30–32% B; 35–40 min, 32–34% B; 40–45 min, 34–70% B; 45–50 min, 70–95% B, 50–55 min, 95–2%. The source parameters were set as follows: spray voltage, 3.5 kV (+) /3.0 kV (−); capillary temperature, 320°C; heater temperature, 350°C; sheath gas flow rate, 35 arb; aux gas flow rate, 10 arb. The Orbitrap analyser scanned over a mass-to-charge ratio (m/z) range of m/z 100 to 1,500 Da with a resolution of 35,000 in full scan MS1 and a resolution of 17,500 in dd-MS2. The mixed normalised collision energy was set at 20, 40 and 60 V. Quality control (QC) samples were injected every 3 samples throughout the run to monitor system stability.
2.2.3 Identification of compounds
Using Compound Discover v3.1 software, the raw MS data collected by UPLC-Q-Orbitrap HRMS were first screened and combined with online databases including mzCloud and mzVault (Thermo Fisher Scientific, Waltham, United States) and self-built databases, and unknown metabolites were identified based on concordance between MS1 and MS2.
2.3 GC-MS analysis
2.3.1 Sample preparation
Powdered samples (5 g) were sonicated in 50 mL of n-hexane for 40 min, then the supernatant was dried under a nitrogen stream to 1 mL and filtered through a 0.22 μm membrane to obtain the sample solutions. All solutions were stored at 4°C prior to analysis.
2.3.2 GC-MS conditions and compounds identification
Analysis was conducted on an Agilent Technologies 7890A GC system and an Agilent Technologies 5975C inert MSD equipped with triple-axis detector (Agilent, United States). Sample separation was operated on a HP-INNOWax capillary column (30 m × 250 μm × 0.25 μm, Agilent, United States). The helium flow rate was controlled at 1 mL/min. A 10°C/min ramp was set from an initial temperature of 50°C to 150°C, then to 180°C at 5°C/min, and then to 250°C at 3°C/min, for a total of 50 min. A sample volume of 1 μL was injected at a split ratio of 10:1. Spectra were recorded in the full scan range (from 35 to 1,000 m/z) with the EI source of positive ion mode, source temperature of 230°C, and quadrupole temperature of 150°C. MS Workstation v6.9.3 (Agilent, United States) was used for instrument control and data processing. Compounds were searched and identified by the NIST14. L database (NIST, United States).
2.4 Statistical analysis
The UPLC-Q-Orbitrap HRMS data were analyzed using Compound Discover software, which produced a matrix of features containing MS, retention time and peak area through peak extraction, deconvolution, peak alignment and other operations. The data of GC-MS were processed by peak alignment and gap filling, and a feature matrix was generated through peak area normalization. The two matrices of features were then imported into SIMCA 14.1 (Umetrics, Sweden) for principal component analysis (PCA), hierarchical cluster analysis (HCA), and orthogonal partial least squares discriminant analysis (OPLS-DA). R2(cum) and Q2(cum) values were used to validate the model. R2 represents the ability to explain the original data, and Q2 represents the predictive ability of the model. Data were analyzed using a combination of variable importance in the projection values (VIP, VIP > 1), fold changes (FC, FC > 2 or FC < 0.5) and p-values (p < 0.05) from the t-test for potential differential metabolites. Heatmap visualization was performed using MetaboAnalyst 5.0.
2.5 Evaluation of bioactivity
The supernatants were diluted to different concentrations for the DPPH, ABTS, FRAP (10) and α-glucosidase (11) bioactivity assay with slight modifications based on literatures. All experiments were carried out independently and repeated more than three times, and the experimental data were expressed as mean ± standard deviation.
3 Results and discussion
3.1 UPLC-Q-Orbitrap HRMS
Compounds were identified by self-built and online databases (mzCloud and mzVault). The self-built database of 169 compounds was constructed from the phytochemical and pharmacological literature by searching the SciFinder, ChemSpider, Google Scholar and CNKI databases, which contained detailed information such as compound name, molecular formula and structural formula. Moreover, compound identification was conducted using MS/MS fragmentation patterns compiled from reference material along with considerations of retention time, characteristic ions, signal intensity, and relevant literature.
The hydroxycinnamic acids (mainly including caffeoylquinic acids, coumaroyltartaric acids and their derivatives) were more easily to be detected in the negative ion mode, whereas the flavonoids were detected in the positive ion mode. A total of 174 compounds, including 54 caffeoylquinic acids and derivatives, 13 feruloylquinic acids and derivatives, 8 p-coumaroylquinic acids and derivatives, 6 caffeoyltartaric acids and derivatives, 29 other hydroxycinnamic acids and derivatives, 16 hydroxybenzoic acids derivatives, 36 flavonoids, 5 coumarins, 4 lignan derivatives, and 3 other compounds were identified from the roots, flowers, stems and leaves of D. nervosa. The total ion chromatograms (TICs) of samples are shown in Supplementary Figures S2, S3. The specific fragment information is shown in Table 1.
Table 1. Metabolites in roots (R), flowers (F), stems (S), and leaves (L) of D. nervosa identified by UPLC-Q-Orbitrap HRMS.
3.1.1 Hydroxycinnamic acids and derivatives
The hydroxycinnamic acids and derivatives are generally divided into four types, namely caffeoylquinic acids (CQAs), p-coumaroylquinic acids (p-CoQAs), feruloylquinic acids (FQAs), and caffeoyltartaric acids (CTAs), The structures and explanation of fragmentation behaviors of mass spectra were given in Figure 1, most of which were reported for the first time in the species.
Figure 1. The possible fragmentation pathway of main hydroxycinnamic acids and derivatives.
3.1.1.1 Caffeoylquinic acids and derivatives
The caffeoylquinic acids (CQAs) are mainly divided into monoacyl-, diacyl-, and triacyl-quinic acids, CQA-dimers, and their hexosides. Almost all caffeoylquinic acids and their derivatives contain at least caffeic acid-specific MS2 fragments at m/z 135 ([CA-H-CO2]−), and 161([CA-H-H2O]−), and at least one quinic acid fragment at m/z 191 ([QA-H]−), and 173 ([QA-H-H2O]−).
Mono-caffeoylquinic acids included [M-H]− at m/z 353 (caffeoylquinic acid, CQA), m/z 335 (caffeoylquinic lactone, CQL), and m/z 371 (hydroxy dihydro-caffeoylquinic acid, HCQA). The position of the caffeoyl residue in the quinic acid skeleton was related to the relative abundance of base peaks at m/z 191, 179, 173 and 135. Tran-3-CQA, Tran-5-CQA, and Tran-4-CQA were unambiguously identified by comparing the retention time and MS2 data with reference standards (9). Accordingly, compounds 1, 2, 4, and 7 were tentatively presumed as 1-CQA, cis-3-CQA, cis-4-CQA and cis-5-CQA, respectively. Furthermore, the base peak at m/z 209 [M-caffeoyl]− has a diagnostic value for the HCQA (44–46). Peaks 39, 40 were assigned to CQL, deduced from the diagnostic ion at m/z 161 by losing the lactone and H2O moiety (15).
Three common diCQAs subclasses were annotated: di-caffeoylquinic acids (diCQA) at m/z 515, hydroxydihydro-caffeoyl-caffeolylquinic acids (HC-CQA) at m/z 533 and caffeoylquinic lactone (diCQL). Peaks (10–19) have been identified with the same fragment ions at m/z 515 [M-H]− (C25H24O12), and their MS2 spectra at m/z 353 [M-H-caffeoyl]− suggested they were diCQA. The elution order of the diCQA isomers was 1,3-diCQA > 1,4-diCQA > 3,4-diCQA > 1,5-diCQA > 3,5-diCQA > 4,5-diCQA (3), and compared to the reference standards, they were, respectively, identified. Similarly, peaks 20–24 and 31, 32 had the same quasi-molecular ions [M-H]−at m/z 677 (C34H30O15) that yielded diagnostic product ions at m/z 515 [M-H-caffeoy]−, 353 [M-H-2caffeoy]− and 191 [M-H-3caffeoyl]−, which could be inferred as triCQA (13). The HC-CQAs were assigned by the analogy of their MS/MS fragmentation behaviors to those of the diCQAs.
The precursor ion [M-H]− at m/z 677 (C31H33O17) and the transitions at m/z 677 → 515 → 353 → 191, indicated the losses of two caffeoyl moieties and a hexoside. Therefore, compound 25–30 were preliminarily identified as diCQA-hexosides. In the same way, CQA-hexoside (8, 9), CQL-hexoside (42, 43), and HC, CQA-hexoside (50) were identified by the precursor ions at m/z 353, 497 and 533.
3.1.1.2 Feruloylquinic acids and derivatives
Compounds 55–60, with a precursor ion at m/z 367, were assigned as mono-FQA. Compounds 55–60 were identified as follows: (1) compounds 55 and 56 were identified as 3-FQA by the base peak at m/z 193 and the “demethylated” ion at m/z 134 [feruloyl-H-CO2-CH3]−; (2) compounds 58 and 59 were identified as 5-FQA by the base peak at m/z 163; and (3) with the fragment ion at m/z 173 (shown as base peak), compounds 57 and 60 were identified as 4-FQA (31). The cis or trans configuration can be judged from the intensity of these peaks, and the stability of cis compounds is more intense (12). Compound 67 had the same quasi-molecular ion [M-H]− at m/z 529, which was 162 Da more than FQA, indicating that they were the hexosides of FQA.
Peaks 61–66 presented the same diagnostic ion at m/z 529 [M-H]−, and by comparison with diCQA and analysis of the characteristic ions at m/z 367 [M-H-caffeoyl]−, 335 [CQA-H-H2O]− and 134 [FA-H-CH3-CO2]−, they were finally deduced as caffeoyl-feruloylquinic (CFQA) (9). The fragments at m/z 349 [FQA-H-H2O]− and 335 [CQA-H-H2O]− (corresponding to the respective dehydrated ions), and the abundant ion at m/z 173, assigned 3F,4CQA (61) (16). Peak 62 was assigned as 3F,5CQA based on the base peak at m/z 193 and the abundant ions at m/z 367 [M-H-caffeoyl]− and 134 as recorded in 3-FQA (9). For 66, a vicinal 4C, FQA was deduced from the base peak at m/z 173, and the fragment ions at m/z 179 and 135 due to the loss of feruloyl.
3.1.1.3 p-Coumaroylquinic acids and derivatives
Compounds 68 and 69, with characteristic ions at m/z 337 [pCoQA-H]− and 163 [pCoA-H]−, were assigned as pCoQA, and the remaining ions were temporarily attributed to fragment series similar to the CQAs (12).
Compounds 70–74 showed the deprotonated ion at m/z 499 [M-H]−, 146 Da more than the CQA (an additional sinapoyl residue). The fragment ions at m/z 191, 163, and 353 (or 337) in the MS2 spectrum indicated they were pCoCQA. The absence of a base peak at m/z 173 of compounds 70 and 71 is consistent with 3,5-pCoCQA. Thus, compounds 70 and 71 were provisionally designated as 3-pCo,5CQA, and 3C,5-pCoQA by the base peak and retention time. In addition, the retention time of the 4-substituted cis-isomer in the reversed phase column is longer than that of the trans-isomer (34). Compounds 72–74 were tentatively characterized as 4-pCo,5CQA, cis-4-pCo,5CQA, and 4C,5-pCoQA, respectively. The fragment ion at m/z 661 of compound 75 was similar to the MS2 spectrum of pCoCQA, so it was tentatively assigned as pCo-diCQA (9).
3.1.1.4 Caffeoyltartaric acids and derivatives
Compounds 76 and 77 both presented deprotonated ion at m/z 311.041 [M-H]−, and the fragments of the deprotonated tartaric acid (m/z 149), caffeic acid (m/z 179) and the losses of CO2 (m/z 135 [M-H-CA-CO2]−) showed that they were caffeoyltartaric acids (CTAs). Three compounds 78–80 were detected in negative modes at m/z 473, with the characteristic ion at m/z 311 [CTA-H]−, 293 [M-H-CTA]−, 149 [tartaric acid-H]−, 179 [CA-H]−, and 135 [CA-H-CO2]−, which were identified as di-caffeoyltartaric acids (diCTA) (18). Compound 81 was detected at m/z 457 and yielded the MS2 ions at m/z 293, 179 and 163, suggesting to be caffeoyltartaric-p-coumaroyl acid (pCoCTA) (20).
3.1.1.5 Other hydroxycinnamic acids and hydroxybenzoic acids and their derivatives
On the basis of the fragment patterns by comparison with the reference standards and references, 11 hydroxycinnamic acids (82, 83, 90, 92–96, 99, 106, and 109) and 8 hydroxybenzoic acids (111, 112, 115, 117–120, and 123) were identified in the extracts, and the losing of neutral molecules [H2O (18 Da), CO (28 Da), CO2 (44 Da), etc.] were their characteristic fragments. For example, compounds 92 and 93 generated the deprotonated molecule [M-H]− at m/z 357 and the fragment ions at m/z 195 [gluconic acid (GA)-H]−, 177 [GA-H-H2O]− and 165 [GA-H-CH2O]−, which were the characteristic fragments of caffeoylgluconic acids (34).
According to the MS2 spectrum, the fragmentation pattern of hexoside were shown (−162 Da) to identify 14 hydroxycinnamic acids glycosides (85–89, 92–95, 97, 98, 100–105, 118, 119, and 110) and 7 hydroxybenzoic acids glycosides (113, 114, 121, 122, and 124–126), and the identification details are shown in Table 1. Besides, MS2 spectra of fragment ions resulting from hexose cross cleavages based on the loss of CHOH are as follows: 2Hex (−60 Da), 3Hex (−90 Da) and 4Hex (−120 Da) (16), can distinguish sugar esters and glycosides, which were ascribed as sugar esters, namely caffeoyl-hexoses (84) and coumaroyl-hexoses (104, 105).
3.1.2 Flavonoids
The fragmentation features of flavonoids involved the unique neutral removal of acetyl (42 Da), methyl (15 Da), and dimethyl (28 Da) groups, as well as the loss of sugar moieties such as 162, 146, 176, 308, and 324 Da which were, respectively, corresponding to hexose, deoxyhexose, glucuronic acid, rutinoside, and dihexose. Fragment ions, resulting from the neutral losses of CO2 (−44 Da), CO (−28 Da), and H2O (−18 Da) by the Retro-Diels-Alder (RDA) cleavages of the flavonoid skeleton, were used for the aglycone annotation of quercetin (127–136), kaempferol (137–145), apigenin (146–150) and luteolin (151–157). In general, flavonoid-O-glycosides were the most abundant flavonoids in the extracts. The specific fragment characteristics are presented in Table 1.
Taking compounds 128, 129 as example, which presented molecular ions at m/z 505 (C23H22O13), 301 [M-H-acetyl-glc]− and 255 [M-acetyl-glc-CO-H2O]− due to cleavage of the glycosidic bond and loss of neutral ion fragments. The ions at m/z 179 and 151 were 1,2A− and 1,3A−, obtained by RDA fragmentation (Figure 2 showed the RDA cleavage mechanisms of the associated flavonoids). Additionally, the abundant aglycone radical ion at m/z 300 was evidence of the 3-O-glycosidic linkage. In the positive ion mode, the abundance of the radical aglycone at m/z 301 and a characteristic ion [M + H-162 Da]+ at m/z 331 revealed the 7-O-glycosidic linkage in 131 (18). According to previous studies, the elution order of glycosylated flavonoids at the same position for monosaccharides is galactoside > glycoside on a C18 column (18). Thus, compound 127 was assigned as quercetin 3-O-acetylgalactoside and 128 was assigned as quercetin 3-O-acetylglycoside. In addition, some other flavonoids were annotated as kampferol-3-O-glucoside (144, diagnostic ion at m/z 285 [M-H-glc]−), apigenin 7-O-glucoside (147, diagnostic ion at m/z 269 [M-H-glc]−), and luteolin-hexoside (152, 153, diagnostic ions at m/z 285 [M-H-glc]−), 217 [M-H-glc-C2H2O-C2H2]− and 199 [M-H-glc-CHO-2CO-H]−.
Figure 2. The RDA cleavage mechanisms of the associated flavonoids.
Compounds 136, 141, and 154–157 were related to the same fragmentation feature and gave characteristic fragment ions at m/z 463, 285, 271, and 255, respectively, indicating losses of glucuronide moieties (Table 1). Kaempferol-7-O-glucuronide (141) was deduced from the fragment ions at m/z 255 [M-glu-CHO-H]− and 227 [M-H-glu-CHO-C2H2-H]−. Compound 154 was assigned as the luteolin 7-O-glucuronide based on the fragment ions at m/z 285 [M-H-glu]− and 217 [M-H-glu-C2H2O-C2H2]−, as well as RDA ions at m/z 151 (1,3A−) and 133 (1,3B−). Similarly, compound 156 was attributed to luteolin-7-O-acetylglucuronide.
In the case of compounds 158 and 159, based on the fragment ions of [aglycone-H]− at m/z 287, [aglycone-H-H2O]− at m/z 269, and 1,3A− and 1,3B− obtained by RDA fragmentation at m/z 151 and 135, they were tentatively assigned to marein (158) and acetylmarein (159). Hispidulin (161) was determined from the base peak at m/z 284. To the best of our knowledge, these flavonoids were described for the first time in D. nervosa.
3.1.3 Coumarins and lignan derivatives
Lignan derivatives included compounds 168–171. Compound 168, tentatively identified as syringaresinol (18), was detected at m/z 417 in negative ion mode with fragment ions at m/z 399 [M-H-H2O]− or 387 [M-H-2CH3]−. In addition, the loss of fragments of deoxyhexose (−204 Da) and hexose (−162 Da) residues at m/z 417 could be observed in the MS2 of compounds 169–171. Just as the loss of fragments from the syringaresinol at m/z 402 (-CH3), 399 (-H2O) or 387 (-2CH3), compounds 169, 170 were then assigned to syringaresinol-hexose and compound 171 was identified as syringaresinol-acetylhexose.
Coumarins derivatives included compounds 163–167. The mass spectrometric fragmentation of coumarin in negative ion mode showed the loss of neutral molecules such as CO (28 Da), CO2 (44 Da), and CH3 (15 Da) due to high energy collisions. Take compounds 164 and 165 for example, which have the same molecular formula C9H6O4 with the characteristic ion [M-H-CO-H2O]− at m/z 133 and [M-H-2CO]− at m/z 105, and both were tentatively identified as dihydroxycoumarin (18). All the coumarins and lignans were identified for the first time in the species.
3.2 GC-MS analysis
Based on the NIST database and comparison with literature, the GC-MS data were analyzed and identified. There were 45 compounds with match degree greater than 80, the identified compounds could be classified into 9 types, including 11 monoterpenes, 10 sesquiterpenes, 2 diterpenes, 1 triterpene, 6 alkanes, 1 olefin, 12 fatty acids and their esters, 1 ketone, and 1 amide. A total list of compounds, which consists of the formula and adducts, is available in the Supplementary Table S1 and Supplementary Figure S4.
3.3 Multivariate statistical analysis of Duhaldea nervosa
3.3.1 Distribution of metabolites in different parts
The relative peak areas of the metabolites were used to construct stack bar graphs of the distribution of metabolites in different parts of D. nervosa, as shown in Figure 3. Thymol-based monoterpenes were designated as the main volatile components in roots, flowers, stems, and leaves, with percentages of 58.47, 36.59, 75.00, and 60.52%, respectively. Moreover, the content of fatty acids and their esters in each part is relatively rich. The identified non-volatile compounds were mainly dominated by hydroxycinnamic acids (main including caffeoylquinic acids, coumaroyltartaric acids and their derivatives) in the extracts of different parts, and the contents of the identified total hydroxycinnamic acid and derivatives were roots (85.95%), flowers (70.06%), stems (79.80%) and leaves (77.07%). It is worth noticing that flavonoids were present at low levels in the roots, while hydroxybenzoic acids were more abundant. Flower and roots were richer in caffeoylquinic acids. The content of different parts may be related to the biosynthesis and photosynthesis during flowering, which may affect the synthesis of large amounts of polyphenols (35).
Figure 3. Distribution of the components in different parts of D. nervosa. (A) Volatile components. (B) Non-volatile components.
3.3.2 Comparative chemical profiling of different parts of Duhaldea nervosa
Principal component analysis (PCA) was conducted to classify the different parts of LC-MS (R2X = 0.883) and GC-MS (R2X = 0.964). The samples that fall within 95% of the Hotelling T2 ellipse and have no outliers are divided into four groups. As shown in Figures 4B, 5B, the PCA score plots demonstrated that the chemical profile of roots and flowers was significantly different from that of leaves, while the chemical profile of stems was similar to that of leaves. It is significantly indicated by the difference between the medicinal and non-medicinal parts of D. nervosa. Organ influence on chemical profiles was more pronounced in roots and flowers, as they showed greater chemical differences. The hierarchical clustering heat map intuitively visualized the degree of difference between chemical profiles in different parts (Figures 4A, 5A). The result of the HCA analysis also clarified it (Figures 4C, 5C), and the dendrogram showed three clusters. They were divided into the flowers cluster, the roots cluster, and finally into two subclusters, one representing the stems and one representing the leaves.
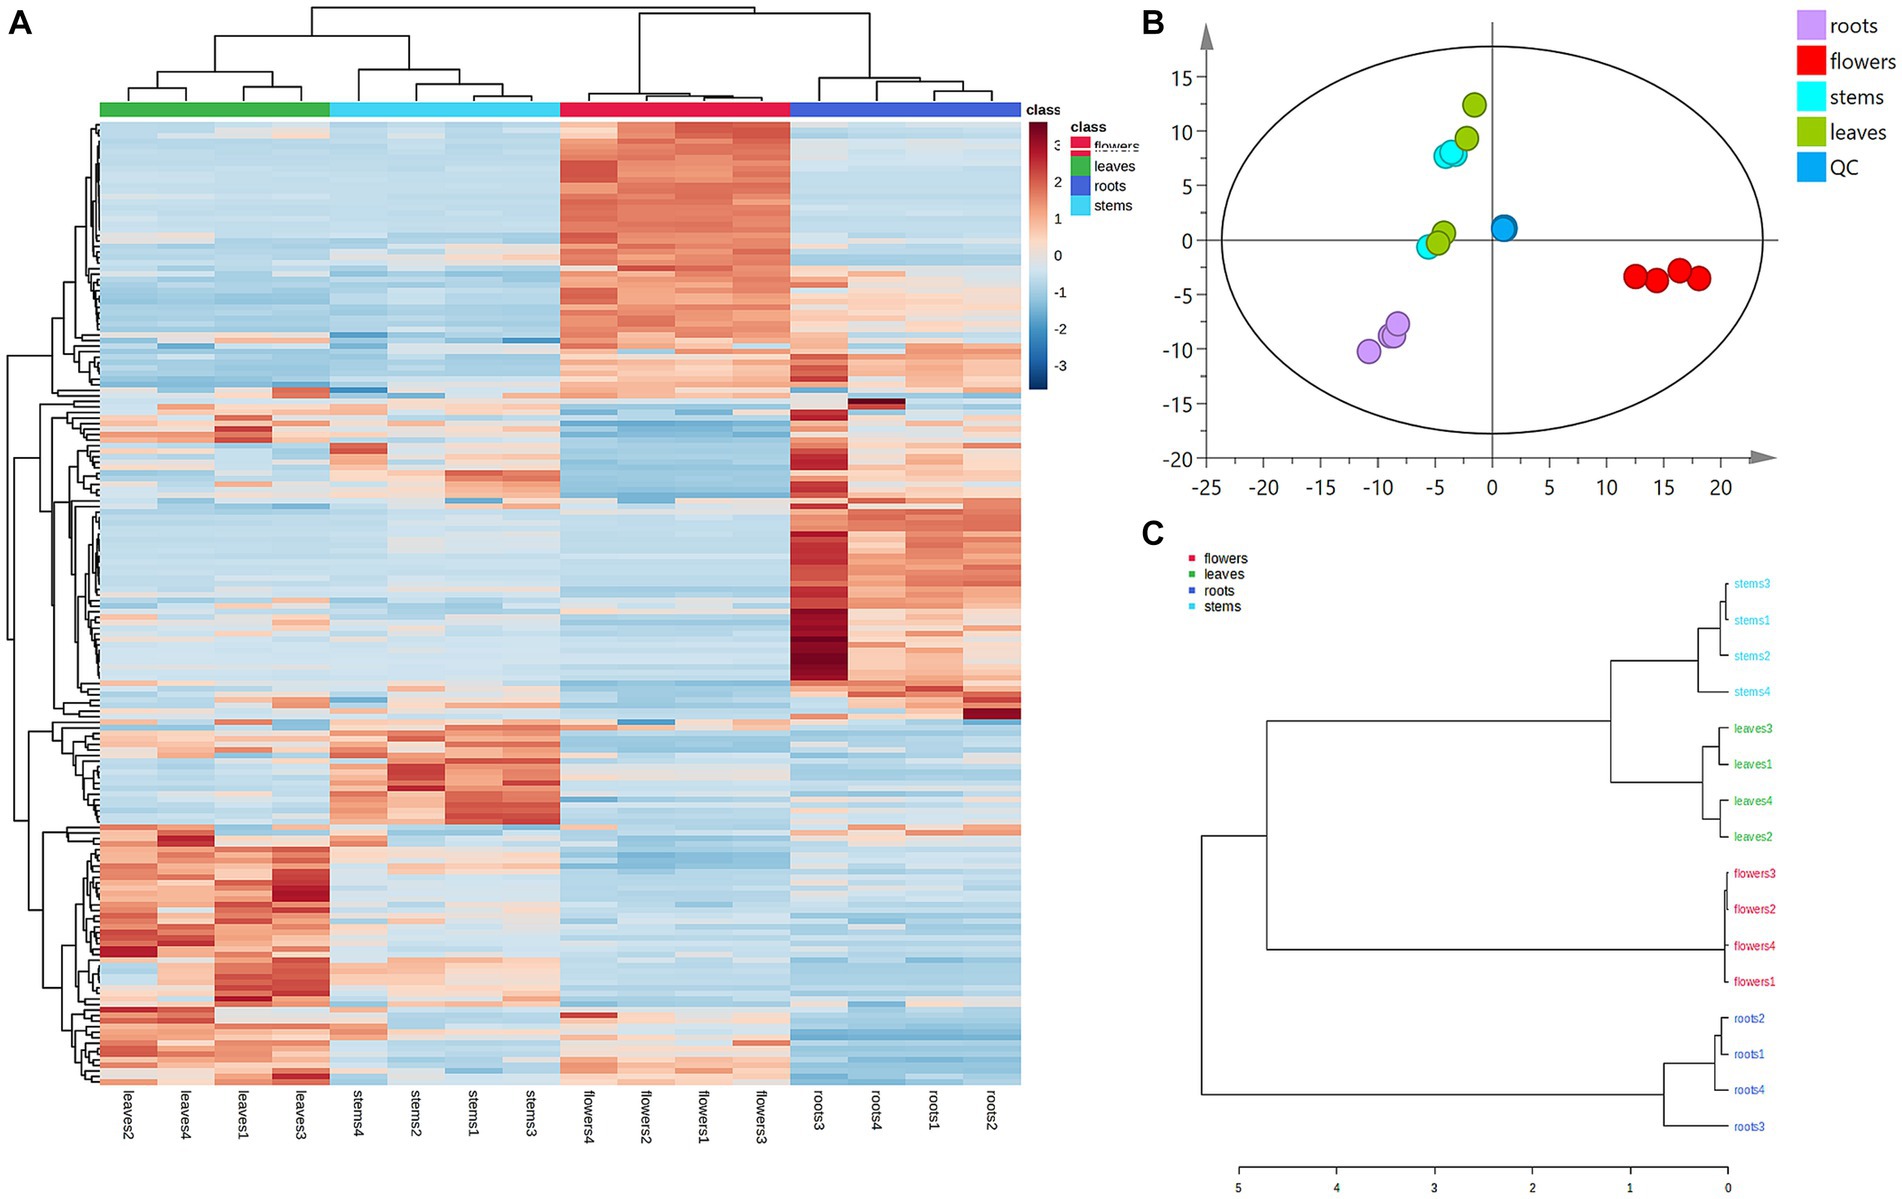
Figure 4. Chemometric analysis for discrimination of non-volatile compounds in different parts (roots, flowers, stems, leaves) of D. nervosa. (A) Pearson’s rank correlation coefficient of different parts. (B) Discriminated by PCA. (C) Discriminated by HCA.
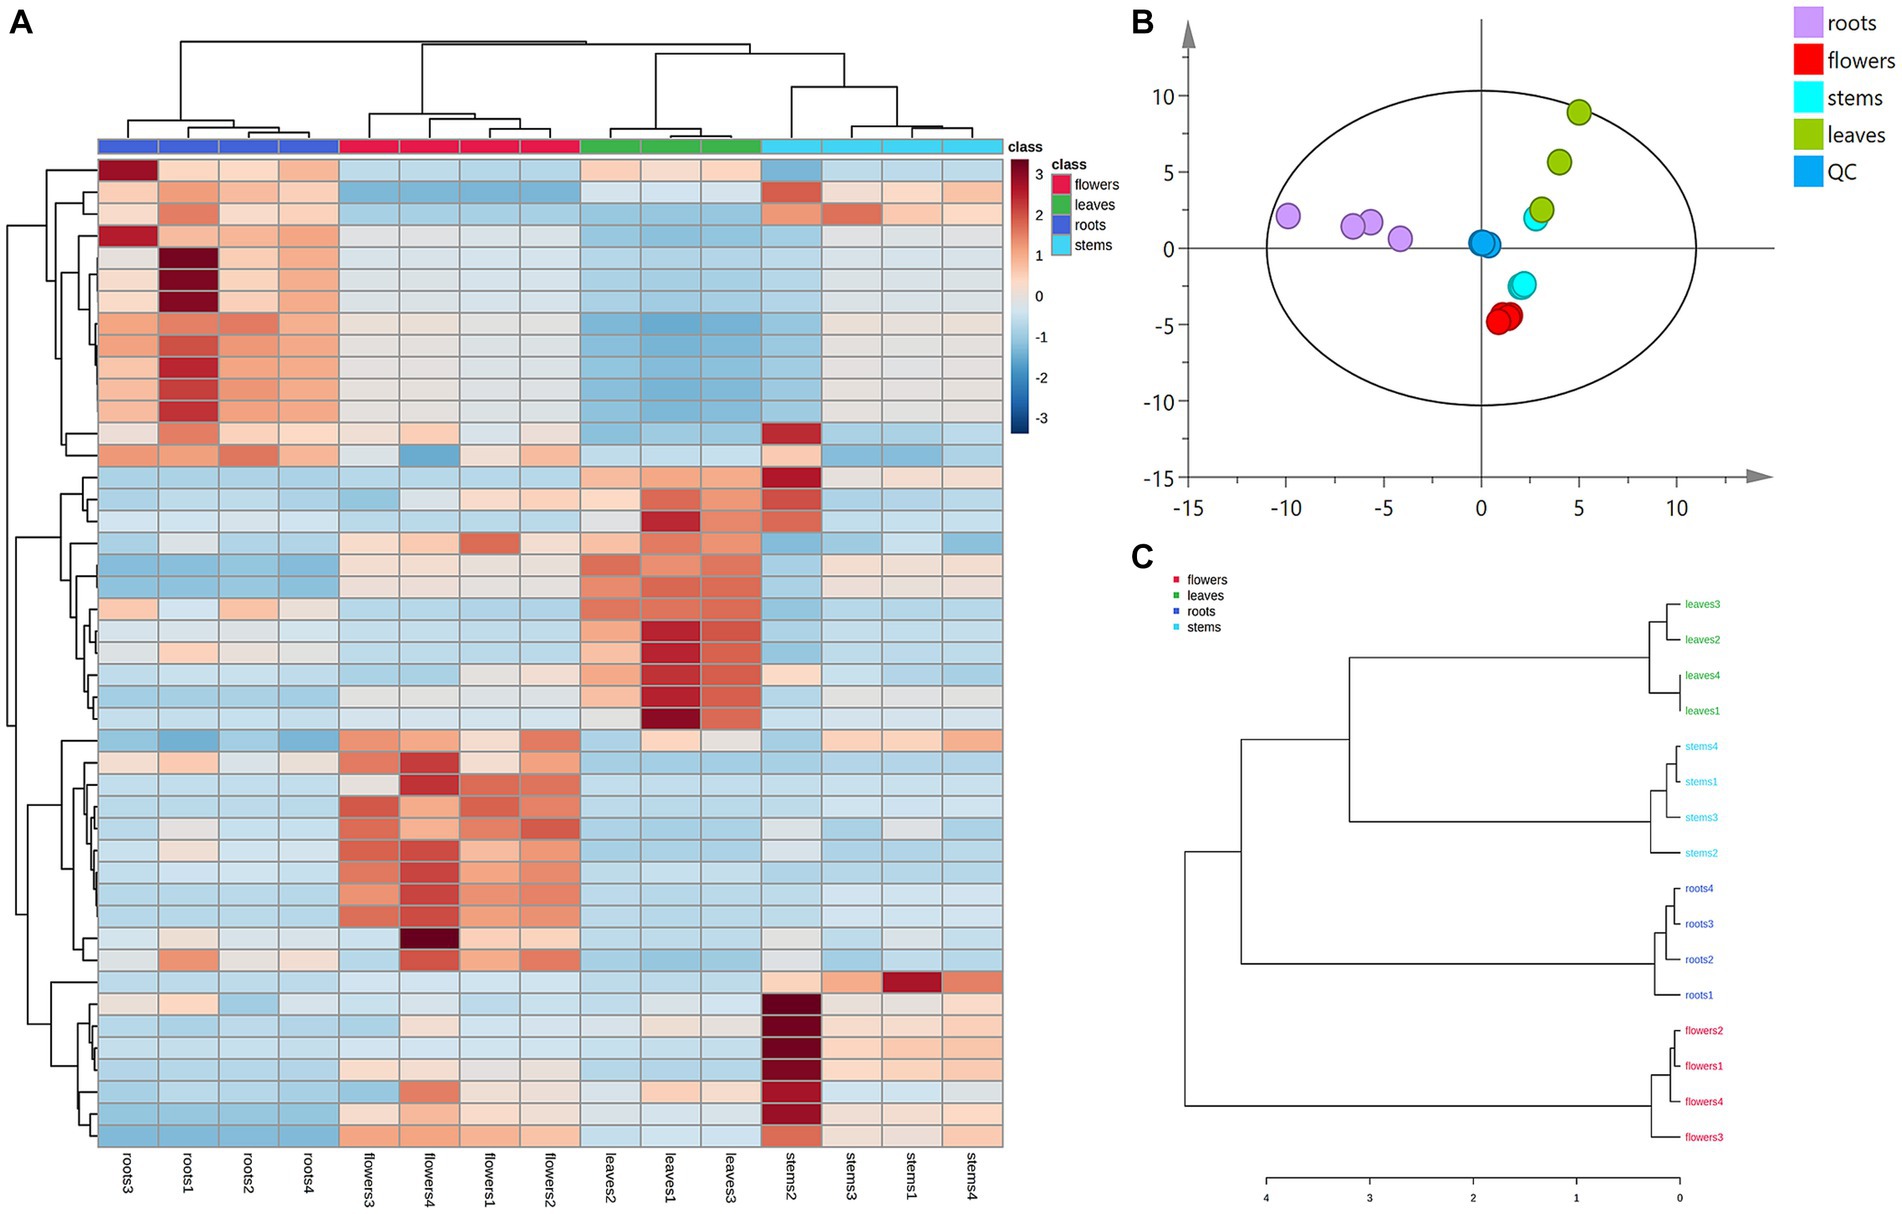
Figure 5. Chemometric analysis for discrimination of volatile compounds in different parts (roots, flowers, stems, leaves) of D. nervosa. (A) Pearson’s rank correlation coefficient of different parts. (B) Discriminated by PCA. (C) Discriminated by HCA.
To further clarify the variations between different parts, the non-medicinal parts were compared with roots for OPLS-DA analysis to find marker compounds representing the difference between groups, and heat maps were generated from the relative peak area of different metabolites to visualize the differences in abundance between different parts of D. nervosa.
Heatmaps were generated from non-repetitive differential compounds (Figure 6A), consisting of 3 monoterpenes, 1 sesquiterpene, and 10 fatty acid and its esters, which were among the 13 differential metabolites identified in various parts. Specifically, the R/F comparative group had 3 differential metabolites, R/S had 2, and R/L had 8 (Supplementary Table S2). The monoterpenes were mainly distributed in stems, while the fatty acids were highly expressed in roots and flowers.
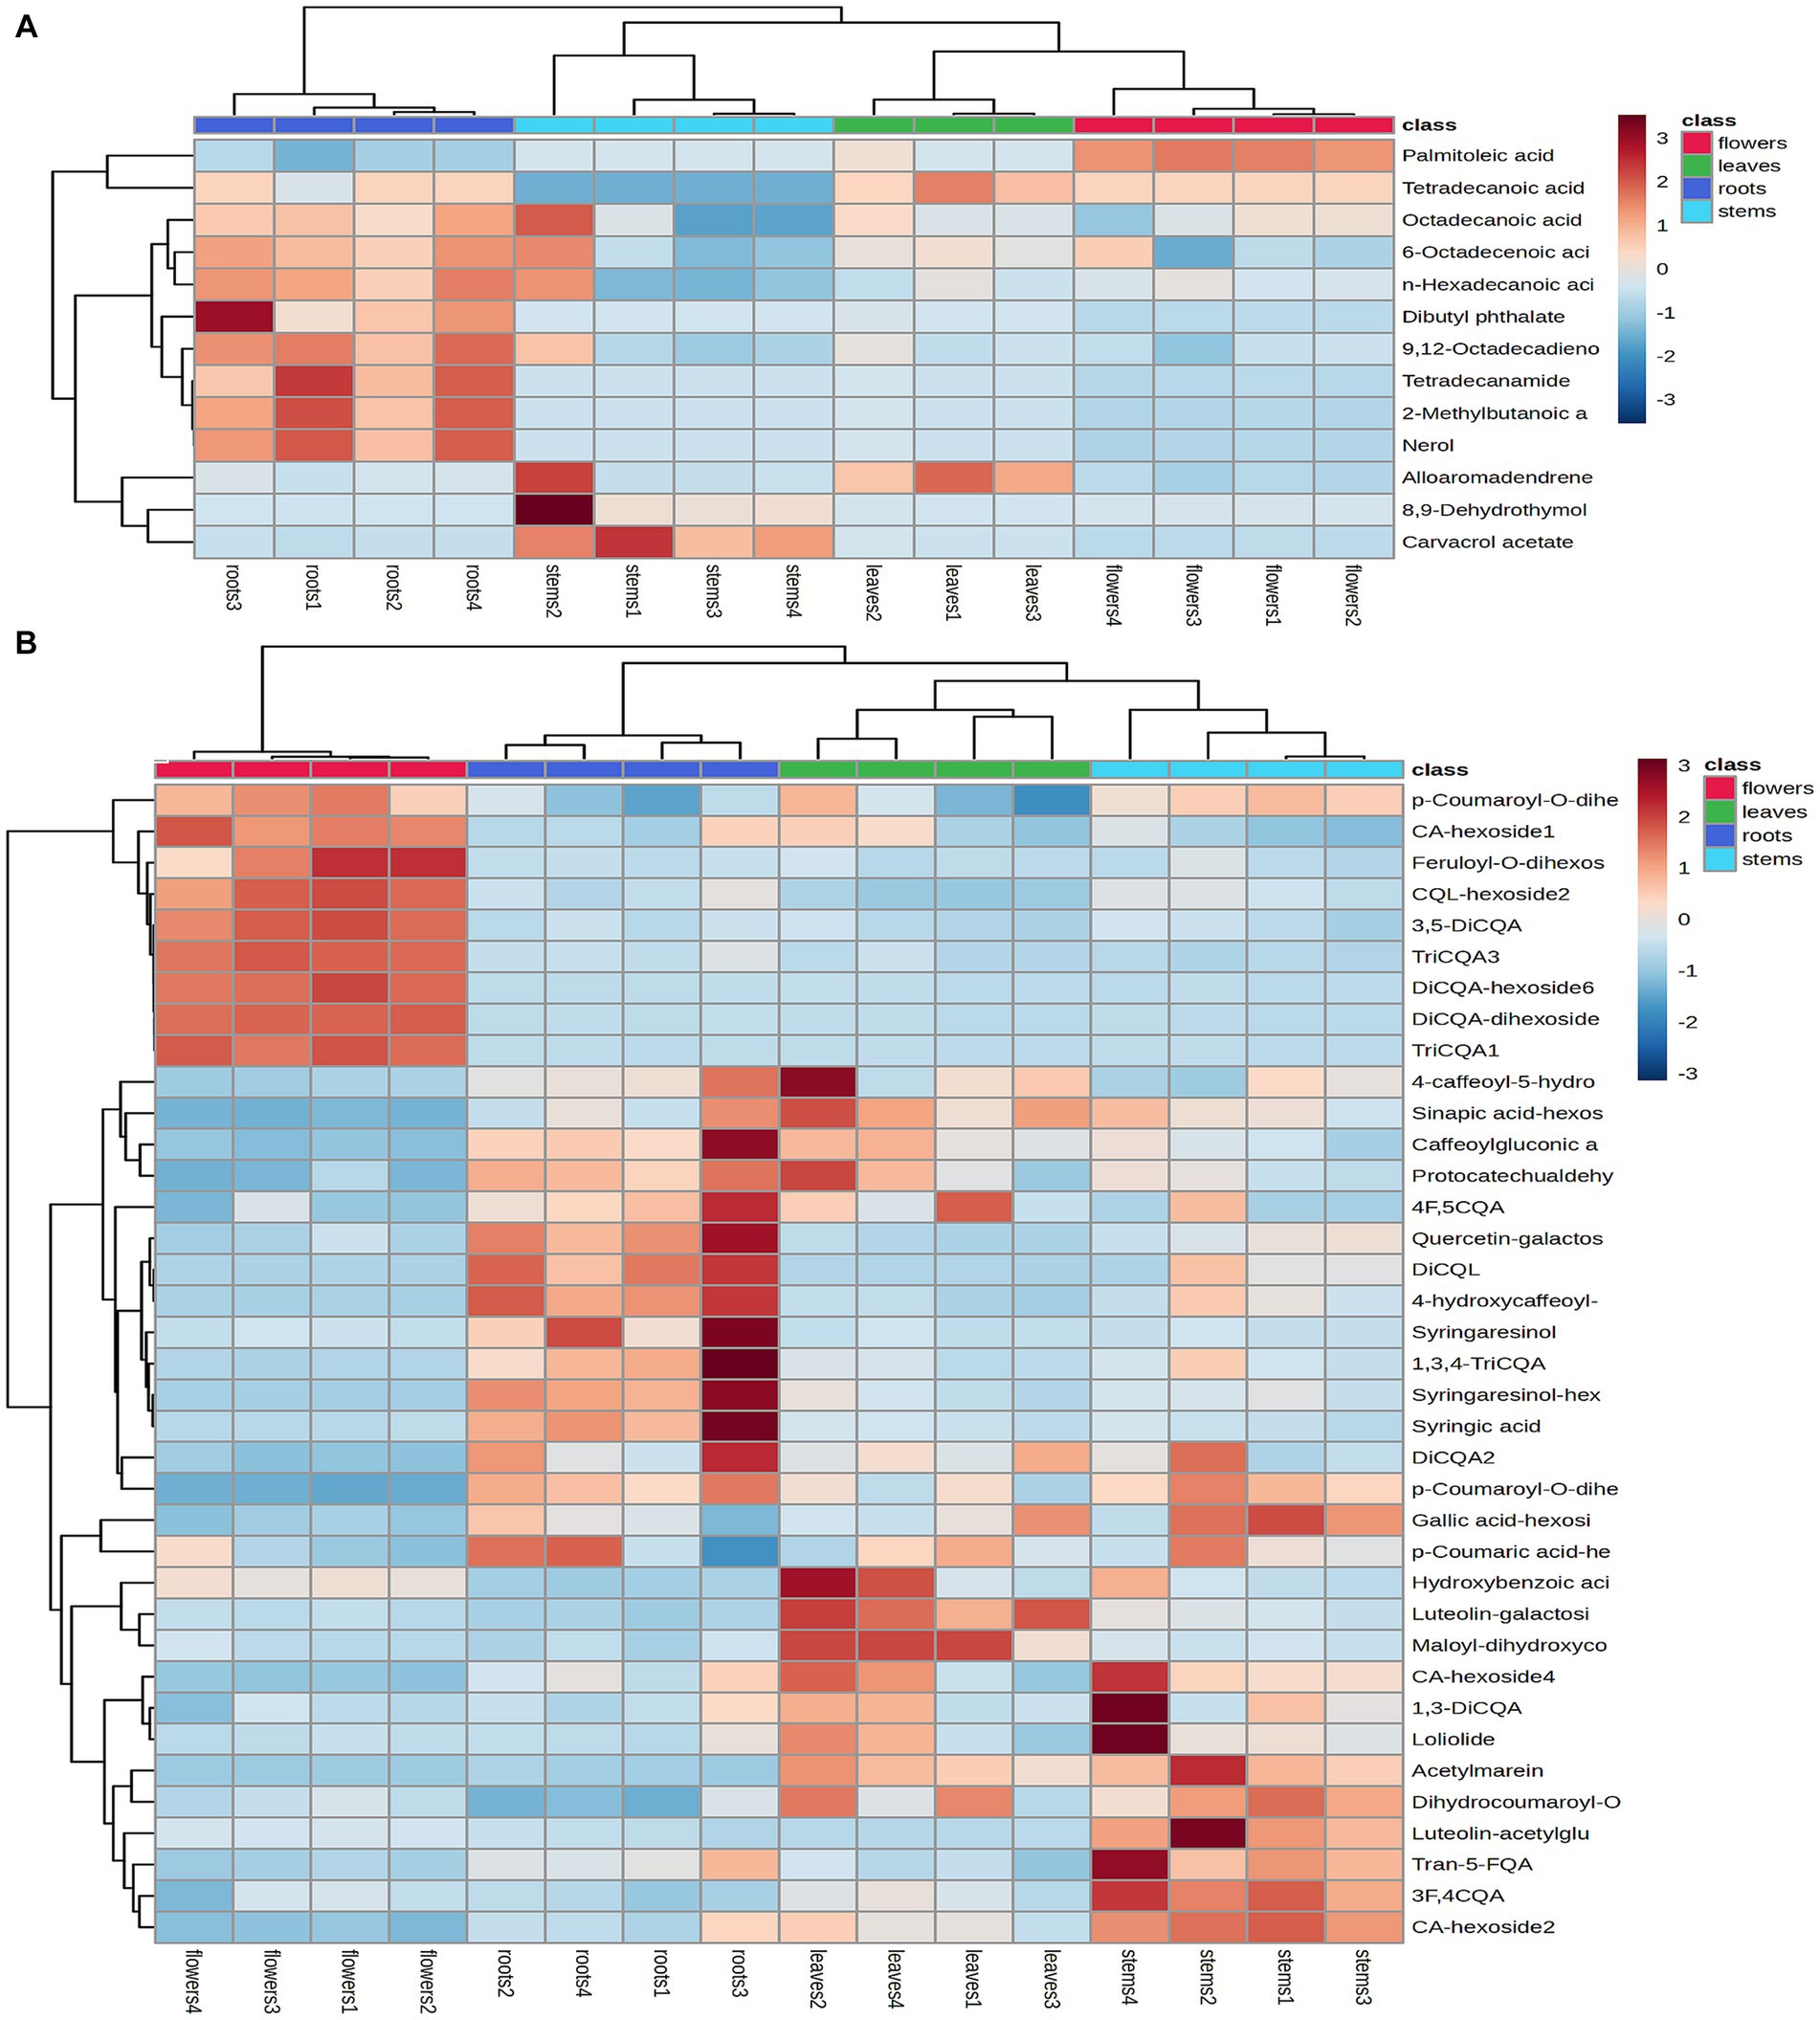
Figure 6. Heatmap of the identified differential metabolites in the volatile compounds (A) and non-volatile compounds (B). Heatmap generated by hierarchical Pearson clustering of different metabolites in four subsamples based on mean values, rows represent different metabolites and columns represent samples. Color comparison plot based on relative amounts of metabolites.
A total of 74 differential metabolites were identified using UPLC-Q-Orbitrap HRMS. The result included 23 differential metabolites in the R/F comparative group, 19 in R/S and 18 in R/L (Supplementary Table S3; Figures 7A–F). Thirty-two were non-repetitive differential compounds, including 13 caffeoylquinic acids, 3 feruloylquinic acids, 4 flavonoids, 4 hydroxybenzoic acids, 2 lignans, 1 coumarin, 9 other hydroxycinnamic acids and 1 other. Among them, 37 candidate marker compounds were screened out, which could suggest a remarkable discrimination capability between different parts of D. nervosa (Supplementary Table S3 and Figure 6B).
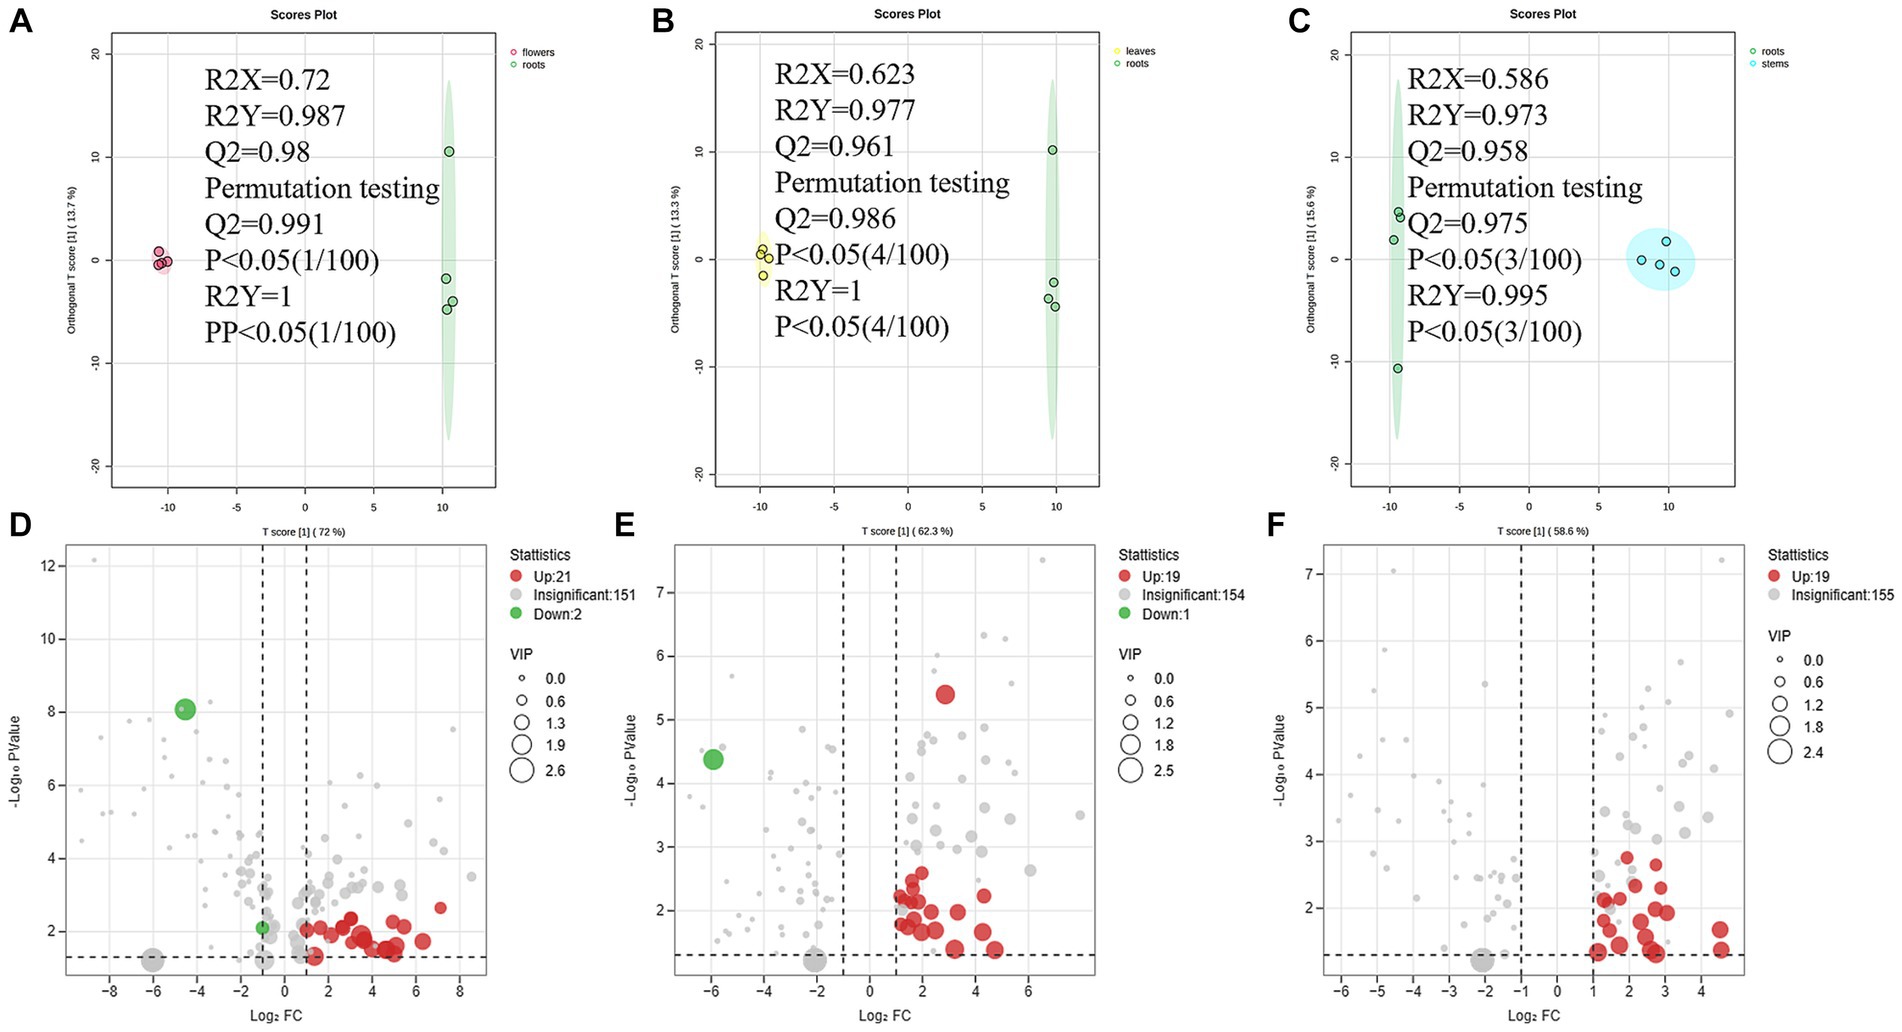
Figure 7. (A–C) The OPLS-DA plot between different comparison groups. (D–F) The Volcano plots of metabolites of different comparison groups.
3.4 Biological activity of different parts
Excessive production of free radicals can result in oxidative stress, which is strongly linked to the onset of chronic inflammation and degenerative disorders such as cardiovascular diseases, cancers, and autoimmune diseases. Conversely, dietary antioxidants have the potential to diminish the likelihood of encountering these ailments (36). The present study suggested that extracts of D. nervosa may serve as natural dietary antioxidants for health promotion, and the roots, flowers, stems and leaves may have significantly different radical scavenging properties. The DPPH, ABTS, and FRAP assays were utilized to assess the antioxidant activity of various parts. Significant variations were observed between the medicinal and non-medicinal sections, with the flowers and roots displaying the highest scavenging activity, followed by the stems, while the leaves exhibited the lowest activity (Table 2). The activity of DPPH was stems < leaves < roots< flowers, and the rise of ABTS and FRAP values were leaves < stems < roots< flowers, which may be explained by the different reaction mechanisms of the ABTS, DPPH, and FRAP.
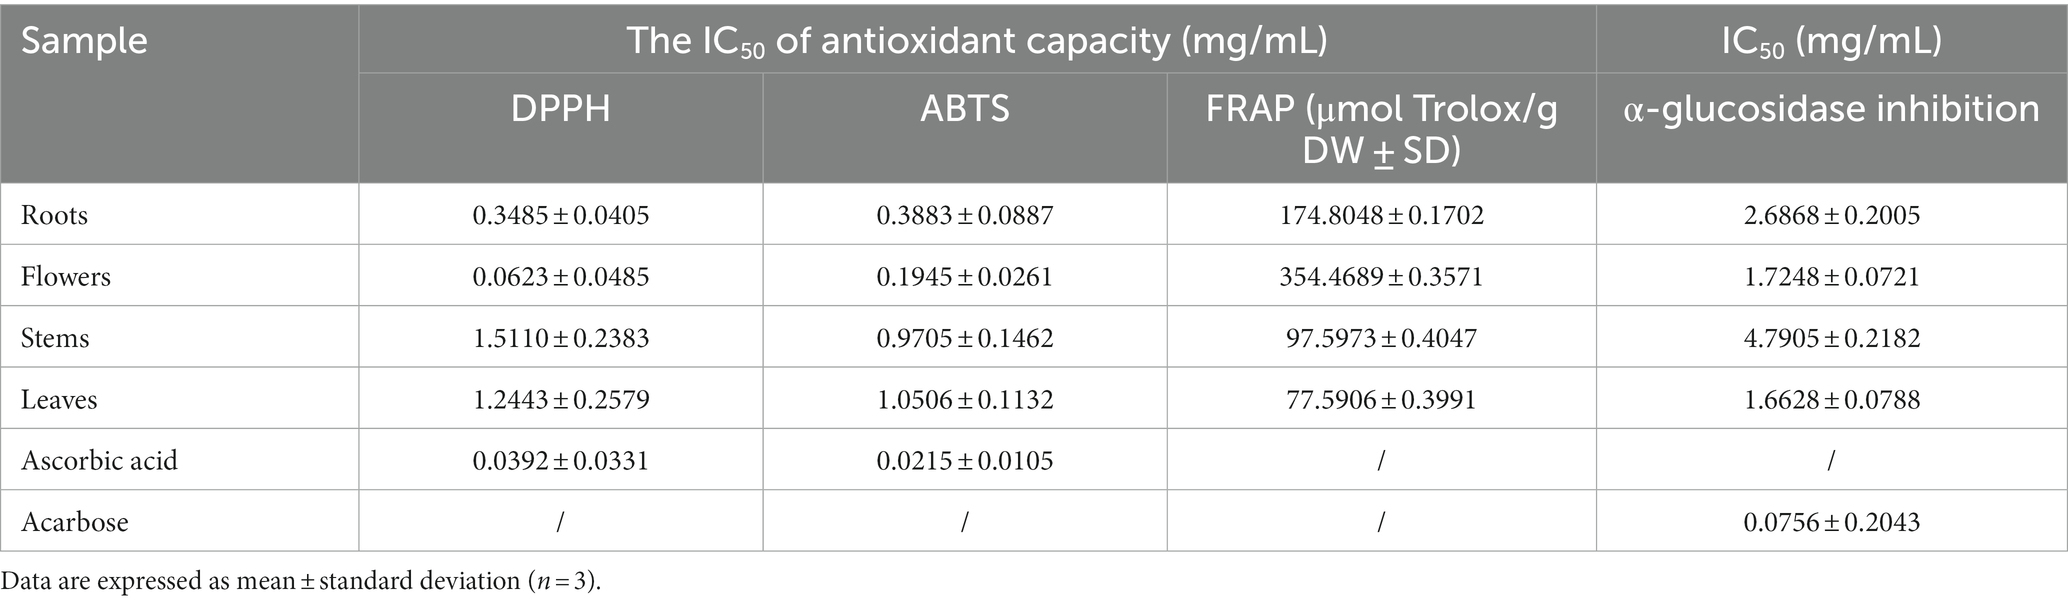
Table 2. Biological activity of different parts, results expressed in crude drug weight (DW) concentration.
These findings indicated that the changes in biological activity were pronounced among various plant parts. These variations in bioactivity can be attributed to the differences in the chemical composition of the extracts obtained from different parts. Multivariable models can effectively demonstrate the predictive potential of metabolomic analysis for antioxidant activity and determine which group of metabolites is most responsible for this activity (37). To understand the correlation of constituents, samples were submitted to Pearson’s correlation analysis (Figure 8A). The IC50 values of DPPH, ABTS, and FRAP scavenging activities showed a mainly positive correlation with caffeoylquinic acids, feruloylquinic acids, p-coumaroylquinic acids, and their derivatives (since IC50 values are inverse to antioxidant levels). Furthermore, Pearson’s correlation analysis was used to show the contribution of the main differential metabolites (including diCQA and triCQA) to the antioxidant activity (Figure 8B). CQAs have gained recognition for their ability to perform as antioxidants, reduce inflammation and prevent diabetes. Previous research has shown that the unique molecular structures of these compounds, namely the presence of five active hydroxyl groups and one carboxyl group, contributed to their natural antioxidant properties. The phenolic hydroxyl structure readily reacted with free radicals to produce antioxidant hydrogen radicals that effectively scavenge hydroxyl radicals and superoxide anions, demonstrating their potent antioxidant activity (38). The contents of caffeoylquinic acids and flavonoids were more abundant in the flowers (Figure 3), which might explain the better antioxidant activity of the flowers. In addition, hydroxyl (OH) has a positive effect on the antioxidant properties of phenolic acids, and the relationship between the antioxidant properties of phenolic acids and the number of hydroxyl groups was listed as follows: trihydric phenolic acid > dihydroxyl > mono-hydroxyl (39), and the highest level of correlation between the main metabolites and the antioxidant activity was observed in triCQAs (Figure 6B), which were the most abundant in the flowers and roots.
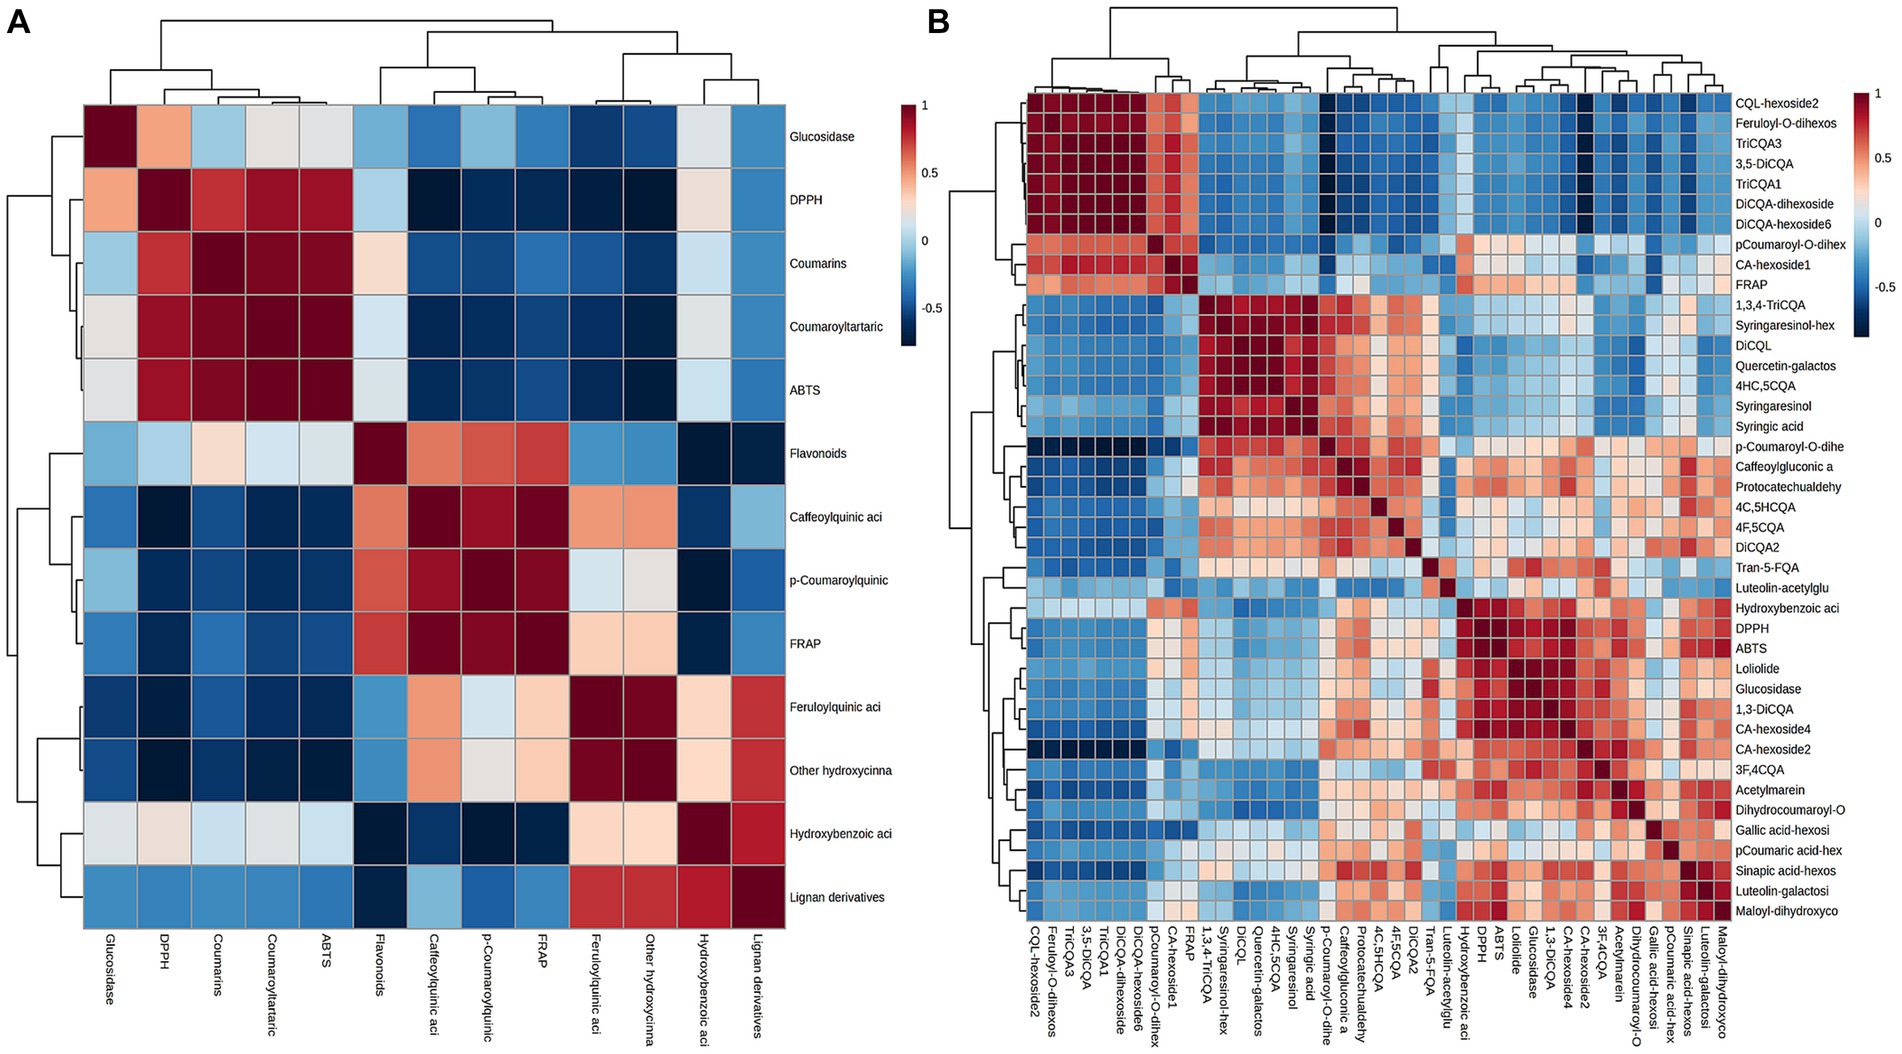
Figure 8. (A) Pearson’s correlation matrices between the IC50 values of DPPH, ABTS, FRAP and α-glucosidase inhibitory scavenging activities and the different types of metabolites in D. nervosa. (B) Pearson’s correlation matrices between the IC50 values with main differential metabolites.
α-Glucosidase inhibitors slowed the release of glucose from dietary carbohydrates, helping to lower postprandial blood glucose levels, and slow the development of diabetes (40). In our work, the hypoglycaemic activities of different parts were assessed by α-glucosidase inhibition assay. It was found that the flowers and leaves extracts exhibited more potent inhibitory activity than roots extracts (as medicinal parts) (Table 2). Particularly, apart from the quinic acids, the IC50 values of α-glucosidase inhibition showed a positive relationship with the amount of flavonoids. Flowers and leaves are richer in flavonoids compared to roots and stems (Figure 6B). It has been reported about the α-glucosidase inhibitory activity of flavonoids (41), and the variability in the results of this study could be due to the difference in the flavonoid contents.
As mentioned previously, caffeoylquinic acid and flavonoids were found to be significantly enriched markers in flowers, suggesting that they may be the main reason for the higher antioxidant activity of this part of the plant. It shows that extracts of D. nervosa can be an important source for supply chains in the cosmetic, pharmaceutical and medical industries. In addition, it can be used to produce innovative functional products such as dietary supplements (e.g., coffee supplements), which are receiving a lot of attention for their ability to promote weight loss (42). Roots are the most commonly used ethnobotanical resource and flowers are usually discarded as industrial waste. However, according to research, flowers appear to be a medicinal and functional food with more promising results.
4 Conclusion
In summary, this study firstly presented the metabolic profiling of flowers, roots, stems and leaves of D. nervosa. A total of 174 non-volatile compounds were identified of various parts by UPLC-Q-Orbitrap-HRMS including hydroxycinnamic acids and derivatives, flavonoids, etc. Forty-five volatile compounds were characterized by GC-MS, including monoterpenes, sesquiterpenes, fatty acids, etc. UPLC-Q-Orbitrap-HRMS and GC-MS combined with multivariate data analysis were able to identify the chemical markers of the samples. It can be seen that there are significant differences in the chemical profile of four parts of the herb. By evaluating the activities of four parts, flowers and roots have the strongest antioxidant activity, while leaves and flowers have exhibited significant α-glucosidase inhibitory activity. This is related to the differences in the metabolites present in different parts. Generally speaking, the difference between different parts can be reflected in the different metabolites detected in the extracts. The identified activity-related chemical markers, which were observed to be concentrated in valuable functional chemical components, can serve as a valid perspective to evaluate the value of different parts of D. nervosa (including waste resources like flowers, stems and leaves). Besides, the non-medicinal fraction of D. nervosa (especially the flowers) is a larger and cheaper alternative medicinal source than the roots. The present research provides valuable evidence on the molecular basis and pharmacological activities of different parts of D. nervosa, facilitating its application in the food chemistry and pharmaceutical industries. However, as the roots have been used as a spice, it is essential to assess the in vivo antioxidant and toxicological profiles of other partial extracts as sources of dietary antioxidants for human health, which is an important step in establishing safety limits.
Data availability statement
The UPLC-Q-Orbitrap HRMS datasets presented in this study can be found in online repositories. The names of the repository can be found at: https://figshare.com/s/172f5b02e8b10b96d714.
Author contributions
QZ: Methodology, Writing – original draft. YL: Formal analysis, Writing – review & editing. SL: Visualization, Writing – review & editing. XH: Writing – review & editing. RG: Funding acquisition, Resources, Writing – review & editing.
Funding
The author(s) declare financial support was received for the research, authorship, and/or publication of this article. This research was funded by National Natural Science Foundation of China (Grant number: 82274208) and Drug Administration of Sichuan Province (510201202102305).
Acknowledgments
The authors also thank the reviewers for their helpful critical comments and advice to improve the manuscript.
Conflict of interest
The authors declare that the research was conducted in the absence of any commercial or financial relationships that could be construed as a potential conflict of interest.
Publisher’s note
All claims expressed in this article are solely those of the authors and do not necessarily represent those of their affiliated organizations, or those of the publisher, the editors and the reviewers. Any product that may be evaluated in this article, or claim that may be made by its manufacturer, is not guaranteed or endorsed by the publisher.
Supplementary material
The Supplementary material for this article can be found online at: https://www.frontiersin.org/articles/10.3389/fnut.2023.1301715/full#supplementary-material
References
1. Cheng, X-R, Ma, J-H, Amadou, I, Zhao, W, Chen, Y-Y, Zhang, C-X, et al. Electrophilic components from Xiaoheiyao (rhizomes of Inula nervosa wall.) alleviate the production of heterocyclic aromatic amines via creatinine inhibition. Food Chem. (2023) 404:134561. doi: 10.1016/j.foodchem.2022.134561
2. Cheng, X, Zhao, W, Dong, W, and Le, G. Chemical space charting of different parts of Inula nervosa wall.: upregulation of expression of Nrf2 and correlated antioxidants enzymes. Molecules. (2020) 25:4789. doi: 10.3390/molecules25204789
3. Kostić, AŽ, Milinčić, DD, Gašić, UM, Nedić, N, Stanojević, SP, Tešić, ŽL, et al. Polyphenolic profile and antioxidant properties of bee-collected pollen from sunflower (Helianthus annuus L.) plant. LWT. (2019) 112:108244. doi: 10.1016/j.lwt.2019.06.011
4. Li, W, Yang, Y, Wu, J, Jiang, S, Yang, Y, Guo, T, et al. A new labdane diterpenoid glycoside and other constituents from Inula nervosa (Asteraceae) and their chemotaxonomic importance. Biochem Syst Ecol. (2023) 109:104662. doi: 10.1016/j.bse.2023.104662
5. Wang, Z, Ma, X, Shi, S, He, S, Li, J, Wilson, G, et al. Structural characterization and anti-inflammatory activity of a novel polysaccharide from Duhaldea nervosa. Polymers. (2023) 15:2081. doi: 10.3390/polym15092081
6. Cheng, X-R, Tu, P-H, Dong, W-L, Yu, B-T, Xia, S-F, Muskat, MN, et al. Electrophilic thymol isobutyrate from Inula nervosa wall. (Xiaoheiyao) ameliorates steatosis in HepG2 cells via Nrf2 activation. J Funct Foods. (2022) 88:104895. doi: 10.1016/j.jff.2021.104895
7. Chen, J, Zheng, Q, Zheng, Z, Li, Y, Liao, H, Zhao, H, et al. Analysis of the differences in the chemical composition of monascus rice and highland barley monascus. Food Funct. (2022) 13:7000–19. doi: 10.1039/D2FO00402J
8. Liu, L, Zhang, J, Zheng, B, Guan, Y, Wang, L, Chen, L, et al. Rapid characterization of chlorogenic acids in Duhaldea nervosa based on ultra-high-performance liquid chromatography-linear trap quadropole-Orbitrap-mass spectrometry and mass spectral trees similarity filter technique. J Sep Sci. (2018) 41:1764–74. doi: 10.1002/jssc.201701047
9. Cai, W, Li, K, Xiong, P, Gong, K, Zhu, L, Yang, J, et al. A systematic strategy for rapid identification of chlorogenic acids derivatives in Duhaldea nervosa using UPLC-Q-Exactive Orbitrap mass spectrometry. Arab J Chem. (2020) 13:3751–61. doi: 10.1016/j.arabjc.2020.01.007
10. Spaggiari, C, Righetti, L, Spadini, C, Annunziato, G, Nsanzurwimo, A, Cabassi, CS, et al. Metabolite profiling and bioactivities of leaves, stems, and flowers of Rumex usambarensis (Dammer) Dammer, a traditional African medicinal plant. Plan Theory. (2023) 12:482. doi: 10.3390/plants12030482
11. Mahana, A, Hammoda, HM, Harraz, FM, and Shawky, E. Metabolomics combined to chemometrics reveals the putative α-glucosidase and α-amylase inhibitory metabolites of ground cherry (Physalis pruinosa L.). Food Res Int. (2022) 161:111903. doi: 10.1016/j.foodres.2022.111903
12. Ouyang, H, Li, J, Wu, B, Zhang, X, Li, Y, Yang, S, et al. A robust platform based on ultra-high performance liquid chromatography quadrupole time of flight tandem mass spectrometry with a two-step data mining strategy in the investigation, classification, and identification of chlorogenic acids in Ainsliaea fragrans champ. J Chromatogr A. (2017) 1502:38–50. doi: 10.1016/j.chroma.2017.04.051
13. Jaiswal, R, Müller, H, Müller, A, Karar, MGE, and Kuhnert, N. Identification and characterization of chlorogenic acids, chlorogenic acid glycosides and flavonoids from Lonicera henryi L. (Caprifoliaceae) leaves by LC-MSn. Phytochemistry. (2014) 108:252–63. doi: 10.1016/j.phytochem.2014.08.023
14. Zhang, J, Wang, Z, Li, Y, Liu, Y, Cai, W, Li, C, et al. A strategy for comprehensive identification of sequential constituents using ultra-high-performance liquid chromatography coupled with linear ion trap-Orbitrap mass spectrometer, application study on chlorogenic acids in Flos Lonicerae Japonicae. Talanta. (2016) 147:16–27. doi: 10.1016/j.talanta.2015.09.039
15. Nemzer, B, Abshiru, N, and Al-Taher, F. Identification of phytochemical compounds in Coffea arabica whole coffee cherries and their extracts by LC-MS/MS. J Agric Food Chem. (2021) 69:3430–8. doi: 10.1021/acs.jafc.0c05937
16. Ak, G, Gevrenova, R, Sinan, KI, Zengin, G, Zheleva, D, Mahomoodally, MF, et al. Tanacetum vulgare L.(Tansy) as an effective bioresource with promising pharmacological effects from natural arsenal. Food Chem Toxicol. (2021) 153:112268. doi: 10.1016/j.fct.2021.112268
17. Redeuil, K, Smarrito-Menozzi, C, Guy, P, Rezzi, S, Dionisi, F, Williamson, G, et al. Identification of novel circulating coffee metabolites in human plasma by liquid chromatography-mass spectrometry. J Chromatogr A. (2011) 1218:4678–88. doi: 10.1016/j.chroma.2011.05.050
18. Viacava, GE, Roura, SI, López-Márquez, DM, Berrueta, LA, Gallo, B, and Alonso-Salces, RM. Polyphenolic profile of butterhead lettuce cultivar by ultrahigh performance liquid chromatography coupled online to UV-visible spectrophotometry and quadrupole time-of-flight mass spectrometry. Food Chem. (2018) 260:239–73. doi: 10.1016/j.foodchem.2018.03.151
19. Escobar-Avello, D, Lozano-Castellón, J, Mardones, C, Pérez, AJ, Saéz, V, Riquelme, S, et al. Phenolic profile of grape canes: novel compounds identified by LC-ESI-LTQ-Orbitrap-MS. Molecules. (2019) 24:3763. doi: 10.3390/molecules24203763
20. Rolnik, A, Soluch, A, Kowalska, I, and Olas, B. Antioxidant and hemostatic properties of preparations from Asteraceae family and their chemical composition—comparative studies. Biomed Pharmacother. (2021) 142:111982. doi: 10.1016/j.biopha.2021.111982
21. Wang, Y, Li, L, Ji, W, Liu, S, Fan, J, Lu, H, et al. Metabolomics analysis of different tissues of Lonicera japonica Thunb. Based on liquid chromatography with mass spectrometry. Meta. (2023) 13:186. doi: 10.3390/metabo13020186
22. Che, Y, Wang, Z, Zhu, Z, Ma, Y, Zhang, Y, Gu, W, et al. Simultaneous qualitation and quantitation of chlorogenic acids in Kuding tea using ultra-high-performance liquid chromatography-diode array detection coupled with linear ion trap-Orbitrap mass spectrometer. Molecules. (2016) 21:1728. doi: 10.3390/molecules21121728
23. Clifford, MN, Johnston, KL, Knight, S, and Kuhnert, N. Hierarchical scheme for LC-MS n identification of chlorogenic acids. J Agric Food Chem. (2003) 51:2900–11. doi: 10.1021/jf026187q
24. Goda, MS, Nafie, MS, Awad, BM, Abdel-Kader, MS, Ibrahim, AK, Badr, JM, et al. In vitro and in vivo studies of anti-lung cancer activity of Artemesia judaica L. crude extract combined with LC-MS/MS metabolic profiling, docking simulation and HPLC-DAD quantification. Antioxidants. (2022) 11:17. doi: 10.3390/antiox11010017
25. Hu, L-X, Luo, M-F, Guo, W-J, He, X, Zhou, J, Qiu, X-Y, et al. Quality assessment and antioxidant activities of the blossoms of Inula nervosa wall. J AOAC Int. (2021) 104:818–26. doi: 10.1093/jaoacint/qsaa143
26. Yin, S, Cai, Z, Chen, C, Mei, Y, Wei, L, Liu, S, et al. Comparative study on chemical constituents of medicinal and non-medicinal parts of Flos Abelmoschus manihot, based on metabolite profiling coupled with multivariate statistical analysis. Horticulturae. (2022) 8:317. doi: 10.3390/horticulturae8040317
27. Yang, W, Su, Y, Dong, G, Qian, G, Shi, Y, Mi, Y, et al. Liquid chromatography-mass spectrometry-based metabolomics analysis of flavonoids and anthraquinones in Fagopyrum tataricum L. Gaertn. (tartary buckwheat) seeds to trace morphological variations. Food Chem. (2020) 331:127354. doi: 10.1016/j.foodchem.2020.127354
28. Aziz, N, Khan, MN, Ali, A, Khadim, A, Muhsinah, AB, Uddin, J, et al. Rapid analysis of flavonoids based on spectral library development in positive ionization mode using LC-HR-ESI-MS/MS. Arab J Chem. (2022) 15:103734. doi: 10.1016/j.arabjc.2022.103734
29. Li, Z-H, Guo, H, Xu, W-B, Ge, J, Li, X, Alimu, M, et al. Rapid identification of flavonoid constituents directly from PTP1B inhibitive extract of raspberry (Rubus idaeus L.) leaves by HPLC-ESI-QTOF-MS-MS. J Chromatogr Sci. (2016) 54:805–10. doi: 10.1093/chromsci/bmw016
30. Chen, S, Liu, J, Dong, G, Zhang, X, Liu, Y, Sun, W, et al. Flavonoids and caffeoylquinic acids in Chrysanthemum morifolium Ramat flowers: a potentially rich source of bioactive compounds. Food Chem. (2021) 344:128733. doi: 10.1016/j.foodchem.2020.128733
31. Li, J, Wang, S-P, Wang, Y-Q, Shi, L, Zhang, Z-K, Dong, F, et al. Comparative metabolism study on chlorogenic acid, cryptochlorogenic acid and neochlorogenic acid using UPLC-Q-TOF MS coupled with network pharmacology. Chin J Nat Med. (2021) 19:212–24. doi: 10.1016/S1875-5364(21)60023-7
32. Gavrilova, V, Kajdžanoska, M, Gjamovski, V, and Stefova, M. Separation, characterization and quantification of phenolic compounds in blueberries and red and black currants by HPLC-DAD-ESI-MS n. J Agric Food Chem. (2011) 59:4009–18. doi: 10.1021/jf104565y
33. Han, B, Xin, Z, Ma, S, Liu, W, Zhang, B, Ran, L, et al. Comprehensive characterization and identification of antioxidants in folium Artemisiae argyi using high-resolution tandem mass spectrometry. J Chromatogr B. (2017) 1063:84–92. doi: 10.1016/j.jchromb.2017.08.021
34. Liu, X, Zhang, J, Li, Y, Yao, C, An, Y, Wei, W, et al. In-depth profiling, nontargeted metabolomic and selective ion monitoring of eight chemical markers for simultaneous identification of different part of Eucommia ulmoides in 12 commercial products by UPLC/QDa. Food Chem. (2022) 393:133346. doi: 10.1016/j.foodchem.2022.133346
35. Nešović, M, Gašić, U, Tosti, T, Horvacki, N, Nedić, N, Sredojević, M, et al. Distribution of polyphenolic and sugar compounds in different buckwheat plant parts. RSC Adv. (2021) 11:25816–29. doi: 10.1039/D1RA04250E
36. Tunnisa, F, Nur Faridah, D, Afriyanti, A, Rosalina, D, Ana Syabana, M, Darmawan, N, et al. Antioxidant and antidiabetic compounds identification in several Indonesian underutilized Zingiberaceae spices using SPME-GC/MS-based volatilomics and in silico methods. Food Chem X. (2022) 14:100285. doi: 10.1016/j.fochx.2022.100285
37. Bouzabata, A, Montoro, P, Gil, KA, Piacente, S, Youssef, FS, Al Musayeib, NM, et al. HR-LC-ESI-Orbitrap-MS-based metabolic profiling coupled with chemometrics for the discrimination of different Echinops spinosus organs and evaluation of their antioxidant activity. Antioxidants. (2022) 11:453. doi: 10.3390/antiox11030453
38. Wang, L, Pan, X, Jiang, L, Chu, Y, Gao, S, Jiang, X, et al. The biological activity mechanism of chlorogenic acid and its applications in food industry: a review. Front Nutr. (2022) 9:943911. doi: 10.3389/fnut.2022.943911
39. Naveed, M, Hejazi, V, Abbas, M, Kamboh, AA, Khan, GJ, Shumzaid, M, et al. Chlorogenic acid (CGA): a pharmacological review and call for further research. Biomed Pharmacother. (2018) 97:67–74. doi: 10.1016/j.biopha.2017.10.064
40. Chang, Y, Fan, W, Shi, H, Feng, X, Zhang, D, Wang, L, et al. Characterization of phenolics and discovery of α-glucosidase inhibitors in Artemisia argyi leaves based on ultra-performance liquid chromatography-tandem mass spectrometry and relevance analysis. J Pharm Biomed Anal. (2022) 220:114982. doi: 10.1016/j.jpba.2022.114982
41. Proença, C, Ribeiro, D, Freitas, M, and Fernandes, E. Flavonoids as potential agents in the management of type 2 diabetes through the modulation of α-amylase and α-glucosidase activity: a review. Crit Rev Food Sci Nutr. (2022) 62:3137–207. doi: 10.1080/10408398.2020.1862755
Keywords: antioxidants, novel foods, Duhaldea nervosa, metabolomics, structural identification
Citation: Zhao Q, Li Y, Li S, He X and Gu R (2023) Comparative bioactivity evaluation and metabolic profiling of different parts of Duhaldea nervosa based on GC-MS and LC-MS. Front. Nutr. 10:1301715. doi: 10.3389/fnut.2023.1301715
Edited by:
Leandro De Morais Cardoso, Juiz de Fora Federal University, BrazilReviewed by:
Tushar Dhanani, Florida Agricultural and Mechanical University, United StatesFrancesca Rigano, University of Messina, Italy
Copyright © 2023 Zhao, Li, Li, He and Gu. This is an open-access article distributed under the terms of the Creative Commons Attribution License (CC BY). The use, distribution or reproduction in other forums is permitted, provided the original author(s) and the copyright owner(s) are credited and that the original publication in this journal is cited, in accordance with accepted academic practice. No use, distribution or reproduction is permitted which does not comply with these terms.
*Correspondence: Xiaofeng He, hexiaofeng@cdutcm.edu.cn; Rui Gu, gurui@cdutcm.edu.cn