Evaluation of global Cenchrus germplasm for key nutritional and silage quality traits
 Sultan Singh1*
  Tejveer Singh2* Krishan Kunwar Singh1
  Manoj Kumar Srivastava2 Madan Mohan Das1
  Sanat Kumar Mahanta1
  Neeraj Kumar2 Rohit Katiyar1 Probir Kumar Ghosh1 Asim Kumar Misra1
- 1Plant Animal Relationship Division, ICAR-Indian Grassland and Fodder Research Institute, Jhansi, India
- 2Crop Improvement Division, ICAR-Indian Grassland and Fodder Research Institute, Jhansi, India
Cenchrus is important genera of grasses inhabiting tropical pastures and the Indian grasslands system. Its forage value is well established to sustain nomadic livestock and wildlife. This study deals with the evaluation of the representative set of global Cenchrus germplasm collection with 79 accessions belonging to six species (C. ciliaris, C. setigerus, C. echinatus, C. myosuroides, C. pennisetiformis, and C. biflorus) at flowering stage. Crude protein (CP), neutral detergent fiber (NDF), acid detergent fiber (ADF), cellulose, and lignin values were in the range of 61.1–136, 640–749, 373–490, 277–375, and 35.6–75.50 g kg−1DM, respectively, while sugar contents varied from 11.6 to 101 mg g−1 DM. From the evaluated germplasm, 14 accessions of C. ciliaris having >70 mg g−1 DM sugar contents were selected and further evaluated for protein, fiber, carbohydrate and protein fractions, palatability indices, in vitro CH4 production, and ensiling traits. Protein contents were lower in EC397323 (61.8) and higher in IG96-96 (91.5), while the NDF, ADF, cellulose, and lignin contents varied between 678–783, 446–528, 331–405, and 39.6–62.0 g kg−1DM, respectively. The carbohydrate and protein fractions of selected accessions differed (p < 0.05), and the sugar contents varied (p < 0.05) between 74.6 and 89.6 mg−1g DM. Dry matter intake (DMI) and relative feed value (RFV) of accessions varied (p < 0.05) and were in the range of 1.53–1.77% and 58.2–73.8 g kg−1 DM, respectively. The total digestible nutrients (TDNs), digestible energy (DE), and metabolizable energy (ME) of selected accessions varied between 362–487 g kg−1 DM, 6.62–8.90, and 5.42–7.29 Mj kg−1 DM, respectively. In vitro gas and CH4 production (24 h) varied (p < 0.05) between 73.1 to 146 and 7.72 to 21.5 ml/g, respectively, while the degraded dry matter (g kg−1 DM) and CH4 (ml/g DDM) ranged between 399–579 and 17.4–47.2, respectively. The DM contents at ensiling, silage pH, and lactic acid contents of accessions differed (p < 0.05) and ranged between 185–345 g kg−1 DM, 5.10–6.05, and 1.39–23.3 g kg−1 DM, respectively. Wide genetic diversity existed in germplasm and selected C. ciliaris accessions for protein fiber, energy, sugar, and other nutritional traits. Silage prepared from EC397366, IG96-96, IG96-50, and EC397323 had pH and lactic acid contents acceptable for moderate to good quality silage of tropical range grasses.
1. Introduction
Grasses constitute up to 48% of all biomass fed to livestock globally (1), and the habitat of natural pastures, rangelands, forests, community lands, etc. serves as one of the major roughage sources for ruminants across the globe and usually constitutes more than 60% of the diet for small ruminants. Tropical grasses are nutritionally poor than temperate grasses, and other cereal forage crops [oat, maize, sorghum, barley, etc., Minson (2)] and their yield and nutritive value vary with species, growth stage, season, soil nitrogen status, and fertilizer application. Grasses are usually fed as green and hay and hardly conserved as silage primarily due to low dry matter, less water-soluble carbohydrate (WSC) contents, higher buffering capacity, and low energy contents (3, 4), which restrict the fermentation process and the subsequent adoption of tropical grass silage technology (5). Success in ensiling of grasses is governed by their readily available carbohydrate, and it is sufficiently high to promote the lactic acid bacteria to produce lactic acid to reduce pH during fermentation for subsequent preservation (6). According to Haigh (7), fresh grass should contain a minimum of 37.0 g kg−1 water-soluble carbohydrates or about 150 g kg−1 WSC on a dry weight basis to prepare good quality silage without silage additives. In addition, fodder species and their developmental stage are also important pre-ensiling factors responsible for silage quality (8).
The Cenchrus genus of the grass family has many species, which can tolerate a wide range of soil types and moisture conditions found globally including Asia, Africa, Australia, and the United States of America (9). In India, Cenchrus is an important component of Dichanthium-Cenchrus-Lasiurus-type grassland cover with coverage of >436,000 km2 (10). Cenchrus species mainly Cenchrus ciliaris (Buffel grass) and Cenchrus setigerus are important pasture grasses in the tropics (11), which are commonly used as a forage grass in India (12). It is drought-tolerant and a well-fertilized C. ciliaris crop may yield up to 24 t DM ha−1 (13) with a yield range of 2–18 t DM ha−1 without fertilizer. At the early flowering stage, hay prepared is of medium quality and rarely made into silage due to lower sugar contents and usually low moisture contents in the semi-arid regions. Efforts have been made to breed its cultivars for improved nutritive value and higher fodder yield, particularly in Australia. In India, a global collection of Cenchrus species are maintained at ICAR-Indian Grassland and Fodder Research Institute, and also, few varieties have been developed for higher biomass (14). However, no research efforts have been put to evolve the varieties for silage making (ensiling properties) but the need for Indian tropical grasslands due to the climatic situation, which favor surplus availability of fodder during monsoon months (mid-September–mid-November) and growth dormancy afterward. Keeping this in view, a multidisciplinary project was initiated on the evaluation of Cenchrus germplasm for higher sugar contents (>70 mg g−1 DM) required to initiate fermentation. So, in the present study, a 79 Cenchrus spp. genotypes were evaluated for yield, protein, and cell wall contents including sugar contents, while the sugar-rich (>70 mg g−1 DM) selected genotypes were evaluated for various nutritional parameters and ensiling properties.
2. Materials and methods
2.1. Location, germplasm maintenance, and multiplication of sugar-rich accessions
The study was carried out at ICAR-Indian Grassland and Fodder Research Institute, Central Research Farm, Jhansi, India (25°31′ N, 78°32′ E; 237 masl). The experimental site has a prevalence of semi-arid climatic conditions with extreme winter (as low as 2°C) and summer (43–46°C) temperatures. The edaphic/soil parameter consisted of deep, moderately well drained, and brown to dark grayish brown with a fine loamy texture. The optimum dose of fertilizers such as nitrogen (80 kg N ha−1), phosphorus (60 kg P/ha), and farmyard manure (30 t ha−1) was applied at sowing. Seeds of 79 accessions of Cenchrus spp. (Cenchrus ciliaris 53, Cenchrus setigerus 20, Cenchrus echinatus 3, Cenchrus myosuroides 1, Cenchrus pennisetiformis 1, and Cenchrus biflorus 1; Supplementary Table 1) representing corsets developed from over 600 global germplasm of Cenchrus spp. maintained in the Institute Gene Bank (14). When seedlings that reached the height of around 30 cm were transplanted with three checks (cv. IGFRI727, IGFRI3108, and IG-96-83) in an augmented randomized complete block design (15) during the rainy season. Each accession was transplanted in 1 × 3 m plots with 2 rows of plants/plot. Line-to-line and plant-to-plant distances were maintained at 50 × 50 cm, with a 1-m distance between two plots. Out of the 79, 14 accessions of C. ciliaris with >70 mg g−1 DM sugar contents were transplanted in RCBD during the rainy season in three replications. Each accession was planted in 4 × 3 m plots with six rows of plants/plots. Line-to-line and plant-to-plant distances were maintained at 50 × 50 cm with 1-m spacing between two plots.
2.2. Sample collection, processing, and drying
Samples of each accession from Cenchrus germplasm and selected sugar-rich accessions of C. ciliaris were harvested at the flowering stage in the rainy season from each row for nutritional evaluation. Immediately after harvesting, fresh forage yield was recorded using a digital portable balance. For the dry matter (DM) and dry matter yield (DMY), estimation samples were dried at 100°C for 72 h and at 60°C for 72 h for chemical/biochemical estimations (16). Dried samples were stored in the plastic sample containers (Tarson make) after fine grounding through a 1-mm sieve using a Willey mill for further nutritional and in vitro analyses.
2.3. Ensiling of sugar-rich accessions
Samples of IG99-124, IG97-379, IG-97-377, IG97-403, EC397323, IG96-87, EC400605, IG97-378, EC397366, EC397379, CC-14-1, IG96-96, IG96-89, and IG96-50 accessions were harvested in the forenoon (September 2016) and wilted for 2 h. Samples were chaffed (1–1.5 cm) through a manually operated chaffing machine and filled in the plastic containers (25.5 cm long × 13 cm diameter wide 5 kg volume) in triplicate for each accession. The chaffed samples filled were pressed manually with a hand and broad-based wooden rod to exclude as much air as possible, and then, the containers were capped and sealed with adhesive tape for ensiling. After 45 days of ensiling silage, containers were opened and representative samples were analyzed for silage DM, pH, lactic acid, and chemical composition.
2.4. Chemical analyses
2.4.1. Chemical composition
Dry matter (930.15), N (976.05), ether extract (EE, 920.39), and ash (932.05) contents of Cenchrus genotypes and selected sugar-rich accessions were determined as per the standard protocol of AOAC (17). The obtained nitrogen values were multiplied by 6.25 to get CP-values. Samples of neutral detergent fiber (NDF), acid detergent fiber (ADF), cellulose, and lignin (sa) were estimated sequentially (18) using the fiber analyzer (Fibra Plus FES 6, Pelican, Chennai, India). Both NDF and ADF were expressed inclusive of residual ash. Heat stable α-amylase and sodium sulfite were not used in NDF determination. Lignin (sa) was determined by the solubilization of cellulose with 72% sulfuric acid in the ADF residue (18). Cellulose was calculated as the difference between ADF and lignin (sa) in the sequential analysis. Hemicellulose was calculated as the difference between NDF and ADF.
2.4.2. Sugar contents
Total sugar contents of germplasm and selected accessions were estimated by the Anthrone method using glucose as standard (19). For this, 100 mg of ground sample (1-mm sieve) was treated with 10 ml of 80% ethanol in the water bath (80°C) for 30 min. The contents were centrifuged at 10,000 rpm for 10 min, the supernatant was collected in a volumetric flask, and the volume was made up to 25 ml. From this, 1 ml was further diluted to 50 ml, from this, 0.25 ml was taken in a tube, and 2.25 ml of distilled water and 5 ml of 0.2% Anthrone reagent were added. The mixture was boiled for 7 min and cooled, and the blue color developed was measured using a UV spectrophotometer (LABINDIA3000) at 630 nm.
2.4.3. Carbohydrate fractions
Cornell Net Carbohydrate and Protein (CNCP) system (20) was used to determine the carbohydrate fractions of sugar-rich C. ciliaris accessions. This system further divides the carbohydrate components into four fractions based on their degradation rate; CA: rapidly degradable sugars; CB1: intermediately degradable starch and pectin; CB2: slowly degradable cell wall; and CC: unavailable/lignin bound cell wall.
Total carbohydrate (tCHO g kg−1 DM) was determined by subtracting CP, EE, and ash contents from 1,000. The difference between NDF and neutral detergent-insoluble protein (NDIP) was used to calculate the structural carbohydrates (SCs), and the difference between tCHO and SC (21) was estimated to calculate the non-structural carbohydrate (NSC). Starch was determined by extracting grass samples in 80% ethyl alcohol to solubilize free sugars, lipids, pigments, and waxes. The residue rich in starch was solubilized with perchloric acid and the extract was treated with anthrone-sulfuric acid to determine glucose calorimetrically using the glucose standard (19).
2.4.4. Protein fractions
The CP fractions of sugar-rich accessions were partitioned into five fractions according to the Cornell Net Carbohydrate and Protein System [CNCPS; (20)] as modified previously (22). These are fraction PA and non-protein N, which are calculated as the difference between total N and true CP N precipitated with sodium tungstate (0.30 M) and 0.5 M sulfuric acid; fraction PB1, buffer-soluble protein, determined as the difference between true protein and buffer-insoluble protein, estimated with borate-phosphate buffer (pH 6.7–6.8) and freshly prepared 0.10 sodium azide solution. Fraction PB2, neutral detergent-soluble protein, was estimated as the difference in buffer-insoluble protein and ND-insoluble protein, whereas fraction PB3, acid detergent-soluble CP, was estimated as the difference between ND-insoluble protein and acid detergent-insoluble CP. Fraction PC is assumed to be indigestible.
Neutral detergent-insoluble protein (NDIP), acid detergent-insoluble protein (ADIP), and non-protein nitrogen (NPN) were determined following the standard method (22). For NDIP and ADIP, samples extracted with neutral detergent and acid detergent solutions, respectively, were analyzed as Kjeldahl N × 6.25 using a semi-auto analyzer (Kel Plus Classic-DX Pelican India). For NPN estimation, samples were treated with sodium tungstate (0.30 M) and filtered, and residual nitrogen was determined by the Kjeldahl procedure. Non-protein nitrogen of the sample was calculated by subtracting residual nitrogen from total nitrogen. Soluble protein (SP) was estimated by treating the samples in borate-phosphate buffer, pH 6.7–6.8, consisting of monosodium phosphate (Na2PO4.H2O) 12.2 g L−1, sodium tetra borate (Na2B4O7.10H2O) 8.91 g L−1, and tertiary butyl alcohol 100 mL L−1and freshly prepared 10% sodium azide solution (23). The N estimated in the residue gives the insoluble protein fraction. The SP was calculated by subtracting the insoluble protein from the total CP.
2.4.5. Gross energy estimation and calculations for DDM, DMI, RFV, and energy
Cenchrus germplasm and selected sugar-rich accessions, dry matter intake (DMI), digestible dry matter (DDM), relative feed value (RFV), total digestible nutrients (TDN), and net energy for different animal functions, i.e., lactation (NEL), gain (NEG), and maintenance (NEM), were calculated using the equations [DMI = 120/NDF; DDM = 88.9–0.779*ADF; RFV = (DDM*DMI)*0.775; TDN = 104.97–(1.302*ADF); NEL =(TDN*0.0245)−0.012; NEG = (TDN*0.029)−1.01; NEM = (TDN*0.029)−0.29] of Undersander et al. (24). Digestible energy (DE, KJ g−1 DM; DE = TDN*0.04409) and metabolizable energy (ME, KJ g−1 DM) values were calculated using the equations of Fonnesbeck et al. (25) and Khalil et al. (26), respectively. Metabolizable energy was calculated as DE × 0.821.
2.5. In vitro incubation
2.5.1. Donor animals and inoculum preparation
Overall, four adult male Jalauni sheep with a mean body weight of 38.7 ± 0.473 kg were used as inoculum donors. These animals were maintained on a sole berseem hay diet and had free access to clean drinking water. Rumen liquor was collected in a pre-warmed thermos from each animal before feeding using a perforated tube from the stomach with the help of a vacuum pressure pump. Rumen liquor collected from each animal was filtered through four layers of muslin cloth and mixed well to have the composite sample, kept at 39°C in a water bath, and gassed with CO2 till used for mixing with incubating buffer media.
In vitro gas production was estimated as per the pressure transducer technique (27). The incubation medium was formulated by sequential mixing of buffer solution (NH4HCO3 and NaHCO3), macro-mineral solution, micro-mineral solution, and resazurin solution (28). Samples (1.0 g) of air-dry Cenchrus sugar-rich accessions were weighed into three serum bottles (150 ml of capacity). In total, three serum bottles without substrate were used as blank cultures. Sample and control serum bottles were gassed briefly with CO2 before adding 65 ml of medium. Bottles were continuously fluxed with CO2, and then, 3 ml of reducing solution was added to each bottle. The gassing of bottles with CO2 continued till the pink color turned colorless. Before inoculation, the gas pressure transducer was used to adjust the head-space gas pressure in each bottle (to adjust the zero reading on the LED display). Serum bottles were inoculated with 8 ml of ruminal fluid inoculum using a 10-ml syringe. Inoculated bottles were sealed and incubated at 39°C. Samples were incubated in triplicates and gas production (ml) was measured at 24 h of incubation. The whole process was repeated on a different day.
2.5.2. Methane measurements
At 24 h of incubation, methane in total gas was measured from three bottles incubated for each of the Cenchrus accession by gas chromatography (Nucon 5765 Microprocessor controlled gas chromatograph, Okhla, New Delhi, India) equipped with a stainless-steel column packed with Porapak-Q and a Flame Ionization Detector. Gas (1 ml) was sampled from gas produced using a Hamilton syringe and injected manually (pull and push methods of sample injection) into a gas chromatograph calibrated with standard methane and CO2. Methane was also measured from three serum bottles used as blanks for the correction of methane produced from the rumen inoculum. Methane measured was related to total gas to estimate its concentration (29). Short-chain fatty acids (SCFA) were calculated using 24 h gas production as described by Getachew et al. (30). Microbial mass (MBM) and partitioning factor (PF) were calculated as described by Blümmel et al. (31).
2.6. Silage analysis
For DM estimation, 100 g of the fresh silage sample was dried in a hot air oven at 60°C till the constant weight is achieved and then corrected for DM using the equation of Kaiser and Kerr (32) as estimated true DM (%) = 4.686 + (0.89 × oven DM %). For silage pH and lactic acid estimation, a 20 g of fresh silage sample was put in a beaker, and to this, 100 ml of tepid water was added. Beaker was kept in a water bath shaker (30°C) for 30 min, and contents were agitated manually and filtered through filter paper. The filtrate was mixed well, a portion of it was used to measure pH using a digital pH meter (Systronic 360), and the remaining filtrate was used for lactic acid estimation as described by Barker and Summerson (33). For this, 1 ml of extract was added to the tubes and 0.05 ml of 4% CuSO4 and 6 ml of concentrated H2SO4 were added drop by drop with continuous shaking. Tubes were kept in a boiling water bath for 5 min and cooled at room temperature, and then, 0.1 ml of P-hydroxyphenyl reagent was added drop by drop and incubated in a shaker water bath at 30°C for 30 min. The blue color developed was measured at 560 nm using UV-spectrophotometer (LABINDIA3000).
2.7. Statistical analysis
To describe the variability among the accessions, univariate statistics including means and ranges were used, which were obtained for each trait based on the accessions. Data on dry matter yield were subjected to statistical analysis using the descriptive statistics on adjusted means estimated by the R package for augmented design (34). Data were subjected to a one-way analysis of variance of SPSS 17.0 to test the differences between Cenchrus accessions for chemical composition, sugar contents, carbohydrate and protein fractions, energy values, digestibility and in vitro gas and methane production, and silage quality (pH, lactic acid, and DM contents). Variable means were compared for significance (p < 0.05) level using Duncan's multiple-range test (35). Euclidean distance as a measure of dissimilarity and incremental sums of squares as a grouping strategy was utilized for clustering the accessions based on their morphological traits using the “cluster” package of SAS statistical software (36). Dendrograms were constructed based on the fusion level to examine the similarities in the pattern of performance among the accessions.
3. Results
3.1. Biomass and nutritional variability in Cenchrus spp. germplasm
The variance and range showed that sufficient variability exits in germplasm evaluated for DMY, chemical composition (CP, NDF, ADF, cellulose, and lignin), sugar contents, and other nutritional traits (Table 1), and the values for these traits for individual accession are given in Supplementary Table 1. The DMY of evaluated Cenchrus species germplasm varied from 1.85 to 34.27 t/ha; CP, NDF, ADF, cellulose, and lignin contents varied between 61.1–136, 640–750, 370–510, 250–400, and 31.0–97.0 g kg−1 DM, with their mean values of 88.0, 694, 426, 321, and 53.2 g kg−1 DM, respectively. Soluble sugar contents of Cenchrus germplasm varied widely in the range of 11–101mg/g with a mean value of 57.07 mg/g. Mean values of total digestible nutrients (TDNs), digestible energy (DE), metabolizable energy (ME), net energy for lactation, net energy for maintenance, and net energy for the gain of the Cenchrus germplasm were 495 g kg−1 DM, 9.02, 7.41, 4.51, 5.42, and 1.82 Mj/Kg, respectively. The mean values of dry matter intake (DMI), digestible dry matter (DDM), and relative feed values (RFVs) for the Cenchrus germplasm were 1.73%, 553 g kg−1 DM, and 72.75%, respectively. The cluster analysis placed 79 accessions into five clusters (R2 = 0.4). Clusters one and two included single accession each, cluster three included five accessions of C. ciliaris and C. setigerus, cluster four contain 19 accessions of C. ciliaris, C. setigerus, C. echinatus, C. myosuroides, and C. pennisetiformis, and cluster five included 53 accessions of C. ciliaris, C. setigerus, C. echinatus, and C. biflorus (Figure 1).
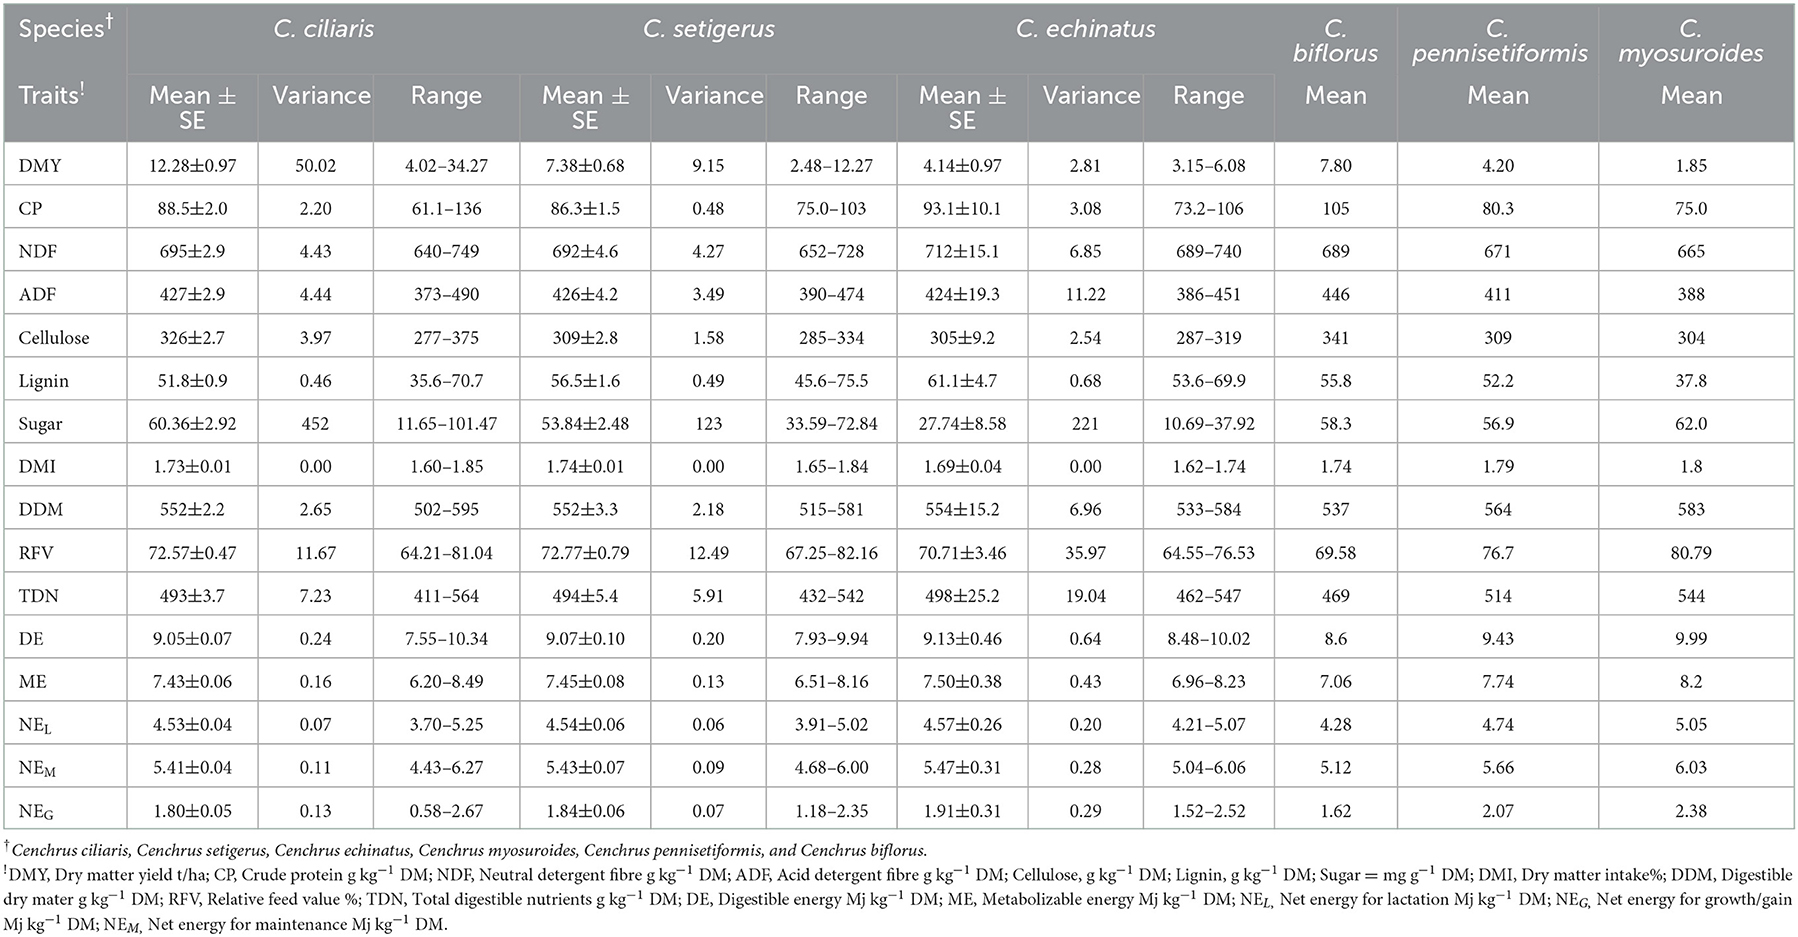
Table 1. Mean performance of Cenchrus species for chemical components and nutritional quality traits.
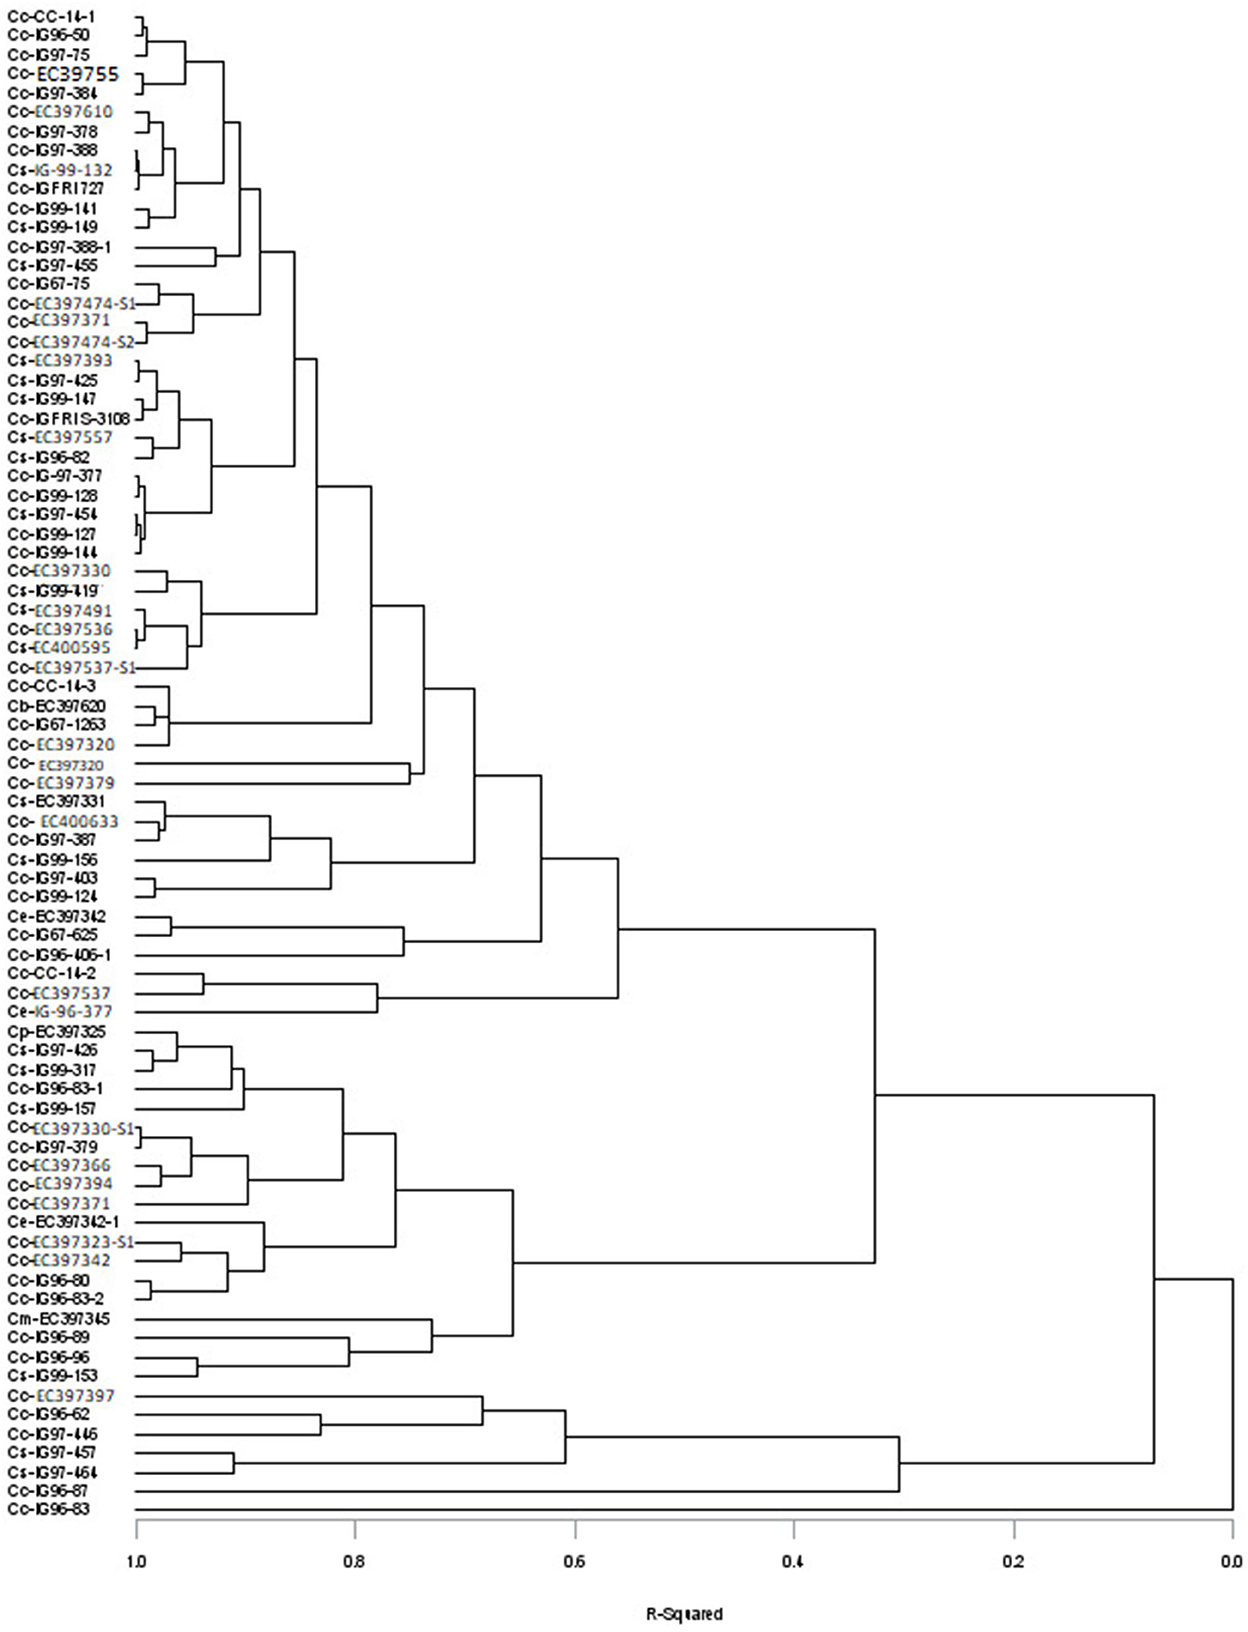
Figure 1. Distribution of different Cenchrus species accessions into different clusters based on nutritional and biochemical traits (Cc, Cenchrus ciliaris; Cs, Cenchrus setigerus; Ce, Cenchrus echinatus; Cm, Cenchrus myosuroides; Cp, Cenchrus pennisetiformis; Cb, Cenchrus biflorus).
3.2. Sugar contents and chemical composition of C. ciliaris accessions
Sugar contents of 14 sugar-rich C. ciliaris accessions, viz. IG99-124, IG97-379, IG-97-377, IG97-403, EC397323, IG96-87, EC400605, IG97-378, EC397366, EC397379, IG96-96, IG96-89, IG96-50, and CC-14-1 were more than 70 mg g−1 DM required for ensiling (Table 2). Sugar contents of accessions differed (p < 0.05) and varied between 74.6 (IG99-127) and 89.6 mg g−1 DM (EC397323). Accessions of CP, NDF, ADF, cellulose, and lignin contents varied (p < 0.05), and their mean values were 76.4, 737, 478, 351, and 49.1 g kg−1 DM, respectively (Table 2). The OM and EE contents of sugar-rich accessions varied (p < 0.05) with mean values of 856 and 20.5 g kg−1 DM, respectively.
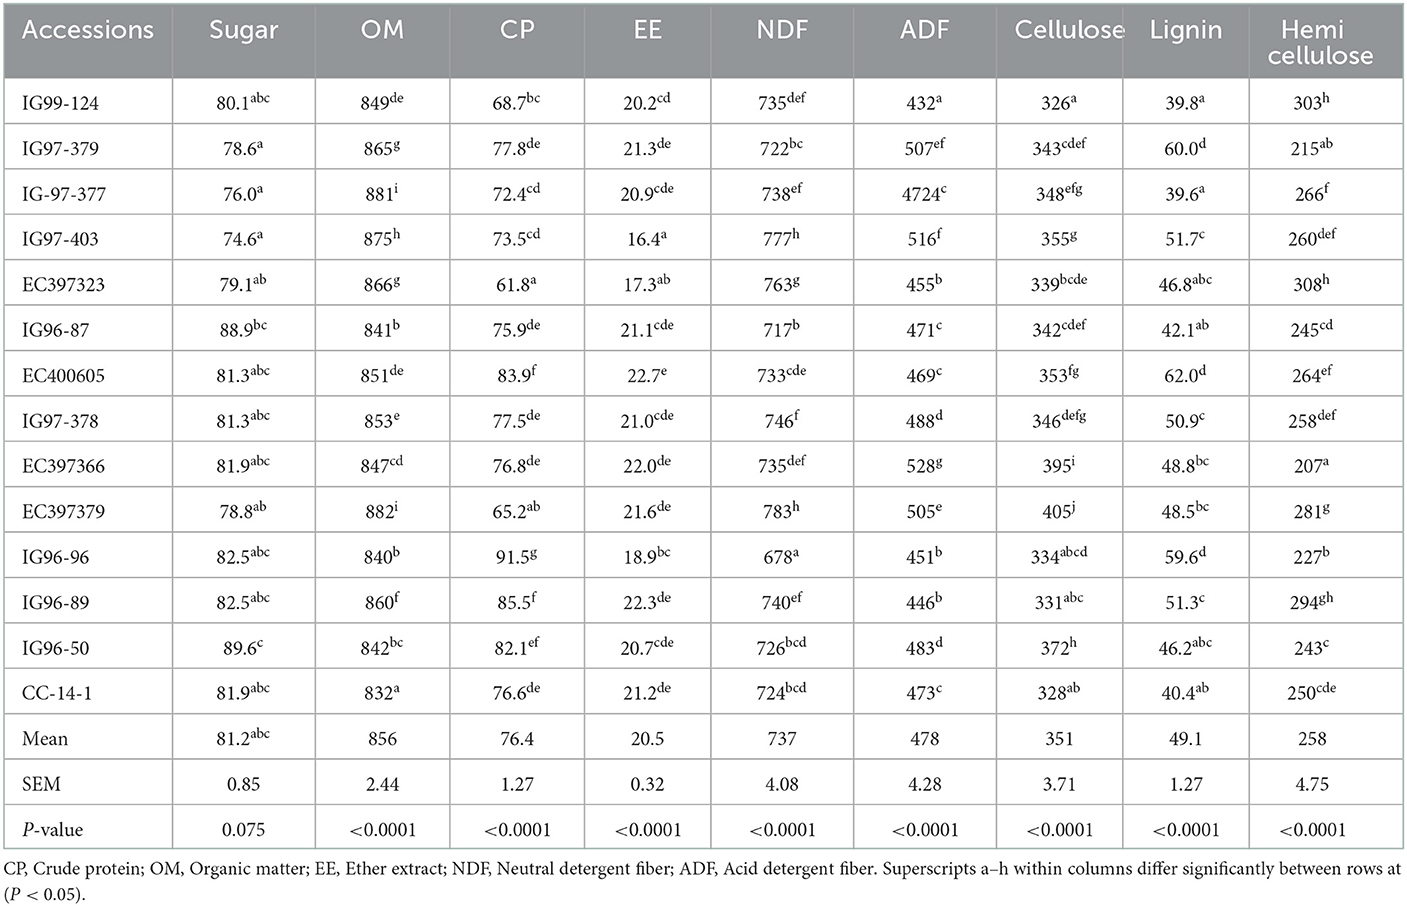
Table 2. Sugar contents (mg g−1DM) and chemical composition (g kg−1 DM) of sugar-rich Cenchrus ciliaris genotypes.
3.3. Protein and carbohydrate fractions of C. ciliaris accessions
Total carbohydrate (tCHO), non-structural carbohydrates (NSCs), and structural carbohydrates (SCs) of C. ciliaris accessions differed (p < 0.05) from 730 to 795, 27.1 to 67.9, and 662 to 765 g kg−1 DM, respectively (Table 3). Similarly, the carbohydrate fractions, namely, CA CB1, CB2, and Cc varied (p < 0.05) across the accessions, and their mean values were 46.5, 56.1, 742, and 155 g kg−1 tCHO, respectively. C. ciliaris accessions protein fractions, viz. PA, PB1, PB2, PB3, and PC differed (p < 0.05) and ranged between 163–425, 172–492, 85.8–206, 44.3–194, and 81.6–152 g kg−1 CP, respectively (Table 4).
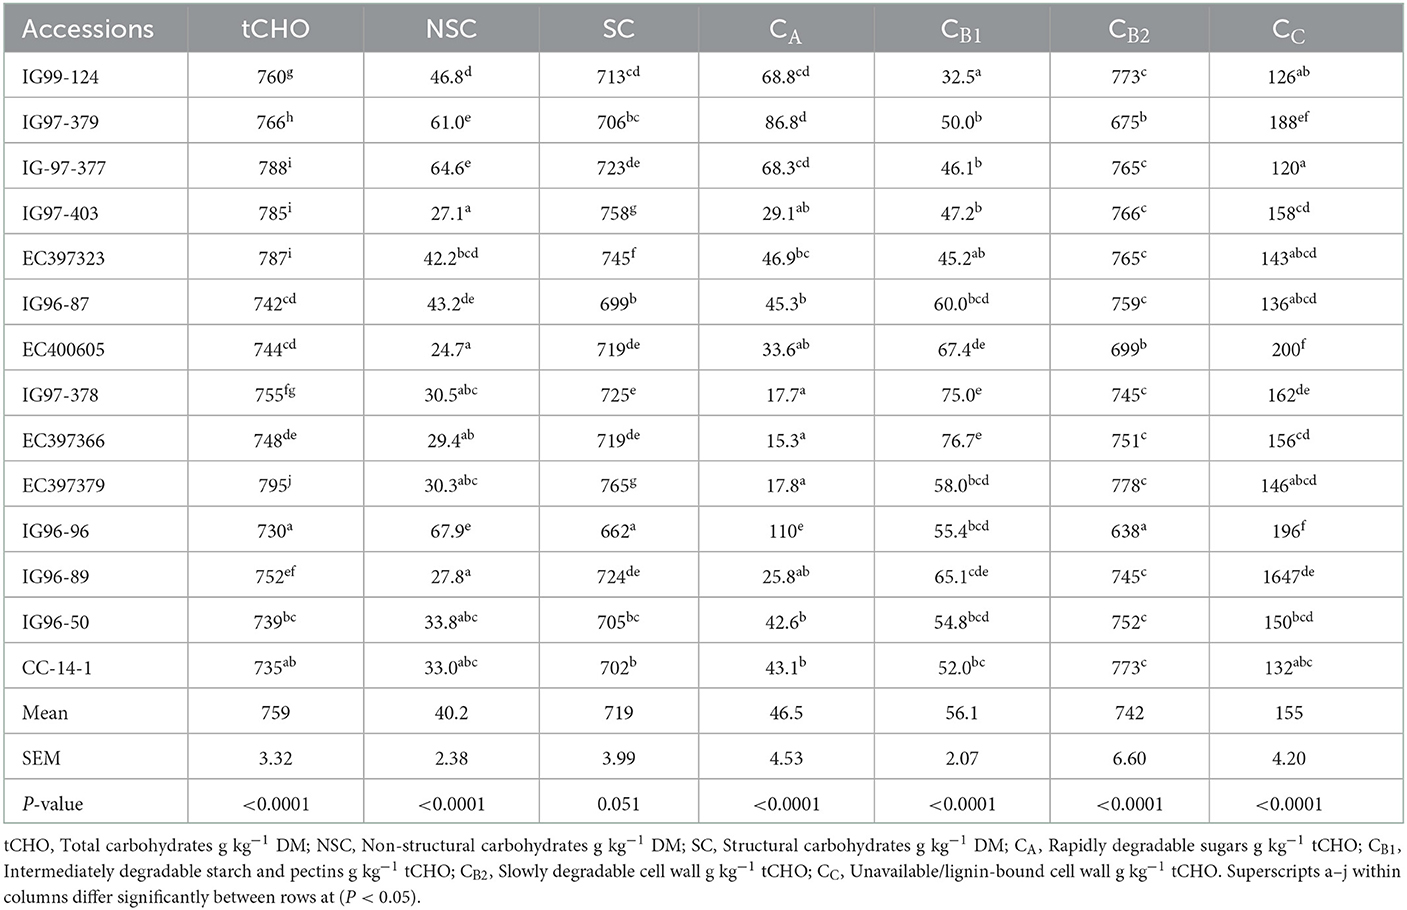
Table 3. Carbohydrate fractions of sugar-rich Cenchrus ciliaris genotypes.
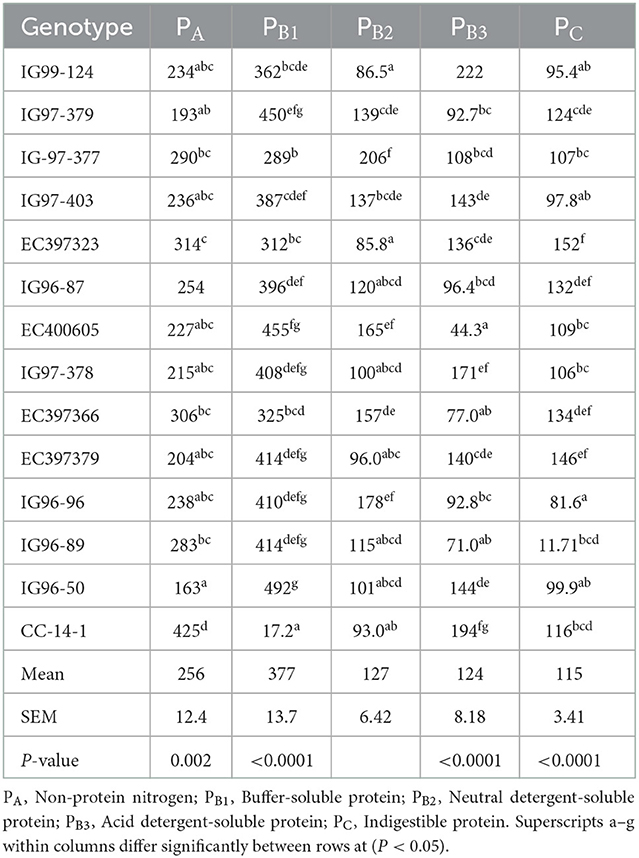
Table 4. Protein fractions (g kg−1 CP) of sugar-rich Cenchrus ciliaris accessions.
3.4. Energy contents of C. ciliaris accessions
Energy contents of sugar-rich C. ciliaris accessions in terms of TDN, DE, and ME differed (p < 0.05), and their mean values were 427 g kg−1 DM, 7.78 Mj kg−1 DM, and 6.42 Mj kg−1 DM, respectively (Table 5). Accessions net energy efficiency for different animal functions, viz. maintenance (NEM), lactation (NEL), and growth (NEG) varied (p < 0.05) from 3.81 to 5.30, 3.19 to 4.43, and 0.16 to 1.66 Mj kg−1 DM, respectively.
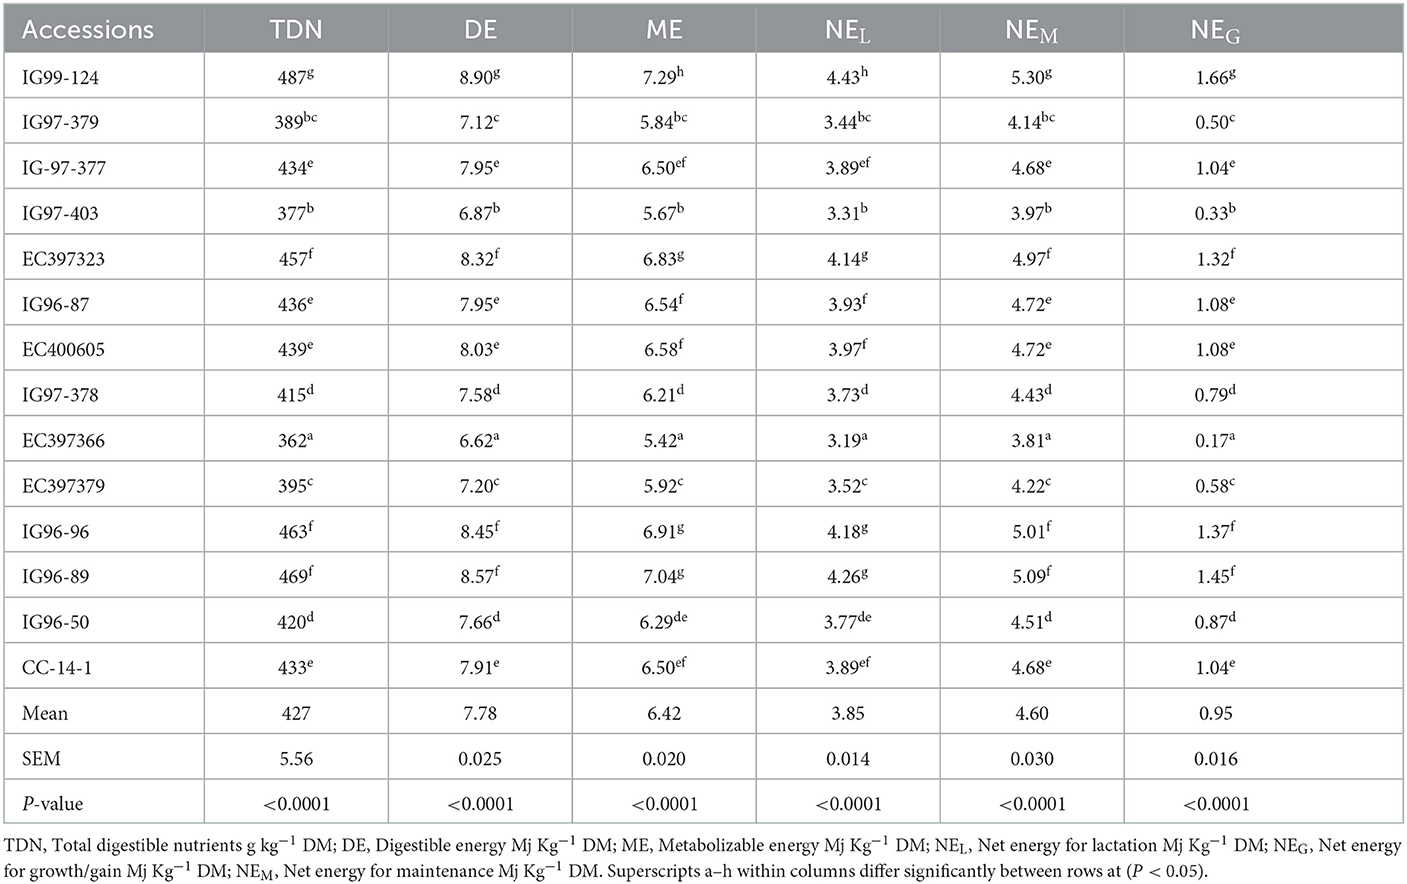
Table 5. Energy contents of sugar-rich Cenchrus ciliaris accessions.
3.5. Palatability attributes of Cenchrus accessions
The DMI, DDM, and RFV for sugar-rich accessions also differed (p < 0.05) and their mean values were 1.63%, 516 g kg−1 DM, and 65.28%, respectively (Table 6).
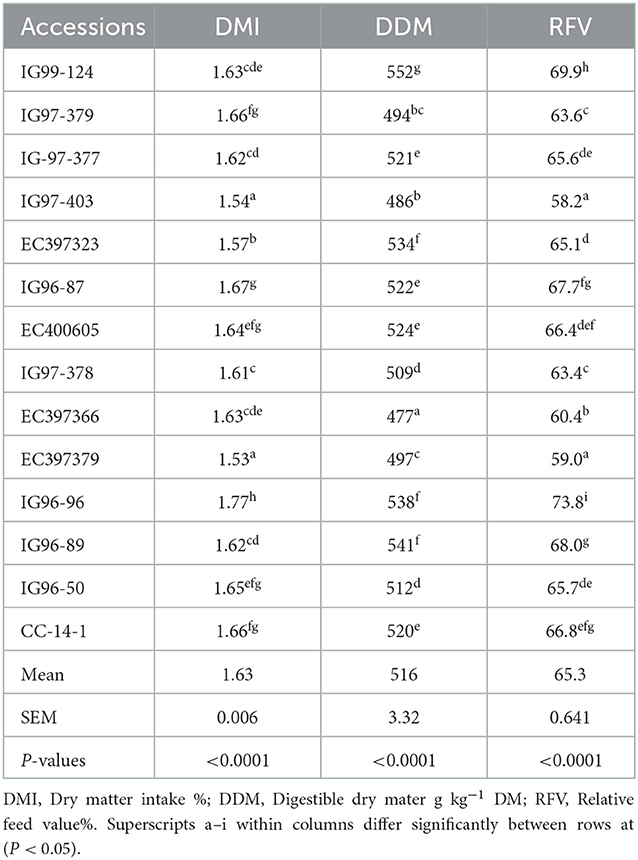
Table 6. Palatability attributes of sugar-rich Cenchrus ciliaris accessions.
3.6. Gas and methane production from sugar-rich Cenchrus accessions
In vitro gas and methane production from C. ciliaris accessions differed (p < 0.05) with the mean values of 108 ml g−1 DM and 14.8 ml g−1 DM, respectively (Table 7). Methane production ml g−1 DDM and DDM (g kg−1 DM) varied (P < 0.05) between 17.4–47.2 and 399–579, respectively, across the accessions. Gas fermentation parameters, namely, partition factor (PF), short-chain fatty acid (SCFA), microbial mass (MBM), and efficiency for microbial mass production (EMBM) varied (p < 0.05) across the accessions. The values of PF and EMBM were highest and SCFA were lowest for accession G96-50.
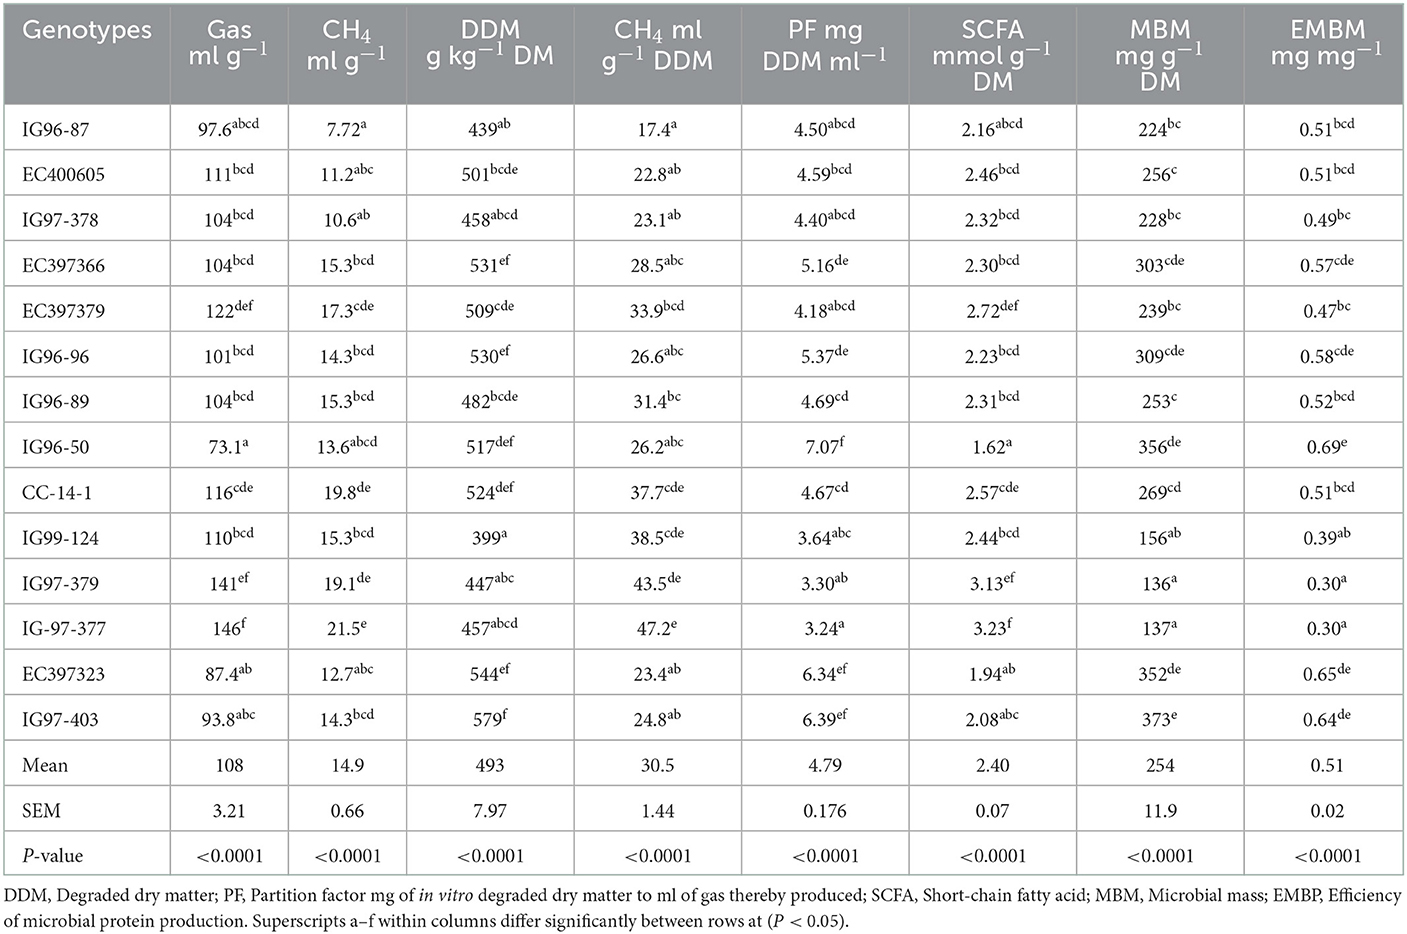
Table 7. In vitro gas and methane production from sugar-rich Cenchrus ciliaris accessions.
3.7. Silage composition
Silage pH and lactic acid contents for evaluated C. ciliaris accessions differed (p < 0.05) and ranged between 5.11 (EC397366) to 6.07 (EC397379) and 3.71 (IG97-403) to 23.7 g kg-1 DM (EC397366), respectively (Table 8).
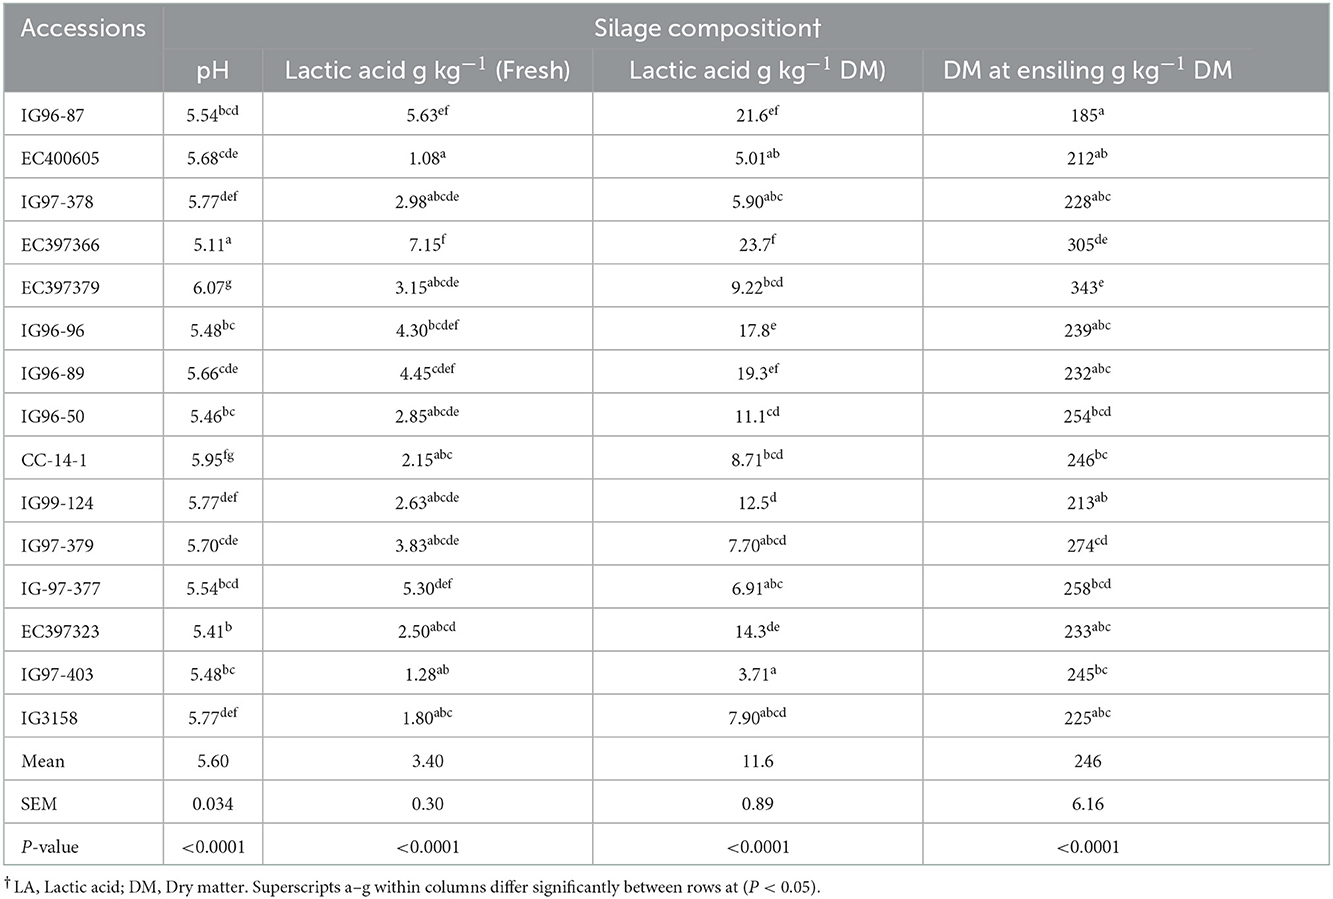
Table 8. Cenchrus ciliaris accessions silage composition.
4. Discussion
4.1. Chemical composition
The chemical composition of feed/fodder is one of the important determinants of its nutritive value. C. ciliaris germplasm and sugar rich accessions had CP more than 70.0g kg−1 DM required for sustained rumen microbial activity (37). CP content is a measure of nutritional quality (38), our germplasm and sugar rich accessions had CP similar to 80.0 g kg−1 DM which is considered adequate for the maintenance of beef cattle (39).
Information on the nutritive value of C. echinatus, C myosuroides, and C. pennisetiformis is not available; however, the CP, NDF, ADF, cellulose, and lignin along with energy values have been reported for C. biflorus and C. setigerus (40, 41), and our values are more or less within the range of their reported values. The OM, CP, NDF, ADF, cellulose, and lignin of five new genotypes of CC differed (p < 0.05) and were in the range of 881–904, 80–96, 687–738, 485–519, 367–432, and 34–60 g kg−1 DM, and the mean values of 893, 87, 713, 492, 400, and 43 g kg−1 DM (42) were more or less similar to the values recorded for the accessions evaluated in the present study. In the study, mean values of OM, CP, NDF, cellulose, and lignin contents of 78 new genotypes of CC evaluated in Mexico (43) were 861, 82, 734, 413, and 31 g kg−1 DM, respectively. Melesse et al. (44) reported that C ciliaris grass at pre flowering growth had CP, EE, NDF, ADF, cellulose, and lignin contents of 82, 14.5, 601, 373, 342, and 26.7 g kg−1 DM, respectively. Ashraf et al. (45) reported higher EE (27.0–53.0) and protein contents (132–175 g kg−1 DM) of 10 C. ciliaris accessions from the Cholistan desert of Pakistan than our EE and CP contents. Saini et al. (46) evaluated six cultivars/species of CC for 2 years (2003–2004) and found that CP contents ranged from 94.1 to 157 g kg−1 DM in 2003 and 37.2 to 101 g kg−1 DM in 2004 during 1st and 2nd cut. Cenchrus ciliaris from light and heavy grazed rangeland (Gemeda and Hassan (47) had mean value of 873, 41.0, 19.5, 682, 418, 360, and 55.0 g kg−1 DM for OM, CP, EE, NDF, ADF, cellulose, and lignin, respectively, lies within the range of our values except for CP, which was lower than our values. Bezabih et al. (48) reported that C. ciliaris collected from six transects of grazing areas of semi-arid savanna grassland in the Mid Rift Valley of Ethiopia had mean values of 889, 563, and 96.0 g kg?1 DM for OM, NDF and CP, respectively. Coelho et al. (49) reported that the mean values of CP, NDF, ADF, and lignin were 98.0, 685, 337, and 26.0 and 111, 688, 349, and 37.0 g kg−1 DM for C. ciliaris harvested four times at 60-90 days growth under stockpiled and grazing conditions. CP and ash contents of 11 ecotypes of C. ciliaris grass grown in the semi-arid lands of Kenya ranged between 66.4–109 and 112–152 g kg−11 DM, respectively (50). Jonathan et al. (51) reported that C. ciliaris grass hay fed to sheep had CP, NDF, ADF, OM, and EE of 46.0, 725, 542, 898, and 86.5 g kg−11 DM, respectively.
4.2. Sugar contents
The sugar content is a measure of rapidly fermentable energy available from a forage/feed and plays an important role in ruminant nutrition as required for both efficient rumen microbial fermentation and lactic acid production during the ensiling process. Sugar contents are of significant importance for ensiling (52) as it is the main source of nutrients for microbes to produce lactic acid and a sugar content level of 80 mg g−1 DM, which is desirable. C. ciliaris germplasm showed (p < 0.05) that the differences in sugar contents were lowest in IG67-625 (11.0 mg g−1 DM) and highest in EC397323 (101 mg g−1). The CC germplasm mean soluble sugar contents (57.1 mg g−1 DM) were lower than the desired level while sugar-rich accession mean sugar contents were more than 70 mg/g DM required for ensiling. Low levels of sugar and water-soluble carbohydrates in tropical grasses limit the fermentative capacity and result in low-quality silage (53). Aminah et al. (54) reported that the sugar content (WSC) of six types of tropical grass ranged between 12.6 and 98.8 mg g−1 DM, which are in agreement with the evaluated germplasm and selected accession sugar contents. Water-soluble carbohydrate contents of Kikuyu grass, Seteria, Rhodes, Signal, Napier, Guinea, and Paspalum grass were 45, 48, 30, 86, 99, 30, and 31 mg g−1 DM, respectively (55).
4.3. Carbohydrate and protein fractions
The mean tCHO of seven types of tropical grass at 56 days of cutting age varied from 730 to 836 g kg−1 DM (56), and our values of sugar-rich accessions (730–795 g kg−1 DM) are within this range. Brandstetter et al. (57) reported that carbohydrate fractions CA+B1, CB2, and CC of Jiggs Bermuda grass in different seasons (fall, winter, spring, and summer) varied between 240–376, 539–650, and 84.9–128 g kg−1 tCHO, respectively. Sa et al. (58) reported that carbohydrate fractions CA+B1, CB2, and Cc of Cynodon dactylon, Brachiaria brizantha, and Panicum maximum grasses at 28, 35, and 54 days of cutting age ranged between 165–255, 346–449, and 110–263 g kg−1 tCHO. These workers further reported that tCHO and NFC contents of Cynodon dactylon, Brachiaria brizantha, and Panicum maximum grasses ranged between 728–827 and 20–90 g kg−1 DM, respectively. The NSCs of 15 types of tropical grass from 87 to 223 g kg−1 DM (59) were higher than our values (24.7–67.9 NSC g kg−1 DM) and similar to 42.0 g kg−1 DM recorded by Jonathan et al. (51) for C. ciliaris. Higher CC and lower CB2 for IG97-379, EC400605, and IG96-96 accessions may be attributed to their higher lignin and lower NDF contents as the forages with high NDF have a higher proportion of CB2 fraction, and the increase in the fraction CC can be partly attributed to the increased lignin concentration in NDF (60).
C. ciliaris high sugar accessions PC fraction varied (p < 0.05) with the mean value of 115 g kg−1 CP, which is in the agreement with the range of 100–150 g kg−1 CP as reported earlier (61, 62). Fraction C is the insoluble N in acid detergent solution (ADIN) and is associated with lignin, tannin–protein complexes, and Maillard products. This fraction represents the unavailable protein and is assumed to have zero ruminal and intestinal digestibility. In our study, PC fraction varied (p < 0.05) between 81.6 and 152 g kg−1 CP is within the range of 90–180 g kg−1 CP as reported by Sanderson and Wedin (63) and Hoekstra et al. (64). Jonathan et al. (51) reported that C. ciliaris PA, PB1, PB2, PB3, and PC fractions of protein were 345, 152, 137, 195, and 480 g kg−1 CP, respectively, which were inconsistent with our protein fraction values except the mean value of PB3 (124 g kg−1 CP). Braga et al. (65) reported (p < 0.05) differences in protein fractions in grass species and their harvesting age. Protein fraction PA composed of NPN has a higher rate of ruminal degradation, which was lower in Andropogon (120–130 g kg−1 CP) than in C. ciliaris and Massai (160–170 g kg−1 CP) at 63 days of cutting age. Grasses PB2, PB3, and PC protein fractions ranged between 280–340, 270–310, and 213–273 g kg−1 CP, respectively, at 63 days of cutting age. Brandstetter et al. (57) reported that the protein fractions PA, PB1, PB2, PB3, and PC of Jiggs Bermuda grass in different seasons (fall, winter, spring, and summer) between 407–550, 138–139, 100–157, 125–148, and 80–115 g kg−1 CP, respectively, and their PB2, PB3, and PC values corroborate with our values of sugar-rich accessions for these fractions. Sa et al. (58) reported that protein fractions PA, PB1+B2, PB3, and PC of Cynodon dactylon, Brachiaria brizantha, and Pancum maximum grasses at 28, 35, and 54 days of cutting age ranged between 164 to 287, 251 to 538, 116 to 349, and 91 to 182 g kg−1 CP, respectively, which are more or less similar to our observations.
4.4. Energy contents
The calculated mean ME values of Cenchrus germplasm (7.41 Mj kg−1 DM) and sugar-rich accessions (6.42 Mj kg−1 DM) were lower than those reported by Getachew et al. (66) for 17 grass samples (7.7–13.6 Mj kg−1 DM) and are inadequate to fulfill the energy requirements for the maintenance of growing cattle (8.8 Mj kg−1 DM; 37). Mlay et al. (67) reported that TDN, DE, and ME contents of 10 types of tropical grass ranged between 342–609 g kg-1 DM, 5.92–11.26, and 4.85–9.23 Mj kg−1 DM, respectively, and our values of Cenchrus germplasm (411–549 g kg-1 DM, 7.99–10.31, and 6.17–8.44 Mj kg−1 DM) and sugar-rich accessions (362–487 g kg-1 DM, 6.62–8.90, and 5.42-7.29 Mj kg−1 DM) lie within these values. The higher TDN and DE values of IG99-124 may be due to lower ADF and lignin contents (432 and 39.8 g kg-1 DM) as higher ADF and lignin contents reduce the nutrient utilization present in forages (68). Yigzaw (69) reported that the ME contents of C. ciliaris varied in the range of 7.65–9.02 Mj kg−1 DM during 60 to 120 days of crop growth. The effect of growth stage, season, and species on ME contents of tropical grasses has been reported earlier (51, 70). The net energy system recommends an animal energy requirement for different physiological functions, viz. tissue maintenance, tissue growth, and lactation (71). The NEL contents of 4.38 and 4.85 Mj kg−1 DM for Napier and Pangola grasses, respectively, reported by Tikam et al. (70) are similar to the mean NEL values of Cenchrus germplasm (4.51 Mj kg−1 DM) and higher than the mean NEL contents of sugar-rich C. ciliaris accessions (3.85 Mj kg−1 DM). The NEL values of IG99-124. EC397323, IG96-96, and IG96-98 accessions are almost similar to the values of Tikam et al. (70). Cenchrus germplasm and high sugar accessions had the adequate NEM levels recommended for a mature beef cow [4.92–5.30 Mj kg−1 DM (71)].
4.5. Palatability attributes of Cenchrus accessions
Many indices to predict the forage quality for feeding ruminants have been developed (72) based on the chemical constituents of forages. Intake is one of the important indices to measure the nutrient availability of animals influenced by both diet and livestock species. Differences in DMI of Cenchrus germplasm (1.61–1.88%) and sugar-rich accessions (1.53–1.77%) may be attributed to the variation in their NDF contents. The mean NDF contents of both germplasm (694 g kg−1 DM) and sugar-rich accessions (737 g kg−1 DM) were beyond the range of 600–650 g kg−1 DM level, which is considered to influence the intake negatively (18). The DMI of tropical grasses at the flowering stage varied (p < 0.05) and ranged between 30.0 for Panicum maximum and 54.0g/kg w075 for Brachiaria ruziziensis and Pennisetum purpureum in sheep fed ad lib (73). Aguir et al. (74) reported DMI of 2.33% and 2.25% for Sudan grass and Elephant grass, respectively, in goats. Assoumaya et al. (75) reported that the voluntary intake of tropical forages is lower (1.95) than that of temperate forages (2.03%).
Forages with digestibility values of 500 g kg−1 DM or more can meet the energy requirements for the maintenance of grazing ruminants (76). The significant differences in DDM values of C. ciliaris germplasm (533–585 g kg−1 DM) and sugar-rich accessions (477–552 g kg−1 DM) may be attributed to the differences in their ADF and lignin contents as both nature and quantity of cell wall contents and cell contents of forages influence the DM degradability (37). Like our observations, Dessommes et al. (42) reported (p < 0.05) the differences in effective DM degradability of six C. ciliaris genotypes (550–663 g kg−1 DM). The IVDMD contents of 11 ecotypes of C. ciliaris ranged between 456 and 550 g kg−1 DM (50). Coelho et al. (49) reported IVDMD of 452 and 500 g kg−1 DM for C. ciliaris under stockpiled and grazing conditions.
Relative feed value (RFV) forage quality index combines the intake and digestibility into one unit (77). Alike our observations on RFV for Cenchrus germplasm (64.21–83.87%) and sugar-rich accessions (58.24–73.78%), Hackman et al. (78) reported a wide variability in RFV of 11 cool-season (71.5–130.0%) and four warm-season types of grass (88.0–165.0%), respectively. Suhaimi et al. (79) evaluated more than 900 samples of Brachiaria decumbens grass over 5 years (1999–2003) and observed that their RFV values ranged between 74.83 and 84.17%. Cinar and Hatipoglu (80) reported that the RFV of Dallis, Bermuda, and Rhodes grasses varied between 68.0–82.1, 75.0–93.7, and 72.8–86.7%, during 3 years of growth (2009–2011) and our RFV lies within these values.
4.6. Gas and methane production from sugar-rich Cenchrus accessions
Cenchrus ciliaris accessions differ (p < 0.05) in gas production with the mean value of 108 ml g−1 DM and are on the pattern of Ley de Coss et al. (81) who recorded (p < 0.05) the differences for in vitro gas production from four types of tropical grass (122–170 ml g−1 DM) at 24 h of incubation in bovine rumen liquor. Garcia and Dessommes (42) reported CH4 production of 4.38 ml g−1 DM of C. ciliaris at 24 h of fermentation while CH4 production for 16 types of grass ranged between 4.02 and 11.70 ml g−1 DM, which was lower than our CH4 values (7.72–19.80 ml g−1 DM). In contrast, Bezabiah et al. (48) reported higher gas and CH4 (202 and 40 ml g−1 DM) of C. ciliaris fermented for 24 h in rumen liquor of Holstein Friesian cattle. Similarly, Melesse et al. (44) recorded higher gas and methane production (204.5 and 34.5 ml g−1 DM) for C. ciliaris than our values. The authors further reported that the total gas and CH4 of 24 grass species ranged between 94 to 232 ml g−1 DM and 26 to 43 ml g−1 DM, respectively. The variation in methane production among C. ciliaris accessions may be partially attributed to their significant differences in chemical constituents such as CP, ash, ether extract, ADF, NDF, ADL, NDIN, ADIN, and NFC concentration. The ratio between methane to total gas production indicates that the methane emission potential per unit of OM degraded from forages, and in the present study, this ratio varied widely from 0.079 to 0.170 across the sugar-rich accessions, which shows the opportunity to select the accessions with low methane potential.
Accessions gas fermentation parameters, viz. partition factor (PF), short-chain fatty acid (SCFA), microbial mass (MBM), and efficiency for microbial mass production (EMBM) differed (p < 0.05). Accession IG96-50 higher values for PF and EMBM and lower for SCFA were consistent with the previous report, and the microbial mass and SCFA are inversely related (82, 83). Higher PF recorded for IG96-50 resulted in greater microbial mass as PF is the measure of the efficiency of microbial production. The amount of short-chain fatty acid produced is related to OMD and the energy content of the feed.
4.7. Silage quality
Typical concentrations of lactic acid in commonly fed silages range from 20.0 to 40.0 g kg−1 DM, but can be considerably higher in silages with low concentrations of DM (< 300 g kg−1 DM). The final pH of silage is affected by many factors but is most related to the concentration of lactic acid and buffering capacity of the crop. Silage prepared from C. ciliaris accessions had pH values (5.11–6.07) above the 3.8 to 4.2 ideal ranges (52) usually observed in corn or sorghum or oat silages. Silage pH values of EC397366 (5.11), IG96-96 (5.46), IG96-50 (5.46), and EC397323 (5.41) accessions are more or less in the acceptable range of tropical grasses with lactic acid contents of 23.7, 17.8, 11.1, and 14.3 g kg−1 DM, respectively. Harrison et al. (84) recommended that good grass silage should have pH < 4.47 and lactic acid between 40.0 and 70.0 g kg−1 DM, respectively. The pH values recorded for sugar-rich Cenchrus accessions are acceptable and consistent with the values reported for grasses (85, 86). Aminah et al. (54) reported that silages from Seteria splendid and Pennisetum purpureum had lower pH (4.07 and 3.96) and more lactic acid (24.7 and 25.3 g kg−1 DM) than other evaluated tropical grasses (4.71–5.32) and 10.4–18.4 g kg−1 DM) partially agree with our values of IG96-96, EC397366, EC397323, and IG96-50 accessions. The DM content of evaluated accessions except EC397366 was below the range of 300 g kg−1 DM desirable for ensiling grasses. Pitt (87) suggested that grasses ensiled below 300 g kg−1 D should have >100 g kg−1 DM soluble sugar for adequate fermentation to achieve the desired pH. Accessions having higher pH might have failed to provide adequate substrate (sugar) to lactic acid bacteria to produce lactic acid. Pinho et al. (88) recorded the pH of Buffel grass silage between 4.6 and 5.4 at 30 days of fermentation harvested at different heights. Li et al. (89) reported the pH and LA contents of Paspalum plicatulum grass 5.2 and 11.0 g kg−1 DM and 5.2 and 18.0 g kg−1 DM during 30 days of fermentation at 28 and 40°C temperature and 5.2 and 17.0 g kg−1 DM and 5.1 and 20.0 g kg−1 DM during 60 days of ensiling at 28 and 40°C temperature, respectively. Yahaya et al. (90) showed that silage of tropical grass (Pennisetum purpurum) had higher pH and lower lactic acid (5.45 and 9.00 g kg−1 DM) than temperate rye grass silage (3.86 and 19.0 g kg−1 DM). In another study, Arroquy et al. (91) recorded lower pH (4.04–4.47) and higher lactic acid (39.1–76.5 g kg−1 DM) for six warm season types of grass than our pH and lactic acid values. However, Vendramini et al. (92) reported higher pH (6.5–8.6) and lower lactic acid (1.00–19.0 g kg−1 DM) for warm season grasses except for Limpo grass (26.0 g kg−1 DM) than our pH and lactic acid values.
5. Conclusions
The results revealed wide genetic variability in Cenchrus germplasm and sugar-rich accessions for dry matter yield, protein, fiber, energy, and soluble sugar contents. Sugar-rich accessions also differ (p < 0.05) for carbohydrate fractions, protein fractions, in vitro gas and methane production, and silage quality (pH and lactic acid). Silage prepared from EC397366, IG96-96, IG96-50, and EC397323 accessions had pH and lactic acid contents acceptable for tropical range grasses. Nutritional evaluation of silage prepared from selected accessions may be undertaken using in vivo studies. The present global subset having wide variability could be utilized for the identification of genomic regions associated with key forage nutritional traits for future breeding programs. Selected accessions need to be introduced in rangelands and pastures to enhance their yield and quality for sustainable livestock production.
Data availability statement
The original contributions presented in the study are included in the article/Supplementary material, further inquiries can be directed to the corresponding authors.
Ethics statement
The animal study was reviewed and approved by Institute Animal Ethics Committee.
Author contributions
SS, TS, and SKM: conceptualized the study. SS, TS, SKM, MMD, KKS, RK, and AKM: methodology and laboratory work. PKG, AKM, SS, and TS: resources and supervision. SS, TS, and MKS: investigation. SS, TS, and NK: data analysis and writing. All authors contributed to the article and approved the submitted version.
Funding
This study was funded by the Indian Council of Agricultural Research project no. CRSCIGFRICOL20130702.
Acknowledgments
The authors are grateful to the Indian Council of Agricultural Research for funding and to the Director, ICAR-Indian Grassland and Fodder Research Institute for providing the facilities necessary to conduct these studies.
Conflict of interest
The authors declare that the research was conducted in the absence of any commercial or financial relationships that could be construed as a potential conflict of interest.
Publisher's note
All claims expressed in this article are solely those of the authors and do not necessarily represent those of their affiliated organizations, or those of the publisher, the editors and the reviewers. Any product that may be evaluated in this article, or claim that may be made by its manufacturer, is not guaranteed or endorsed by the publisher.
Supplementary material
The Supplementary Material for this article can be found online at: https://www.frontiersin.org/articles/10.3389/fnut.2022.1094763/full#supplementary-material
References
1. Herrero M, Pavlik P, Valin H, Notenbaert A, Rufino M, Thornton PK, et al. Global livestock systems: Biomass use, production, feed efficiency and green house gas emissions. Proc National Academy Sci. (2013) 110:20888–93. doi: 10.1073/pnas.1308149110
3. Coan RM, Reis RA, Garcia GR, Schocken-Inturrino RP, Souza-Ferreira D, Dutra RF, et al. Microbiological and fermentative dynamics of Tanzania grass and B. bryzanta grass silage using pelleted citrus pulp as an additive. R Bras Zootec. (2007) 36:1502–11. doi: 10.1590/S1516-35982007000700007
4. Keady TWJ, Kilpatrick DJ, Mayne CS, Gordon FJ. Effects of replacing grass silage with maize silages, differing in maturity, on performance and potential concentrate sapring effect of dairy cows offered two feed value grass silages. Livest Sci. (2008) 119:1–11. doi: 10.1016/j.livsci.2008.02.006
5. Spitaleri RF, Sollenberger LE, Staples CR, Schank SC. Harvest management effects on ensiling characteristics and silage nutritive value of seeded Pennisetum hexaplois hybrids. Postharvest Biol Technol. (1995) 5:353–62. doi: 10.1016/0925-5214(94)00033-O
6. Humphreys MO. “Variation in the carbohydrate and protein content of ryegrass: Potential for genetic manipulation,” In: Proceeding of the 19th EUCARPIA Fodder Crops Section Meeting. Brugge: Belgium (1994). p. 165–71.
7. Haigh PM. Effect of herbage water soluble carbohydrate content and weather conditions at ensilage on the fermentation of grass silages made on commercial farms. Grass Forage Sci. (1990) 45:263–71. doi: 10.1111/j.1365-2494.1990.tb01949.x
8. Mc Eniry J, King C, O'Kiely P. Silage fermentation characteristics of three common grassland species in response to advancing stage of maturity and additive application. Grass Forage Sci. (2013) 69:393–404. doi: 10.1111/gfs.12038
9. Syamaladevi DP, Meena SS, Nagar RP. Molecular understandings on ‘the never thirsty' and apomictic Cenchrus grass. Biotechnol Lett. (2016) 38:369–76. doi: 10.1007/s10529-015-2004-0
10. Kumar VV, Mahato AK, Patel R. “Ecology and management of Banni grassland of Kuchchh Gujrat in Ecology and management of grassland habitats in India,” In: Rawat GS, Adhikari BS (Eds) ENVIS Bulletin Wildlife and Protected Areas. Dehradun: Wildlife Institute of India (2015). p. 43–53.
12. Duke JA. Handbook of Energy Crops. West Lafayette, IN: New CROPS web site, Purdue University (1983).
13. Osman AE, Makawi M, Ahmed R. Potential of the indigenous desert grasses of the Arabian Peninsula for forage production in a water-scarce region. Grass Forage Sci. (2008) 63:495–503. doi: 10.1111/j.1365-2494.2008.00656.x
14. Sahay G, Dikshit N, Singh T, Tyagi VC, Dheeravathu SN, Ahmed S, et al. FORAGE Genetic Resources at ICAR-IGFRI Jhansi, Accomplishments and Future Strategies. Jhansi: ICAR-Indian Grassland and Fodder Research Institute (2019). p. 34.
15. Federer WT. Augmented designs with one-way elimination of heterogeneity. Biometrics. (1961) 17:447–73. doi: 10.2307/2527837
16. VDLUFA (Verband Deutscher Landwirtschaftlicher Untersuchungs- und Forschungsanstalten). Die chemische Untersuchung von Futtermitteln. VDLUFA-Methodenbuch. Band III, Ergänzungslieferungen von 2007. Darmstadt: VDLUFA-Verlag (2007). Available online at: https://www.vdlufa.de/Methodenbuch/index.php?option=com_content&view=article&id=4&Itemid=111&lang=de&lang=en
17. AOAC. Association of Official Analytical Chemists, 18th edn. Washington, DC: Official Methods of Analysis of AOAC International (2005).
18. Van Soest PJ, Robertson JB, Lewis BA. Methods for dietary fiber, neutral detergent fiber and non starch polysaccharides in relation to animal nutrition. J Dairy Sci. (1991) 74:3583–97. doi: 10.3168/jds.S0022-0302(91)78551-2
19. Sastry VRB, Kamra DN, Pathak NN. Laboratory Manual of Animal Nutrition. Izatnaar, UP: Centre of Advance Studies, Division of Animal Nutrition Indian Veterinary Research Institute (1991). p. 116–7.
20. Sniffen CJ, O'Connor JD, Van Soest PJ, Fox DG, Russel JB. A net carbohydrate and protein system for evaluating cattle diets II carbohydrate and protein availability. J Anim Sci. (1992) 70:3562–77. doi: 10.2527/1992.70113562x
21. Caballero R, Alzueta C, Ortiz LT, Rodriguez ML, Barro C, Rebolé A, et al. Carbohydrate and protein fractions of fresh and dried common vetch at three maturity stages. Agron. J. (2001) 93:1006–13. doi: 10.2134/agronj2001.9351006x
22. Licitra G, Harnandez TM, Van Soest PJ. Standardizations of procedures for nitrogen fractionation of ruminant feeds. Anim Feed Sci Technol. (1996) 57:347–58. doi: 10.1016/0377-8401(95)00837-3
23. Krishnamoorthy U, Muscato TV, Sniffen CJ, Van Soest PJ. Nitrogen fractions in selected feedstuffs. J Dairy Sci. (1982) 65:217–25. doi: 10.3168/jds.S0022-0302(82)82180-2
24. Undersander DJ, Howard WT, Shaver RD. Milk per acre spreadsheet for combining yield and quality into a single term. J Prod Agric. (1993) 6:231–223. doi: 10.2134/jpa1993.0231
25. Fonnesbeck PV, Clark DH, Garret WN, Speth CF. Predicting energy utilization from alfalfa hay from the Western region. Proc Amer Soc Anim Sci W Sect. (1984) 35:305–8.
26. Khalil JK, Sawayaw N, Hyder SZ. Nutrient composition of Atriplex leaves grown in Saudi Arabia. J Range Manag. (1986) 39:104–7. doi: 10.2307/3899277
27. Theodorou MK, Williams AB, Dhanoa MS, Mc Allan AB, France J. a simple gas production method using pressure transducer to determine the fermentation kinetics of ruminant feeds. Anim Feed Sci Technol. (1994) 48:185–97. doi: 10.1016/0377-8401(94)90171-6
28. Menke KH, Steingass H. Estimation of the energetic feed value obtained from chemical analysis and in vitro gas production using rumen fluid. Anim Res Dev. (1988) 28:7–55.
29. Tavendale MH, Meahger LP, Pacheco D, Walker N, Attwood GC, Sivakumaran S, et al. Methane production from in vitro rumen incubations with Lotus penduculatus and Medicago sativa and effects of extractable condensed tannin fractions on methanogenesis. Anim. Feed Sci. Technol. (2005) 123:403–19. doi: 10.1016/j.anifeedsci.2005.04.037
30. Getachew G, Makkar HPS, Becker K. Tropical browses: contents of phenolic compounds, in vitro gas production and stoichiometric relationship between short chain fatty acid and in vitro gas production. J Agric Sci. (2002) 139:341–52. doi: 10.1017/S0021859602002393
31. Blümmel M, Makkar HPS, Becker K. In vitro gas production: a technique revisited. J Anim Physiol Anim Nutr. (1997) 77:24–34. doi: 10.1111/j.1439-0396.1997.tb00734.x
32. Kaiser AG, Kerr KL. More accurate laboratory tests for assessing silage quality, Final Report for DRDC Project DAN 100 and RIRDC Project DRD-4A (2003). p. 50.
33. Barker SB, Summerson WH. The colorimetric determination of lactic acid in biological material. J Biol Chem. (1941) 138:535–54. doi: 10.1016/S0021-9258(18)51379-X
34. Aravind J, Mukesh S, Wankhede D, Kaur V. Augmented RCBD: analysis of augmented randomised complete block designs. R Package Vers 0.1.5.900. (2021) 2:1–54.
35. Snedecor GW, Cochran WG. Statistical Methods, 8th ed. Calcutta, India: Oxford and IBH Publishing Company. (1994).
37. Van Soest PJ. Nutritional Ecology of the Ruminant. Znd ed. Ithaca, New York, USA Comstock Publishing Associates and Cornell University Press (1994).
38. Ganskopp D, Bohnert D. Nutritional Dynamics of 7 Northern Great Basin Grasses. J Range Manag. (2001) 54:640–7. doi: 10.2307/4003664
39. NRC. Nutrient Requirements of Domestic Animals, Nutrient Requirements of Beef Cattle. 7th ed. National Academy of Sciences. National Research Council, Washington, USA (2000).
40. Peerzada AM, Naeem M, Ali HH, Tanveer A, Javaid MM, Chauhan BS. Cenchrus biflorus Roxb. (Indian sandbur), a blessing or curse in arid ecosystems: a review. Grass Forage Sci. (2016) 72, 179–192. doi: 10.1111/gfs.12215
41. Kumar K, Soni A. Nutrient evaluation of common vegetation of Rajasthan: Pennisetum typholdenum, Cenchrus ciliaris, Cenchrus setigerus and Lasiurus sindicus. Int J Plant Anim Environ Sci. (2014) 4:177–84. Available online at: www.ijpaes.com
42. García-Dessommes GJ, Ramírez-Lozano RG, Morales Rodríguez R, García-Díaz G. Ruminal digestion and chemical composition of new genotypes of buffelgrass (Cenchrus ciliaris L.) under irrigation and fertilization. Interciencia. (2007) 32:349–53. Available online at: https://www.redalyc.org/articulo.oa?id=33932511
43. Morales-Rodríguez R, Ramírez RG, García-Dessommes GJ, González-Rodríguez H. Nutrient Content and in-situ Disappearance in Genotypes of Buffelgrass (Cenchrus ciliaris L.). J. Appl. Anim. Res. (2006) 29:17–22. doi: 10.1080/09712119.2006.9706562
44. Melesse A, Steingass H, Schollenberger M, Rodehutscord M. Screening of common tropical grass and legume forages in Ethiopia for their nutrient composition and methane production profile in vitro. Tropical Grasslands Forrajes Tropicales. (2017) 5:163–75. doi: 10.17138/TGFT(5)163-175
45. Ashraf MA, Mahmood K, Yusoff I, Qureshi AK. Chemical constituents of Cenchrus ciliaris L. from the Cholistan desert, Pakistan. Arch Biol Sci Belgr. (2013) 65:1473–8. doi: 10.2298/ABS1304473A
46. Saini ML, Jain P, Joshi UN. Morphological characteristics and nutritive value of some grass species in an arid ecosystem. Grass Forage Sci. (2007) 62:104–8. doi: 10.1111/j.1365-2494.2007.00563.x
47. Gemeda BS, Hassan A. In vitro fermentation, digestibility and methane production of tropical perennial grass species. Crop Pasture Sci. (2014) 65:479–88. doi: 10.1071/CP13450
48. Bezabih M, Pellikaan WF, Tolera A, Khan NA, Hendriks WH. Chemical composition and in vitro total gas and methane production of forage species from the Mid Rift Valley grasslands of Ethiopia. Grass Forage Sci. (2014) 69:635–43. doi: 10.1111/gfs.12091
49. Coêlho JJ, Leão AC, Santos MVF, Junior BD, Cunha MV, Lira A. Prediction of the nutritional value of grass species in the semiarid region by repeatability analysis. Pesqui. Agropecu. Bras. (2018) 53:378–385. doi: 10.1590/s0100-204x2018000300013
50. Kirwa EC, Njoroge K, Chemining'wa G, Mnene WN. Nutritive composition of Eragrostis egund Peyr and Cenchrus ciliaris L. collections from the ASALs of Kenya. Livestock Res Rural Develop. (2015) 27:144. Available online at: https://www.lrrd.cipav.org.co/lrrd27/8/kirw27144.html
51. Jonathan N, Avilés N, José L, Valle C, Francisco CP, Sergio AC, et al. Digestibility of Buffel grass (Cenchrus ciliaris)-based diets supplemented with four levels of Gliricidia sepium hay in hair sheep lambs. Proc. New Zealand Grassland Assoc. (2013) 45:1357–62. doi: 10.1007/s11250-013-0369-4
52. McDonald P, Henderson AR, Heron SJE. The Biochemistry of Silage. 2nd ed. Mallow, Bucks: Chalcombe Publications (1991).
53. Gallaher RN, Pitman WD. “Conservation of forages in the tropics and subtropics,” In: Sotomayor-Rios A, Pitman WD, eds Tropical Forage Plants: Development and Use. Boca Raton: CRC Press LLC. (2001). p. 2136–2145. doi: 10.1201/9781420038781.ch14
54. Aminah A, Abu BC, Izham A. Silages From Tropical Forages: Nutritional Quality Milk Production. FAO Electronic Conference on Tropical Silage. (1999). Available online at: http://ftpmirror.your.org/pub/misc/cd3wd/1005/_ag_lstock_silage_4P1_en_111610.pdf (accessed March 12, 2020).
55. Piltz JW, Kaiser AG. “Principles of silage preservation,” In: Piltz JW, Kaiser AG, Burns HM, Griffith NW. Successful Silage The State of New South Wales: Department of Primary industries and Dairy Australia (2004). p. 26–56.
56. Campos SS, Silva JFC, Vásquez HM, Vittori A, Silva MA. Fractions of carbohydrates and of nitrogenous compounds of tropical grasses at different cutting ages. R Bras Zootec. (2010) 39:1538–47. doi: 10.1590/S1516-35982010000700021
57. Brandstetter EV, Costa KAP, Santos DC, Souza WF, Silva VC, Dias MBC, et al. Protein and carbohydrate fractionation of Jiggs Bermudagrass in different seasons and under intermittent grazing by Holstein cows. Acta Scientiarum. Acta Sci. Anim. Sci. (2019) 41:e43363. doi: 10.4025/actascianimsci.v41i1.43363
58. Sá JF, Pedreira MS, Silva FF, Bonomo P, Figueiredo MP, Menezes DR, et al. Carbohydrates and proteins fractions of tropical grasses cut at three ages. Arq Bras Med Vet Zootec. (2010) 62:667–76. doi: 10.1590/S0102-09352010000300023
59. Juarez Lagunes FI, Fox DG, Blake RW, Pell AN. Evaluation of Tropical Grasses for Milk Production by Dual-Purpose Cows in Tropical Mexico. J Dairy Sci. (1999) 82:2136–45. doi: 10.3168/jds.S0022-0302(99)75457-3
60. Silva SP, Silva MMC. Fracionamento de carboidrato e egundo egundo o sistema CNCPS. Vet Notícias. (2013) 19:95–108. Available online at: https://seer.ufu.br/index.php/vetnot/article/view/23169
61. Elizalde JC, Merchen NR, Faulkner DB. Fractionation of fiber and crude protein in fresh forages during the spring growth. J Anim Sci. (1999) 77:476–84. doi: 10.2527/1999.772476x
62. Bryant RH, Gregorin IP, Edwards GR. Effects of N fertilisation, leaf appearance and time of day on N fractionation and chemical composition of Lolium perenne cultivars in spring. Anim Feed Sci Tech. (2012) 173:210–9. doi: 10.1016/j.anifeedsci.2012.02.003
63. Sanderson MA, Wedin WF. Nitrogen in the detergent fibre fractions of temperate legumes and grasses. Grass Forage Sci. (1989) 44:159–68. doi: 10.1111/j.1365-2494.1989.tb01923
64. Hoekstra NJ, Struik PC, Lantinga EA, Amburgh ME, Schulte RPO. Can herbage nitrogen fractionation in Lolium perenne be improved by herbage management? NJAS-Wagen. J Life Sci. (2008) 55:167–80. doi: 10.1016/S1573-5214(08)80035-8
65. Braga AP, Assis LC, Lucena JA, Lima JSS, Barreto FB, Amâncio AF, et al. Fractionation of nitrogen compounds and carbohydrates in forages of different ages. Semina: Ciências Agrárias. (2018) 39:819–32. doi: 10.5433/1679-0359.2018v39n2p819
66. Getachew G, DePeters EJ, Robinson PH, Fadel JG. Use of an in vitro rumen gas production technique to evaluate microbial fermentation of ruminant feeds and its impact on fermentation products. Anim Feed Sci Technol. (2005) 124:547–59. doi: 10.1016/j.anifeedsci.2005.04.034
67. Mlay PS, Pereka A, Phiri EC, Balthazary S, Igusti J, Hvelplund T, et al. Feed value of selected tropical grasses, legumes and concentrates. Vet Arh. (2006) 76:53–63. Available online at: https://hrcak.srce.hr/file/8188
68. Aydin N, Mut Z, Mut H, Ayan I. Effect of autumn and spring sowing dates on hay yield and quality of oat (Avena sativa L.) genotypes. J. Anim. Vet. Adv. (2010) 9:1539–1545. doi: 10.3923/javaa.2010.1539.1545
69. Yigzaw GW. Effect of harvesting stage on yield and nutritive value of Buffel Grass (Cenchrus ciliaris linn) under irrigation at Gewane district, North Eastern Ethiopia. J Sci Innov Res. (2019) 8:7–12. Available online at: www.jsirjournal.com
70. Tikam K, Phatsara C, Mikled C, Vearasilp T, Phunphiphat W, Chobtang J, et al. Pangola grass as forage for ruminant animals: a review. Springer Plus. (2013) 2:604. doi: 10.1186/2193-1801-2-604
71. NASEM. National Academies of Sciences, Engineering, and Medicine. Nutrient Requirements of Beef Cattle, Eighth Revised Edition. Washington, DC: The National Academies Press (2016). doi: 10.17226/19014
72. Moore JE. “Forage quality indices: development and application,” In: Fahey GC, ed Forage Quality, Evaluation, and Utilization. Madison, WI: ASA, CSSA, SSSA (1994). p. 977–98. doi: 10.2134/1994.foragequality.c24
73. Babatoundé S, KaKaï RG, Alkoiret I, Mensah GA. Intake and digestibility of native and exotic grasses fed ad libitum to Djallonke sheep in South Benin. J. Agric. Sci. Technol. (2011) 5, 513–523. doi: 10.17265/2161-6256/2011.04A.019 Available online at: https://www.researchgate.net/publication/233780926
74. Aguiar EM, Lima GFC, Santos MVF, Carvalho FFR, Medeiros HR, Maciel FC, et al. Intake and apparent digestibility of chopped grass hays fed to goats. R Bras Zootec. (2006) 35:2219–25. doi: 10.1590/S1516-35982006000800004 Available online at: https://www.researchgate.net/publication/262650759
75. Assoumaya C, Sauvant D, Archimède H. Comparative study of ingestion and digestion tropical and temperate forages. INRA Prod Anim. (2007) 20:383–92. Available online at: https://www.researchgate.net/publication/285665975
76. Kearl LC. Nutrient Requirements of Ruminants in Developing Countries. International Feedstuffs Institute, Utah Agricultural Experimental Station Utah State University, Logan Utah, USA (1982). p. 67–9.
77. Linn JG, Martin NP. Forage quality tests and interpretations. Vet Clin North Am Food Anim Pract. (1999) 7:509–23. doi: 10.1016/S0749-0720(15)30790-8
78. Hackmann TJ, Sampson JD, Spain JN. Comparing relative feed value with degradation parameters of grass and legume forages. J Anim Sci. (2008) 86:2344–56. doi: 10.2527/jas.2007-0545
79. Suhaimi D, Sharif S, Normah MA, Norain NM, Wan SH. Estimating relative feed value of local Brachiaria decumbens. Malaysian J Vet Res. (2017) 8:78–82. Available online at: http://www.dvs.gov.my/dvs/resources/u
80. Cinar S, Hatipoglu R. Quality characteristics of the mixtures of some warm season perennial grasses with alfalfa (Medicago sativa L.) under irrigated conditions of Cukurova. Turk. J. Field Crops. (2015) 20:31–37. doi: 10.17557/.36336
81. De Ley Coss A, Guerra-Medina C, Montañez-Valdez O, Guevara HF, Pinto RR, Reyes-Gutiérrez J. In vitro production of gas methane by tropical grasses. Rev. MVZ Córdoba. (2018) 23:6788–98. doi: 10.1007/s11250-020-02393-5
82. Hungate RE. Variations in the Rumen, The Rumen and Its Microbes. Cambridge, MA: Academic Press (1966). p. 376–418. doi: 10.1016/B978-1-4832-3308-6.50013-9
83. Anele UY, Südekum KH, Hummel J, Arigbede OM, Oni AO, Olanite JA, et al. Chemical characterization, in vitro dry matter and ruminal crude protein degradability and microbial protein synthesis of some cowpea (Vigna unguiculata L. Walp) haulm varieties. Anim Feed Sci Technol. (2011) 163:161–9. doi: 10.1016/j.anifeedsci.2010.11.005
84. Harrison JH, Blauwiekel R, Stokes MR. Symposium: Utilization of Grass Silage- Fermentation and Utilization of Grass Silage. J Dairy Sci. (1994) 77:3209–35. doi: 10.3168/jds.S0022-0302(94)77264-7
85. Pereira OG, Rocha KD, Ferreira CL. Chemical composition, characterization, and population of microorganisms on elephantgrass “Cameroon” (Pennisetum purpureum, Schum) and its silages. R Bras Zootec. (2007) 36:1742–50. doi: 10.1590/S1516-35982007000800006
86. Santos EM, Pereira OG, Garcia R, Lucas CL, Ferreira F, Oliveira JS, et al. Microbial populations, fermentative profile and chemical composition of signal grass silages at different regrowth ages. R Bras Zootec. (2011) 40:747–55. doi: 10.1590/S1516-35982011000400007
87. Pitt RE. “The biology of silage preservation,” In: Silage and Hay Preservation Ithaca, NY: National Resource, Agriculture, and Engineering Service (1990). p. 5–20.
88. Pinho MA, Santos EM, Carvalho GP, Silva PG, Silva TC, Campos FS, et al. Microbial and fermentation profiles, losses and chemical composition of silages of buffel grass harvested at different cutting heights. R Bras Zootec. (2013) 42:850–6. doi: 10.1590/S1516-35982013001200003
89. Li D, Ni K, Zhang Y, Lin Y, Yang F. Fermentation characteristics, chemical composition and microbial community of tropical forage silage under different temperatures. Asian-Australas J Anim Sci. (2019) 32:665–74. doi: 10.5713/ajas.18.0085
90. Yahaya MS, Goto M, Yimiti W, Smerjail B, Kawamoto Y. Evaluation of fermentation quality of a tropical and temperate forage crops ensiled with additives of fermented juice of epiphytic lactic acid bacteria (FJLB). Asian-Aust J Anim Sci. (2004) 17:942–6. doi: 10.5713/AJAS.2004.942
91. Arroquy JI, Cornacchione MV, Colombatto D, Kunst JC. Chemical composition and in vitro ruminal degradation of hay and silage from tropical grasses. Can J Anim Sci. (2014) 94:705–15. doi: 10.4141/cjas-2014-014
Keywords: Cenchrus germplasm, ensiling, energy value, methane, sugar
Citation: Singh S, Singh T, Singh KK, Srivastava MK, Das MM, Mahanta SK, Kumar N, Katiyar R, Ghosh PK and Misra AK (2023) Evaluation of global Cenchrus germplasm for key nutritional and silage quality traits. Front. Nutr. 9:1094763. doi: 10.3389/fnut.2022.1094763
Received: 10 November 2022; Accepted: 13 December 2022;
Published: 02 February 2023.
Edited by:
Sapna Langyan, National Bureau of Plant Genetic Resources (ICAR), IndiaReviewed by:
Chirag Maheshwari, Indian Agricultural Research Institute (ICAR), IndiaAalok Shiv, Indian Institute of Sugarcane Research (ICAR), India
Amar Kant Kushwaha, Central Institute for Subtropical Horticulture (ICAR), India
Copyright © 2023 Singh, Singh, Singh, Srivastava, Das, Mahanta, Kumar, Katiyar, Ghosh and Misra. This is an open-access article distributed under the terms of the Creative Commons Attribution License (CC BY). The use, distribution or reproduction in other forums is permitted, provided the original author(s) and the copyright owner(s) are credited and that the original publication in this journal is cited, in accordance with accepted academic practice. No use, distribution or reproduction is permitted which does not comply with these terms.
*Correspondence: Sultan Singh,  Sultan.Singh1@icar.gov.in; Tejveer Singh, tejveersinghbhu@gmail.com