Lonicerae Japonicae Flos extract and chlorogenic acid attenuates high-fat-diet- induced prediabetes via CTRPs-AdipoRs-AMPK/PPARα axes
 Chengcheng Guo1,2,3
  Cuiqing Chang
- 1Department of Sports Medicine, Beijing Key Laboratory of Sports Injuries, Peking University Third Hospital, Beijing, China
- 2Institute of Sports Medicine, Peking University, Beijing, China
- 3Department of Endocrinology and Metabolism, Peking University People’s Hospital, Beijing, China
Prediabetes is considered an important reversible checkpoint in T2DM development, which can be delayed and prevented by early interventions. Lonicerae Japonicae Flos (LJF), an edible-medicinal herb, is rich in chlorogenic acid (CGA, 5-O-caffeoylquinic acid) and exerts anti-diabetes effects, but its role in prediabetes remains unclear. The purpose of this study was to explore the effects of LJF extract and CGA on rat with prediabetes. Sprague-Dawley rats were given high-fat diet (HFD) to induce prediabetes, and glycolipid metabolism parameters and molecular mechanisms were evaluated. LJF (the LJF extract treatment group) and CGA (the pure CGA treatment group) significantly attenuated HFD-induced prediabetes with impaired glucose tolerance and dyslipidemia, but their mechanisms of action are not exactly the same. Specifically, LJF prioritizes increasing protective lipid species [such as increasing blood polyunsaturated fatty acids (PUFA)-containing diacylglycerol (DAG) species, high-density lipoprotein-cholesterol (HDL-C)], whereas CGA prioritizes reducing detrimental lipid species [such as saturated fatty acid-containing DAG species, low-density lipoprotein-cholesterol (LDL-C), total cholesterol (TC)]. In addition, CGA significantly increased the content of blood very-long-chain fatty-acid (VLCFA)-containing ceramides species. This could be explained mechanically by a distinction between LJF and CGA’s effects on C1q/TNF-related proteins (CTRPs) which activate adiponectin receptors, triggering several downstream reactions. Because both LJF and CGA upregulated liver expression of adiponectin receptors (AdipoR1 and AdipoR2) and enhanced the activity of downstream AMPK. LJF also increased serum levels of CTRP3 and CTRP9, especially CTRP9, whereas CGA had higher serum CTRP3 and upregulated liver PPARa expression. Additionally, ELOVL6 expression in the liver was greater in CGA than LJF. This study demonstrates that LJF and CGA exert hypoglycemic and lipid modulation capacity to prevent prediabetes may through the CTRPs-AdipoRs-AMPK/PPARα axes and promoting ELOVL6 protein expression.
Introduction
Prediabetes, a state of neither normoglycemia nor bona-fide diabetes (1, 2), is identified by laboratory measurement of fasting blood glucose (FBG), 2-h postprandial blood glucose (2hBG), or glycosylated hemoglobin (HbA1C) (3). The increasing prevalence of prediabetes globally is a major public health concern and is also associated with an increased risk of type 2 diabetes (T2D) and cardiovascular diseases (4, 5). Diabetes prevention guidelines currently recommend lifestyle modification (dietary changes and increased physical activity) as the first line treatment option for individuals with prediabetes, a critical reversible stage of T2D (6). However, the challenge is sustaining lifestyle change in practice, and even after lifestyle intervention and metformin therapy, a proportion of prediabetes patients progress to T2D (7). Therefore, finding effective and accessible methods to prevent prediabetes from progressing to T2D is crucial.
Plant extracts rich in phenols have been increasingly recognized for their hypoglycemic effects and ability to regulate glucose metabolism in the body, as well as their ease of availability, low cost, and minimal side effects (8). Lonicerae Japonicae Flos (LJF) is a polyphenol-rich traditional medicinal herb widely cultivated in eastern Asia. LJF extracts have been explored for treating T2D and its complications, including anti-hyperglycemic, hypolipidemic, and attenuating diabetic retinopathy (9, 10). Additionally, LJF extracts combined with metformin increase metformin distribution in the liver, and ameliorate glucose tolerance (11, 12). The medicinal parts of LJF are derived from the dried buds and initial flowers, and its major active ingredient is chlorogenic acid (5-caffeoylquinic acid, CGA) (13). Previous studies reveal that CGA plays important and therapeutic roles in anti-inflammatory, anti-oxidant, anti-obesity (14), and antidiabetic (15–17). Furthermore, our previous study found that CGA (99% purity, extracted from green coffee seeds) decreases the expression of hepatic glucose-6-phosphatase, and increases adiponectin receptors (AdipoRs), adiponectin, and phosphorylation of AMPK and PPARα in late diabetic mice (18). However, there is little information available about how LJF extracts and its primary active ingredient CGA influence prediabetes, nor is the exact mechanism understood.
Clinical and experimental studies have suggested that C1q/TNF-related protein (CTRP) superfamily (including adiponectin, CTRP3, CTRP6, and CTRP9) bind to their receptors AdipoR1 and AdipoR2, could ameliorate impaired glucose tolerance, insulin resistance (IR) via activation of AMPK and PPAR-α pathways, respectively (19, 20). Of these, AdipoR1 [identified as the receptor for adiponectin, CTRP6 (21), and CTRP9 (22, 23)] has been shown to activate the AMP-activated protein kinase (AMPK) pathway, and AdipoR2 (identified as the receptor for adiponectin and CTRP3) (24) to activate peroxisome proliferator-activated receptor (PPAR) signaling, thus improving glucose and lipid metabolism and exerting anti-diabetic effects. In addition, the crystal structure of the AdipoRs suggests that AdipoR1 and AdipoR2 possess intrinsic ceramidase activity (25) and promotes desaturase activity (26). Thus, we hypothesized that LJF extracts and its primary active ingredient CGA ameliorate prediabetes through CTRPs- AdipoRs-AMPK/PPARα Axes.
Here, HFD induced prediabetes rats were established as an experimental animal model to evaluate the effects and the mechanism of LJF extract and CGA on the improvement of glucose and lipid metabolism.
Materials and methods
Lonicerae Japonicae Flos extract
Lonicerae Japonicae Flos bud extract (measured 52.52 % purity CGA, abbreviated as LJF), and CGA (extracted from Lonicerae Japonicae Flos bud, measured 98.63% purity CGA, purchased from Herbaltone Bio-technology (Shandong, China). The purity of CGA was measured using standard high-performance liquid chromatography (HPLC), a Hypersil Gold C18 analytical column (5 μm, 250 × 4.6 mm). The mobile phase consisted of acetonitrile (A) and water containing 0.2% phosphoric acid (B). The flow rate was 1.0 mL/min, the injection volume was 10 μL and the detection wave length was 327 nm.
Animals and experimental treatment
All animal protocols were approved by the Animal Care and Use Committee of Peking University (No. LA2017002). Sprague–Dawley (SD) rats (5-week-old, male, n = 32) were obtained from Vital River Laboratory Animal Technology Co. Ltd (Beijing, China) and housed two animals per cage in a standard specific-pathogen-free environment, with ad libitum access to water and food. After 7 days of acclimatization, rats (n = 24) were fed a high-fat diet (HFD; 45% of energy from fat, 20% from protein, and 35% from carbohydrate, with energy density 4.7 Kcal/g; Research Diets, Cat# D12451) for 30 days to induce prediabetes, then randomly distributed into the following experimental groups (n = 8 animals/group) received their respective treatments daily by gavage while continuing exposure to high-fat diet for the next 60 days: HFD group, receiving the vehicle (phosphate buffered saline); HFD+LJF group, receiving LJF (80 mg/kg/day); HFD+CGA group: receiving CGA (80 mg/kg/day), positive medicinal control group. Control group (n = 8), receiving standard diet throughout the experiment (CON; 13% of energy from fat, 24% from protein, and 63% from carbohydrate, with energy density 3.4 Kcal/g; Keao Xieli Feed) and the vehicle daily by gavage at the second month.
Sample collection and laboratory measurements
Food intake and body weight were recorded weekly. At the end of the experiment, rats were fasted overnight and sacrificed under 2% sodium pentobarbital (0.3 mL/100 g body weight) anesthesia. Body weight and length (distance from the tip of the nose to the anus) were measured, and Lee’s index calculated
Blood was collected via femoral artery puncture and allowed to clot at room temperature for 30 min. Serum was isolated via centrifugation at 1,000 × g for 20 min, at 4°C, and then stored at –80°C, for further biochemical analyses. Next, pancreas, liver, white adipose tissues in perirenal and epididymal were removed, weighed, and then either snap-frozen in liquid nitrogen, or fixed in 10% formalin, in preparation for later analysis. Visceral fat percentage (VF%) was calculated as the weight (g) of perirenal and epididymal adipose tissues divided by whole body weight (g), then multiplied by 100%.
Histology
To assess overall tissue morphology, sections (5 μm) of formalin-fixed pancreas was stained with H&E and imaged under a light microscope (CX21; Olympus, Tokyo, Japan). For histopathological scoring, H&E-stained slides were observed by two blinded pathologists. The number of pancreatic islets was determined using x10 magnification.
Serum biochemistry
Serum triglyceride (TG), total cholesterol (TC), low-density lipoprotein-cholesterol (LDL-C), and high-density lipoprotein cholesterol (HDL-C) concentrations, as well as liver TG and TC concentrations, were measured using commercially available kits (Nanjing Jiancheng Bioengineering Institute, Nanjing, China). Serum adiponectin (Abcam, Cat. # ab108784), C1q tumor necrosis factor-related protein 3 (CTRP3) (J&L Biological, Cat.# JL46562), CTRP6 (J&L Biological, Cat. # JL46565), and CTRP9 (J&L Biological, Cat.# JL46568) concentrations were measured using ELISA kits.
Oral glucose tolerance test and homeostasis model assessment of insulin resistance
The oral glucose tolerance test (OGTT) was performed three times: at the beginning, after 4 weeks, and after 8 weeks of CGA treatment, respectively. Rats have fasted for 16 h overnight and body weights were measured. Fasting blood glucose levels were read using an ACCU-CHEK Advantage glucometer (Roche, DE, Switzerland) via the tail vein. A 50% glucose solution was administered via gavage at 2 g/kg body weight, followed by blood glucose readings at 15, 30, 60, and 120 min post glucose challenge. On the last OGTT, insulin levels were assessed in retrobulbar plexus blood samples at 0, 30, 60, and 120 min, after the glucose challenge. The area under the curve of glucose (AUC-G) and insulin (AUC-I) was estimated using the trapezoidal rule. Quantitative estimation of serum insulin was performed using a rat insulin ELISA kit (Millipore, EZRMI-13K, USA), according to the manufacturer’s protocol. Insulin resistance estimation was performed using the homeostasis model assessment method (HOMA-IR), and was calculated using the following formula: HOMA-IR = fasting blood glucose (FBG, mmol/L) × fasting insulin (FINS, μU/L)/22.5.
Western blot
Liver tissues were homogenized in RIPA buffer and centrifuged at 12,000 × g for 20 min. Membranes were incubated with primary antibodies against phospho-IRS1 (Ser307) (p-IRS1) (CST, #2381), total-IRS1 (t-IRS1) (CST, #2382), phospho-Akt (Ser473) (p-Akt) (CST, #4060), total-Akt (t-Akt) (CST, # 4685), AdipoR1 (ab126611), AdipoR2 (ab77612), ELOVL6 (ab69857), AMPK (CST, #5832), p-AMPK (Thr172) (CST, #2535), and peroxisome proliferator-activated receptor-alpha (PPAR-α) (ab24509), and β-actin (C1313). Quantification of chemiluminescent signals was performed using Image J software.
Lipidomics
The plasma lipidomic profiling analysis was conducted using an UPLC-Q Exactive Orbitrap-MS instrument (Thermo, CA). Briefly, 400 μL of dichloromethane/methanol (volume ratio = 2:1) was added to 100 μL of plasma, with the lipid-containing liquid of the lower layer then collected and dried using nitrogen to obtain the lipid samples. Reverse-phase chromatography was used to separate lipid samples via a Cortecs C18 column (2.1 × 100 mm, Waters). Data were acquired using a Q Exactive orbitrap mass spectrometer (MS) (Thermo, CA), combined with the UHPLC system Ultimate 3000 (Thermo, CA). Lipids were identified and quantified using LipidSearch software v4.1.16 (Thermo, CA). Detailed conditions of the LC gradient and MS instrument parameters were the same as in previous literature (27).
Lipids are abbreviated as follows: sterol lipids cholesteryl ester (ChE), sitosterol ester (SiE); sphingolipids ceramide (Cer), dihydroceramide (DHCer), phytoceramide (PhyCer), hexa-ceramides (Hex1Cer), sphingomyelin (SM); glycerolipids triacylglycerol (TAG) and diacylglycerol (DAG); glycerophospholipids phosphatidylethanolamine (PE), phosphatidylinositol (PI). The side-chain structures are denoted as carbon chain length: the number of double bonds and are provided for each chain where they could be determined, or as a total number of all carbons and double bonds where individual chains could not be determined.
Statistical analysis
All data are presented as mean ± SEM, except where otherwise indicated. SPSS statistics 25 (IBM, Armonk, NY, USA) was used for statistical analysis. Statistical significance was determined using unpaired Student’s t-test when analyzing CON group and HFD group, for normally distributed data, and the Mann–Whitney rank sum test, f or non-normally distributed data. Comparisons among three groups (HFD, HFD+LJF, and HFD+CGA) were performed using one-way analysis of variance (ANOVA) followed by Tukey’s postdoc test, for normally distributed data, and Krus-kal-Wallis nonparametric ANOVA with Bonferroni correction, for non-normally dis-tributed data. P-values < 0.05 were considered significant.
Results
Effect of Lonicerae Japonicae Flos and chlorogenic acid on body weight
To examine the effects of LJF and CGA on the development of prediabetes, body weight was tracked weekly for 12 weeks (Figure 1A). At the end of the experiment, rats in the HFD group had significantly increased in body weight, Lee’s index, and VF% compared to CON rats (Figures 1B–D). The addition of LJF or CGA did not significantly affect the body weight, Lee’s index and VF% compared to the HFD group (Figure 1D).
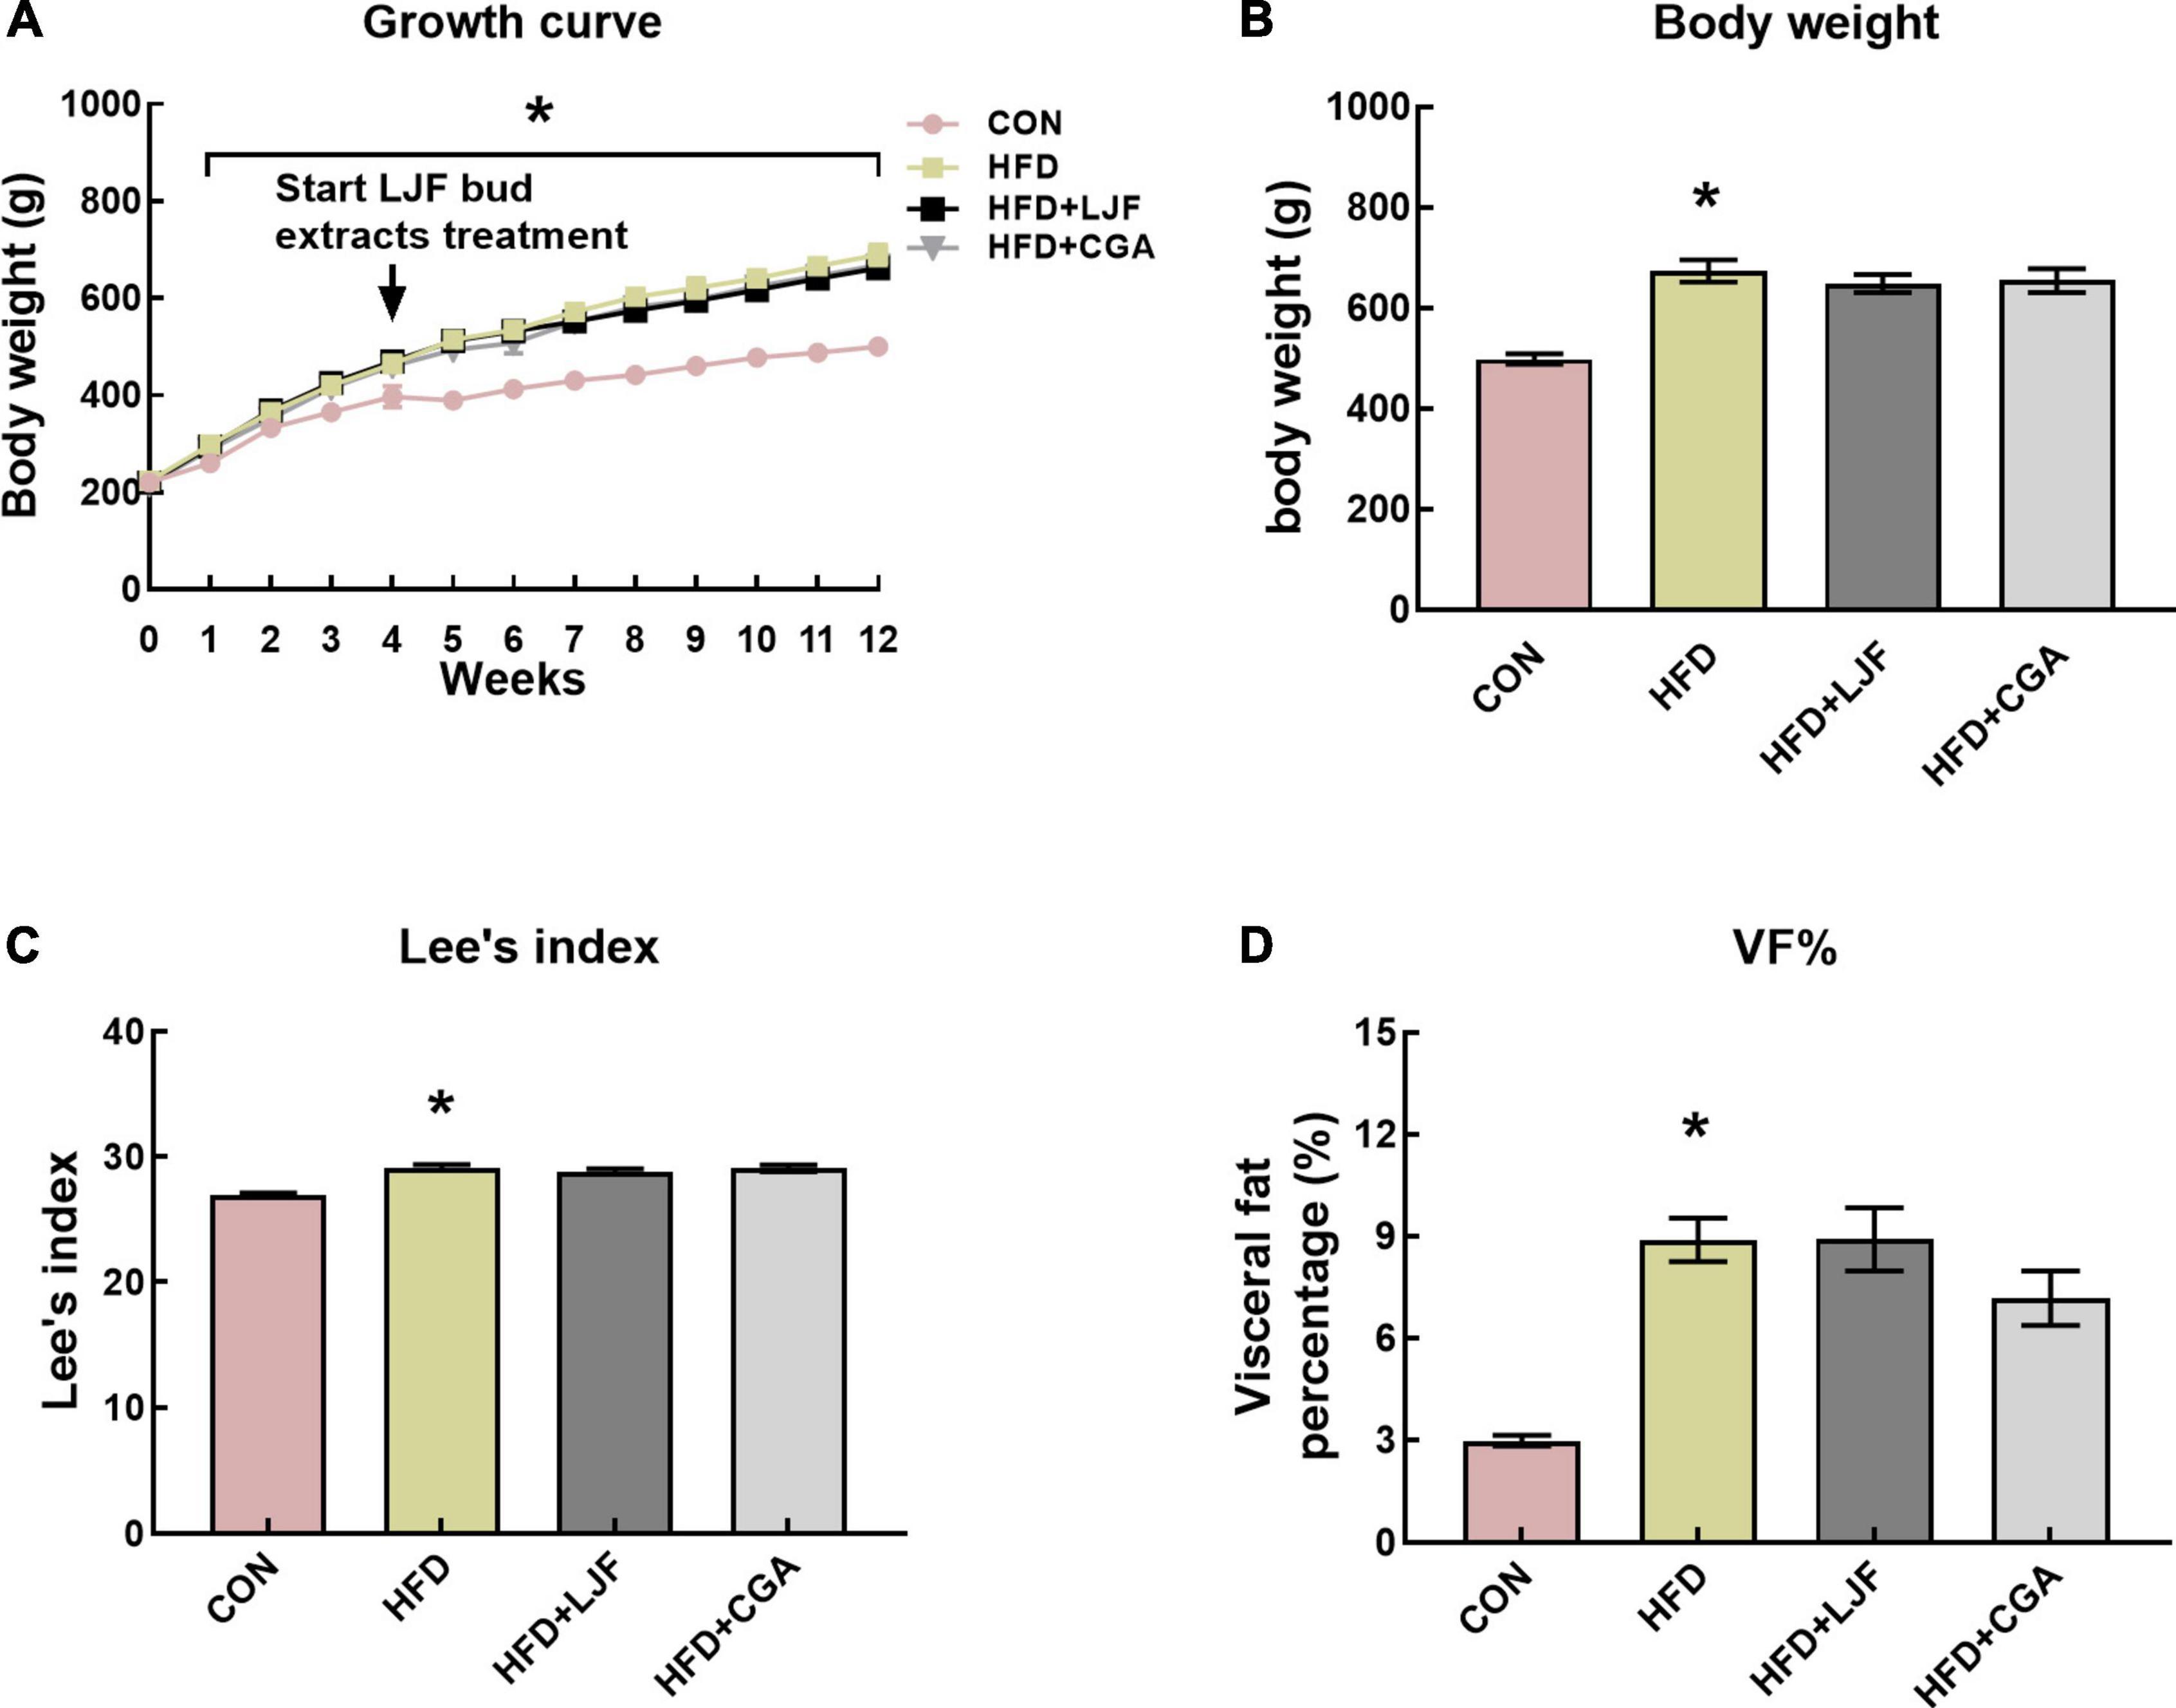
Figure 1. Lonicerae Japonicae Flos (LJF) and chlorogenic acid (CGA) have no significant effect on body weight and VF% in prediabetes rats. (A) Graph showing evolution of body weight in male SD rats fed a standard diet vs. HFD diet for up to 12 weeks. (B–D) Body weights, Lee’s index, and VF% (visceral fat mass as a percentage of body weight) at the end of the study. Data are expressed as means ± SEM (n = 8 per group). *P < 0.05, HFD group vs. CON group.
Effect of Lonicerae Japonicae Flos and chlorogenic acid on glucose tolerance and insulin sensitivity
Effect of Lonicerae Japonicae Flos and chlorogenic acid on impaired glucose tolerance
To test markers of insulin sensitivity, OGTT was performed on live rats every 4 weeks. At the beginning of LJF and CGA treatment, HFD rats had high blood glucose levels (Figure 2A), at 120 min, and an increased AUC-G (Figure 2D), compared to the CON group. After 4 weeks of LJF and CGA treatment, HFD rats had high blood glucose levels, at 60 and 120 min (Figure 2B), and an increased AUC-G (Figure 2E), compared to the CON group, and this trend continued until the end of the experiment (Figures 2C,F). As shown in Figure 2, impaired glucose tolerance (IGT) in HFD group not only lasted for a further 8 weeks following 4-week-HFD exposure but also progressively worsened. In prediabetes rats fed either LJF or CGA for 4 weeks, OGTT-60 min, OGTT-120 min glucose levels and AUC-G in the LJF group and CGA group did not differ significantly from those in the HFD group (Figures 2B,E). The OGTT-60min and OGTT-120min blood glucose levels of the LJF group and the CGA group decreased significantly after 8 weeks of LJF and CGA treatment, but AUC-G did not (Figures 2C,F).
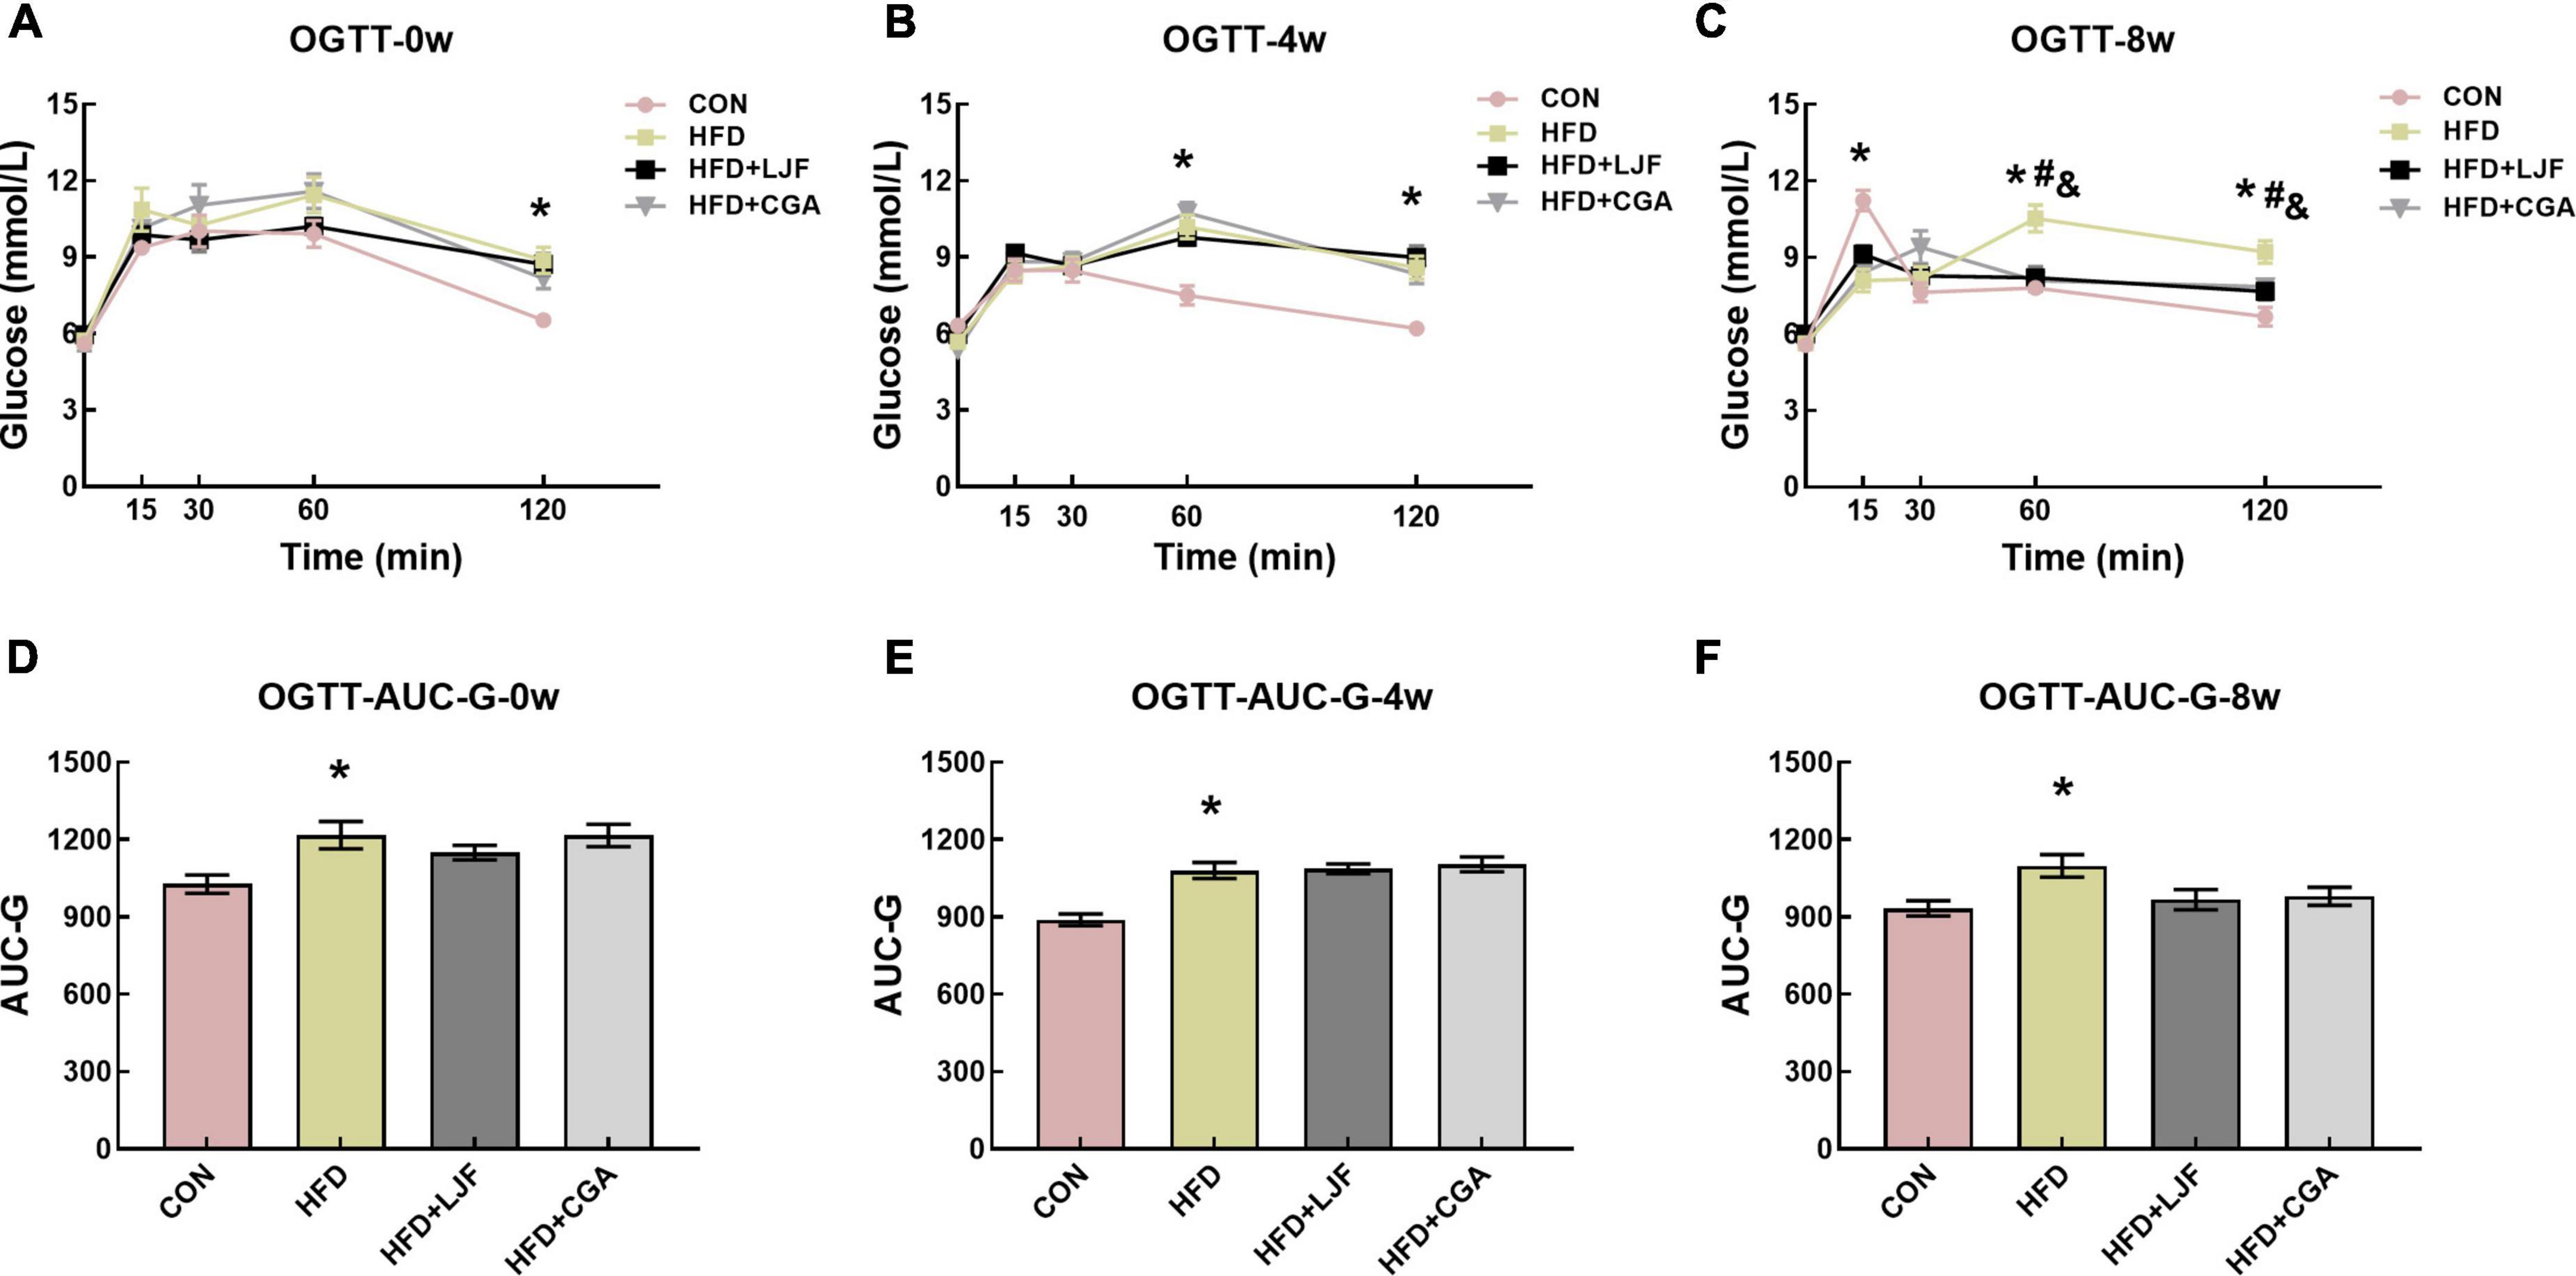
Figure 2. Lonicerae Japonicae Flos and CGA protect against HFD-induced IR and glucose homeostasis disorder in prediabetes rats. (A–C) Blood glucose during the oral glucose tolerance test (OGTT) was measured at the indicated time points after administration of 2 g/kg glucose to rats, following consumption of PBS, LJF or CGA for 0, 4, or 8 weeks (n = 8 per group). (D–F) The area under the curve of glucose (AUC-G). Dates are presented as bar graphs with means ± SEM. *P < 0.05, HFD group vs. CON group; #P < 0.05, HFD+LJF vs. HFD group; &P < 0.05, HFD+CGA vs. HFD group.
Lonicerae Japonicae Flos and chlorogenic acid decreased the level of serum insulin and insulin resistance
We next examined serum insulin levels. Our data indicated that rats fed either LJF or CGA for 8 weeks showed better insulin sensitivity. A significant increase in serum insulin was observed in HFD rats at 0, 30, 60, and 120 min compared with CON rats. LJF treated rats had significantly lower insulin levels at 0, 30, and 120 min than HFD treated rats, whereas CGA treated rats had significantly lower insulin levels at 0 and 120 min than HFD rats (Figure 3A). Although AUC-I for rats in both LJF and CGA groups did not differ, compared with the HFD group (Figure 3B), the HOMA-IR index was substantially reduced in both the LJF and CGA groups (Figure 3C). Those results are consistent with pathological findings that rats in CON group had significantly fewer pancreatic islets than rats in HFD group, and rats treated for 8 weeks with LJF or CGA also had significantly fewer pancreatic islets than rats in HFD group (Figures 3D–H). Taken together, although both LJF and CGA do not affect body mass, they still improve insulin sensitivity and glucose homeostasis.
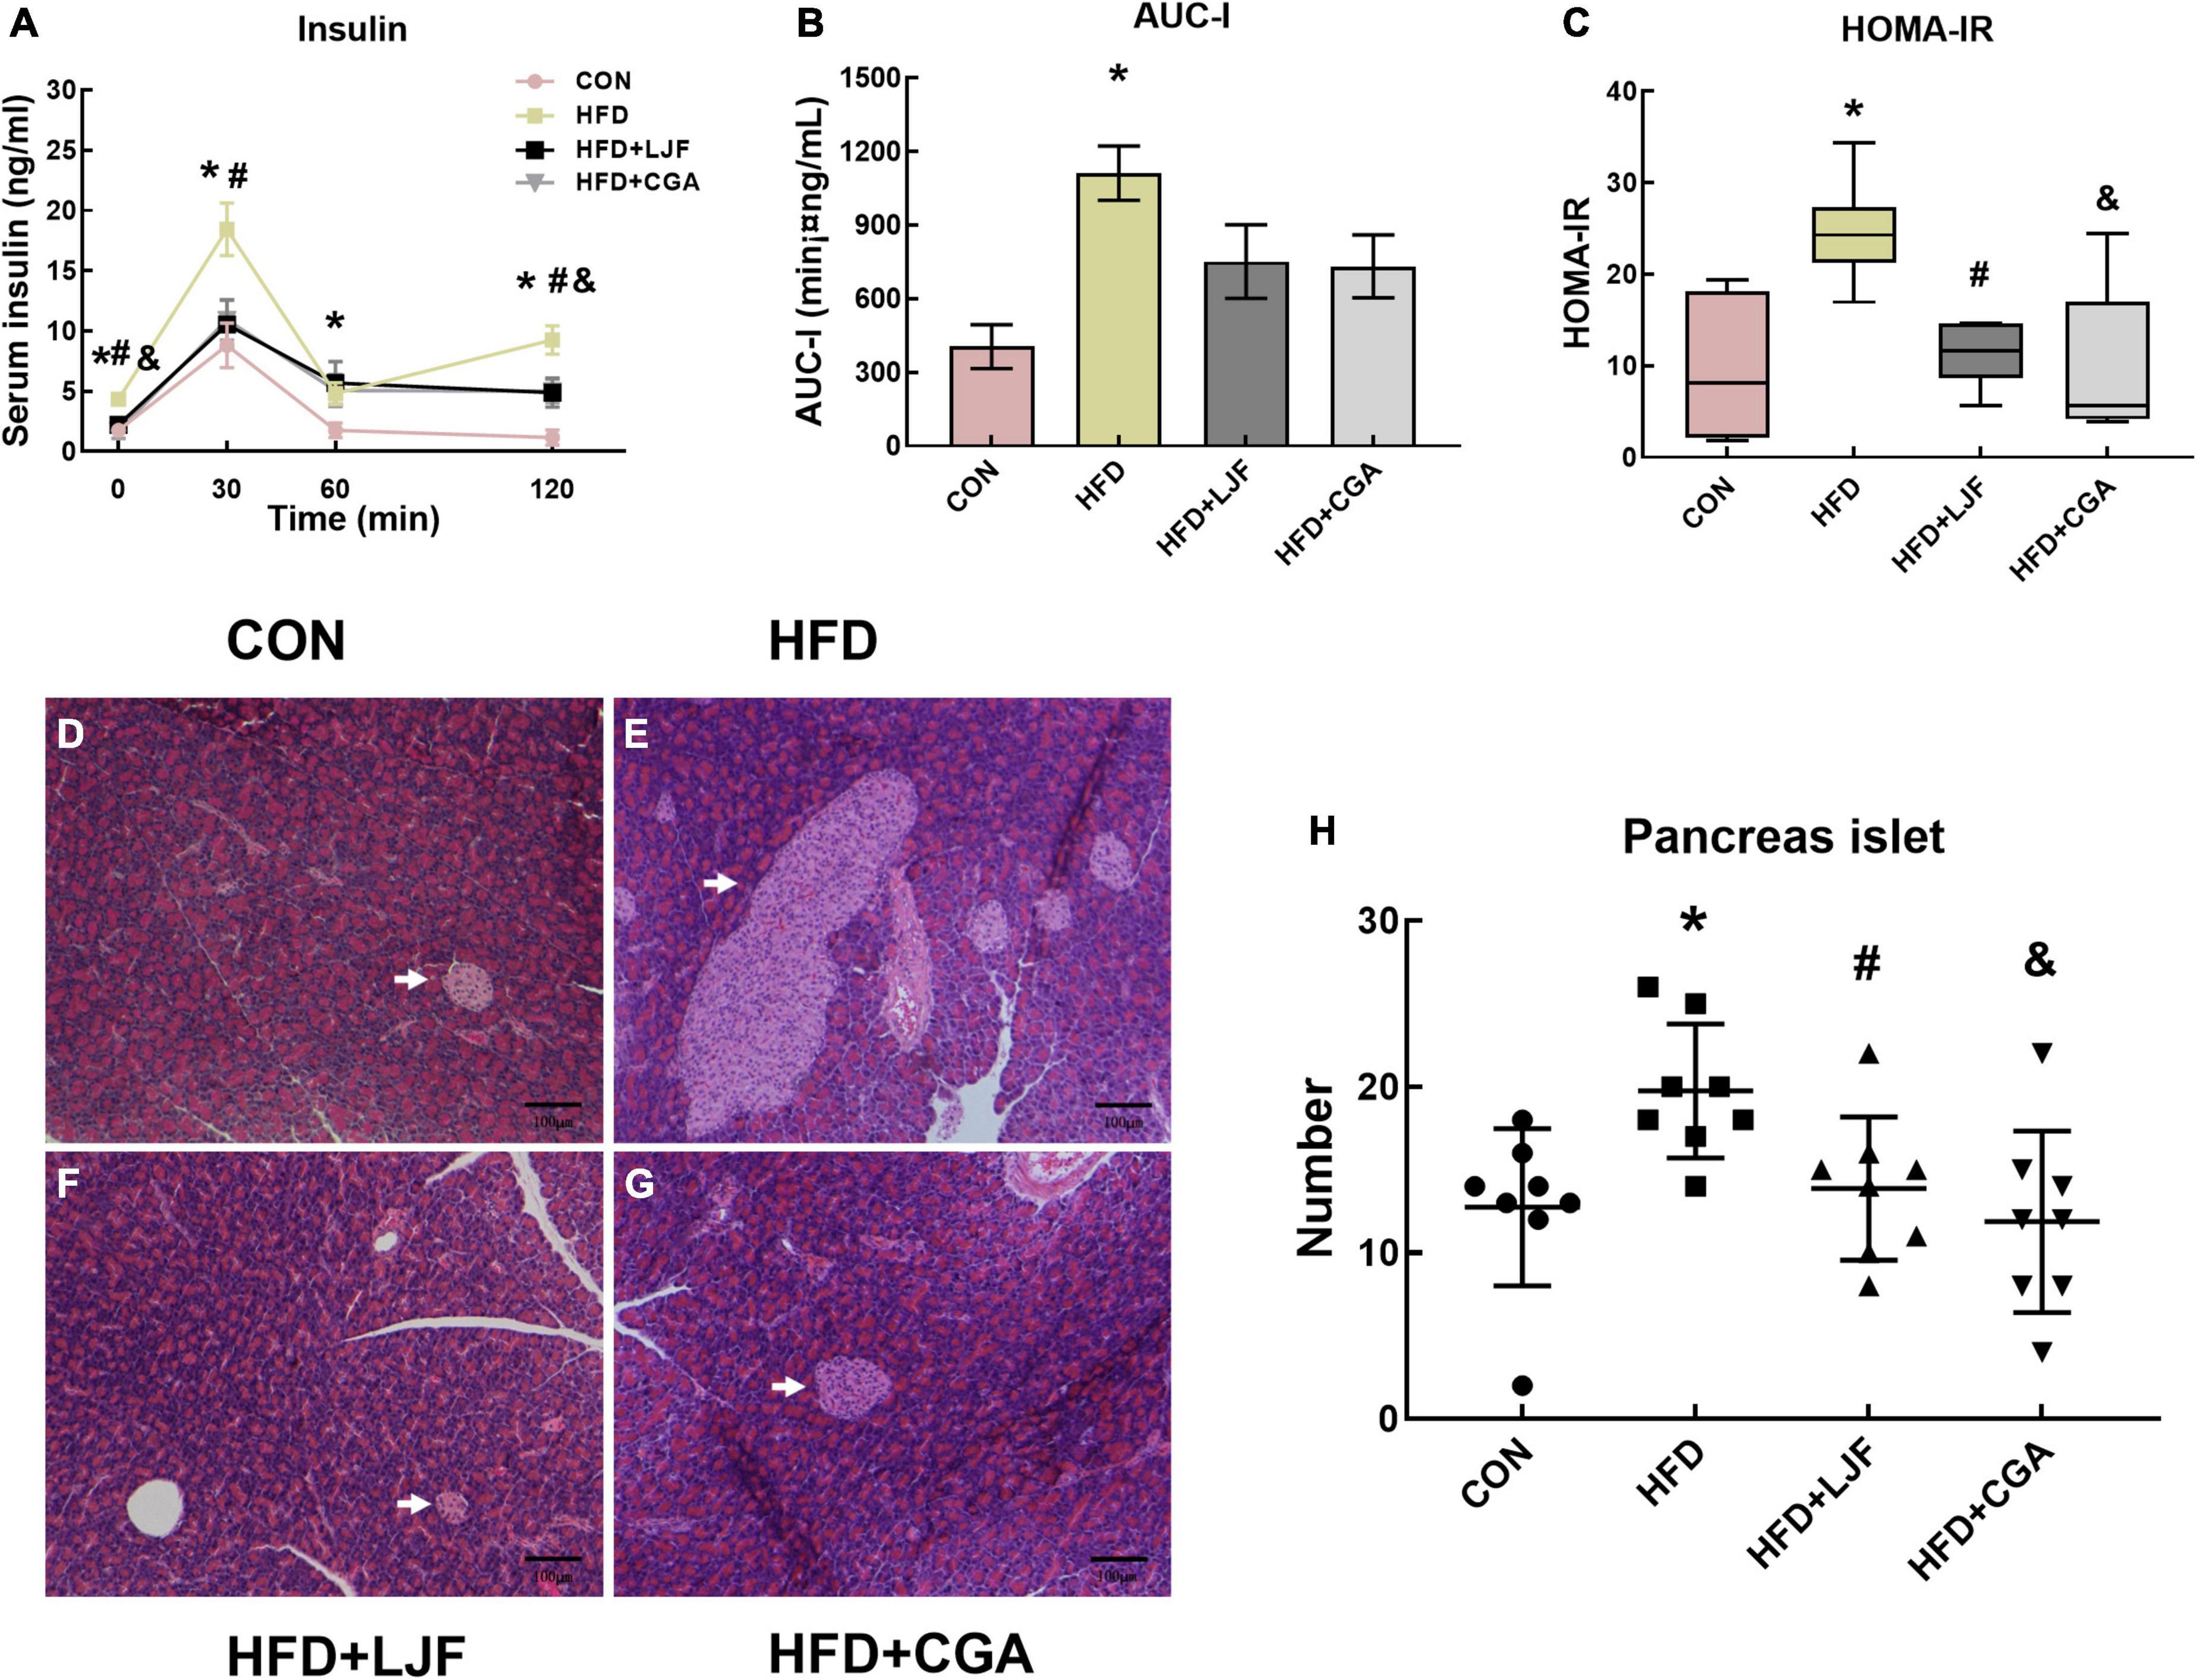
Figure 3. Lonicerae Japonicae Flos and CGA protect against HFD-induced IR and glucose homeostasis disorder and significantly reduce islet hyperplasia in prediabetes rats. (A) Serum insulin levels during the last OGTT timepoint (n = 6 per group). (B) The area under the curve of serum insulin (AUC-I) (n = 6 per group). (C) Homeostasis model assessment of insulin resistance (HOMA-IR) presented as box and whiskers plots, minimum to maximum, where the center line represents the median (n = 6 per group). (D–G) Representative H&E stained images of the pancreas (Scale bar represents 100 μm; x100) in the indicated group; islets (white arrows). (H) Scatter plot graphs (bottom panels) represent the number of pancreatic islets, each dot represents one rat. Other data are presented as bar graphs with means ± SEM. *P < 0.05, HFD group vs. CON group; #P < 0.05, HFD+LJF vs. HFD group; &P < 0.05, HFD + CGA vs. HFD group.
Lonicerae Japonicae Flos and chlorogenic acid improved insulin signaling pathway in liver
To further assess the effects of LJF and CGA on glucose tolerance, we measured the protein levels of phospho-IRS1(Ser307) and phospho-Akt (Ser473) in rat liver. We found that a HFD significantly increased phosphorylation at Ser307-(p-IRS1), which was accompanied by decreased Akt phosphorylation at Ser473-(p-Akt) in liver. In contrast, the insulin signaling pathway was dramatically ameliorated in both LJF and CGA groups, characterized by reduced IRS-1 (Ser307) phosphorylation and elevated Akt phosphorylation (Figures 4A–C).
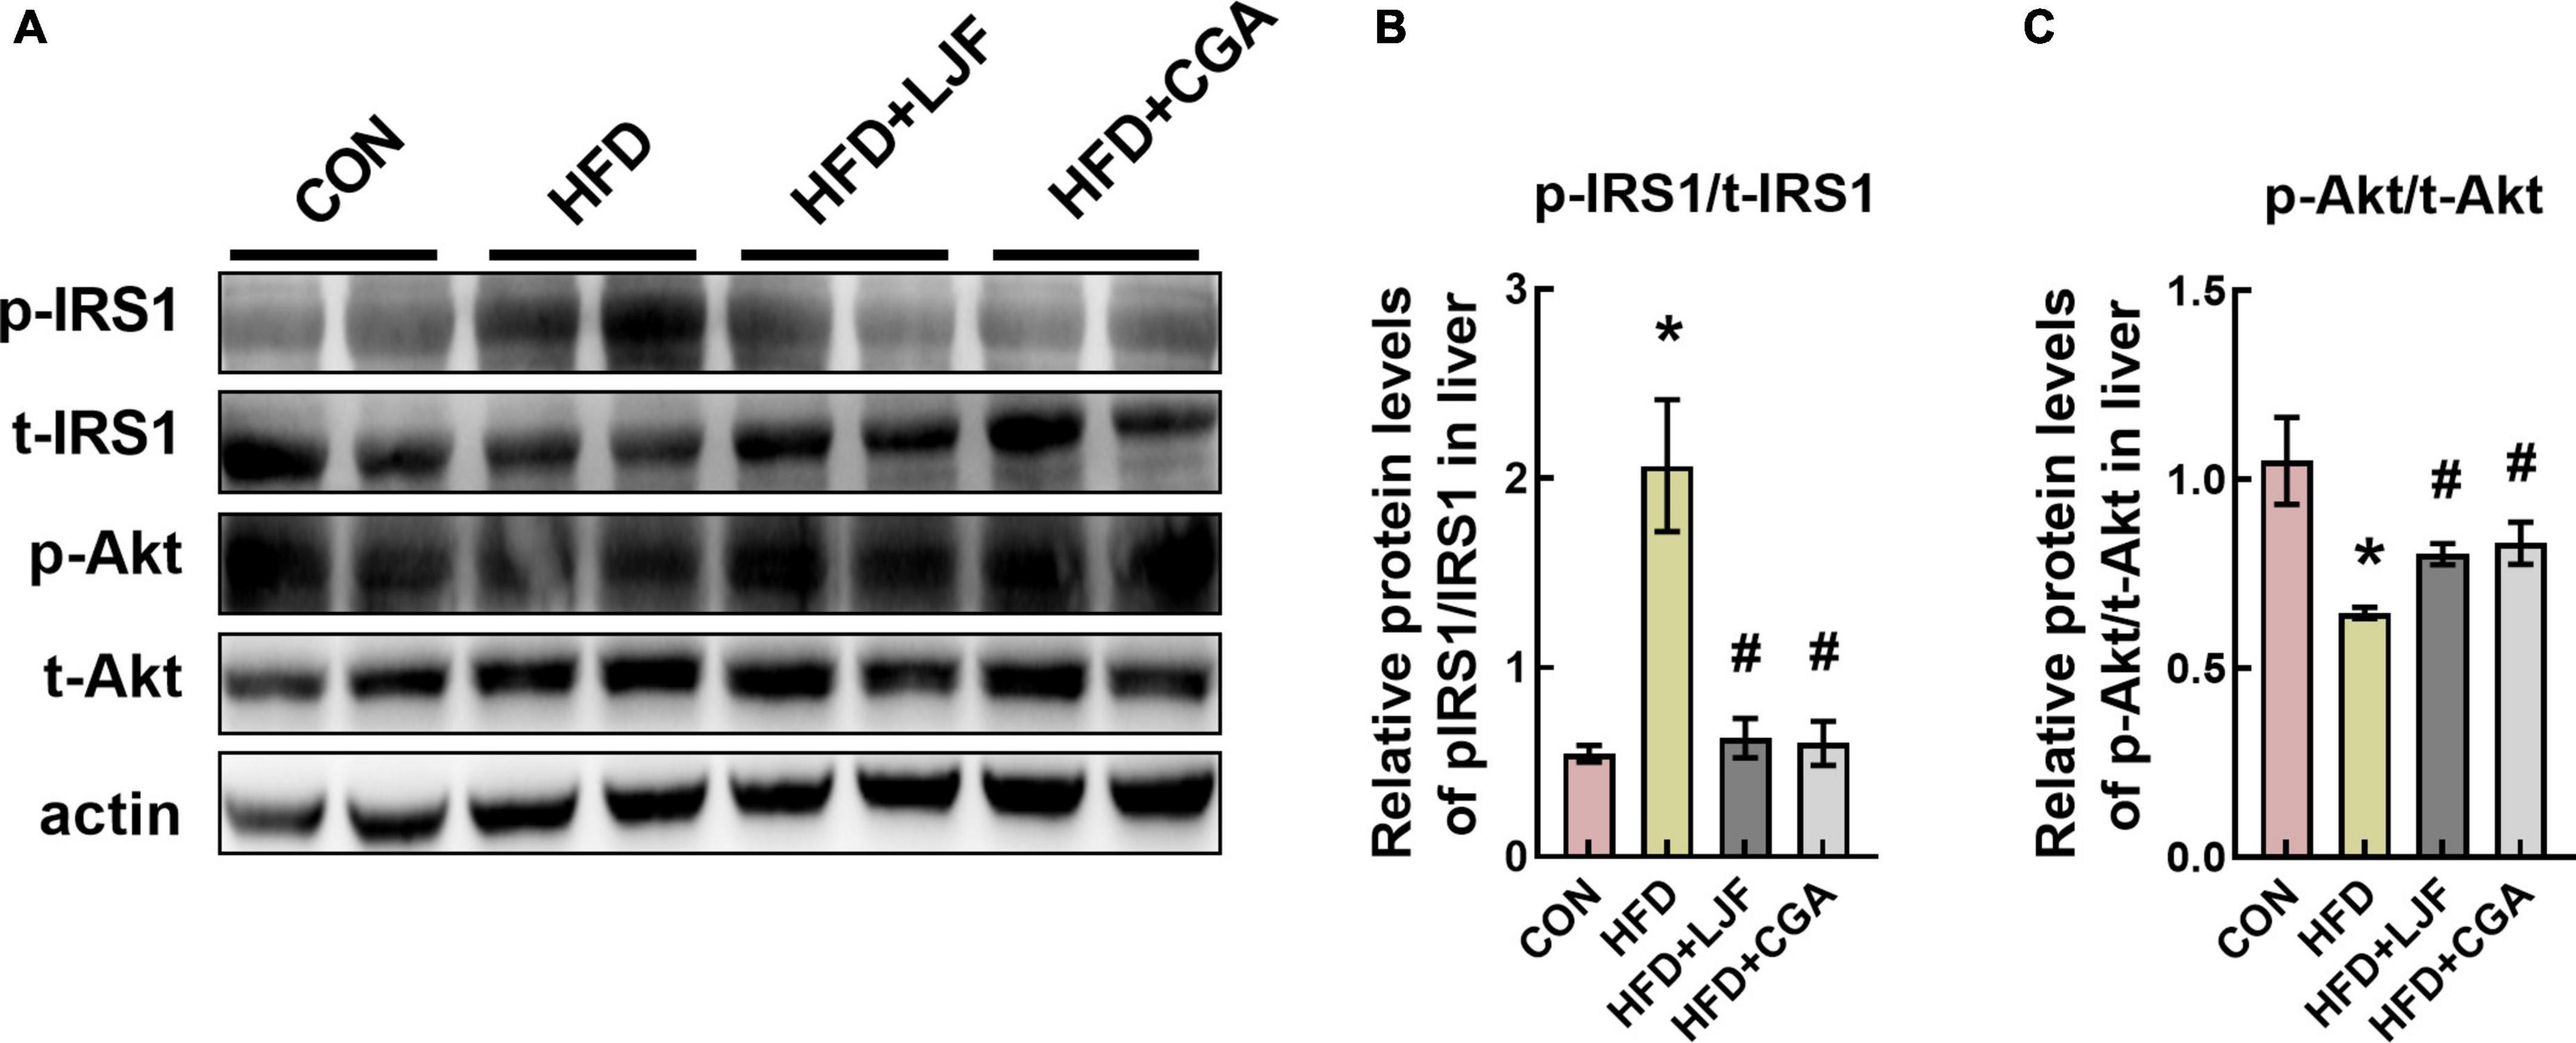
Figure 4. Lonicerae Japonicae Flos and CGA improved the insulin signaling pathway in rat liver. (A–C) Protein levels and densitometric quantification of phospho-insulin receptor substrate 1 (p-IRS1) (Ser307), total(t)-IRS1, phospho-protein kinase B (p-Akt) (Ser473), total(t)-Akt, and β-actin, bars represent densitometric quantification normalized to β-actin. All bars show means ± SEM. (n = 4 per group). *P < 0.05, vs. CON group; #P < 0.05, vs. HFD group.
Lonicerae Japonicae Flos and chlorogenic acid improved lipid homeostasis
Prediabetes is ultimately accompanied by abnormal lipid metabolism and adipokine disorder. As expected, compared with the CON group, dyslipidemia was present in HFD-induced prediabetes rats, as indicated by increased serum LDL-C and TG (Table 1), as well as increased liver TC and TG content. Conversely, HDL-C levels were significantly decreased than in CON group (Table 1). Compared with the HFD group, we found that LJF treated rats had significantly higher serum HDL-C, while CGA treated rats had significantly lower hepatic TC and serum LDL-C levels (Table 1).
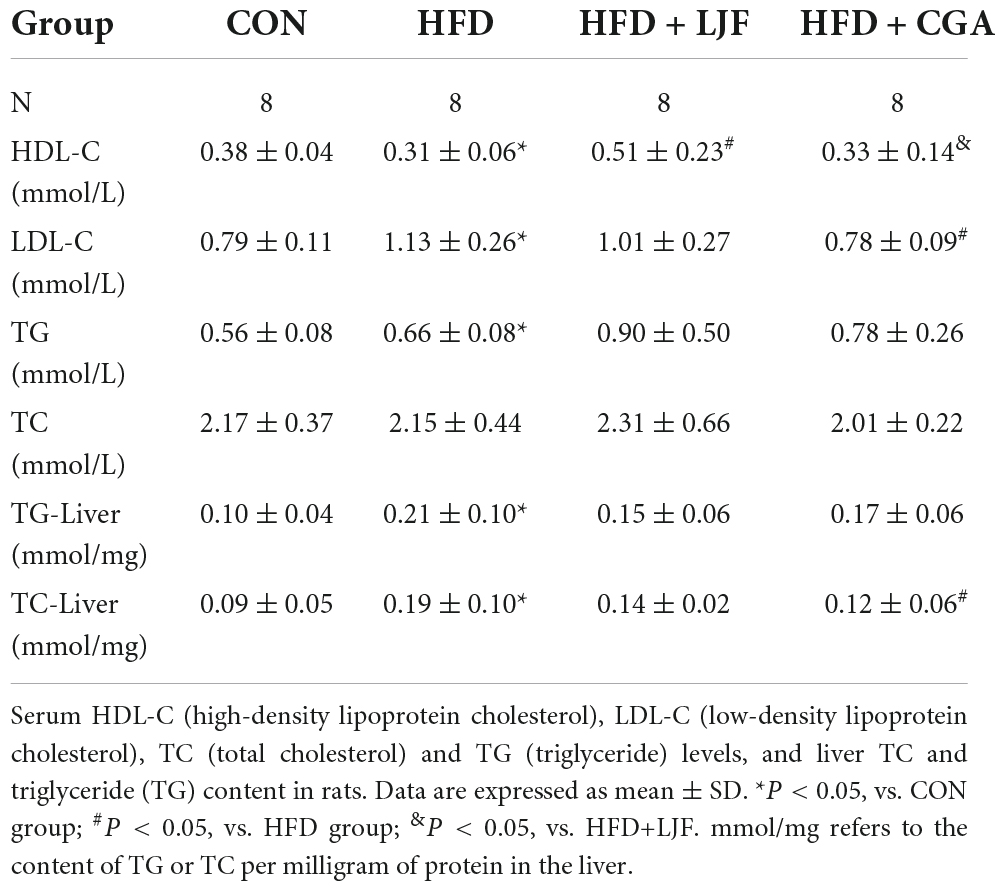
Table 1. Effect of Lonicerae Japonicae Flos (LJF) and chlorogenic acid (CGA) on blood lipid and liver lipid content.
Next, we performed lipidomic analysis due to the high complexity of the plasma lipidome. At the end of the experiment, the HFD diet significantly elevated plasma levels of Cer (d18:1/18:0), with neither LJF nor CGA attenuating this increase, However, the Cer (d18:1/18:0) levels showed a small but not significant increase in the CGA group than in the LJF group. By contrast, the HFD diet significantly reduced the contents of many very long chain-containing ceramides species (Figures 5A–D), some of which can be reversed by LJF and CGA treatment. In detail, CGA significantly attenuating the reduction of Cer (d18:1/23:0), Cer (d18:1/24:0), Cer (d18:1/25:0) and Cer (d18:1/26:0) (Figure 5D). However, Hex1Cer (t18:0/24:0+O) and PhyCer (t18:0/24:0) (Figure 5D) contents were reduced in the HFD group with LJF attenuating the reduction, and similar trends were observed for the PI and PE species (Figure 5H). Furthermore, the level of DHCer (d18:0/24:0) reduced in the HFD group was significantly increased by both LJF and CGA (Figure 5D). By contrast, the amount of SM and ChE species combined was increased by the HFD diet, with LJF significantly attenuating this increase whereas CGA supplementation did not affect those species (Figures 5E–G). Interestingly, LJF exerted specific effects on several SiE species that were decreased by the HFD diet, such as the reduction of SiE (18:2), SiE (20:4), and SiE (22:6) levels (Figure 5I). For more details, see Supplementary material.
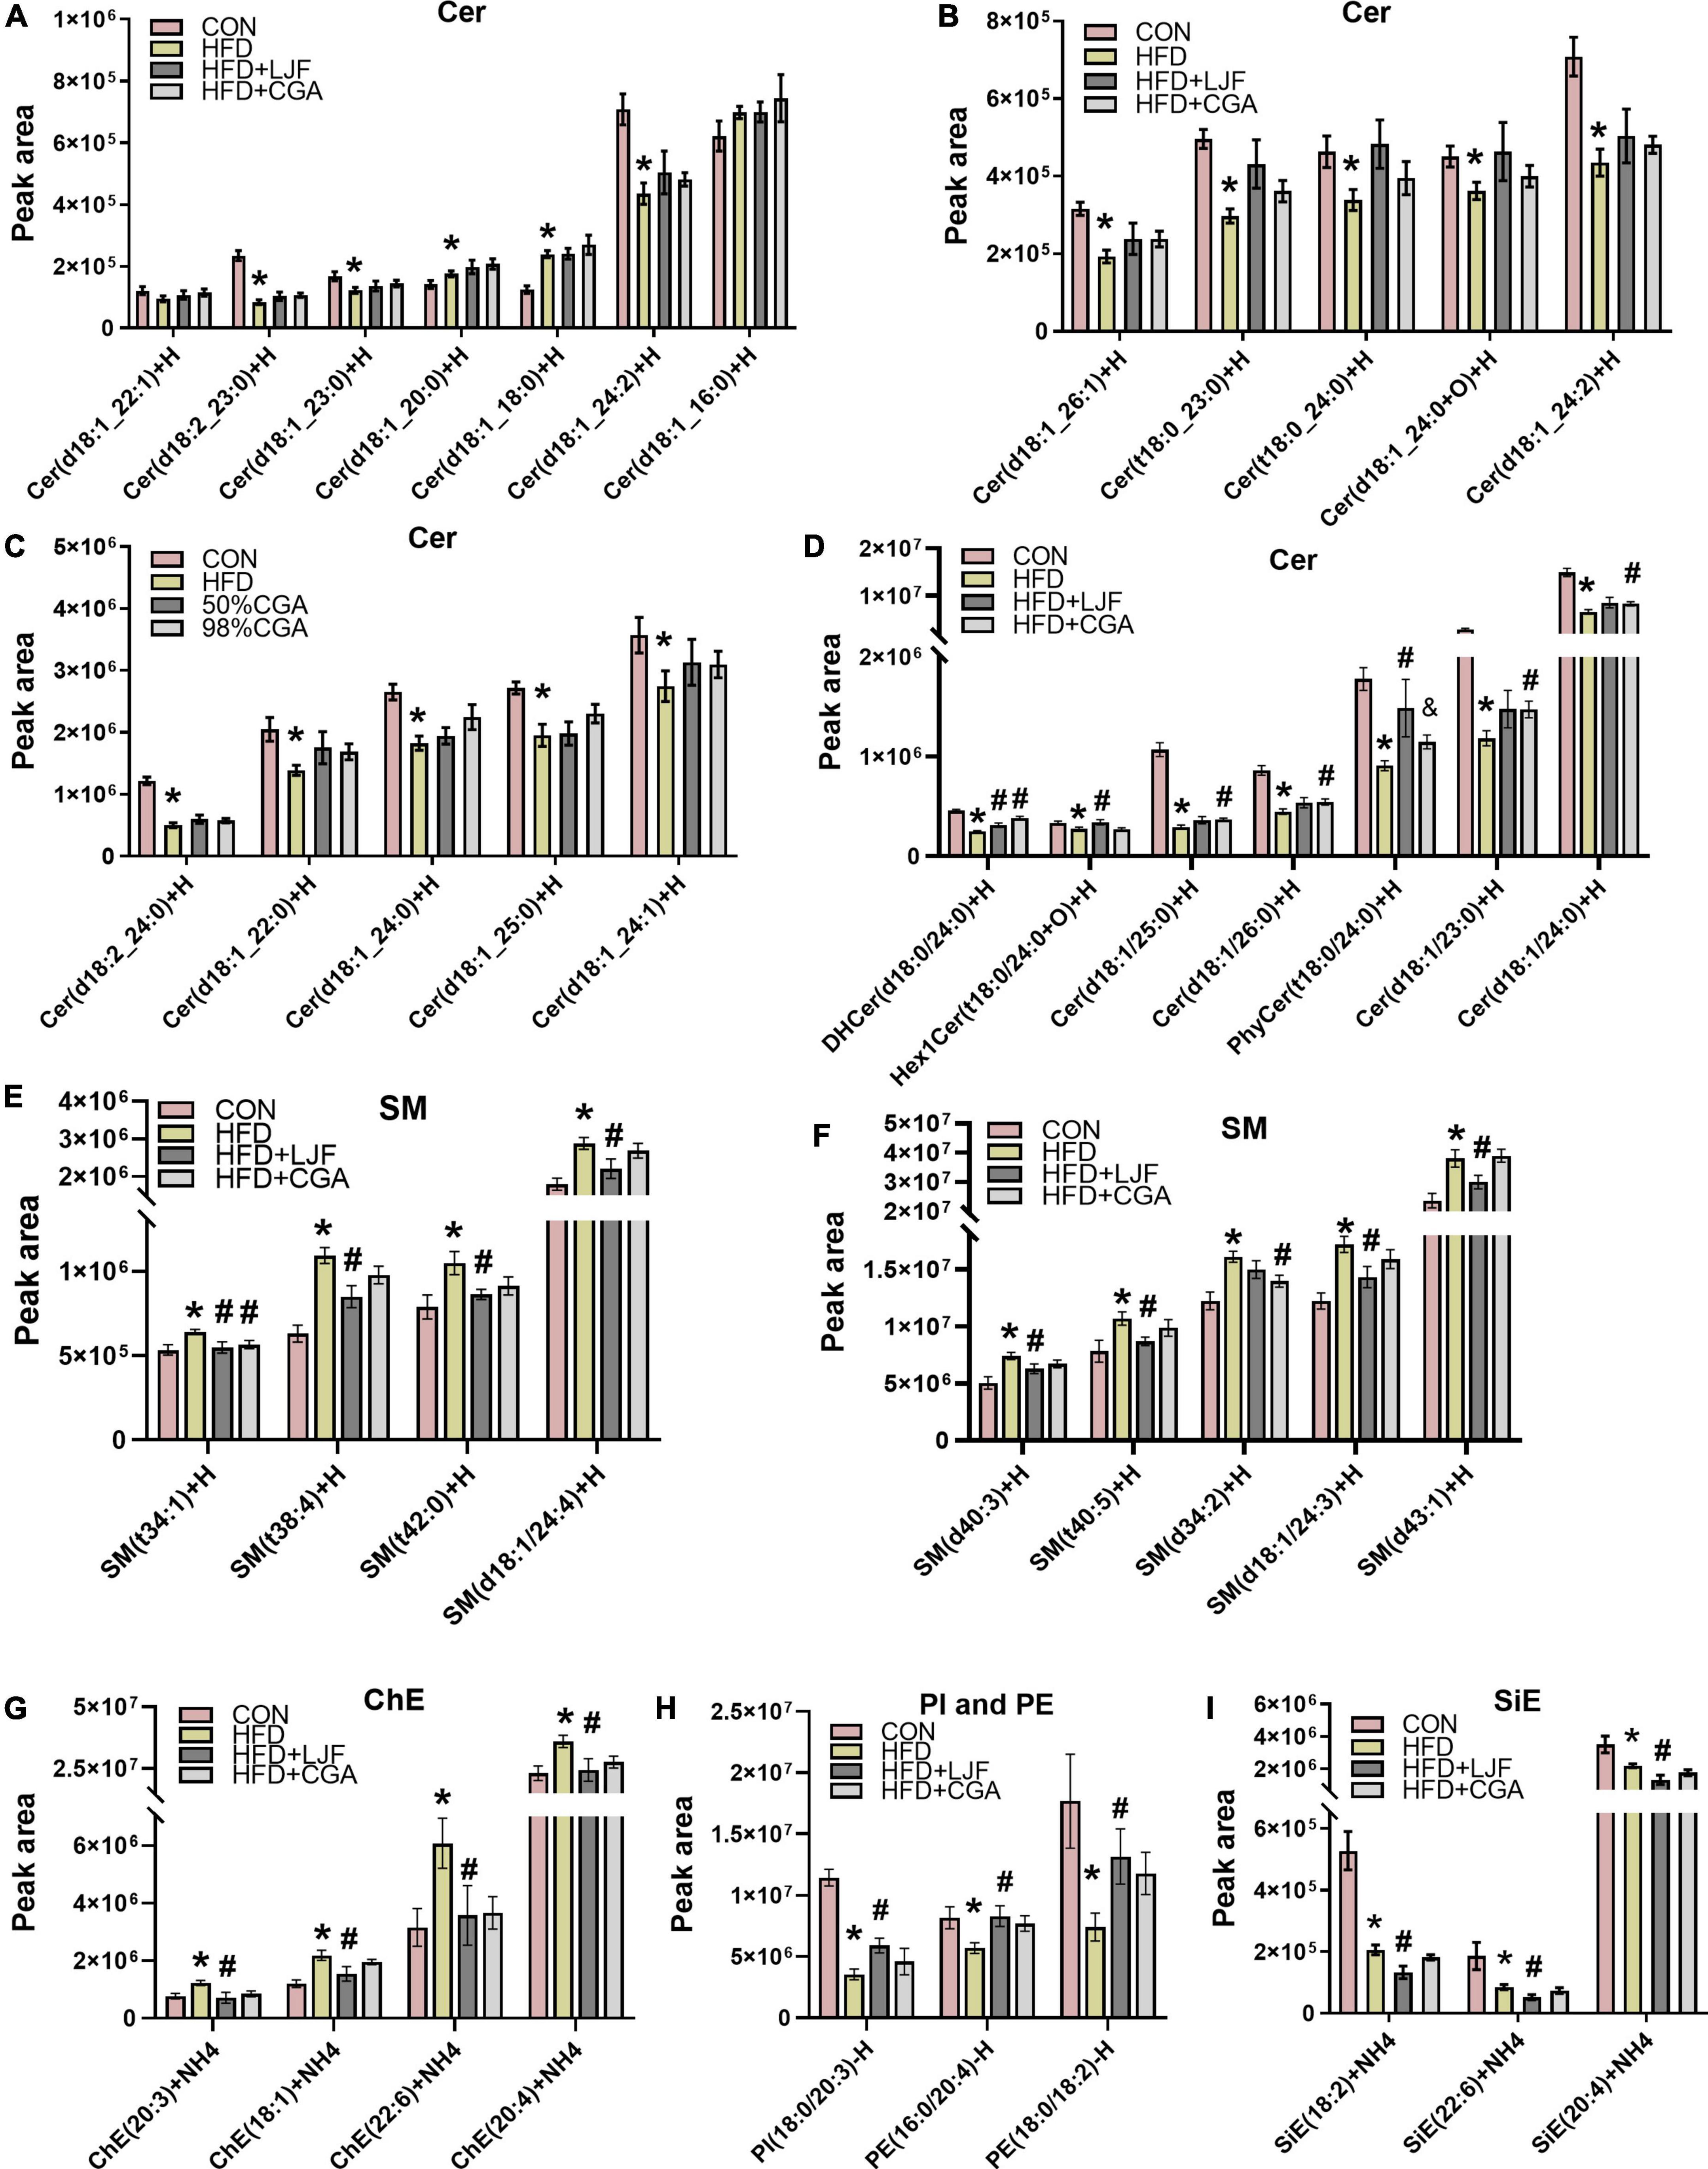
Figure 5. Lonicerae Japonicae Flos and CGA regulated plasma sphingolipids levels. (A–D) Lipidomic Analysis in rat plasma concentrations of ceramide (Cer) species. (E–I) Plasma concentrations of sphingomyelin (SM), cholesteryl ester (ChE), sitosterol ester (SiE), phosphatidylethanolamine (PE), and phospha-tidylinositol (PI). Data are presented as bar graphs with means ± SEM (n = 8 per group). *P < 0.05, vs. CON group; #P < 0.05, vs. HFD group; &P < 0.05, vs. HFD + LJF.
We have also analyzed the fatty acid profile of the plasma TAGs and DAG. Notably, levels of C18:2, C18:3, and C24:1 containing-TAGs were significantly reduced in the HFD group with LJF attenuating this change. The opposite trend is observed in concentrations of C18:1 and C20:4 containing-TAGs such as TAG (20:5/18:2/20:4), TAG (18:1/18:1/20:4), and TAG (18:1/18:1/22:6), whereas CGA treatment not reversing those changes (Figure 6B). As there were for DAG species, there were decreases in the abundance of C18:2, C18:3, and C22:6 containing DAG species with both LJF and CGA strikingly reversing this decrease, excepting DAG (16:0/22:6) (LJF only). However, the levels of DAG species containing C16:0 and C18:0, including DAG (16:0/16:0), DAG (18:0/18:0), and DAG (18:0/16:0), elevated in HFD animals were decreased in the CGA group only, whereas elevated DAG (18:0/20:0) in HFD reversed by both LJF and CGA treatment (Figure 6A).
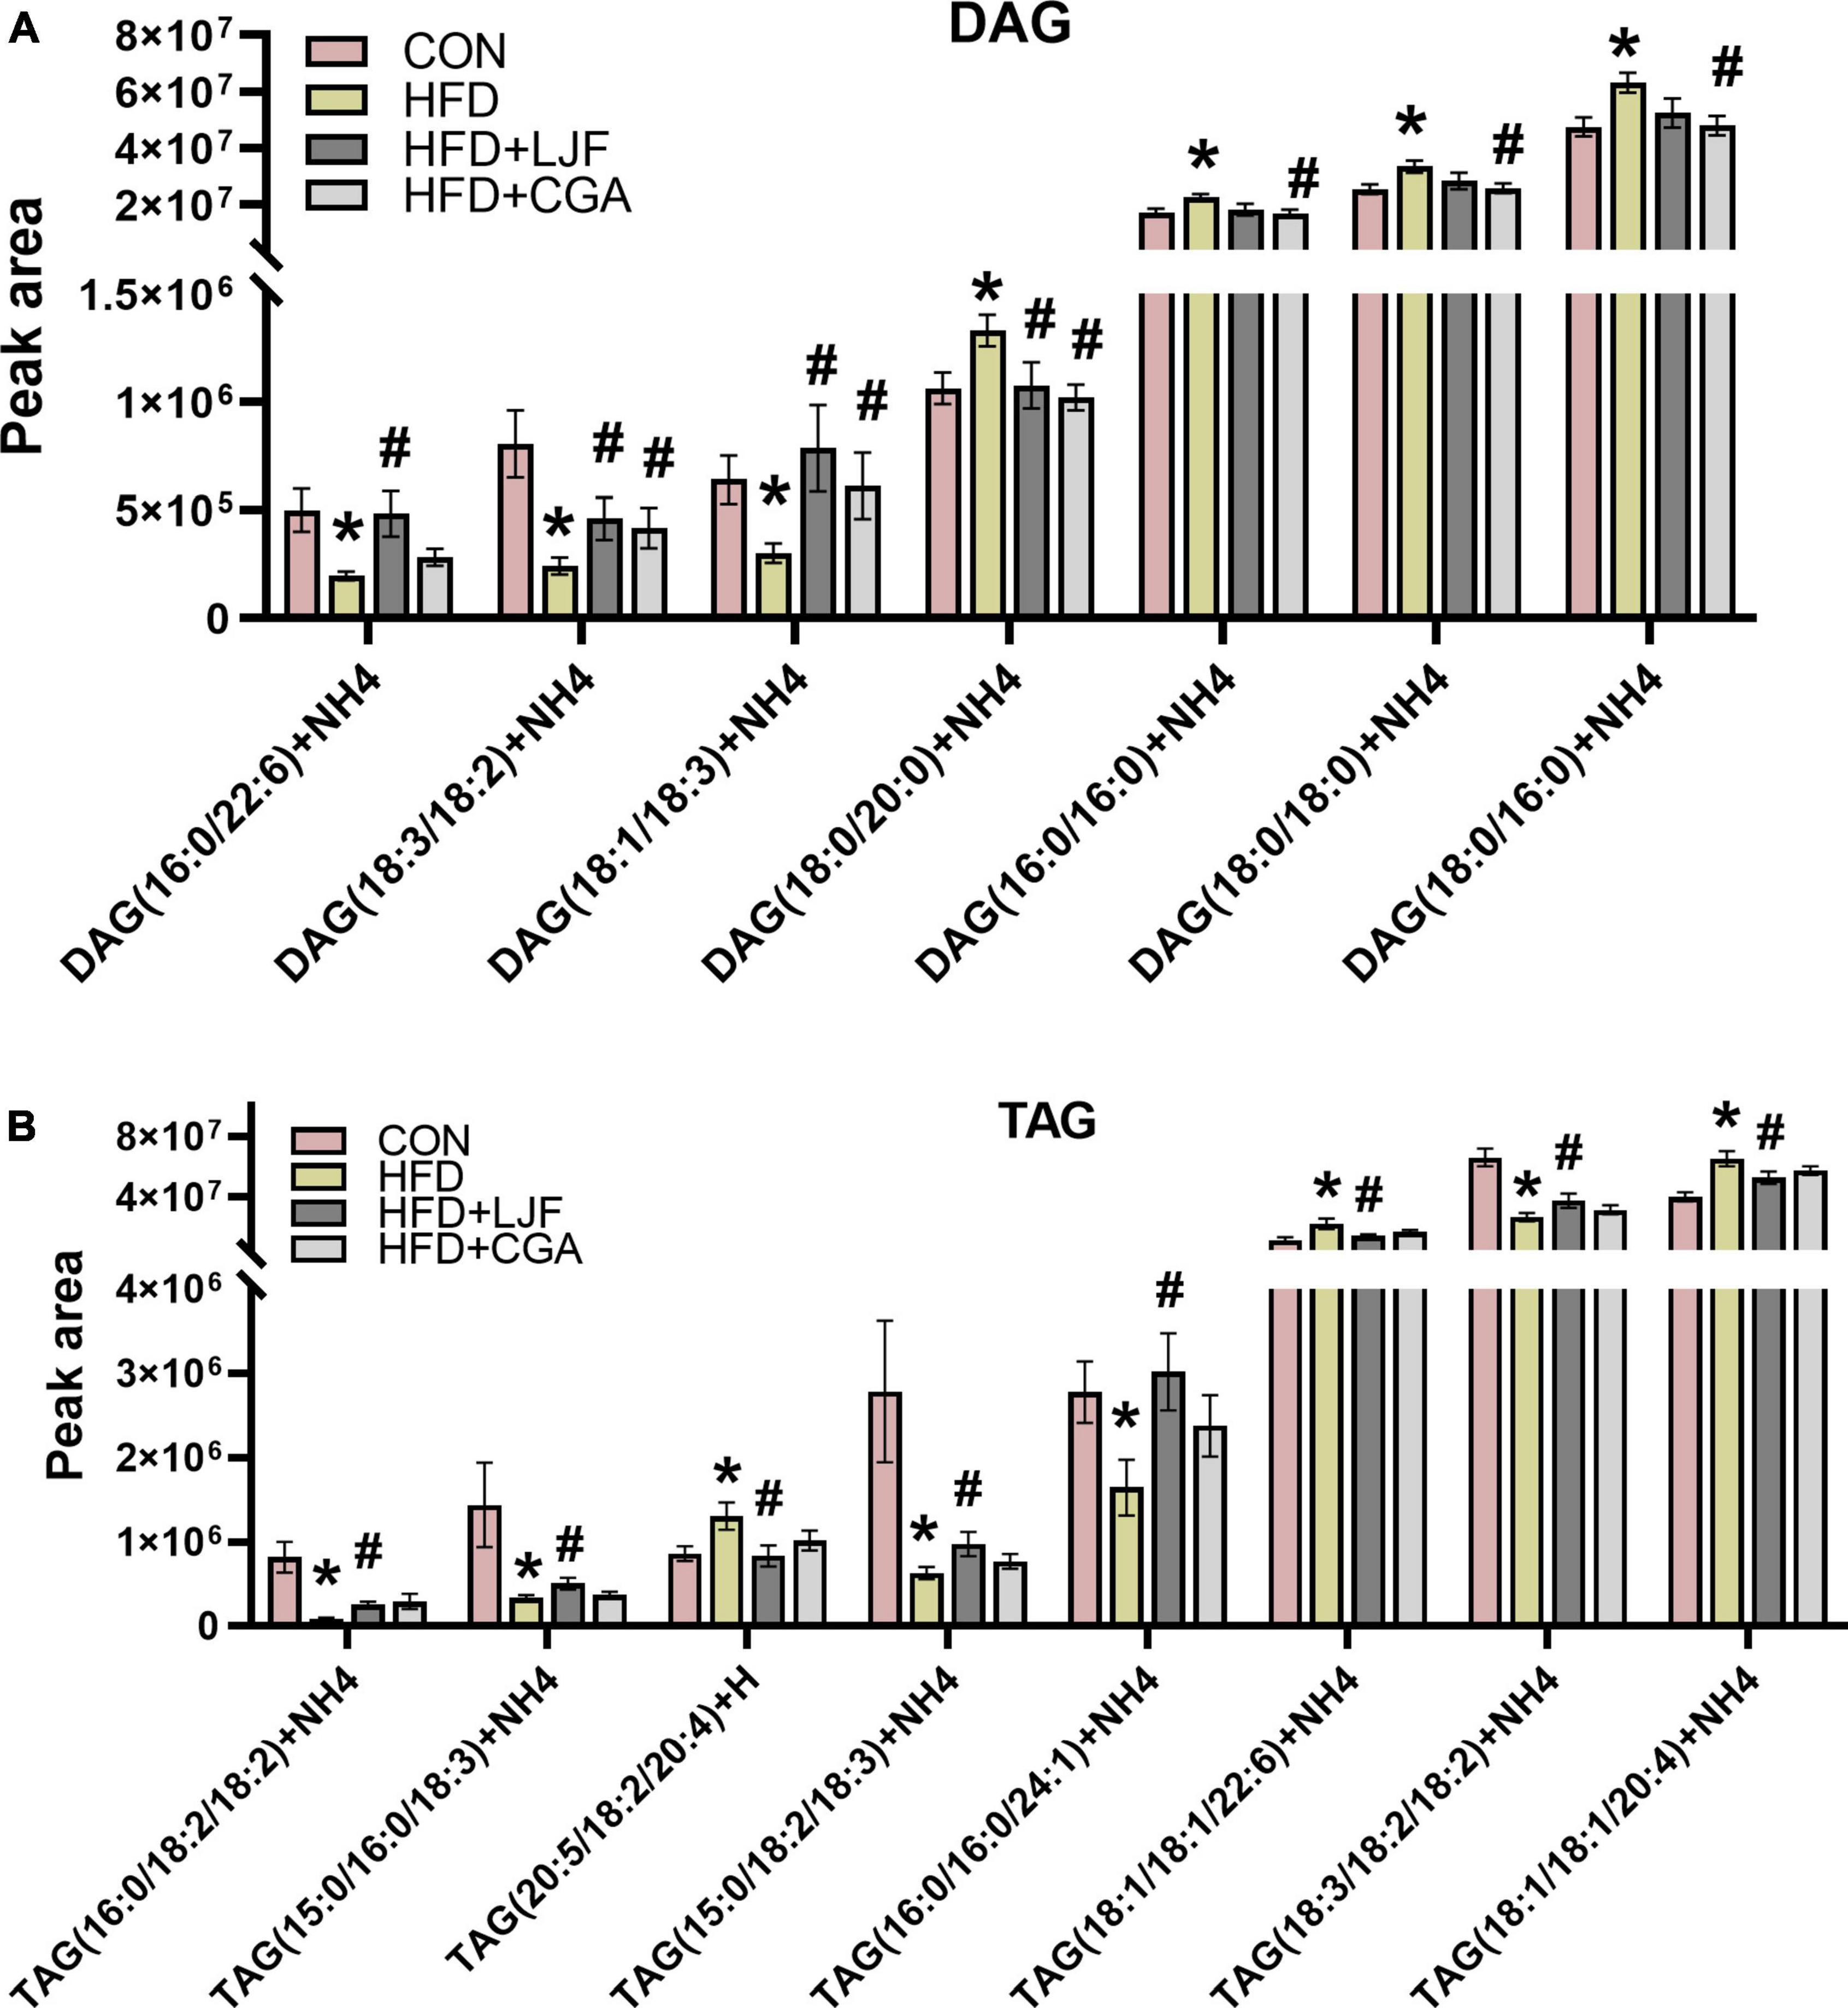
Figure 6. Lonicerae Japonicae Flos and CGA regulated plasma diacylglycerol (DAG) and triacylglycerol (TAG) species levels. Lipidomic Analysis in Rat (A) plasma concentrations of DAG species. (B) Plasma concentrations of TAG species. Data are presented as bar graphs with means ± SEM (n = 8 per group). *P < 0.05, vs. CON group; #P < 0.05, vs. HFD group; &P < 0.05, vs. HFD + LJF.
Lonicerae Japonicae Flos and chlorogenic acid activate the adiponectin pathway
To gain more insight into the mechanisms involved in the regulation of IGT and lipid metabolism, we examined the effects of LJF and CGA treatment on CTRPs-AdipoRs signaling pathways and ELOVL6 which regulates the acyl-chain composition of ceramide (28).
Results showed that lower serum adiponectin, CTRP3, and CTRP9 levels of serum were observed in rats exposed to HFD feeding when compared with CON group. Compared with HFD group, the level of serum CTRP3 was higher following LJF and CGA treatment, with CTRP3 significantly higher in the CGA group than in the LJF group. In addition, decreased serum CRTP9 in HFD-fed rats was increased by LJF. These results indicate that both LJF and CGA have therapeutic effects on the reversal of adipokine disorder (Table 2).
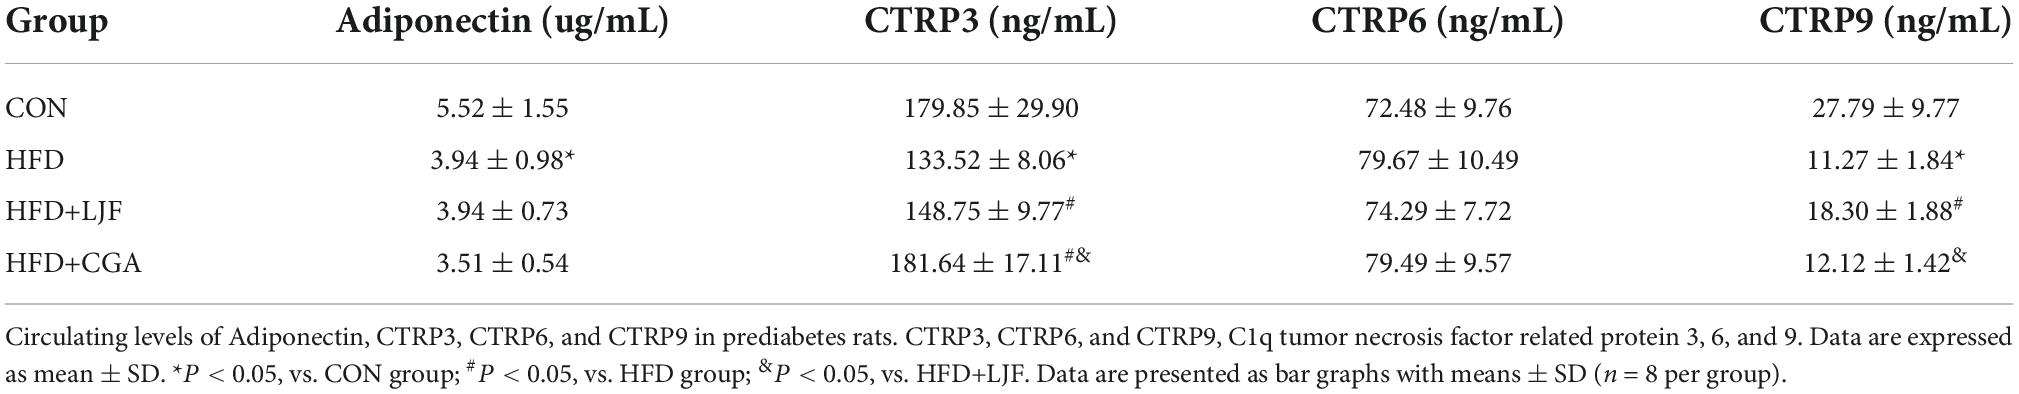
Table 2. Lonicerae Japonicae Flos and CGA improved serum adipokine disorder.
Compared with the CON group, the liver expression level of AdipoR1 and AdipoR2 expression did not change significantly in the HFD group. Interestingly, rats treated with LJF or CGA for 8 weeks showed significantly upregulated expression levels of AdipoR1 and AdipoR2 than the HFD group. Next, we analyzed PPARα expression and the phosphorylation of AMPK, because AdipoR1 activates the AMPK pathway and AdipoR2 activates the PPARα pathway, respectively (29). We found that the phosphorylation of AMPK was significantly increased by LJF and CGA administration. And the CGA administration markedly increased the expression of PPARα which was decreased in HFD group. These results suggest that LJF enhances lipid metabolism partially by the regulation of the CTRP9/ AdipoR1/AMPK axis, while CGA via the CTRP3/AdipoR2/PPARa axis.
Furthermore, the liver ELOVL6 expression was also reduced in the HFD group versus the CON group, and both LJF and CGA attenuated this reduction. Interestingly, the hepatic ELOVL6 level was significantly higher in the CGA group than in the LJF group (Figure 7).
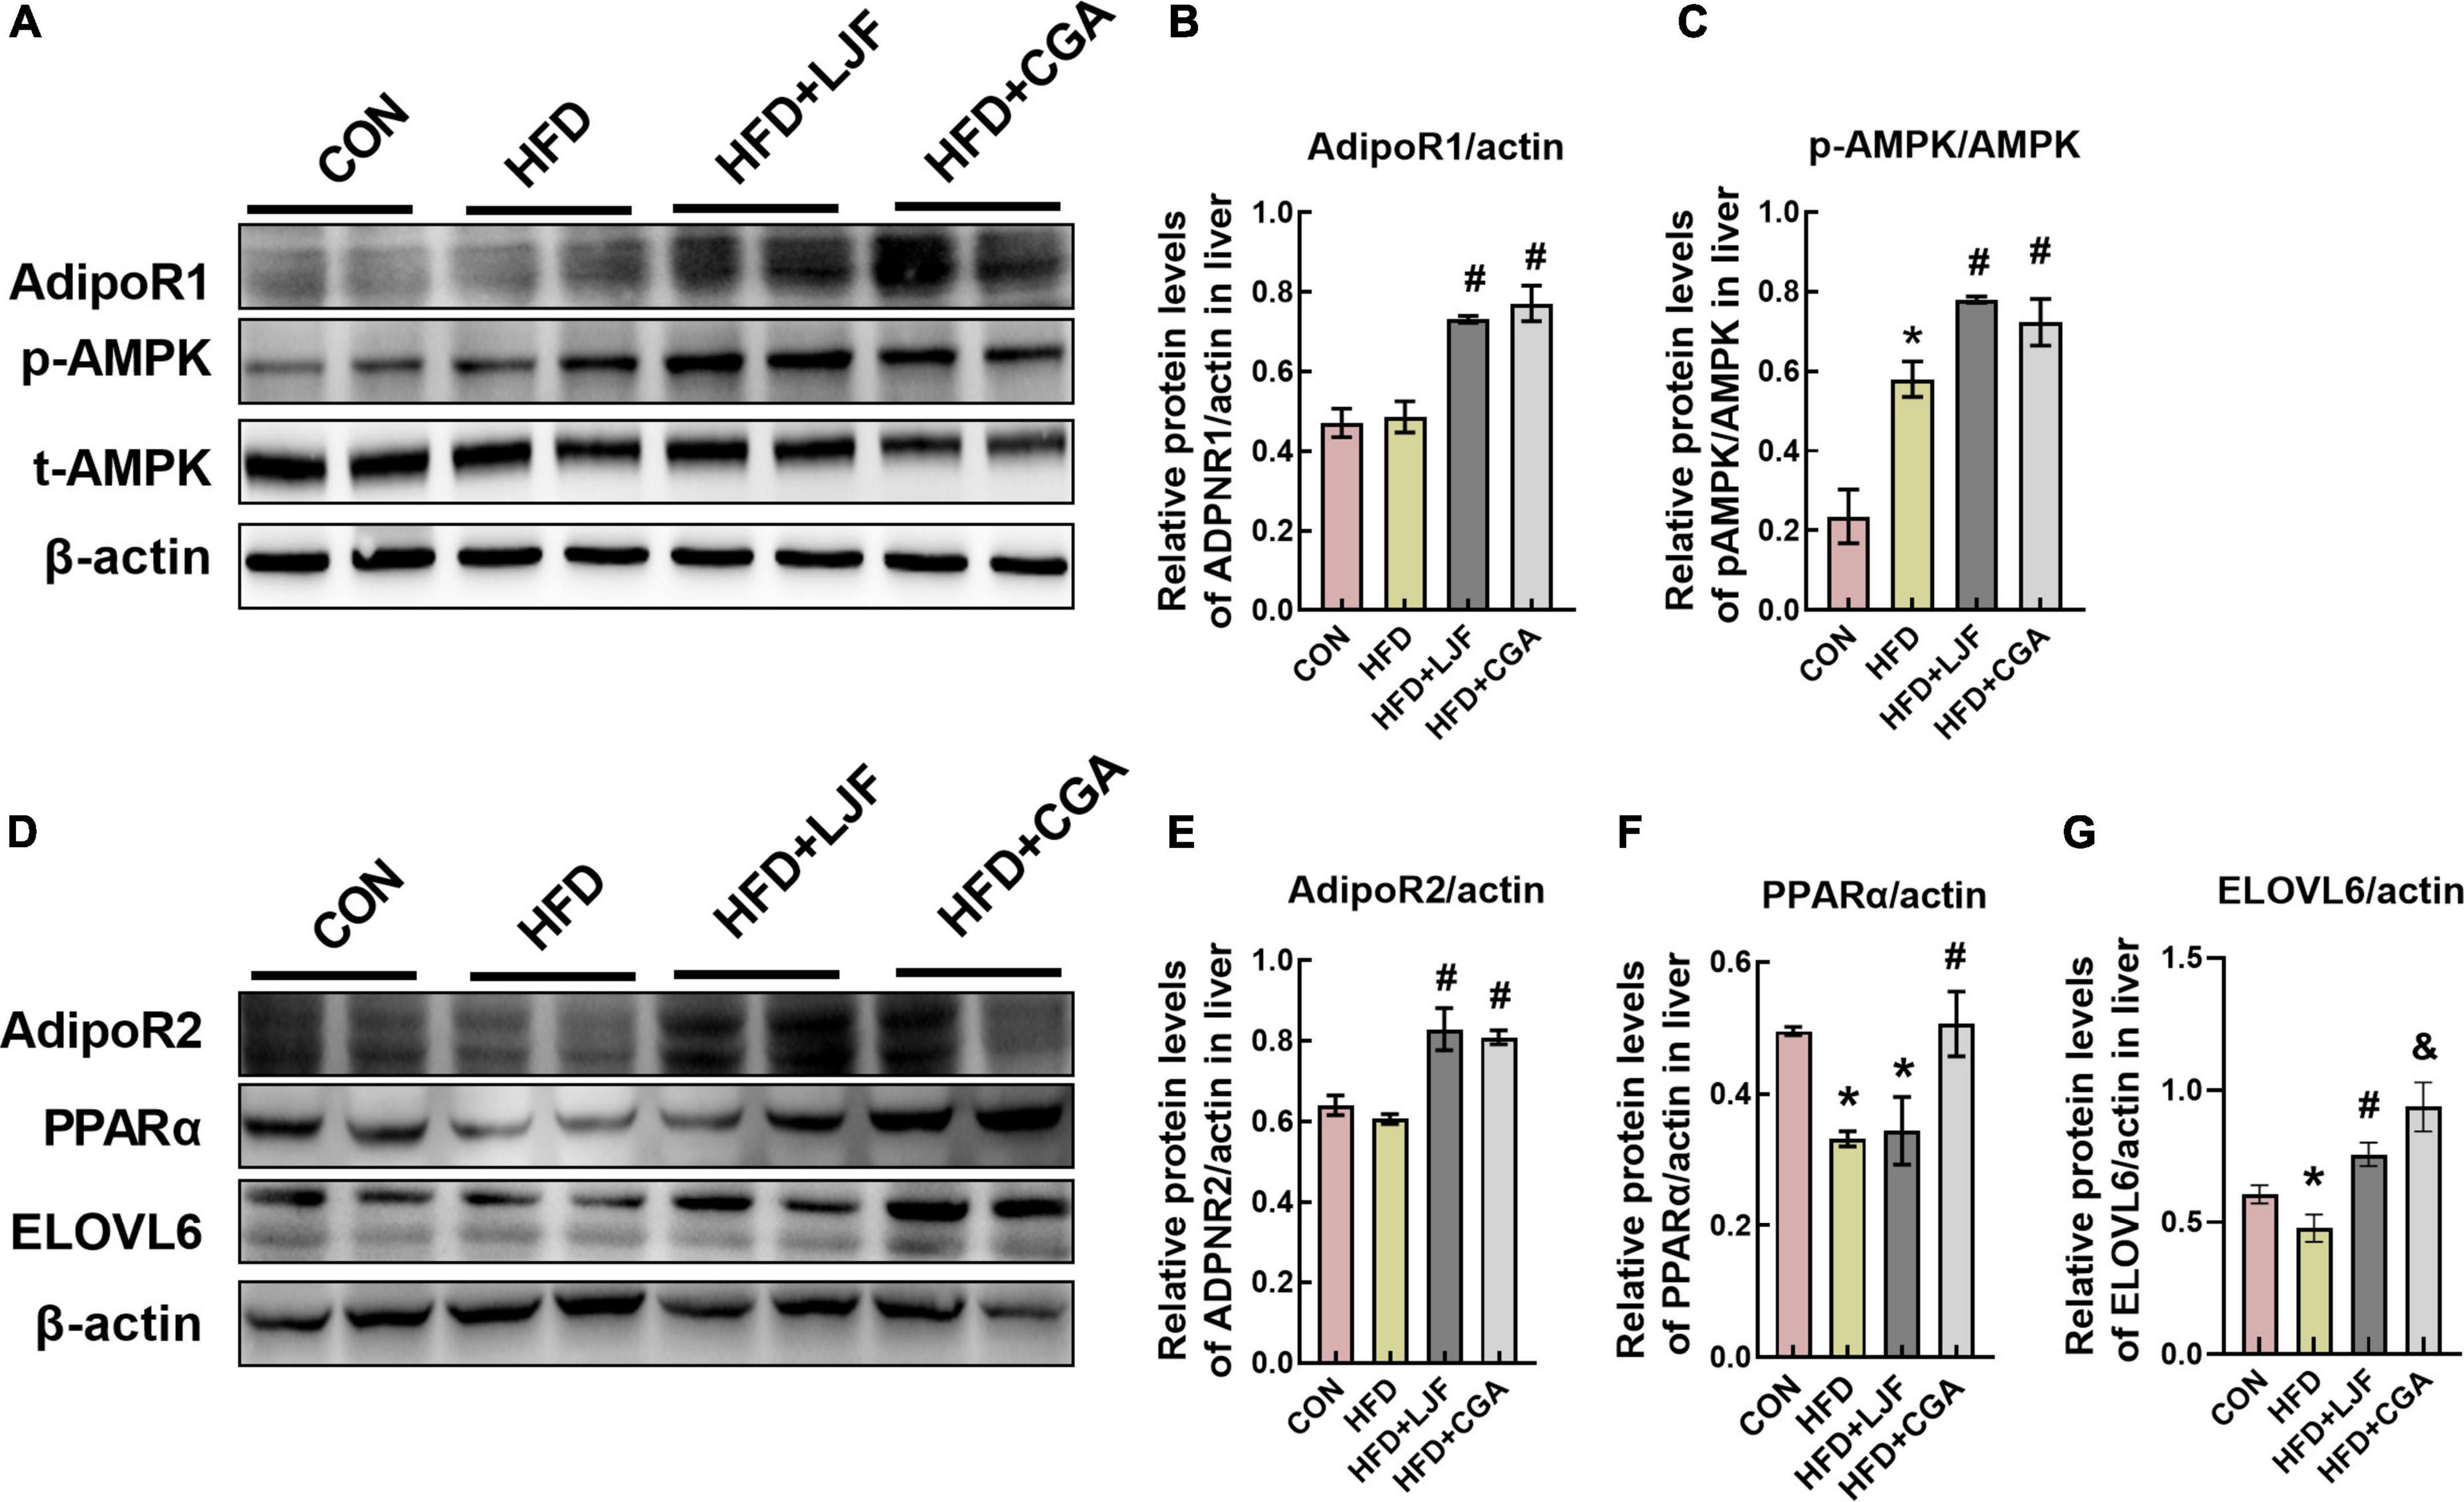
Figure 7. Lonicerae Japonicae Flos and CGA up-regulated expression levels of AdipoR1, AdipoR2, and ELOVL6 proteins in rat liver. (A–G) Protein levels and densitometric quantification of adiponectin receptors (AdipoR1 and AdipoR2), ELOVL6, p-AMPK, AMPK, PPAR-α, and β-actin, bars represent densitometric quantification normalized to β-actin. All bars show means ± SEM. (n = 4 per group). *P < 0.05, vs. CON group; #P < 0.05, vs. HFD group; &P < 0.05, vs. HFD + LJF.
Discussion
Prediabetes is strongly associated with a high risk of T2D and is an important reversible checkpoint in T2D development. In this investigation, both LJF and CGA improved HFD-induced prediabetes with IGT and lipid metabolism disorders such as decreasing plasma LDL-C and liver TC, attenuating the reduction of plasma HDL-C, VLCFA-containing ceramides species and PUFA-containing DAG species, which may be through the CTRPs-AdipoR1/2-AMPK/PPARα signaling pathway. In detail, LJF has a stronger effect on the CTRP9-AdipoR1-AMPK axis, while CGA has a stronger effect on the CTRP3-AdipoR2-PPARa axis. In addition, ELOVL6 protein was also involved in regulating the chain length of ceramide.
Administration of the HFD diet for 2 months caused an increase in body weight and adiposity, disturbance in lipids and adipokines, impaired glucose tolerance, β-cell mass expansion, and hyperinsulinemia compared to control rats, but not FPG. This suggests that impaired glucose tolerance and hyperinsulinemia induced by the HFD diet occur in an early stage of prediabetes. Although neither LJF nor CGA intervention impacted body weight, both of them enhanced glucose tolerance as evidenced by reduced blood glucose levels at 60 and 120 min during the OGTT and HOMA-IR, which is consistent with the decreased phosphorylation of IRS1(Ser307) and increased phosphorylation of Akt (Ser473) in liver. PPARα and AMPK are major regulators of glucose and lipid metabolism. The phosphorylation of AMPK improves hepatic IRS1-PI3K-AKT signaling pathway and increases hepatic insulin sensitivity (30, 31). Moreover, AdipoR1 demonstrated as the receptor for CTRP9 (22, 23) has been shown to activate the AMPK pathway, whereas AdipoR2 is identified as the receptor for CTRP3 (24) to activate PPARα pathway. In this study, both LJF and CGA increased the expression of AdipoR1 and AdipoR2, and their downstream phosphorylation of AMPK, which may partially account for the beneficial effects of LJF and CGA on lipid and glucose metabolism. Interestingly, the CGA group has a higher plasma CTRP3 than LJF, which may help to increase PPARα expression and decrease the level of plasma LDL-C and liver TC, which were not observed in LJF. Thus, these findings suggest that the CGA group has stronger effect on the CTRP3-AdipoR2-PPARα axis than the LJF group. Accordingly, we speculate that CGA promoted CTRP3 and PPARα expression may be in a dose-dependent manner. Additionally, CTRP9 increased only in LJF group indicating a stronger effect on the CTRP9-AdipoR1-AMPK axis than in the CGA group.
Notably, the plasma lipidomic analysis in our study also offered some clues to explain these positive features of LJF and CGA supplements. Several studies have proved that sphingolipids are signal molecules that interfere with insulin signaling, while ceramides are one of the most important bioactive lipids playing different roles in the development of IR depending on the length of the acyl chain (32). For instance, obesity usually causes increased concentrations of Cer (d18:1/16:0) and Cer (d18:1/18:0), which inhibit the insulin receptor-PI3K-AKT signaling pathway and fatty acid β-oxidation, thus leading to the onset of IR (33). Conversely, Cer (d18:1/24:0), preferentially synthesized by ceramide synthase 2, is suggested to protect mice from HFD-induced obesity and glucose intolerance (34). Additionally, dihydroceramide (DHCer) is transiently produced during the process of ceramides de novo synthesis, finally being desaturated by two isoforms of dihydroceramide desaturase (Des1/2) to form ceramides, for example, Cer (d18:1/X). Previous studies have reported that inhibition of Des1 activity may increase DHCer levels, preferentially producing DHCer (d18:0/24:0), thus inducing cytoprotective autophagy (35), and improving glucose tolerance and insulin sensitivity without affecting body mass (36, 37). Phytoceramide (PhyCer), first found in plants and yeast, but also in animal brains, heart, and liver tissue is an intermediate product present during the conversion of DHCer to ceramides (38). A previous study showed that plant-derived PhyCer promotes the PI3K-AKT signaling pathway (39). In agreement with our findings, both LJF and CGA treatments ameliorated the decrease of plasma DHCer (d18:0/24:0) and PhyCer (t18:0/24:0) induced by HFD. Moreover, CGA treatment reversed the reduction of VLCFA-containing Cer (d18:1/C23-26:0).
Mechanistically, ELOVL6 is responsible for converting C12, C14, and C16 saturated and monounsaturated fatty acids into C18 species and regulating the acyl-chain composition of ceramide. Elovl6 is also the major elongase acting on odd-chain SFA C13 and C15 fatty acids, which catalyzed elongation of C13→C15 and C15→C17 (40, 41). Simultaneously, others demonstrated that downregulation of Elovl6 expression with siRNA decreased levels of very long-chain species in ceramides such as Cer (d18:1/C24:0) and Cer(d18:1/C26:0) (42). Furthermore, ELOVL6-KO mice exhibit an impaired metabolic profile, expanded β-cell mass, and increased insulin secretory capacity (43). In Tang et al.’s study, ELOVL6-KO mice gain weight and have increased subcutaneous white adipose tissue mass and impaired carbohydrate metabolism, and had lower brown adipose tissue thermogenic capacity due to the activity of Elovl6 is required for the remodeling of mitochondria for enhancing thermogenic potential (44, 45). Thus, the increased expression of Elovl6 protein may partially explain the common positive performance between LJF and CGA, including elevated DHCer (d18:0/24:0), and Phy (t18:0/24:0), and attenuated β-cell mass expanding. Given that the content of CGA in the CGA group was almost equivalent to twice that of the LJF group, and the CGA group exerts higher expression of ELOVL6 level that explains increasing VLCFA-containing Cer (d18:1/C23-26:0) in the CGA group.
It is well-known that AdipoR1 and especially AdipoR2 possess intrinsic ceramidase activity of lowing ceramide levels. In terms of AdipoR2, which has a preference for Cer (d18:1/18:0) substrate, the ceramidase activity was greatly increased (20-fold) when treated with adiponectin (25, 46) which shared AdipoR1 as a common receptor with CTRP9, and AdipoR2 as a coreceptor with CTRP3. Taken together, we speculate that ELOVL6-induced Cer (d18:1/18:0) lipotoxicity was abolished by the ceramidase activity of the AdipoR1/2 (28), and retained the beneficial effects of ELOVL6 on insulin sensitivity. This may explain that CGA treatment improves insulin sensitivity without reducing Cer (d18:1/18:0) and even a small higher content was shown in the CGA group. These results provide evidence for CGA to exert synergistic action in improving insulin sensitivity via a different mechanistic pathway. Moreover, AdipoR1 and AdipoR2 also have been demonstrated to promote FA desaturation and increase the levels of long-chain PUFAs via their enzyme activity independently of adiponectin (26), which may account for the effectiveness of lowering the saturated fatty acids content like C18:0 or C16:0-containing DAG and increasing in unsaturated fatty acids like C18:1, C18:2, C18:3, and C22:6-containing DAG accompanied with upregulation of liver AdipoR1 and AdipoR2 expression in both LJF and CGA treatment.
The different effects of LJF compared to CGA were also observed with SM, ChE, PE, and PI species, whose levels were reduced by LJF treatment compared to the HFD group, but not by CGA treatment. Sphingomyelin synthase (SMS), using ceramide as one of the substrates to produce sphingomyelin, has 2 isoforms: SMS1 and SMS2. SMS2 is the major isoform in the liver. However, SM can be hydrolyzed to ceramide by 5 different sphingomyelinases. Importantly, SMS2 deficiency prevented high fat diet-induced obesity and insulin resistance. SMS2 liver-specific knockout mice could diminish liver steatosis (47).
Although TAGs are not signaling molecules, fatty acids produced during their synthesis or breakdown were shown to interfere with the intracellular insulin signaling pathway and contribute to the development of insulin resistance. Previous studies showed positive correlations between levels of C18:2 and C18:3 containing TAGs and insulin sensitivity, whereas levels of saturated fatty acids C20:0 and C18:0 and monounsaturated C18:1 and C20:4 containing TAGs were shown previously to negatively correlate with insulin resistance (48), which according to line with our results. Given that CGA alone did not cause such a reduction, the different effects of LJF compared to CGA might be regarded as a positive effect of other compounds contained in the LJF. A recent study suggests that the main three bioactive components of LJF are organic acids, iridoids and amino acids (49). However, further studies are needed to investigate this in more detail.
One limitation of our study is that we calculated HOMA-IR, an indirect method, to assess β-cell function and insulin sensitivity, rather than using the gold standard hyperinsulinemic euglycemic clamp technique. Although both of these methods have the same sensitivity, HOMA-IR has a lower precision. An additional limitation of our study is that we do not know the identity of the other bioactive compounds in LJF bud extracts, which therefore limits our interpretation of its mechanism of action.
Conclusion
This study demonstrates that LJF and CGA exert hypoglycemic and lipid modulation capacity to prevent prediabetes in different ways. Specifically, LJF prioritizes raising protective lipid species (such as increasing blood polyunsaturated fatty acids (PUFA)-containing diacylglycerol (DAG) species, high-density lipoprotein-cholesterol (HDL-C)) via CTRP3/9-AdipoR1-AMPK pathway, whereas CGA prioritizes reducing detrimental lipid species (such as saturated fatty acid-containing DAG species, low-density lipoprotein-cholesterol (LDL-C), total cholesterol (TC)) via CTRP3-AdipoR2- PPARα pathway. This indicated that LJF and CGA as a potential therapy to prevent metabolic disorders in multiple targets. Thus LJF bud extracts rich in CGA could be considered a potential candidate for the prevention and treatment of prediabetes at the earlier stage.
Data availability statement
The original contributions presented in this study are included in the article/Supplementary material, further inquiries can be directed to the corresponding author.
Ethics statement
This animal study was reviewed and approved by the Animal Care and Use Committee of Peking University (No. LA2017002).
Author contributions
CC: conceptualization, funding acquisition, project administration, resources, and supervision. CG: formal analysis and writing original draft. CG, XZ, YY, YW, and LX: investigation. All authors read and agreed to the published version of the manuscript.
Funding
This research was funded by the National Key Research and Development Program of China (2016YFD0400603).
Acknowledgments
We are grateful to the company named Herbaltone Biotechnology Co., Ltd. (Shandong, China), provide Lonicerae Japonicae Flos bud extract for free. We thank the National Key Research and Development Program of China for their funds supporting.
Conflict of interest
The authors declare that the research was conducted in the absence of any commercial or financial relationships that could be construed as a potential conflict of interest.
Publisher’s note
All claims expressed in this article are solely those of the authors and do not necessarily represent those of their affiliated organizations, or those of the publisher, the editors and the reviewers. Any product that may be evaluated in this article, or claim that may be made by its manufacturer, is not guaranteed or endorsed by the publisher.
Supplementary material
The Supplementary Material for this article can be found online at: https://www.frontiersin.org/articles/10.3389/fnut.2022.1007679/full#supplementary-material
References
1. Abdul-Ghani M, DeFronzo RA, Jayyousi A. Prediabetes and risk of diabetes and associated complications: impaired fasting glucose versus impaired glucose tolerance: does it matter? Curr Opin Clin Nutr Metab Care. (2016) 19:394–9. doi: 10.1097/MCO.0000000000000307
2. Tabák AG, Herder C, Rathmann W, Brunner EJ, Kivimäki M. Prediabetes: a high-risk state for diabetes development. Lancet (London, England). (2012) 379:2279–90.
3. American Diabetes Association. 2. Classification and diagnosis of diabetes: standards of medical care in diabetes-2020. Diab Care. (2020) 43:S14–31. doi: 10.2337/dc20-S002
4. Andes LJ, Cheng YJ, Rolka DB, Gregg EW, Imperatore G. Prevalence of prediabetes among adolescents and young adults in the United States, 2005-2016. JAMA Pediatr. (2020) 174:e194498. doi: 10.1001/jamapediatrics.2019.4498
5. Echouffo-Tcheugui JB, Selvin E. Prediabetes and what it means: the epidemiological evidence. Annu Rev Public Health. (2021) 42:59–77.
6. Li G, Zhang P, Wang J, Gregg EW, Yang W, Gong Q, et al. The long-term effect of lifestyle interventions to prevent diabetes in the China Da Qing diabetes prevention study: a 20-year follow-up study. Lancet (London, England). (2008) 371:1783–9. doi: 10.1016/S0140-6736(08)60766-7
7. Samocha-Bonet D, Debs S, Greenfield JR. Prevention and treatment of type 2 diabetes: a pathophysiological-based approach. Trends Endocrinol Metab TEM. (2018) 29:370–9. doi: 10.1016/j.tem.2018.03.014
8. Lim WXJ, Gammon CS, von Hurst P, Chepulis L, Page RA. A Narrative review of human clinical trials on the impact of phenolic-rich plant extracts on prediabetes and its subgroups. Nutrients. (2021) 13:3733. doi: 10.3390/nu13113733
9. Zhou L, Zhang T, Lu B, Yu Z, Mei X, Abulizi P, et al. Lonicerae Japonicae Flos attenuates diabetic retinopathy by inhibiting retinal angiogenesis. J Ethnopharmacol. (2016) 189:117–25. doi: 10.1016/j.jep.2016.05.039
10. Wang D, Zhao X, Liu Y. Hypoglycemic and hypolipidemic effects of a polysaccharide from flower buds of Lonicera japonica in streptozotocin-induced diabetic rats. Int J Biol Macromol. (2017) 102:396–404. doi: 10.1016/j.ijbiomac.2017.04.056
11. Han SY, Chae HS, You BH, Chin YW, Kim H, Choi HS, et al. Lonicera japonica extract increases metformin distribution in the liver without change of systemic exposed metformin in rats. J Ethnopharmacol. (2019) 238:111892. doi: 10.1016/j.jep.2019.111892
12. Shin NR, Bose S, Wang JH, Ansari A, Lim SK, Chin YW, et al. Flos Lonicera combined with metformin ameliorates hepatosteatosis and glucose intolerance in association with gut microbiota modulation. Front Microbiol. (2017) 8:2271. doi: 10.3389/fmicb.2017.02271
13. Li Y, Li W, Fu C, Song Y, Fu Q. Lonicerae japonicae flos and Lonicerae flos: a systematic review of ethnopharmacology, phytochemistry and pharmacology. Phytochem Rev Proc Phytochem Soc Europe. (2019) 19:1–61. doi: 10.1007/s11101-019-09655-7
14. Huang K, Liang XC, Zhong YL, He WY, Wang Z. 5-Caffeoylquinic acid decreases diet-induced obesity in rats by modulating PPARα and LXRα transcription. J Sci Food Agric. (2015) 95:1903–10. doi: 10.1002/jsfa.6896
15. Naveed M, Hejazi V, Abbas M, Kamboh AA, Khan GJ, Shumzaid M, et al. Chlorogenic acid (CGA): a pharmacological review and call for further research. Biomed Pharmacother. (2018) 97:67–74. doi: 10.1016/j.biopha.2017.10.064
16. Santana-Gálvez J, Cisneros-Zevallos L, Jacobo-Velázquez DA. Chlorogenic acid: recent advances on its dual role as a food additive and a nutraceutical against metabolic syndrome. Molecules (Basel, Switzerland). (2017) 22:358. doi: 10.3390/molecules22030358
17. Liu Z, Cheng Z, He Q, Lin B, Gao P, Li L, et al. Secondary metabolites from the flower buds of Lonicera japonica and their in vitro anti-diabetic activities. Fitoterapia. (2016) 110:44–51.
18. Jin S, Chang C, Zhang L, Liu Y, Huang X, Chen Z. Chlorogenic acid improves late diabetes through adiponectin receptor signaling pathways in db/db mice. PLoS One. (2015) 10:e0120842. doi: 10.1371/journal.pone.0120842
19. Kadowaki T, Yamauchi T. Adiponectin receptor signaling: a new layer to the current model. Cell Metab. (2011) 13:123–4. doi: 10.1016/j.cmet.2011.01.012
20. Okada-Iwabu M, Yamauchi T, Iwabu M, Honma T, Hamagami K, Matsuda K, et al. A small-molecule AdipoR agonist for type 2 diabetes and short life in obesity. Nature. (2013) 503:493–9.
21. Wu W, Zhang J, Zhao C, Sun Y, Pang W, Yang G. CTRP6 regulates porcine adipocyte proliferation and differentiation by the AdipoR1/MAPK signaling pathway. J Agric Food Chem. (2017) 65:5512–22. doi: 10.1021/acs.jafc.7b00594
22. Zhao L, Chen S, Sherchan P, Ding Y, Zhao W, Guo Z, et al. Recombinant CTRP9 administration attenuates neuroinflammation via activating adiponectin receptor 1 after intracerebral hemorrhage in mice. J Neuroinflamm. (2018) 15:215. doi: 10.1186/s12974-018-1256-8
23. Kambara T, Shibata R, Ohashi K, Matsuo K, Hiramatsu-Ito M, Enomoto T, et al. C1q/tumor necrosis factor-related protein 9 protects against acute myocardial injury through an adiponectin receptor I-AMPK-dependent mechanism. Mol Cell Biol. (2015) 35:2173–85. doi: 10.1128/MCB.01518-14
24. Murayama MA, Chi HH, Matsuoka M, Ono T, Iwakura Y. The CTRP3-AdipoR2 axis regulates the development of experimental autoimmune encephalomyelitis by suppressing Th17 cell differentiation. Front Immunol. (2021) 12:607346. doi: 10.3389/fimmu.2021.607346
25. Vasiliauskaité-Brooks I, Sounier R, Rochaix P, Bellot G, Fortier M, Hoh F, et al. Structural insights into adiponectin receptors suggest ceramidase activity. Nature. (2017) 544:120–3. doi: 10.1038/nature21714
26. Ruiz M, Ståhlman M, Borén J, Pilon M. AdipoR1 and AdipoR2 maintain membrane fluidity in most human cell types and independently of adiponectin. J Lipid Res. (2019) 60:995–1004. doi: 10.1194/jlr.M092494
27. Tang H, Wang X, Xu L, Ran X, Li X, Chen L, et al. Establishment of local searching methods for orbitrap-based high throughput metabolomics analysis. Talanta. (2016) 15:163–71. doi: 10.1016/j.talanta.2016.04.051
28. Matsuzaka T, Kuba M, Koyasu S, Yamamoto Y, Motomura K, Arulmozhiraja S, et al. Hepatocyte ELOVL fatty acid elongase 6 determines ceramide Acyl-chain length and hepatic insulin sensitivity in mice. Hepatology (Baltimore, Md). (2020) 71:1609–25. doi: 10.1002/hep.30953
29. Yamauchi T, Nio Y, Maki T, Kobayashi M, Takazawa T, Iwabu M, et al. Targeted disruption of AdipoR1 and AdipoR2 causes abrogation of adiponectin binding and metabolic actions. Nat Med. (2007) 13:332–9. doi: 10.1038/nm1557
30. Yan J, Wang C, Jin Y, Meng Q, Liu Q, Liu Z, et al. Catalpol ameliorates hepatic insulin resistance in type 2 diabetes through acting on AMPK/NOX4/PI3K/AKT pathway. Pharmacol Res. (2018) 130:466–80. doi: 10.1016/j.phrs.2017.12.026
31. Liu TY, Shi CX, Gao R, Sun HJ, Xiong XQ, Ding L, et al. Irisin inhibits hepatic gluconeogenesis and increases glycogen synthesis via the PI3K/Akt pathway in type 2 diabetic mice and hepatocytes. Clin Sci. (1979) 2015:839–50. doi: 10.1042/CS20150009
32. Iqbal J, Walsh MT, Hammad SM, Hussain MM. Sphingolipids and lipoproteins in health and metabolic disorders. Trends Endocrinol Metab TEM. (2017) 28:506–18. doi: 10.1016/j.tem.2017.03.005
33. Turner N, Lim XY, Toop HD, Osborne B, Brandon AE, Taylor EN, et al. A selective inhibitor of ceramide synthase 1 reveals a novel role in fat metabolism. Nat Commun. (2018) 9:3165. doi: 10.1038/s41467-018-05613-7
34. Park JW, Park WJ, Kuperman Y, Boura-Halfon S, Pewzner-Jung Y, Futerman AH. Ablation of very long acyl chain sphingolipids causes hepatic insulin resistance in mice due to altered detergent-resistant membranes. Hepatology (Baltimore, Md). (2013) 57:525–32. doi: 10.1002/hep.26015
35. Casasampere M, Ordóñez YF, Casas J, Fabrias G. Dihydroceramide desaturase inhibitors induce autophagy via dihydroceramide-dependent and independent mechanisms. Biochim Biophys Acta Gen Subj. (2017) 1861:264–75. doi: 10.1016/j.bbagen.2016.11.033
36. Magaye RR, Savira F, Hua Y, Kelly DJ, Reid C, Flynn B, et al. The role of dihydrosphingolipids in disease. Cell Mol Sci CMLS. (2019) 76:1107–34. doi: 10.1007/s00018-018-2984-8
37. Chaurasia B, Tippetts TS, Mayoral Monibas R, Liu J, Li Y, Wang L, et al. Targeting a ceramide double bond improves insulin resistance and hepatic steatosis. Science (New York, NY). (2019) 365:386–92. doi: 10.1126/science.aav3722
38. Dasgupta S, Kong J, Bieberich E. Phytoceramide in vertebrate tissues: one step chromatography separation for molecular characterization of ceramide species. PLoS One. (2013) 8:e80841. doi: 10.1371/journal.pone.0080841
39. Jang JY, Lee HK, Yoo HS, Seong YH. Phytoceramide ameliorates ß-amyloid protein-induced memory impairment and neuronal death in mice. Arch Pharm Res. (2017) 40:760–71. doi: 10.1007/s12272-017-0893-2
40. Wang Z, Wang DH, Goykhman Y, Yan Y, Lawrence P, Kothapalli KSD, et al. The elongation of very long-chain fatty acid 6 gene product catalyses elongation of n-13 : 0 and n-15 : 0 odd-chain SFA in human cells. Br J Nutr. (2019) 121:241–8. doi: 10.1017/S0007114518003185
41. Ampong I, John Ikwuobe O, Brown JEP, Bailey CJ, Gao D, Gutierrez-Merino J, et al. Odd chain fatty acid metabolism in mice after a high fat diet. Int J Biochem Cell Biol. (2022) 143:106135.
42. Berdyshev E, Goleva E, Bronova I, Dyjack N, Rios C, Jung J, et al. Lipid abnormalities in atopic skin are driven by type 2 cytokines. JCI Insight. (2018) 3:e98006. doi: 10.1172/jci.insight.98006
43. Zhao H, Matsuzaka T, Nakano Y, Motomura K, Tang N, Yokoo T, et al. Elovl6 deficiency improves glycemic control in diabetic db/db mice by expanding β-cell mass and increasing insulin secretory capacity. Diabetes. (2017) 66:1833–46. doi: 10.2337/db16-1277
44. Tan CY, Virtue S, Bidault G, Dale M, Hagen R, Griffin JL, et al. Brown adipose tissue thermogenic capacity is regulated by Elovl6. Cell Rep. (2015) 13:2039–47. doi: 10.1016/j.celrep.2015.11.004
45. You M, Fan R, Kim J, Shin SH, Chung S. Alpha-linolenic acid-enriched butter promotes fatty acid remodeling and thermogenic activation in the brown adipose tissue. Nutrients. (2020) 12:136. doi: 10.3390/nu12010136
46. Holland WL, Xia JY, Johnson JA, Sun K, Pearson MJ, Sharma AX, et al. Inducible overexpression of adiponectin receptors highlight the roles of adiponectin-induced ceramidase signaling in lipid and glucose homeostasis. Mol Metab. (2017) 6:267–75. doi: 10.1016/j.molmet.2017.01.002
47. Li Y, Dong J, Ding T, Kuo MS, Cao G, Jiang XC, et al. Sphingomyelin synthase 2 activity and liver steatosis: an effect of ceramide-mediated peroxisome proliferator-activated receptor γ2 suppression. Arterioscler Thromb Vasc Biol. (2013) 33:1513–20. doi: 10.1161/ATVBAHA.113.301498
48. Al-Sulaiti H, Diboun I, Banu S, Al-Emadi M, Amani P, Harvey TM, et al. Triglyceride profiling in adipose tissues from obese insulin sensitive, insulin resistant and type 2 diabetes mellitus individuals. J Transl Med. (2018) 16:175.
49. Cai Z, Wang C, Chen C, Zou L, Chai C, Chen J, et al. Quality evaluation of Lonicerae Japonicae Flos and Lonicerae Flos based on simultaneous determination of multiple bioactive constituents combined with multivariate statistical analysis. Phytochem Anal PCA. (2021) 32:129–40. doi: 10.1002/pca.2882
Keywords: prediabetes, lipid metabolism, chlorogenic acid, Lonicerae Japonicae Flos extract, adiponectin receptors, ELOVL6
Citation: Guo C, Zhang X, Yu Y, Wu Y, Xie L and Chang C (2022) Lonicerae Japonicae Flos extract and chlorogenic acid attenuates high-fat-diet- induced prediabetes via CTRPs-AdipoRs-AMPK/PPARα axes. Front. Nutr. 9:1007679. doi: 10.3389/fnut.2022.1007679
Received: 30 July 2022; Accepted: 15 September 2022;
Published: 14 October 2022.
Edited by:
Yadu Nandan Dey, B.C. Roy College of Pharmacy and Allied Health Sciences, IndiaReviewed by:
Mahendra Yadav, Gopal Narayan Singh University, IndiaSiddhartha Das Pramanik, Indian Institute of Technology Roorkee, India
Copyright © 2022 Guo, Zhang, Yu, Wu, Xie and Chang. This is an open-access article distributed under the terms of the Creative Commons Attribution License (CC BY). The use, distribution or reproduction in other forums is permitted, provided the original author(s) and the copyright owner(s) are credited and that the original publication in this journal is cited, in accordance with accepted academic practice. No use, distribution or reproduction is permitted which does not comply with these terms.
*Correspondence: Cuiqing Chang, changcuiqing@126.com