Effect of Dietary Tryptophan on Growth, Intestinal Microbiota, and Intestinal Gene Expression in an Improved Triploid Crucian Carp
 Yawei Fu1,2† Xiaoxiao Liang1,2†
  Donghua Li2† Hu Gao1
  Yadong Wang1,2
  Wenting Li2
  Kang Xu1,3*
  Fangzhou Hu3*
- 1CAS Key Laboratory of Agro-Ecological Processes in Subtropical Region, Hunan Provincial Key Laboratory of Animal Nutritional Physiology and Metabolic Process, National Engineering Laboratory for Pollution Control and Waste Utilization in Livestock and Poultry Production, Institute of Subtropical Agriculture, Chinese Academy of Sciences, Changsha, China
- 2College of Animal Science and Technology, Henan Agricultural University, Zhengzhou, China
- 3State Key Laboratory of Developmental Biology of Freshwater Fish, College of Life Sciences, Hunan Normal University, Changsha, China
Tryptophan (Trp) has received increasing attention in the maintenance of intestinal function. In this study, improved triploid crucian carp (ITCC) fed diets containing 6.35 g kg−1 Trp had higher average daily gain (ADG) and improved villus height (VH) and crypt depth (CD) in the intestine compared to the control group. To elucidate the potential mechanisms, we used RNA sequencing (RNA-seq) to investigate changes in the intestinal transcriptome and 16S rRNA gene sequencing to measure the intestinal microbiota in response to 6.35 g kg−1 Trp feeding in ITCC. Dietary Trp altered intestinal gene expression involved in nutrient transport and metabolism. Differentially expressed transcripts (DETs) were highly enriched in key pathways containing protein digestion and absorption and the AMPK signaling pathway. 16S rRNA sequencing showed that 6.35 g kg−1 Trp significantly increased the abundance of the genus Cetobacterium, and the Firmicutes/Bacteroidetes ratio at the phylum level (P < 0.05). In addition, bacterial richness indices (Simpson index) significantly increased (P < 0.05) community evenness in response to 6.35 g kg−1 Trp. In conclusion, appropriate dietary Trp improves the growth performance, and influences the intestinal flora of ITCC. This study might be helpful to guide the supply of dietary exogenous Trp in ITCC breeding.
Introduction
Improving the growth rate and feed conversion rate of fish is essential for the sustainable development of aquaculture (1, 2). Amino acids play important roles in the nutrient metabolism of cultured fishes. Dietary nutrients affect gut microbial diversity and composition (3). Numerous studies describe the link between Trp metabolism and fish health (4). Trp cannot be synthesized exogenously in fish, and must be obtained via food (5, 6). Appropriate feeding of Trp has positive effects on the growth performance and intestinal health status of fish by regulating intestinal immune tolerance, maintaining microbial homeostasis, and inhibiting inflammation (5, 6). Besides, there is growing evidence that Trp deficiency could cause negative impacts on growth performance in fish (7–9). For example, fish growth performance and the structural integrity of the intestines were altered in a Trp deficient scenario, which translated into lower disease resistance (6, 10). Similarly, Trp deficiency causes depressed growth and efficiency of feed conversion and low protein retention, as reported for other fish species (11–14).
The microbial balance of the intestinal flora is associated with the gut health, which can be affected by dietary constituents and commensal bacteria (15, 16). The intestinal flora could affect food digestion and absorption, and nutrients can also affect the composition of intestinal microbes (17, 18). Previous studies have demonstrated that Trp could alter the intestinal microbial composition and diversity (19). The metabolism of Trp by the intestinal microbiome could also affect intestinal homeostasis (20, 21). Trp catabolites are essential signaling molecules in microbial communities, and important mediators for regulating a diverse array of physiological systems in fish (4). Gut microbes are primary participants in Trp metabolism; it is estimated that 90% of serotonin in the human body is produced by gut microbes (22).
In our previous studies, the ITCC was produced by crossing improved tetraploid males with improved diploid female red crucian carp, which has excellent traits of fast growth rate and sterility (23). With the expansion of improved triploid crucian carp farming, the breed of ITCC and research on the development of its feeding should be developed. However, information regarding the effects of amino acids on the growth performance and intestinal health status of ITCC is lacking. Moreover, little information has been done on the effect of Trp on the growth performance and intestinal health of ITCC. In this study, we aimed to explore the effects of Trp supplementation on growth, intestinal microbiota, and intestinal gene expression in ITCC. This study will provide guidance for developing effective nutritional strategies and feeding practices to improve ITCC health.
Materials and Methods
Ethics Statement
All experimental animals used in this study were treated humanely, following the Animal Welfare Committee of the Institute of Subtropical Agriculture (201703-64C), Chinese Academy of Sciences, Changsha, China.
Experimental Animals and Tissue Samples
A total of 450 healthy ITCC and weight-matched ITCC (23) were randomly divided into five groups, with three biological replicates of each group, and 30 fishes per biological replicate. The Trp concentrations in the five experimental diets were determined to be 1.85 (control), 3.35, 4.85, 6.35, and 7.85 g kg−1 Trp diet (basal diets supplemented with 0, 1.5, 3.0, 4.5, and 6.0 g kg−1 Trp). The fishes were weighed at the beginning and end of the 4-week feeding trial.
Sample Collections
At the end of the feeding trial, all the experimental fish fasted for 12 h. Three fish from each replicate (a total of 45 fish) were randomly selected, anesthetized, sacrificed, and sampled according to the method described in a previous study (24). For other biochemical parameters and molecular analysis, the intestinal tract and distal intestinal contents were quickly removed, frozen in liquid nitrogen, and stored at −80°C until use. Meanwhile, we collected section samples from each group and fixed them in a 4% paraformaldehyde solution for histologic analysis (25).
RNA Extraction
Transcriptome sequencing was performed on a total of 6 samples from the 6.35 Trp group (6.35 g kg−1 Trp diet group) and the 1.85 Trp group (control group). Total RNA was isolated from the intestinal tract of fish using an RNAiso Plus kit (Takara, Kyoto, Japan). Total RNA was purified using a TruSeq RNA Sample Prep Kit 52 (New England Biolabs, Ipswich, MA, USA). RNA degradation and contamination were detected using 1% agarose gels. The purity of the total RNA was assessed with a NanoPhotometer® spectrophotometer (IMPLEN, CA, USA). The total RNA concentration was measured using a Qubit® RNA Assay Kit in Qubit® 2.0 Fluorometer (Life Technologies, CA, USA). The integrity of the total RNA was estimated using an RNA Nano 6000 Assay Kit of the Bioanalyzer 2100 system (Agilent Technologies, CA, USA).
Library Preparation for Transcriptome Sequencing
Three samples were pooled to make one biological replicate and experiment was done using three technical replicates. A total amount of 1.5 μg RNA per sample was used as input material for the RNA sample preparations. Sequencing libraries were generated using the NEBNext® Ultra™ RNA Library Prep Kit of Illumina® (NEB, USA) following the manufacturer's protocols, and index codes were added to attribute sequences to each sample. Briefly, mRNA was purified from total RNA using poly-T oligo-attached magnetic beads. Fragmentation was carried out using divalent cations under elevated temperature in NEBNext First Strand Synthesis Reaction Buffer (5X). First-strand cDNA was synthesized using random hexamer primers and M-MuL5 Reverse Transcriptase (RNase H). Second strand cDNA synthesis was subsequently performed using DNA Polymerase I and RNase H. The remaining overhangs were converted into blunt ends via exonuclease/polymerase activities. After adenylation of the 3′ ends of DNA fragments, NEBNext adaptor with a hairpin loop structure was ligated to prepare for hybridization. To preferentially select cDNA fragments 250–300 bp in length, the library fragments were purified with the AMPure XP system (Beckman Coulter, Beverly, USA). Then, 3 μl of USER Enzyme (NEB, USA) was used with size-selected, adaptor-ligated cDNA at 37°C for 15 min followed by 5 min at 95°C before PCR. Then PCR was performed with Phusion High-Fidelity DNA polymerase, universal PCR primers, and Index (X) Primer. Finally, PCR products were purified (AMPure XP system), and library quality was assessed on the Agilent Bioanalyzer 2100 system.
RNA-Seq Data Analysis
Clustering of the index-coded samples was performed on a cBot Cluster Generation System using TruSeq PE Cluster Kit 53-cBot-HS (Illumina) according to the manufacturer's instructions. Differential expression analysis of two groups (three biological replicates per group) was performed using the DESeq R package (1.10.1) (26). DESeq provides statistical routines for determining differential expression in digital gene expression data using a model based on the negative binomial distribution. The resulting P-values were adjusted using Benjamini and Hochberg's approach to control the false discovery rate. Genes with an adjusted P < 0.05 found by DESeq were assigned as differentially expressed. To obtain significantly different genes, we set the screening criteria as P-value (padj) ≤ 0.001 and difference multiple |FoldChange| ≥ 2. Cluster analysis was used to cluster genes with the same or similar expression patterns, which might have similar functions or participate in the same biological process. Cluster analysis of a heat-map for DEGs was performed by the pheatmap R package (27).
Gene function was annotated based on the following databases: Nr (NCBI non-redundant protein sequence, ftp://ftp.ncbi.nih.gov/blast/db/); Nt (NCBI non-redundant nucleotide sequence); Pfam (Protein family http://pfam.xfam.org/); KOG/COG (Clusters of Orthologous Groups of proteins, http://www.ncbi.nlm.nih.gov/KOG/); Swiss-Prot (a manually annotated and reviewed sequence database http://www.uniprot.org/); KO (KEGG Ortholog database, http://ccb.jhu.edu/software/tophat/index.shtml); GO (Gene Ontology, and STRING database. The Protein–protein interaction networks (PPIs) information of these DEGs were predicted by STRING database. After mapping the DEGs into this database, and a combined score ≥0.4 were exported. Then, the PPIs of these SDEGs were visualized in Cytoscape, and the hub genes among the PPI network were identified and ranked using CytoHubba plugin and the maximal clique centrality (MCC) method of Cytoscape software (28).
Real-Time PCR Analysis
We randomly selected 8 genes (including four upregulated genes and four downregulated genes) for real-time PCR in 1.85Trp and 6.35Trp groups to confirm the reproducibility and accuracy of the RNA-seq gene expression data. Using an RNAiso Plus kit (Takara, Kyoto, Japan), total RNA was isolated from intestinal tract tissues of fishes. After checking the RNA quality, as described in the RNA extraction section, reverse transcription was performed using the PrimeScript™ RT Reagent Kit with gDNA Eraser (Takara, Kyoto, Japan) according to the manufacturer's protocol. Real-time PCR experiments were performed using a LightCycler® 96 Real-Time PCR system (Roche Applied Science) in a 25 μL reaction volume containing 12.5 μL of 2 × SYBR® Premix Ex TaqTM II (Tli RNaseH Plus; Takara, Kyoto, Japan), 1.25 μL each of the forward and reverse primers (10 μM), 8 μL of deionized water, and 2 μL (~100 ng) of cDNA. The β-actin gene was used as the reference gene, and the primers of eight genes were designed using Primer. The thermal cycling conditions were 3 min at 95°C, followed by 37 reaction cycles (95°C for 30 s, 60°C for 30 s, and 72°C for 30 s), and an extension for 10 min at 72°C. We calculated the relative gene expression levels with the comparative CT method (referred to as the 2−ΔΔCT method) (29), with three replicates for each reaction.
DNA Extraction, 16S rRNA Sequencing
DNA was extracted from the intestinal contents using a fecal DNA kit (Omega, USA) and then eluted in a 50 μL eluent buffer. The primers (F:5′-ACTCCTACGGGAGGCAGCAG-3′; R: 5′-GGACTACHVGGGTWT-CTAAT-3′) were used in the PCR amplification for the V3–V4 region of the bacterial 16S rRNA gene. PCR analysis was performed with 25 μL reactions containing 12.5 μL of PCR premix, 2.5 μL of each primer, 25 ng of template DNA, and PCR-grade water to equalize the final volumes. The PCR products were detected by 2% agarose gel electrophoresis and then purified using a gel recovery kit (Thermo Scientific, USA). The libraries were constructed using the Ion Plus Fragment Library Kit 48 reactions library building kit (Thermo Fisher, USA) and qualified by Qubit quantification and library assay, Single-ended sequencing was performed using Ion S5TMXL (Thermo Fisher, USA).
The clean reads of all samples were clustered using UPARSE software. The sequences were clustered into OTUs with 97% identity, and the sequences with the highest frequency of occurrence were selected as the representative sequences of OTUs. Species annotation analysis was performed using the Mothur method with the SSU rRNA database of SILVA132 for classification (threshold set between 0.8 and 1). Multiple sequence alignment was performed using MUSCLE software, and then the data were homogenized. Alpha diversity analysis and beta diversity analysis were based on the homogenized data. PCoA was plotted using R software (Version 2.15.3). The WGCNA, stats and ggplot2 were used for PCoA analysis. LEfSe was performed by LEfSe software.
Statistical Analysis
The qRT-PCR validation data were analyzed by using SPSS 18.0 (SPSS, USA). The significance of the difference between two groups was analyzed by Student's t-test. Differences were considered significant if the P < 0.05 and P < 0.01 were considered extremely significant. The results are presented as the mean and standard error of the mean (SEM).
Results
Growth Performance and Gut Morphology
As shown in Figure 1, the average final weight and the ADG were significantly (P < 0.05) increased as affected by dietary 6.35 g kg−1 Trp levels compared with the control group. In this study, compared with the control group, dietary supplementation with different doses of Trp significantly altered the VH and CD (p < 0.05) in ITCC, and the effect was obvious when the fish were fed a diet containing 6.35 g kg−1Trp, while there was no difference in the ratio of VH to CD (Table 1).
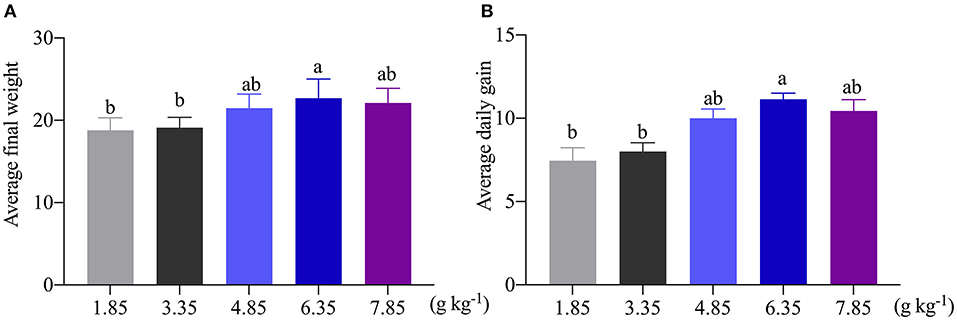
Figure 1. Effects of dietary tryptophan on the growth performance of ITCC. (A) Average final weight of ITCC. (B) The average daily gain of ITCC. The Trp concentrations in the five experimental diets were determined to be 1.85 (control), 3.35, 4.85, 6.35, and 7.85 g kg−1 Trp diet (basal diets supplemented with 0, 1.5, 3.0, 4.5, and 6.0 g kg−1 Trp).
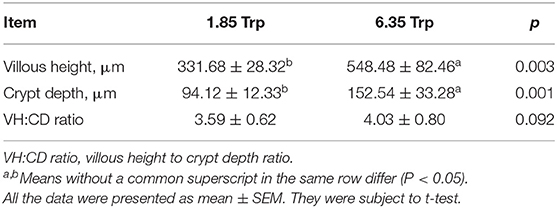
Table 1. The effect of tryptophan on the morphology of the intestine in ITCC.
RNA-Seq Analysis
To reveal the molecular regulatory mechanism, we used the pooled total RNA of the control and 6.35 g kg−1 Trp diet groups. The cDNA library of six intestinal tissues (1.85Trp_1, 1.85Trp _2, and 1.85Trp _3 from the control group; 6.35Trp _1, 6.35Trp _2, and 6.35Trp _3 from the group fed 6.35 g kg−1 Trp diets) were sequenced on an Illumina HiSeq platform, with 3.11 million reads in total being generated, of which 97.5% (3.04 million) passed the filter for clean reads. The GC contents of the clean reads were 45.61–47.29% (Supplementary Table 1). By comparing to the sequencing data of the two groups, 155,547 transcripts were identified, of which 140,907 and 143,462 transcripts were identified in the 6.35 Trp group and control group, respectively.
In total, we found 3,263 differentially expressed transcripts (1,443 upregulated and 1,820 downregulated transcripts) in the 6.35 Trp group compared with the control group (Supplementary Table 2). The heat map of cluster analysis of DETs showed that the gene expression patterns of DETs were clustered within groups, while the difference between the two groups was significant (Figure 2).
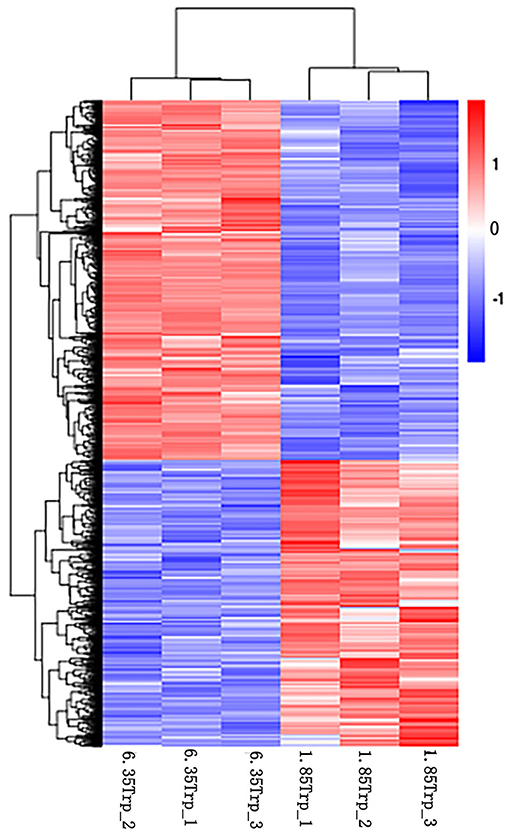
Figure 2. Cluster analysis of DETs by the FPKM value. The X-axis indicates the samples in the different groups. The sample on the left is from the 6.35 Trp group, and the sample on the right is from the 1.85 Trp group. The Y-axis is the gene cluster across the 1.85 and 6.35 Trp groups. Color from red to blue, indicated that the log10 (FPKM+1) values were from large to small, red color indicates high expression level and blue color indicates low expression level.
GO Enrichment Analysis of DETs
GO enrichment analysis was performed with 1,654 DETs. A total of 2,730 GO terms were enriched, including 1,559 biological process terms, 430 cellular component terms and 741 molecular function terms (Supplementary Table 3). The top 30 most significantly enriched GO terms are shown in Figure 3. The top GO terms of the 1,164 upregulated transcripts were molecular function including motor activity and ion binding. The top GO terms of the 490 downregulated transcripts were solute: sodium symporter activity, neurotransmitter transporter activity, and neurotransmitter: sodium symporter activity. The top 22 GO terms in the molecular functions are shown in Figure 3, including motor activity, ATP binding, adenyl ribonucleotide binding, and anion binding so on. As shown in Figure 3, the top 2 GO terms belong to the cellular component category, including the myosin complex and the actin cytoskeleton.
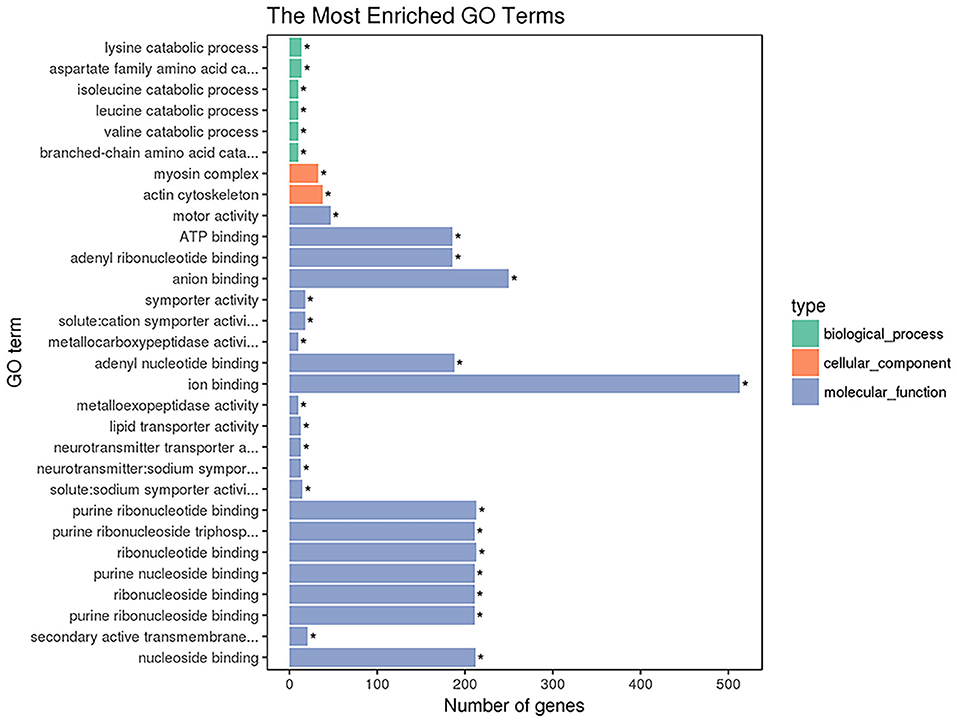
Figure 3. The enriched GO terms of the DETs. The X-axis indicates the number of DETs for each GO term; the y-axis corresponds to the GO terms. *represent the significantly enriched terms (p < 0.05).
KEGG Pathway Analysis of DETs
The DETs were annotated into 273 KEGG pathways (Supplementary Table 4). The top 10 enriched pathways of the DETs are shown in Table 2. With regard to the KEGG pathway analysis of the upregulated genes, 11 pathways were enriched including “fatty acid biosynthesis,” “AMPK signaling pathway,” “protein digestion and absorption,” “butanoate metabolism,” and “Terpenoid backbone biosynthesis.” With regard to KEGG pathway analysis of the downregulated genes, 19 pathways were enriched, including “bile secretion,” “mineral absorption,” “renin-angiotensin system,” “cell cycle,” “carbohydrate digestion and absorption,” and “PPAR signaling pathway.”
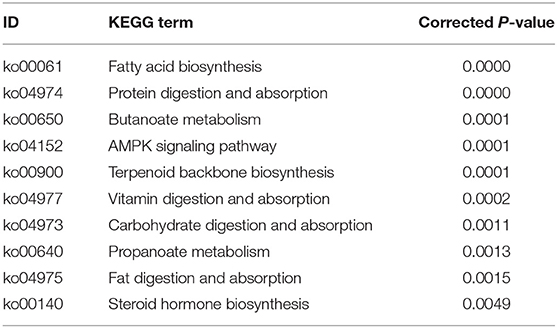
Table 2. The top 10 significantly enriched KEGG pathway of DEGs.
Protein-Protein Interaction (PPI) Network Analysis
After importing the PPI network of DETs, Cytoscape displayed modules in the default MCODE settings. Genes in these modules were then assembled for enrichment analysis using DAVID. Among them, the “metabolic pathways” was identified as the most significant pathway. Twenty-nine significant pathways were enriched in KEGG pathways. Based on the STRING database, the PPI network of 566 nodes and 2,154 protein pairs was obtained with a combined score >0.7 (Supplementary Table 5). In total, one module (module 1) with a score >13 was detected by MCODE. The hub gene ubiquitin A-52 residue ribosomal protein fusion product 1 (UBA52) (padj = 0.01911, log2FC = −2.4374) was identified with Cytohubba and MCODE (Supplementary Table 6; Figure 4).
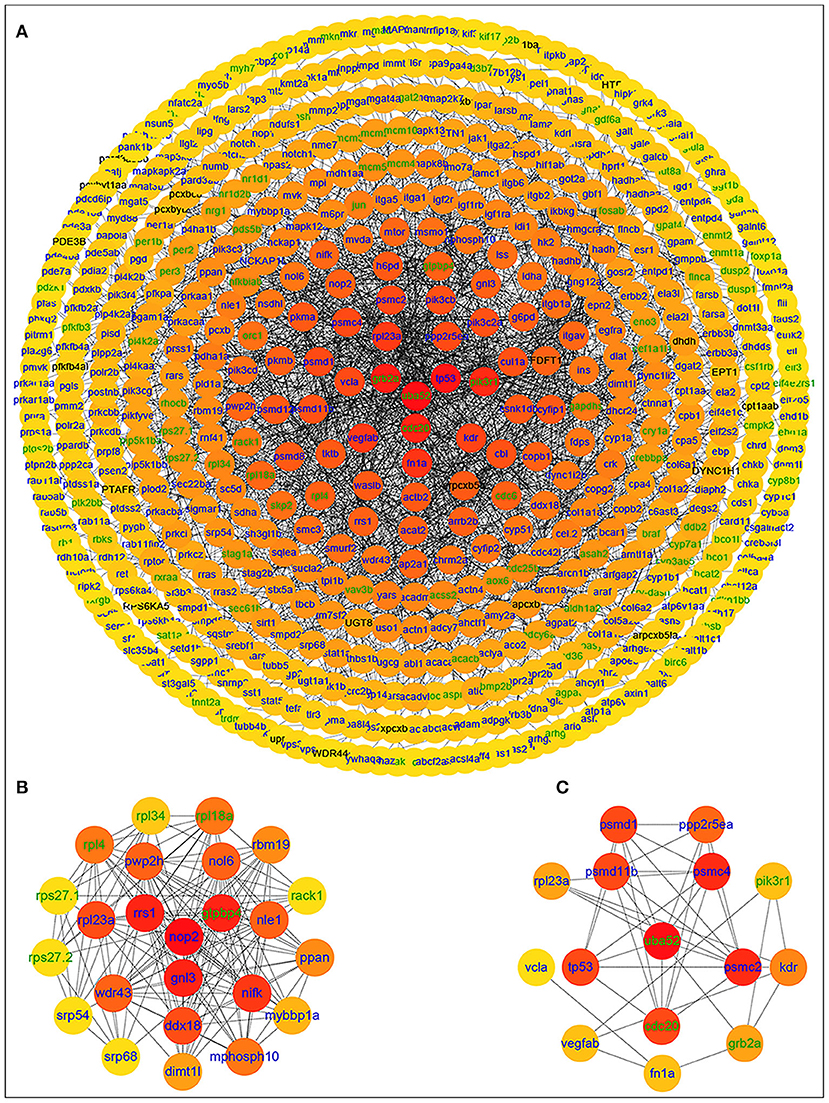
Figure 4. PPI network of differentially expressed genes in the group fed 6.35 g kg−1 Trp diets compared with the control group and two significant modules identified among the PPI network using the molecular complex detection method with a score of >13. Blue nodes represent the upregulated genes; green nodes represent the downregulated genes; (A) PPI network of differentially expressed genes in the group fed 6.35 g kg−1 Trp diets compared with the control group; (B) module 1, MCODE score = 23; (C) protein-protein interaction network of 15 hub genes.
Real-Time PCR Validation
The real-time PCR results were consistent with the RNA-seq data (Figure 5). Eight transcripts were selected, and the RNA-seq data were further evaluated by real-time PCR experiments. The relative expression levels of carboxypeptidase A1 (CPA1), carboxypeptidase A5 (CPA5), chymotrypsin-like (CTRL), and endoplasmic reticulum resident protein 27-like (Erp27) were significantly increased in the 6.35 Trp group compared to those in the control group. In addition, the relative expression levels of period circadian protein homolog 1-like (LOC109066737), neuraminidase 3 (NEU3), period circadian regulator 2 (Per2), and single-stranded DNA binding protein 4 (ssbp4) were significantly decreased in the 6.35 Trp group compared to the control group.
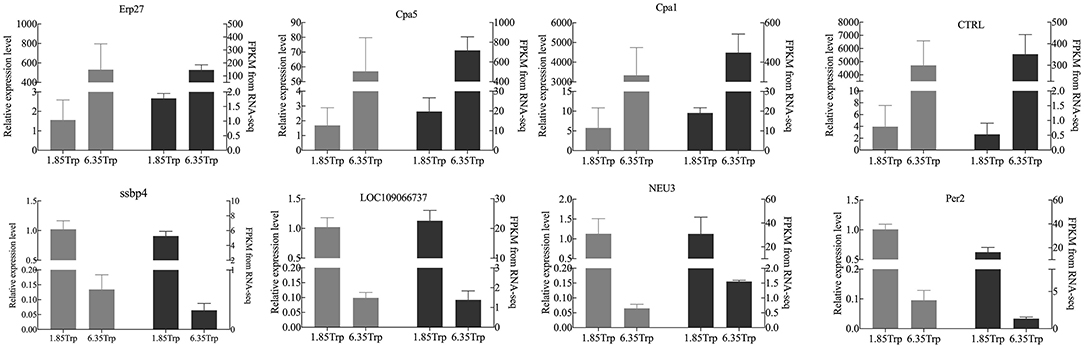
Figure 5. Comparison of the gene expression levels of RNA-seq with real-time PCR. The right axis represents the expression levels determined by RNA-seq in FPKM units, and the left axis represents gene expression levels determined by real-time PCR. Bars represent the mean (±SE) of three samples. The black column indicates the FPKM value; the grey column indicates the real-time PCR using β-actin as a reference gene. Data represent relative mRNA expression of (A) Erp27, (B) CPA5, (C) CPA1, (D) CTRL, (E) LOC109066737, (F) ssbp4, (G) NEU3, and (H) Per2 determined by quantitative real-time PCR.
Gut Microbial Composition
OTUs were defined as a read sharing 97% nucleotide-sequence identity (Supplementary Table 7). The number of observed species and indices of Shannon, Simpson, and Chao1 did not differ between the 6.35 Trp and control groups (Figure 6). Compared to the control group, the Simpson index (P < 0.05) in the 6.35 Trp group was decreased significantly, which indicated that the bacterial diversity was increased after 6.35 g kg−1 Trp diets treatment. PCoA is a comparative analysis of the microbial community composition of different samples (Figure 7). The unweighted UniFrac distance-based PcoA results showed that the microbiota compositions of the control group and the 6.35 Trp group were overt changes.
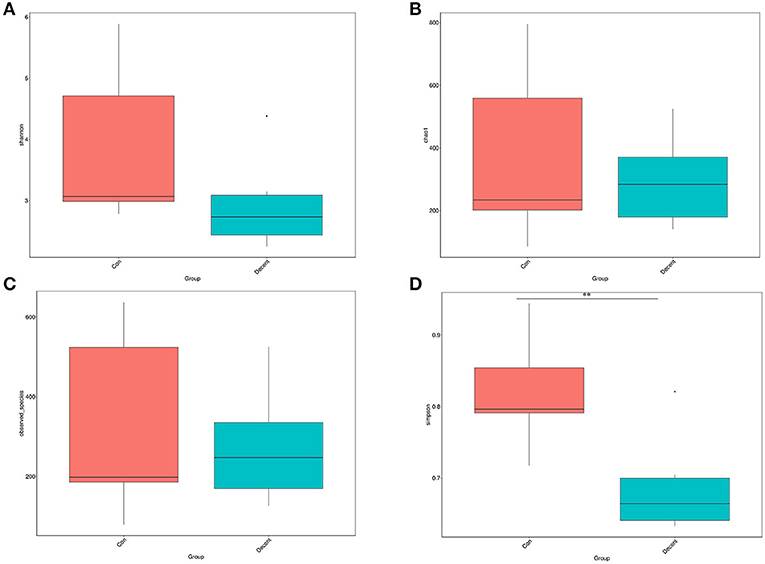
Figure 6. Alpha diversity of the gut microbiota in control group and 6.35Trp group. (A) Shannon's diversity index. (B) Chao1. (C) Observed-species. (D) Simpson. **p < 0.01 vs. control group by Tukey's post-hoc test.
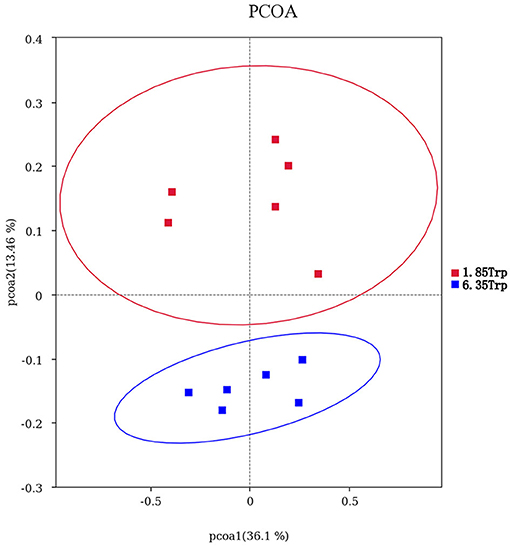
Figure 7. Principal coordinate analysis (PCoA) of the microbial community composition of the control group and 6.35 Trp group. Horizontal coordinates indicate one principal component, vertical coordinates indicate another principal component, and percentages indicate the value of the principal component's contribution to sample differences; each point in the graph represents a sample, and samples from the same group are represented using the same color. Blue represents the 6.35 Trp group, and red represents the 1.85 Trp group.
To identify the significantly different species of gut microbes between the control and 6.35 Trp groups, we analyzed the microbial community profiles using LEfSe software (Figure 8). There were seven significantly different biomarker, with enrichment of p_Fusobacteria, o_Fusobacteriales, c_Fusobacteria, g_cetobacterium, and f_Fusobacteriaceae in the 6.35 Trp group and c_Bacteroidia, and c_Bacteroidetes, in the control group. At the genus level, compared to the control group, Cetobacterium was significantly more abundant in the 6.35 Trp group (P < 0.05). At the phylum level, the abundance of Fusobacteria increased, but the abundance of Proteobacteria decreased in the 6.35 Trp group. The Firmicutes /B acteroidetes ratio was increased compared to that of the control group (P < 0.05).
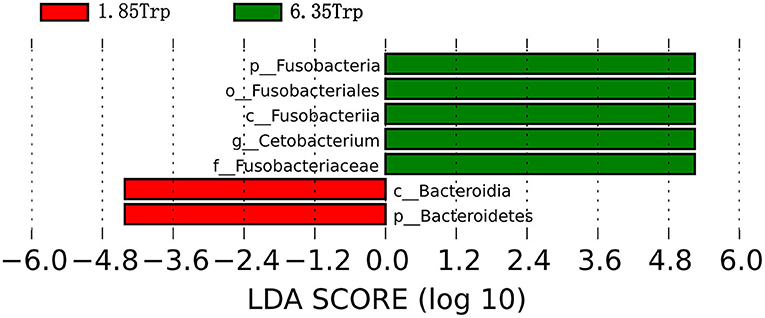
Figure 8. Linear discriminant analysis coupled with effect size (LEfSe) of the control group and 6.35 Trp group. The LDA value distribution histogram shows species with an LDA score greater than the set value (set to 4 by default), and the biomarkers with statistically significant differences between groups. The prefixes “p,” “c,” “o,” “f,” “g,” “s,” and “t” represent the annotated level of phylum, class, order, family, genus, species, and strain. Green represents the 6.35 Trp group, and red represents the 1.85 Trp group.
Dicussion
Growth Performance
Trp, an essential amino acid, is important for metabolic functions in fish (30–32). Some Trp metabolites are also important mediators to regulate partial physiological functions in fish (4). Previous studies have reported that different dietary levels of Trp affect growth performance in many fish, including juvenile silver catfish, and fingerling Indian catfish (11, 33). Trp improved hybrid catfish growth performance, digestive, and absorptive abilities (34). In this study, we found that the growth performance of ITCC increased as the dietary Trp levels increased (up to 6.35 g kg−1). This result supports that optimal dietary Trp could improve the growth performance and feed efficiency as reported in juvenile Jian carp (Cyprinus carpio var. Jian) (13), silver catfish (33), red drum (14), Indian catfish (Ahmed et al., 2012), and Nile tilapia (35). Analogously, increases in the dietary Trp concentrations can promote the ADG, and a certain dose-dependent relationship has been found between dietary Trp and the growth performance of fishes (36–40). However, another study showed that dietary supplementation with Trp had no effects on the growth performance and body proximate of seabream (Sparus aurata) (41). A possible reason for this discrepancy may be related to ethnic differences and different diets.
Trp Improved the Intestinal Morphology of ITCC
The integrity of the intestine is important for nutrient uptake and intestinal health (42–44). Generally, digestion and absorption depend on intestinal growth and development, as well as the activities of digestive enzymes in fish. The VH and CD are important indices of the functional capacity of enterocytes, and the VH: CD ratio affects the nutrient digestibility and absorption capacity of the intestinal mucosa (45, 46). The improvement of intestinal morphology was associated with increased nutrient absorption and growth performance of fish (47). Previous studies have demonstrated that fish have a special need for Trp in epithelial structures. Optimal Trp exerts beneficial effects on maintaining the intestinal structural integrity and intestinal development of fish (13, 48). In this study, feeding 6.35 g kg−1 Trp diets significantly increased villus height and crypt depth, which suggests that dietary Trp can influence the morphological structure of the intestine, which might be associated with nutrient digestion and absorption. Similar results showed that Trp improves the digestive and absorption capacity of fish (34, 49).
Trp Regulated the Expression of Genes in the Intestine of ITCC
Regarding the molecular mechanism by which Trp affects intestinal morphology, pathway enrichment of DEGs summarizes the complex networks of genes.
Fatty Acid Biosynthesis
Fatty acid biosynthesis capacity of fish varies among species, with trophic level hypothesized as a major factor (50). Fatty acid catabolism is a major source of energy in salmonid fish (51). In the present study, 6.35 g kg−1 Trp gut samples showed an upregulated expression of genes enriched significantly in Fatty acid biosynthesis signaling pathway (ACSL, FADD, ACACA, and FASN) compared with control group. This indicated that 6.35 g kg−1 Trp intake further promoted fatty acid biosynthesis in ITCC. Acetyl-CoA carboxylase (ACACA) and fatty acid synthase (FASN) are important rate-limiting enzymes that play a critical role in body weight differences in abdominal adipose tissue of growing animals (52). FASN plays a crucial role in the process from lipogenesis and is physiologically modulated by energy balance (53). So, the expression of FASN may be a good non-invasive indicator to study the role of Trp in growth and in studies on fatty acid biosynthesis in ITCC. Therefore, studying the regulation of Fatty acid biosynthesis has great significance for improving gut health.
Protein Digestion and Absorption
Fish growth is based on the digestion and absorption of nutrients (54). Fish are known to utilize proteins preferentially to lipids or carbohydrates as energy sources (55). Amino acids are important energy sources, satisfying 14–85% of the energy needs of teleost fish (54). A previous study showed that dietary Trp could improve the digestion and absorption ability of juvenile Jian carp (Cyprinus carpio var. Jian) (13). In this work, numerous genes related to “protein digestion and absorption” were upregulated in the intestine of fish fed 6.35 g kg−1 Trp diets, indicating that dietary Trp might influence associated with changed intestinal function in protein digestion and absorption of ITCC.
AMPK Signaling Pathway
TOR can activate the AMPK signaling pathway and control the growth response of cells to nutrients, especially amino acids (56). TOR is a nutrient sensor that can affect cell growth by regulating of protein synthesis (57, 58). Previous studies have reported that dietary Trp supplementation increased the expression of TOR and S6K1 mRNA levels and the phosphorylation level of TOR and S6K1 in grass carp muscle (59, 60). In this work, dietary Trp levels (6.35 g kg−1 Trp diet) upregulated the relative expression of TOR mRNA in the intestinal tract, in agreement with the finding that dietary Trp increased the expression of TOR in hybrid catfish (34). Conversely, another study showed that dietary Trp improved young grass carp growth, which may be related to the downregulation of TOR in the intestine of young grass carp (36). These results suggest that Trp may activate the AMPK signaling pathway to coordinate nutrient uptake in fish through regulation of TOR gene expression. However, the mechanisms require further study.
Intestinal Microorganism and Tryptophan
Trp plays important roles in maintaining gut microflora and intestinal health. Deficiency in dietary Trp could alter the gut microbial community (61). In this study, we found that 6.35 g kg−1 Trp significantly increased the abundance of Cetobacterium, and the Firmicutes/Bacteroidetes ratio at the phylum level (P < 0.05). A study by Liang et al. reported that Trp can increase intestinal species richness (62). Studies have shown that the ratio of Firmicutes/Bacteroidetes is related to increased energy harvesting and growth performance (63–65). Similarly, it was found that the higher the ratio of the relative abundance of Firmicutes to Bacteroidetes in grass carp, the faster the growth of the fish (66). It is worth noting that Trp increased the richness and diversity of the intestinal microbiota, perhaps partly because Trp promoted the growth of the intestinal villi, thus increasing the nutrients available to the intestinal flora (34, 62, 67).
Moreover, Cetobacterium has been identified as an important component of gut microbiota in freshwater fishes, which is an indicator of healthy fish (68–71). A previous study found the effect of diet on the abundance of Cetobacterium in the intestine of zebrafish (72). Numerous studies have confirmed the effect of Cetobacterium on the digestion and absorption of food, and the general growth and development process of fishes (Yunlong Grouper, common carp, and tilapia) (73, 74). In the present study, the abundance of Cetobacterium was increased significantly by 6.35 g kg−1 Trp treatment in ITCC, suggesting that Cetobacterium might play a crucial role in digestive and nutritional processes.
In addition, it was also found that in the 6.35 Trp group, the abundance of Fusobacteria increased after dietary with 6.35 g kg−1 Trp. Fusobacteria is the most dominant phylum in the fish intestine and it may have a lasting positive impact on intestinal function (17, 75). Fusobacteria may be involved in the digestive process of fish by providing a variety of enzymes (76). Previous studies have shown that Trp catabolites are absorbed through the intestinal epithelium and enter the bloodstream, affecting host physiology and promoting intestinal and systemic homeostasis (31). Thus, the increase in the abundance of Cetobacterium and Fusobacteria might indicate the positive effect of Trp in balancing the gut microbiota, which may be most strongly linked to health performance.
Overall, our study suggests that dietary 6.35 g kg−1 Trp had a beneficial effect on gut microbes and regulated the abundance of gut microbes in ITCC. However, further work needs to be done determine the effects of Trp on certain beneficial intestinal bacteria.
Conclusions
In this study, dietary Trp was found to improve the growth performance and intestinal health of ITCC. We found that 6.35 g kg−1 Trp altered intestinal gene expression involved in protein digestion and absorption and the AMPK signaling pathway in the ITCC gut. In addition, 6.35 g kg−1 Trp significantly increased the abundance of Cetobacterium and the Firmicutes/Bacteroidetes ratio in the ITCC gut. However, more studies are needed to clarify the interaction between host gene expression and gut microbiota in ITCC fed a diet with 6.35 g kg−1 Trp.
Data Availability Statement
The raw reads were deposited to Sequence Read Archive (SRA) database (PRJNA702642 for RNA-seq; BioProject: PRJNA704527 for 16S rRNA sequencing).
Ethics Statement
The animal study was reviewed and approved by the Animal Welfare Committee of the Institute of Subtropical Agriculture (201703-64C), Chinese Academy of Sciences, Changsha, China.
Author Contributions
KX and FH conceptualized and designed this study. YF, XL, DL, HG, YW, and WL performed the main experiments and analyzed the data. FH participated in experimental animal management, tissue sampling, and data analysis. YF, XL, and DL drafted this manuscript. KX and FH reviewed this manuscript. KX acquired the funding and supervised this study. All authors read and approved the manuscript.
Funding
This work was supported by the Special Funds for the Construction of Innovative Provinces in Hunan (2020JJ5635, 2019RS1068, 2020WK2030, and 2019NK2193), Supported by State Key Laboratory of Developmental Biology of Freshwater Fish (Grant No. 2018KF008), the Natural Science Foundation of Guangxi Province (2020JJB130030), the National Natural Science Foundation of China (31601953), and the Open Fund of Key Laboratory of Agro-ecological Processes in Subtropical Region, Chinese Academy of Sciences (ISA2019304).
Conflict of Interest
The authors declare that the research was conducted in the absence of any commercial or financial relationships that could be construed as a potential conflict of interest.
Supplementary Material
The Supplementary Material for this article can be found online at: https://www.frontiersin.org/articles/10.3389/fnut.2021.676035/full#supplementary-material
References
1. Fry JP, Love DC, Macdonald GK, West PC, Engstrom PM, Nachman KE, et al. Environmental health impacts of feeding crops to farmed fish. Environ Int. (2016) 91:201–14. doi: 10.1016/j.envint.2016.02.022
2. Dourou M, Dritsas P, Baeshen MN, Elazzazy A, Al-Farga A, Aggelis G. High-added value products from microalgae and prospects of aquaculture wastewaters as microalgae growth media. FEMS Microbiol. Lett. (2020) 367:fnaa081. doi: 10.1093/femsle/fnaa081
3. Thorburn AN, Macia L, Mackay CR. Diet, metabolites, and “western-lifestyle” inflammatory diseases. Immunity. (2014) 40:833–42. doi: 10.1016/j.immuni.2014.05.014
4. David A, Lange A, Abdul-Sada A, Tyler CR, Hill EM. Disruption of the prostaglandin metabolome and characterization of the pharmaceutical exposome in fish exposed to wastewater treatment works effluent as revealed by nanoflow-nanospray mass spectrometry-based metabolomics. Environ Sci Technol. (2017) 51:616–24. doi: 10.1021/acs.est.6b04365
5. Farhat, Khan MA. Dietary L-tryptophan requirement of fingerling stinging catfish, Heteropneustes fossilis (Bloch). Aquac Res. (2014) 45:1224–35. doi: 10.1111/are.12066
6. Wen H, Feng L, Jiang W, Liu Y, Jiang J, Li S, et al. Dietary tryptophan modulates intestinal immune response, barrier function, antioxidant status and gene expression of TOR and Nrf2 in young grass carp (Ctenopharyngodon idella). Fish Shellf Immunol. (2014) 40:275–87. doi: 10.1016/j.fsi.2014.07.004
7. Walton MJ, Coloso RM, Cowey CB, Adron JW, Knox D. The effects of dietary tryptophan levels on growth and metabolism of rainbow trout (Salmo gairdneri). Br J Nutr. (1984) 51:279–87. doi: 10.1079/BJN19840032
8. Akiyama T, Murai T, Mori K. Role of tryptophan metabolites in inhibition of spinal deformity of chum salmon fry caused by tryptophan deficiency. Nsugaf. (1986) 52:1255–9. doi: 10.2331/suisan.52.1255
9. Hoseini SM, Perez-Jimenez A, Costas B, Azeredo R, Gesto M. Physiological roles of tryptophan in teleosts: current knowledge and perspectives for future studies. Rev Aquac. (2019) 11:3–24. doi: 10.1111/raq.12223
10. Machado M, Azeredo R, Domingues A, Fernandez-Boo S, Dias J, Conceicao LEC, et al. Dietary tryptophan deficiency and its supplementation compromises inflammatory mechanisms and disease resistance in a teleost fish. Sci Rep. (2019) 9:7689. doi: 10.1038/s41598-019-44205-3
11. Ahmed I. Dietary amino acidl-tryptophan requirement of fingerling Indian catfish, Heteropneustes fossilis (Bloch), estimated by growth and haemato-biochemical parameters. Fish Physiol Biochem. (2012) 38:1195–209. doi: 10.1007/s10695-012-9609-1
12. Ciji A, Sahu NP, Pal AK, Akhtar MSJR. Dietary L-tryptophan modulates growth and immuno-metabolic status of Labeo rohita juveniles exposed to nitrite. Aquac Res. (2013) 46:2013–24. doi: 10.1111/are.12355
13. Tang QQ, Feng L, Jiang WD, Liu Y, Jiang J, Li SH, et al. Effects of dietary copper on growth, digestive, and brush border enzyme activities and antioxidant defense of hepatopancreas and intestine for young grass carp (Ctenopharyngodon idella). Biol Trace Elem Res. (2013) 155:370–80. doi: 10.1007/s12011-013-9785-6
14. Pewitt E, Castillo S, Velásquez A, Gatlin DM III. The dietary tryptophan requirement of juvenile red drum, Sciaenops ocellatus. Aquaculture. (2017) 469:112–6. doi: 10.1016/j.aquaculture.2016.11.030
15. Koleva Z, Dedov I, Kizheva J, Lipovanska R, Moncheva P, Hristova P. Lactic acid microflora of the gut of snail. Biotechnol Biotechnol Equip. (2014) 28:627–34. doi: 10.1080/13102818.2014.947071
16. Azad MK, Gao J, Ma J, Li T, Tan B, Huang X, et al. Opportunities of prebiotics for the intestinal health of monogastric animals. Anim Nutr. (2020) 6:379–88. doi: 10.1016/j.aninu.2020.08.001
17. Knutie SA, Gabor CR, Kohl KD, Rohr JR. Do host-associated gut microbiota mediate the effect of an herbicide on disease risk in frogs? J Anim Ecol. (2018) 87:489–99. doi: 10.1111/1365-2656.12769
18. Zha Y, Eiler A, Johansson F, Svanbäck R. Effects of predation stress and food ration on perch gut microbiota. Microbiome. (2018) 6:28. doi: 10.1186/s40168-018-0400-0
19. Liang H, Dai Z, Liu N, Ji Y, Chen J, Zhang Y, et al. Dietary L-tryptophan modulates the structural and functional composition of the intestinal microbiome in weaned piglets. Front Microbiol. (2018) 9:1736. doi: 10.3389/fmicb.2018.01736
20. Dehhaghi M, Kazemi Shariat Panahi H, Guillemin GJ. Microorganisms, tryptophan metabolism, and kynurenine pathway: a complex interconnected loop influencing human health status. Int J Tryptop Res. (2019) 12:1178646919852996. doi: 10.1177/1178646919852996
21. Taleb S. Tryptophan dietary impacts gut barrier and metabolic diseases. Front Immunol. (2019) 10:2113. doi: 10.3389/fimmu.2019.02113
22. Lee-Sarwar KA, Lasky-Su J, Kelly RS, Litonjua AA, Weiss ST. Gut microbial-derived metabolomics of asthma. Metabolites. (2020) 10:97. doi: 10.3390/metabo10030097
23. Chen S, Wang J, Liu S, Qin Q, Xiao J, Duan W, et al. Biological characteristics of an improved triploid crucian carp. Sci China Ser. C Life Sci. (2009) 52:733–8. doi: 10.1007/s11427-009-0079-3
24. Xu K, Wen M, Duan W, Ren L, Hu F, Xiao J, et al. Comparative analysis of testis transcriptomes from triploid and fertile diploid cyprinid fish. Biol Reprod. (2015) 92:95. doi: 10.1095/biolreprod.114.125609
25. Liu X, Wu P, Jiang WD, Liu Y, Jiang J, Kuang SY, et al. Effects of dietary ochratoxin a on growth performance and intestinal apical junctional complex of juvenile grass carp (Ctenopharyngodon idella). Toxins. (2020) 13:11. doi: 10.3390/toxins13010011
26. Wang L, Feng Z, Wang X, Wang X, Zhang X. DEGseq: an R package for identifying differentially expressed genes from RNA-seq data. Bioinformatics. (2010) 26:136–8. doi: 10.1093/bioinformatics/btp612
27. Robinson MD, Mccarthy DJ, Smyth GKJB. edgeR: a Bioconductor package for differential expression analysis of digital gene expression data. Bioinformatics. (2010) 26:139–40. doi: 10.1093/bioinformatics/btp616
28. Shannon P, Markiel A, Ozier O, Baliga NS, Wang JT, Ramage D, et al. Cytoscape: a software environment for integrated models of biomolecular interaction networks. Genome Res. (2003) 13:2498–504. doi: 10.1101/gr.1239303
29. Schmittgen TD, Livak KJ. Analyzing real-time PCR data by the comparative C(T) method. Nat Protoc. (2008) 3:1101–8. doi: 10.1038/nprot.2008.73
30. Le Floc'h N, Otten W, Merlot E. Tryptophan metabolism, from nutrition to potential therapeutic applications. Amino Acids. (2011) 41:1195–205. doi: 10.1007/s00726-010-0752-7
31. Roager HM, Licht TR. Microbial tryptophan catabolites in health and disease. Nat Commun. (2018) 9:3294. doi: 10.1038/s41467-018-05470-4
32. Maslowski KM. Metabolism at the centre of the host-microbe relationship. Clin Exp Immunol. (2019) 197:193–204. doi: 10.1111/cei.13329
33. Pianesso D, Neto JR, Silva LPD, Goulart FR, Adorian TJ, Mombach PI, et al. Determination of tryptophan requirements for juvenile silver catfish (Rhamdia quelen) and its effects on growth performance, plasma and hepatic metabolites and digestive enzymes activity. J Anim Feed Sci Technol. (2015) 210:172–83. doi: 10.1016/j.anifeedsci.2015.09.025
34. Zhao Y, Wu XY, Xu SX, Xie JY, Xiang KW, Feng L, et al. Dietary tryptophan affects growth performance, digestive and absorptive enzyme activities, intestinal antioxidant capacity, and appetite and GH-IGF axis-related gene expression of hybrid catfish (Pelteobagrus vachelli♀ × Leiocassis longirostris♂). Fish Physiol Biochem. (2019) 45:1627–47. doi: 10.1007/s10695-019-00651-4
35. Zaminhan M, Boscolo WR, Neu DH, Feiden A, Barriviera Furuya VRB, Furuya WM. Dietary tryptophan requirements of juvenile Nile tilapia fed corn-soybean meal-based diets. Anim Feed Sci Technol. (2017) 227:62–7. doi: 10.1016/j.anifeedsci.2017.03.010
36. Tang L, Feng L, Sun CY, Chen GF, Jiang WD, Hu K, et al. Effect of tryptophan on growth, intestinal enzyme activities and TOR gene expression in juvenile Jian carp (Cyprinus carpio var. Jian): studies in vivo and in vitro. Aquaculture. (2013) 412–3:23–33. doi: 10.1016/j.aquaculture.2013.07.002
37. Tejpal CS, Pal AK, Sahu NP, Kumar JA, Muthappa NA, Vidya S, et al. Dietary supplementation of l-tryptophan mitigates crowding stress and augments the growth in Cirrhinus mrigala fingerlings. Aquaculture. (2009) 293:277. doi: 10.1016/j.aquaculture.2008.09.014
38. Ahmed I, Khan MA, Jafri AKJR. Dietary threonine requirement of fingerling Indian major carp, Cirrhinus mrigala (Hamilton). Aquac Res. (2004) 35:162–70. doi: 10.1111/j.1365-2109.2004.00997.x
39. Fatmaabidi S, Khan MJ. Dietary tryptophan requirement of fingerling rohu, Labeo rohita (Hamilton), based on growth and body composition. J World Aquac Soc. (2010) 41:700–9. doi: 10.1111/j.1749-7345.2010.00412.x
40. Cowan M, Petri WA Jr. Microglia: immune regulators of neurodevelopment. Front Immunol. (2018) 9:2576. doi: 10.3389/fimmu.2018.02576
41. Cerqueira M, Schrama D, Silva TS, Colen R, Engrola SAD, Conceição LEC, et al. How tryptophan levels in plant-based aquafeeds affect fish physiology, metabolism and proteome. J Proteom. (2020) 221:103782. doi: 10.1016/j.jprot.2020.103782
42. Qian L, Tang M, Yang J, Wang Q, Cai C, Jiang S, et al. Targeted mutations in myostatin by zinc-finger nucleases result in double-muscled phenotype in Meishan pigs. Sci Rep. (2015) 5:14435. doi: 10.1038/srep14435
43. Qiu K, Qin CF, Luo M, Zhang X, Sun WJ, Jiao N, et al. Protein restriction with amino acid-balanced diets shrinks circulating pool size of amino acid by decreasing expression of specific transporters in the small intestine. PLoS ONE. (2016) 11:e0162475. doi: 10.1371/journal.pone.0162475
44. Yu Y, Lu J, Oliphant K, Gupta N, Claud K, Lu L. Maternal administration of probiotics promotes gut development in mouse offsprings. PLoS ONE. (2020) 15:e0237182. doi: 10.1371/journal.pone.0237182
45. Chang Y, Cai H, Liu G, Chang W, Zheng A, Zhang S, et al. Effects of dietary leucine supplementation on the gene expression of mammalian target of rapamycin signaling pathway and intestinal development of broilers. Anim Nutr. (2015) 1:313–9. doi: 10.1016/j.aninu.2015.11.005
46. Wu QJ, Zheng XC, Wang T, Zhang TY. Effect of dietary oridonin supplementation on growth performance, gut health, and immune response of broilers infected with. Irish Vet J. (2018) 71:16. doi: 10.1186/s13620-018-0128-y
47. Kumari R, Gupta S, Singh AR, Ferosekhan S, Kothari DC, Pal AK, et al. Chitosan nanoencapsulated exogenous trypsin biomimics zymogen-like enzyme in fish gastrointestinal tract. PLoS ONE. (2013) 8:e74743. doi: 10.1371/journal.pone.0074743
48. Poston HA, Rumsey GL. Factors affecting dietary requirement and deficiency signs of L-tryptophan in rainbow trout. J Nutr. (1983) 113:2568–77. doi: 10.1093/jn/113.12.2568
49. Blanco AM, Bertucci JI, Sánchez-Bretaño A, Delgado MJ, Valenciano AI, Unniappan S. Ghrelin modulates gene and protein expression of digestive enzymes in the intestine and hepatopancreas of goldfish (Carassius auratus) via the GHS-R1a: possible roles of PLC/PKC and AC/PKA intracellular signaling pathways. Mol Cell Endocrinol. (2017) 442:165–81. doi: 10.1016/j.mce.2016.12.027
50. Garrido D, Kabeya N, Betancor MB, Pérez JA, Acosta NG, Tocher DR, et al. Functional diversification of teleost Fads2 fatty acyl desaturases occurs independently of the trophic level. Sci Rep. (2019) 9:11199. doi: 10.1038/s41598-019-47709-0
51. Horn SS, Sonesson AK, Krasnov A, Moghadam H, Hillestad B, Meuwissen THE. Individual differences in EPA and DHA content of Atlantic salmon are associated with gene expression of key metabolic processes. Sci Rep. (2019) 9:3889. doi: 10.1038/s41598-019-40391-2
52. Pitel F, Fillon V, Heimel C, Le Fur N, El Khadir-Mounier C, Douaire M, et al. Mapping of FASN and ACACA on two chicken microchromosomes disrupts the human 17q syntenic group well conserved in mammals. Mammal Genome. (1998) 9:297–300. doi: 10.1007/s003359900752
53. Kuhajda FP. Fatty acid synthase and cancer: new application of an old pathway. Cancer Res. (2006) 66:5977–80. doi: 10.1158/0008-5472.CAN-05-4673
54. Jiang J, Feng L, Tang L, Liu Y, Jiang W, Zhou X. Growth rate, body composition, digestive enzymes and transaminase activities, and plasma ammonia concentration of different weight Jian carp (var.). Anim Nutr. (2015) 1:373–7. doi: 10.1016/j.aninu.2015.12.006
55. Lee DH, Lim SR, Han JJ, Lee SW, Ra CS, Kim JD. Effects of dietary garlic powder on growth, feed utilization and whole body composition changes in fingerling sterlet sturgeon, Acipenser ruthenus. Asian Austral J Anim Sci. (2014) 27:1303–10. doi: 10.5713/ajas.2014.14087
56. González A, Hall MN. Nutrient sensing and TOR signaling in yeast and mammals. EMBO J. (2017) 36:397–408. doi: 10.15252/embj.201696010
57. Paoli PP, Wakeling LA, Wright GA, Ford D. The dietary proportion of essential amino acids and Sir2 influence lifespan in the honeybee. Age. (2014) 36:9649. doi: 10.1007/s11357-014-9649-9
58. Honda Y, Araki Y, Hata T, Ichihara K, Ito M, Tanaka M, et al. 10-Hydroxy-2-decenoic acid, the major lipid component of royal jelly, extends the lifespan of Caenorhabditis elegans through dietary restriction and target of rapamycin signaling. J Aging Res. (2015) 2015:425261. doi: 10.1155/2015/425261
59. Jiang WD, Wen HL, Liu Y, Jiang J, Kuang SY, Wu P, et al. The tight junction protein transcript abundance changes and oxidative damage by tryptophan deficiency or excess are related to the modulation of the signalling molecules, NF-κB p65, TOR, caspase-(3,8,9) and Nrf2 mRNA levels, in the gill of young grass carp (Ctenopharyngodon idellus). Fish Shellfish Immunol. (2015) 46:168–80. doi: 10.1016/j.fsi.2015.06.002
60. Jiang WD, Wen HL, Liu Y, Jiang J, Wu P, Zhao J, et al. Enhanced muscle nutrient content and flesh quality, resulting from tryptophan, is associated with anti-oxidative damage referred to the Nrf2 and TOR signalling factors in young grass carp (Ctenopharyngodon idella): avoid tryptophan deficiency or excess. Food Chem. (2016) 199:210–9. doi: 10.1016/j.foodchem.2015.12.003
61. Hashimoto T, Perlot T, Rehman A, Trichereau J, Ishiguro H, Paolino M, et al. (2012). ACE2 links amino acid malnutrition to microbial ecology and intestinal inflammation. Nature. 487, 477–81. doi: 10.1038/nature11228
62. Liang H, Dai Z, Kou J, Sun K, Chen J, Yang Y, et al. Dietary l-tryptophan supplementation enhances the intestinal mucosal barrier function in weaned piglets: implication of tryptophan-metabolizing microbiota. Int J Mol Sci. (2018) 20:20. doi: 10.3390/ijms20010020
63. Turnbaugh PJ, Ley RE, Mahowald MA, Magrini V, Mardis ER, Gordon JI. An obesity-associated gut microbiome with increased capacity for energy harvest. Nature. (2006) 444:1027–31. doi: 10.1038/nature05414
64. Moschen AR, Wieser V, Tilg H. Dietary factors: major regulators of the gut's microbiota. Gut Liver. (2012) 6:411–6. doi: 10.5009/gnl.2012.6.4.411
65. López-Cepero AA, Palacios C. Association of the intestinal microbiota and obesity. Puerto Rico Health Sci J. (2015) 34:60–4. doi: 10.1111/j.1472-765X.2007.02258.x
66. Li X, Yan Q, Xie S, Hu W, Yu Y, Hu Z. Gut microbiota contributes to the growth of fast-growing transgenic common carp (Cyprinus carpio L.). PLoS ONE. (2013) 8:e64577. doi: 10.1371/journal.pone.0064577
67. Gao J, Xu K, Liu H, Liu G, Bai M, Peng C, et al. Impact of the gut microbiota on intestinal immunity mediated by tryptophan metabolism. Front Cell Infect Microbiol. (2018) 8:13. doi: 10.3389/fcimb.2018.00013
68. Robins Wahlin TB, Wahlin A, Winblad B, Bäckman L. The influence of serum vitamin B12 and folate status on cognitive functioning in very old age. Biol Psychol. (2001) 56:247–65. doi: 10.1016/S0301-0511(01)00079-5
69. Tsuchiya C, Sakata T, Sugita H. Novel ecological niche of Cetobacterium somerae, an anaerobic bacterium in the intestinal tracts of freshwater fish. Lett Appl Microbiol. (2008) 46:43–8.
70. Van Kessel MA, Dutilh BE, Neveling K, Kwint MP, Veltman JA, Flik G, et al. Pyrosequencing of 16S rRNA gene amplicons to study the microbiota in the gastrointestinal tract of carp (Cyprinus carpio L.). AMB Exp. (2011) 1:41. doi: 10.1186/2191-0855-1-41
71. Ramírez C, Coronado J, Silva A, Romero J. Cetobacterium is a major component of the microbiome of giant amazonian fish (Arapaima gigas) in ecuador. Animals. (2018) doi: 10.3390/ani8110189
72. Zheng M, Lu J, Lin G, Su H, Sun J, Luan T. Dysbiosis of gut microbiota by dietary exposure of three graphene-family materials in zebrafish (Danio rerio). Environ Pollut. (2019) 254:112969. doi: 10.1016/j.envpol.2019.112969
73. Sugita H, Miyajima C, Deguchi Y. The vitamin-B12-producing Ability of the intestinal microflora of fresh-water fish. Aquaculture. (1991) 92:267–76. doi: 10.1016/0044-8486(91)90028-6
74. Ma C, Chen C, Jia L, He X, Zhang B. Comparison of the intestinal microbiota composition and function in healthy and diseased Yunlong Grouper. AMB Exp. (2019) 9:187. doi: 10.1186/s13568-019-0913-3
75. Clements KD, Angert ER, Montgomery WL, Choat JH. Intestinal microbiota in fishes: what's known and what's not. Mol Ecol. (2014) 23:1891–8. doi: 10.1111/mec.12699
Keywords: tryptophan, improved triploid crucian carp, transcriptome, intestinal flora, 16S rRNA
Citation: Fu Y, Liang X, Li D, Gao H, Wang Y, Li W, Xu K and Hu F (2021) Effect of Dietary Tryptophan on Growth, Intestinal Microbiota, and Intestinal Gene Expression in an Improved Triploid Crucian Carp. Front. Nutr. 8:676035. doi: 10.3389/fnut.2021.676035
Received: 04 March 2021; Accepted: 20 May 2021;
Published: 17 June 2021.
Edited by:
Christophe Lacroix, ETH Zürich, SwitzerlandReviewed by:
Jun Wang, Shanghai Ocean University, ChinaYongqing Hou, Wuhan Polytechnic University, China
Copyright © 2021 Fu, Liang, Li, Gao, Wang, Li, Xu and Hu. This is an open-access article distributed under the terms of the Creative Commons Attribution License (CC BY). The use, distribution or reproduction in other forums is permitted, provided the original author(s) and the copyright owner(s) are credited and that the original publication in this journal is cited, in accordance with accepted academic practice. No use, distribution or reproduction is permitted which does not comply with these terms.
*Correspondence: Kang Xu, xukang2020@163.com; Fangzhou Hu, hufangzhou90@163.com
†These authors have contributed equally to this work