Age-related differences in functional nodes of the brain cortex – a high model order group ICA study
- 1 Department of Diagnostic Radiology, Oulu University Hospital, Oulu, Finland
- 2 Department of Psychiatry, Oulu University Hospital, Oulu, Finland
- 3 Department of Child Psychiatry, Oulu University Hospital, Oulu, Finland
- 4 Department of Pediatrics, Oulu University Hospital, Oulu, Finland
- 5 FMRIB Centre, Oxford University, London, UK
- 6 Centre for Neuroscience, Imperial College London, London, UK
Functional MRI measured with blood oxygen dependent (BOLD) contrast in the absence of intermittent tasks reflects spontaneous activity of so-called resting state networks (RSN) of the brain. Group level independent component analysis (ICA) of BOLD data can separate the human brain cortex into 42 independent RSNs. In this study we evaluated age-related effects from primary motor and sensory, and, higher level control RSNs. One hundred sixty-eight healthy subjects were scanned and divided into three groups: 55 adolescents (ADO, 13.2 ± 2.4 years), 59 young adults (YA, 22.2 ± 0.6 years), and 54 older adults (OA, 42.7 ± 0.5 years), all with normal IQ. High model order group probabilistic ICA components (70) were calculated and dual-regression analysis was used to compare 21 RSN’s spatial differences between groups. The power spectra were derived from individual ICA mixing matrix time series of the group analyses for frequency domain analysis. We show that primary sensory and motor networks tend to alter more in younger age groups, whereas associative and higher level cognitive networks consolidate and re-arrange until older adulthood. The change has a common trend: both spatial extent and the low frequency power of the RSN’s reduce with increasing age. We interpret these result as a sign of normal pruning via focusing of activity to less distributed local hubs.
Introduction
In the mid 1990s, Biswal and Hyde were the first to notice that functionally connected regions of the brain are more synchronized in their activity than what could be expected from the noise in general. It was seen as there were modulated waves carrying information between different regions (Biswal et al., 1995). Since this discovery functional MRI measured with blood oxygen dependent (BOLD) contrast in the absence of intermittent tasks has become a major area of interest in the understanding of brain activity (Kiviniemi et al., 2000, 2003; Fox et al., 2007; Vincent et al., 2007). Spatially independent resting state networks (RSN) have been shown to be differentiable from noise during normal, awake resting conditions, during sleep, and, during anesthesia (Kiviniemi et al., 2000; Fransson et al., 2009; Gao et al., 2009).
The background activity fluctuations of the brain cannot be modeled a priori as in task activation studies, therefore more data driven approaches are needed. Furthermore some of the noise sources in the BOLD data may be difficult to account for and their separation from the neuronal signal is demanding (Birn et al., 2006; Starck et al., 2010). Independent component analysis (ICA) offers an effective tool for both the separation of functional sources and noise in a data driven manner without strong assumptions. ICA separates mixtures of independent source signals by maximizing the non-Gaussianity of the source signals. Spatial domain ICA (sICA) can separate BOLD signal sources that represent reactions to externally cued task-activations, background activity within functional brain (i.e., resting state) networks (RSN), and various physiological noise and artifact sources (McKeown et al., 1998; Calhoun et al., 2001; Kiviniemi et al., 2003; Beckmann and Smith, 2004; van de Ven et al., 2004; Beckmann et al., 2005) ICA methodology yields results that are consistent with the results of other contemporary methods of detecting large scale temporally coherent networks from the BOLD signal data (Long et al., 2008).
Recently it has been shown that at least some 42 robust RSNs can be separated from group ICA runs when the algorithm is given the task to search for high model order (Kiviniemi et al., 2009; Smith et al., 2009). When the model order of the ICA estimation is increased, the separated BOLD signal sources have been shown to split into several functional nodes (Li et al., 2007; Ma et al., 2007; Malinen et al., 2007; Eichele et al., 2008). Higher ICA model order (≈70) enables the detection of sub-networks and other independent sources not detected in lower model orders without overfitting the data (Ma et al., 2007; Malinen et al., 2007; Abou-Elseoud et al., 2010)
Recently a large data collection of over 1000 subjects was able to show age-related differences in the brain networks (Biswal et al., 2010). There are few studies about the functional connectivity development from childhood to adulthood and they are predominantly focused on the DMN. In the gestationally preterm and term infants, a primitive resting state networks have been found (Fransson, 2005; Fransson et al., 2007; Gao et al., 2009). The DMN connectivity might develop in a non-linear manner from childhood to adulthood (Gao et al., 2009). DMN regions are sparsely functionally connected in children at early school age compared to adults (Fair et al., 2008). Posterior cingulate cortex (PCC) and medial prefrontal cortex (mPFC) are suggested to be major hubs of the DMN and connections between them have been found to be weaker in children than in young adults (Fair et al., 2008; Supekar et al., 2010). There is little knowledge of the maturing of the non-DMN, for instance primary sensory or higher level cognitive resting state networks. The comparison between young and older adults has not previously been done to our knowledge.
In the present study, we evaluated age-related effects ranging from 25 independent resting state networks primary motor and sensory cortices to higher level control networks in 168 subjects divided into three age cohorts. Both spatial and frequency domain effects of high model order ICA components were analyzed. We show that the activity within the primary cortices and higher level cognitive areas alters in different ages and yet has a common trend. Some of the networks undergo splitting into several sources at later age.
Materials and Methods
The ethical committee of Oulu University Hospital has approved the studies for which the subjects have been recruited, and informed consent has been obtained from each adult subject and from the parents of adolescent subjects according to the Helsinki declaration. The following data of Northern Finland Birth Cohorts 1986 (NFBC 1986) and 1966 (NFBC 1966, c.f. www.kelo.oulu.fi/NFBC/ for further information) were used: At risk mental stage (ARMS) of NFBC 1986 focusing on ADHD and schizophrenia and a NFBC 1966 study on schizophrenia. From pediatric psychiatry a Childhood Autism Spectrum-study with 30 healthy control children and a pediatric temporal lobe epilepsia study with 26 healthy control children were used. Both NFBC data and the childhood studies have been imaged with an identical resting state fMRI protocol. The healthy controls of all these studies represent the normal Finnish population and therefore they were chosen for the analysis. Fifty-five adolescent subjects (ADO, mean 13.2 ± 2.4 years, 20 ), 59 young adults (YA mean 22.2 ± 0.6 years 35 ), and 54 older adults (OA, mean 42.7 ± 0.5, 25 OA), all with normal IQ, and verifiably free of psychiatric and neurological disease, were included.
Subjects were imaged on a GE 1.5 T HDX scanner equipped with an eight-channel head coil using parallel imaging with an acceleration factor of 2. The scanning was performed during January 2007–June 2009. All subjects received identical instructions: to simply rest without motion and focus on a cross on an fMRI dedicated screen which they saw through the mirror system of the head coil. Hearing was protected using ear plugs, and motion was minimized using soft pads fitted over the ears.
The functional scanning was performed using an EPI GRE sequence. The TR used was 1800 ms and the TE was 40 ms. The whole brain was covered, using 28 oblique axial slices 4-mm thick with a 0.4 mm space between the slices. FOV was 25.6 cm × 25.6 cm with a 64 × 64 matrix, and a flip angle of 90°. The resting state scan consisted of 253 functional volumes. The first three images were excluded due to T1 equilibrium effects. In all three studies, the resting state scanning started the protocols, and lasted 7 min and 36 s. In addition to resting state fMRI, T1-weighted scans were taken with 3D FSPGR BRAVO sequence (FOV 24.0 cm, matrix 256 × 256, slice thickness 1.0 mm, TR 12.1 ms, TE 5.2 ms, and flip angle 20°) in order to obtain anatomical images for co-registration of the fMRI data to standard space coordinates.
Pre-Processing of Imaging Data
The pre-processing was identical to our previous study of 55 subjects group PICA (Kiviniemi et al., 2009). The data collection consists of some 580 subjects and healthy subjects with excess motion (>2 mm translational or 1° of rotation) were discarded in order to reduce motion artifacts. Also FSL and ICA were both used to reduce motion artifacts. In short, the head motion in the fMRI data was corrected with FSL 3.3 mcflirt-software (Jenkinson et al., 2002) with default settings. Brain extraction was carried out for motion corrected BOLD volumes with BET software (Smith, 2002) using threshold parameters f = 0.5 and g = 0; and for 3D FSPGR volumes, using parameters f = 0.25 and g = 0. The BOLD volumes were spatially smoothed with a 7 mm FWHM Gaussian kernel and the voxel time series were de-trended using a Gaussian linear low-pass filter with a 125-s cutoff. Co-registration into MNI space was carried out using the non-linear FSL 4.14 FNIRT software. Corresponding fMRI volumes were co-registered with corresponding 3D FSPGR volumes that had been co-registered to a MNI152 brain template with a 2-mm voxel size included in FSL. The functional volumes were transferred into the MNI space but down-sampled to 4-mm isotropic resolution in order to reduce computational complexity.
Spatial Domain Analysis
The image analysis and IC identification protocols were identical to our previous study (Kiviniemi et al., 2009). Probabilistic independent component analysis (PICA) (Beckmann and Smith, 2004) was used to analyze the data into 70 independent components. The analysis was carried out in two separate ICA runs, one containing the ADO and YA groups and the other containing the YA and OA groups. This was done in order to avoid the blurring of the age-related differences by averaging of the source ICs in a large dataset. The YA group was used as a common marker in both analyses. Also, a joint three group run was performed and there the components indeed were averaged ICs that did not clearly show the age-related intricacies. It is more sensitive to perform group ICA runs to detect source RSN’s for dual regression from age groups closer to each other than from the whole age span.
In this study, the model order was chosen to be 70, in correspondence with the high order sICA modeling of the resting state BOLD data, based on previous experience on the matter (Abou-Elseoud et al., 2010). Two neuroradiologists (H.L and V.K) using the same criteria as before, depicted the thresholded IC maps corresponding to the previously depicted RSNs sources (Kiviniemi et al., 2009). Some 30 artifactual (residual motion, mal-alignment, and other noise sources) were discarded initially. From the passing 42 ± 3 IC sources, 21 RSN sources representing primary sensory and motor and control networks were chosen for more detailed spatial and frequency domain analysis. The selection of the RSN sources was based on previous literature, presence of low frequency fluctuations and personal experience on ICA source selection (Kiviniemi et al., 2003, 2009; Abou-Elseoud et al., 2010). After PICA, dual regression was performed between ADO vs. YA and YA vs. OA groups according to a procedure described previously (Filippini et al., 2009). Mean group t-score maps for each age group were obtained from the individual level analysis of the dual-regression program (FSL 4.0.4). The unthresholded mean group t-score maps produced by dual-regression script were presented with 6 < t < 12 arbitrary thresholding. The effect of age was analyzed between the groups with the dual_regression software script of FSL using threshold free cluster enhancement (TFCE)-correction for multiple comparison at a p < 0.01 threshold. In the group-comparison analysis one does not want to rely on a fixed assumed null-hypothesis, e.g., the fact that in dual regression the data is used twice can easily induce a bias towards average non-zero regression. The non-parametric TFCE-test avoids any of these issues so as the threshold adapts to the distribution, whatever it is. Secondly we use unthresholded ICA maps on unthresholded data to then derive a new estimate for which we perform a single test. What’s more is that the test itself looks at differential effects, i.e., at the relation with age, which has not entered into any analyses before.
Frequency Domain Analysis
Power spectral analysis of the RSN sources is based on a large group PICA analysis with all the 168 subjects analyzed together (group168PICA). This was done in order to obtain matched individual IC signal source time courses for further power spectral analysis. The time courses were extracted from the group168PICA mixing matrix as before (Kiviniemi et al., 2009). An FFT power spectrum analysis was performed on the IC time courses individually. Mean power spectra per each group for each of the analyzed IC sources was analyzed. The difference between frequency power of the analyzed RSN sources between the groups (ADO, YA, OA) was analyzed with Student’s t-test and the results were Bonferroni corrected for multiple comparisons for each spectrum (threshold p < 0.0025).
Results
There is a common trend in the age-related effects on resting state networks. Increasing age reduces the spatial extent of the sources and the network hubs consolidate. This is illustrated in Figures 1, 2, 4, 5 and 8, and in Table 1, where the key-hubs related to functional networks present marked changes with age (for age-group mean maps, c.f. Figures S1 and S2 in Supplementary material).
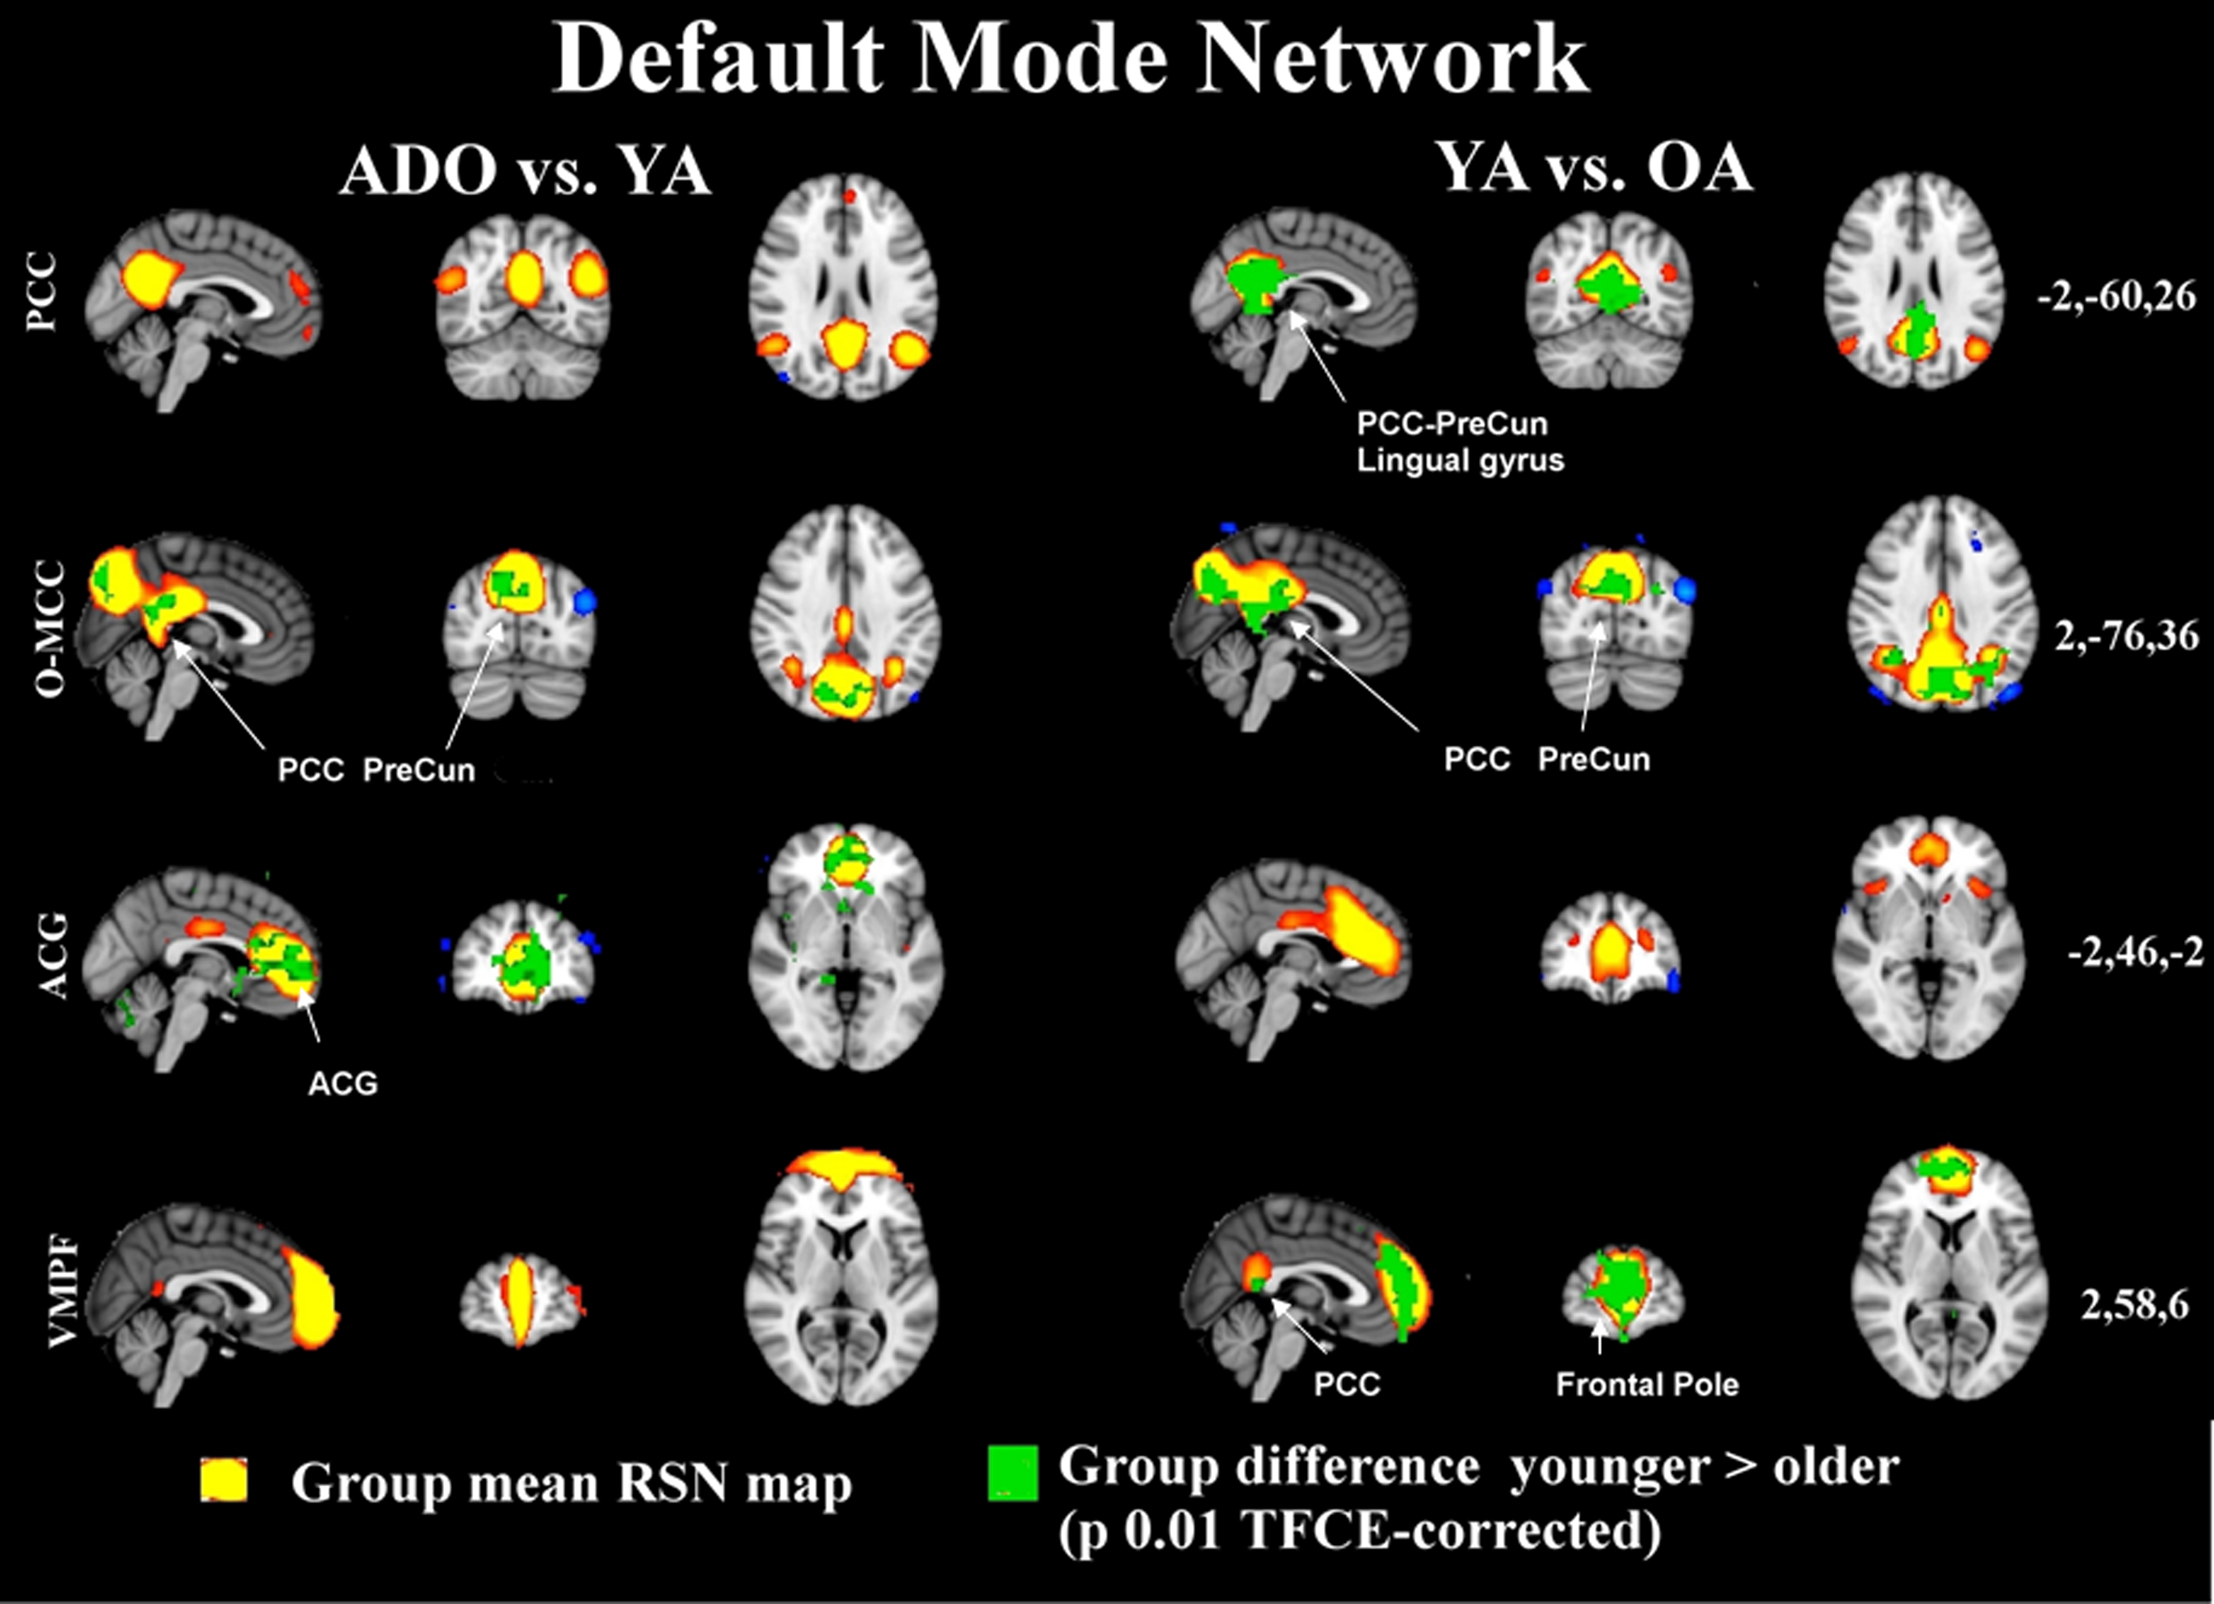
Figure 1. The maps in 3D with MNI (coordinates on the right) background present the group mean RSN sources of ADO and YA and YA and OA of combined groupICA analyses with 5 < z < 10 thresholding in red-yellow colour. The overlaid green colour indicates statistically significant differences between the groups (left ADO vs. YA, on right YA vs. OA) after dual regression. Significant difference areas are named and pointed with white arrows. PCC = posterior cingulate gyrus, PreCun = precuneous, ACG = anterior cingulate gyrus.

Figure 2. The salience and executive control networks are show with identical thresholding as in Figure 1. It is notable that adolescents and younger adults have a salience-executive signal source which is separated into two components in the older adults. SMA, supplementary motor area; ACG, anterior cingulate gyrus.
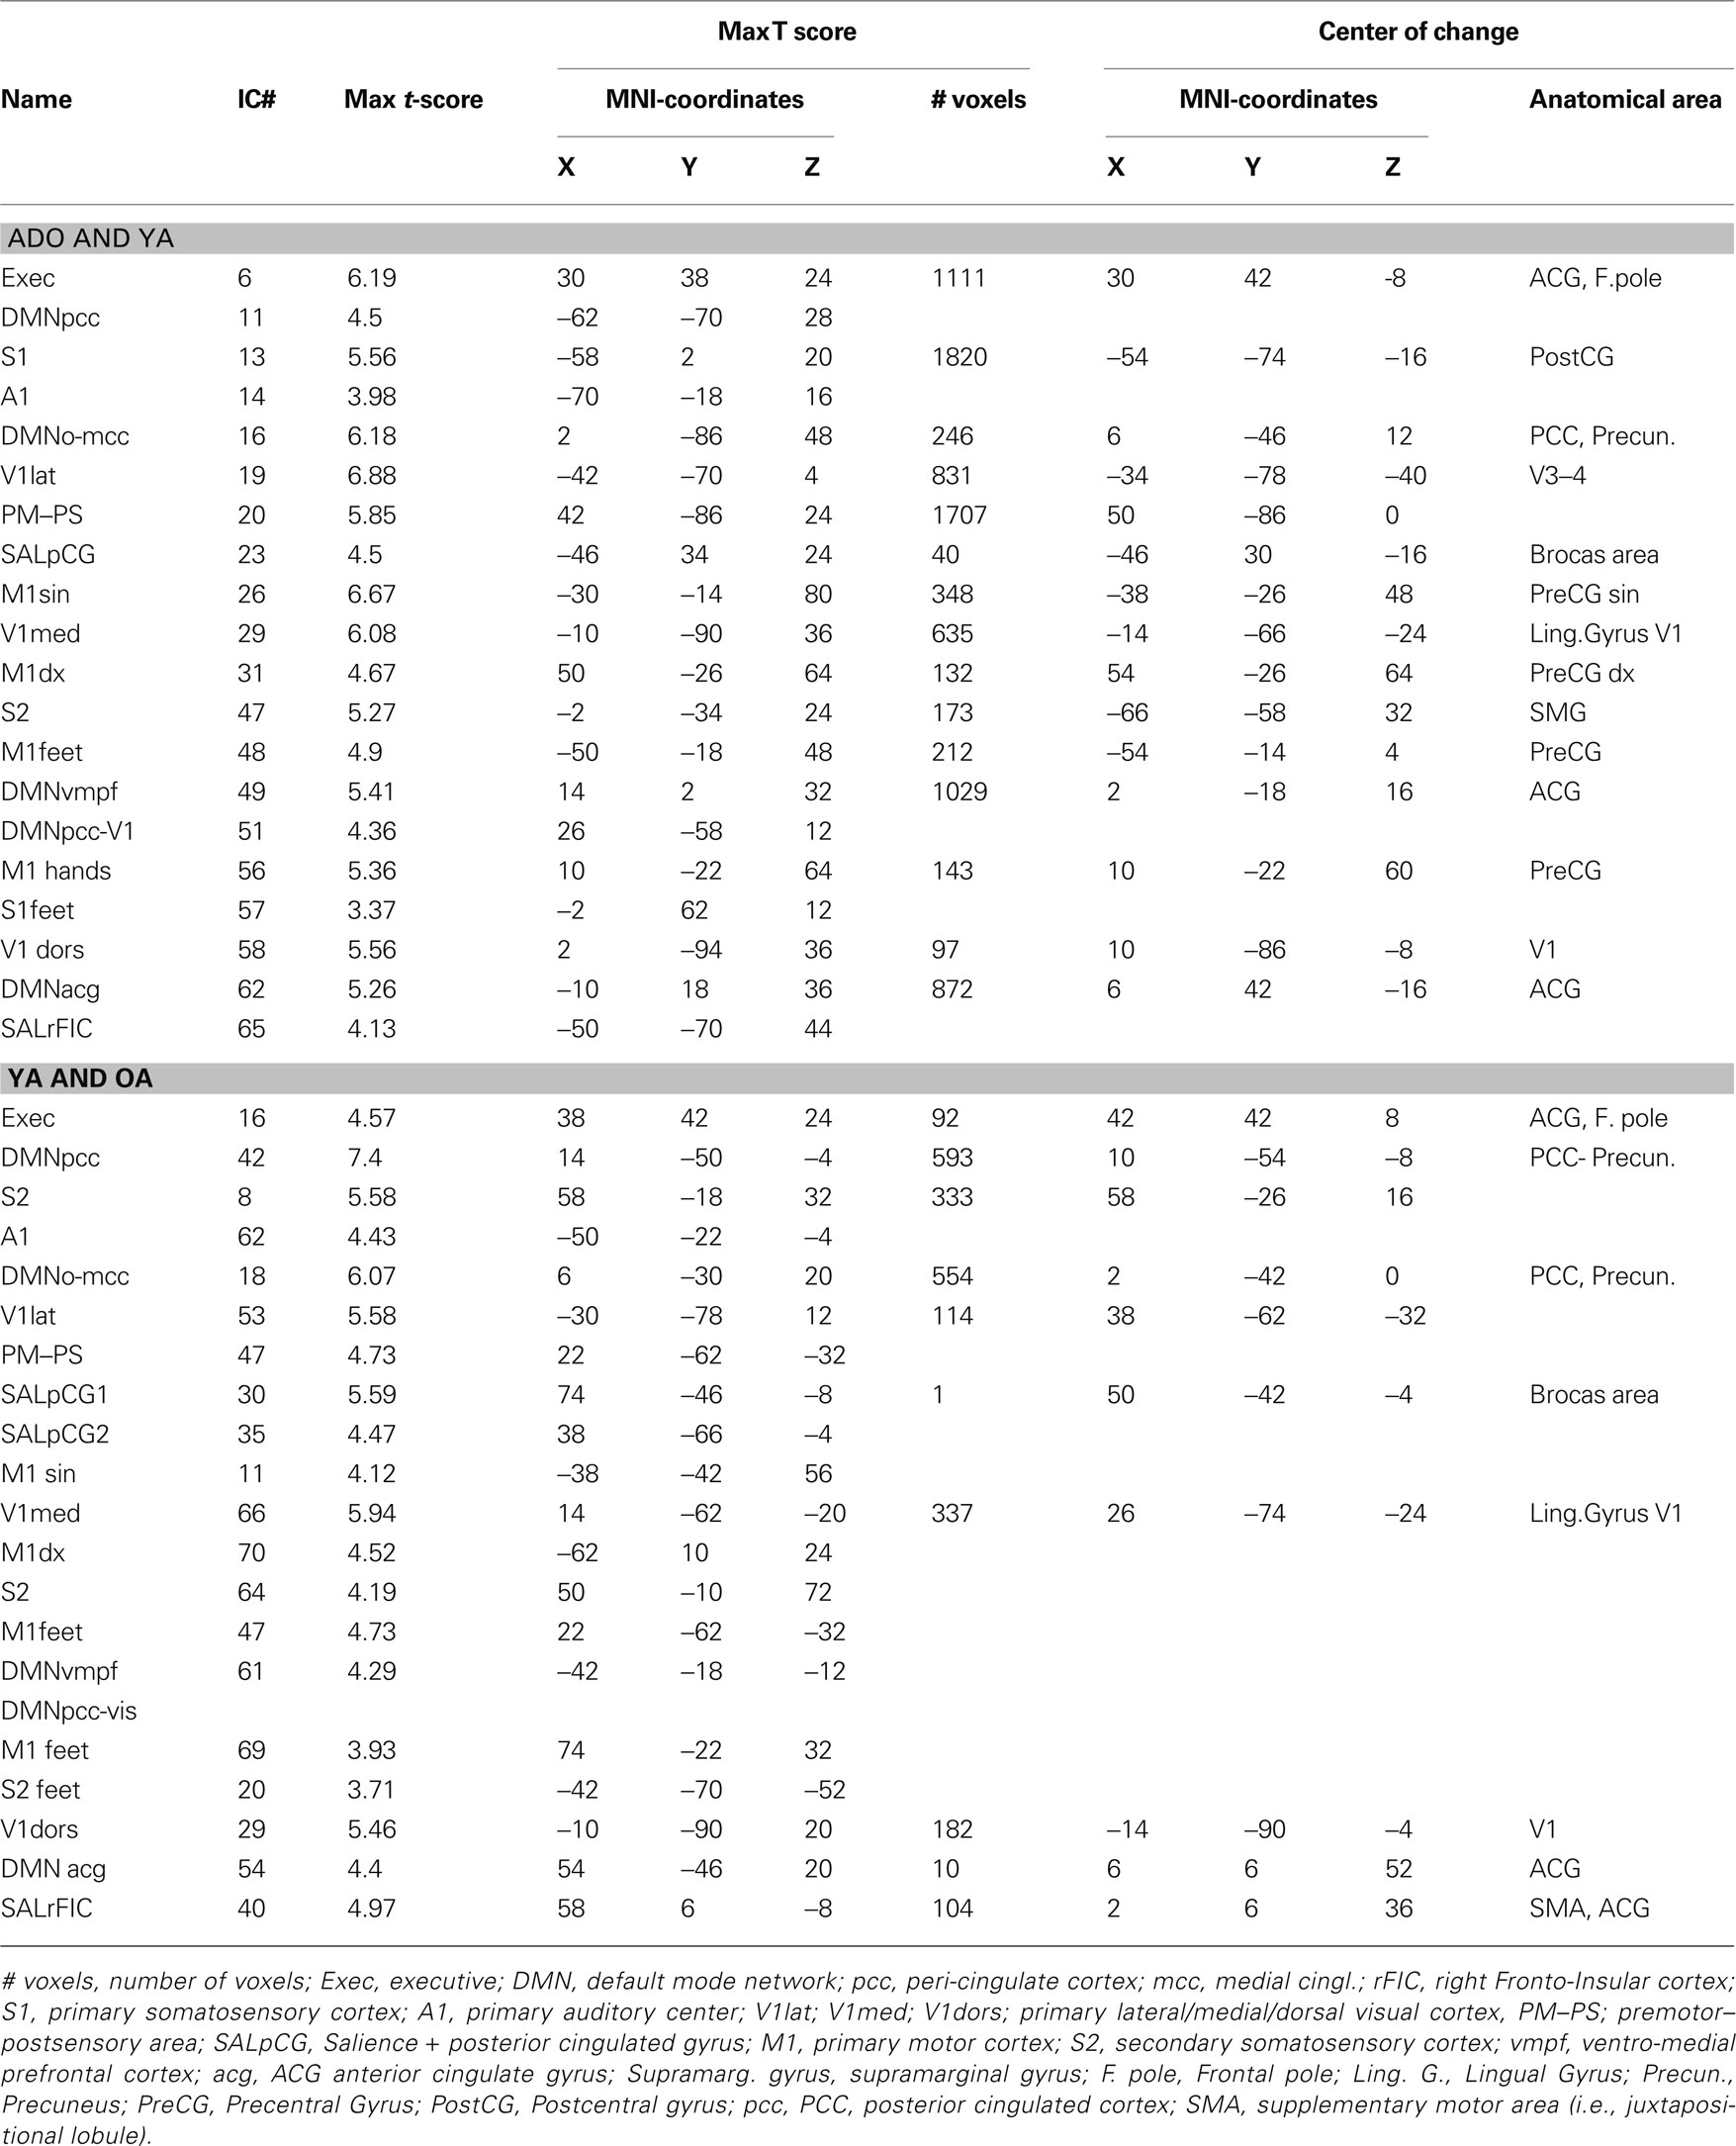
Table 1. RSN differences between the younger and the older ICA group runs.
Default Mode and Control Sources
In this study our high model order approach suggested that the posterior cingulate dominant (DMNpcc) default mode network node loses its connection to frontal areas, and, its angular gyri parts become more condensed from adolescence to adulthood. The occipito-medial cingulate (DMNo-mcc) node fuses in the upper posterior cingulate areas in the older adult group and demonstrates bilateral increase in connectivity to neighboring areas in the occipital cortex. Similar fusion can be depicted in the anterior-cingulate node of DMNacg where the activity nodes move toward the front and fuse near the anterior node in the OA group. This component is also shifting backwards and upwards in the most powerful node. Interestingly, the most ventro-medial node at the prefrontal areas (DMNvmpf) strengthens its connection to the posterior cingulated, condenses and shifts somewhat backwards in the most anterior parts. These changes can be best viewed from the Figure S1 in Supplementary material.
Importantly these age-related changes tend to be more marked in the default mode network sources between the two older cohorts and there are less differences between the younger cohorts. This shows that there are changes occurring between the second and fourth decades in life in these control networks. Figure 1 shows how the alterations in the DMN occur between the younger and the older cohorts and only frontal areas of the ACG undergo changes in the comparison of the younger cohorts. Similarly, executive and salience related networks also tend to be altering in later years, c.f. Figure 2, although the executive network also undergoes marked changes already in early adulthood.
Primary Sensory and Motor Networks
The primary sensory and motor networks shown in Figures 4 and 5 tend to be dominated by changes occurring in early rather than late adulthood. The primary motor sources of hands and feet (M1dx, M1sin, M1feet, respectively) and secondary somatosensory sources (S2) present changes in early adulthood and these networks do not seem to alter much later on. There were no significant alterations in the somatosensory area of the feet (Ssen Feet) and primary auditory network (A1) between any age group, suggesting earlier functional maturation of the sources. The only one of the peri-rolandic sources that alters strongly between all groups is the primary somatosensory source, S1, from the postcentral gyrus.
Occipital Visual Sources
The sources at or near the visual cortex seem to be dominated by alterations occurring between all groups. Midline visual (V1dors and V1med) sources and dorso-lateral (Vcran) RSN’s show differences between all the age groups. V1lat show changes dominantly only in the younger age groups, c.f. Figure 5.
Vanishing and Fusing RSN’s
Not all changes related to age are related to condensing and reduction in the component strength. DMN pcc has two separate sources in the younger cohorts that are not present in the OA cohort; one more caudal is related to visual areas and one more cranial is connected more to posterior cingulate areas, c.f. Figure S1 in Supplementary material. Both of these DMN sources have bilateral connections but in the visual cortex these are more medial and in the other more lateral and cranial. Similarly V5 and Vcran seen as separate in ADO and YA groups fuse into unified Vcran in OA groups as shown in Figure 7.
There is also a mixed salience-executive type frontal network that has a dominant source in the paracingulate areas (S-E pCG in Figure 1) in a unified component in the earlier age ranges (ADO and YA). Later in adulthood (OA group) there were no components with similar pCG area dominance. Instead the paracingulate areas were connected more to (at least) two separate sources as is depicted in Figure 2. A unique alteration is the almost complete vanishing of a pre-motor and post somatosensory (PM–PS) quadrate network from the adult group. The PM–PS was present in both ADO and YA groups as identical source (Figure S2 in Supplementary material).
Frequency Domain
The frequency power of the RSN sources reduces invariably as a function of age. This can be seen in Figures 3, 6 and 8, where the mean power spectra of the analyzed IC sources representing RSNs are plotted. The ADO group power spectrum is above the YA and OA groups’ mean power spectra almost in each source. In DMN sources, SalrFIC and Exec sources the power spectra of the younger groups (ADO and YA) is markedly similar with decrease in the lowest frequencies in the OA group, see also Figure 3.
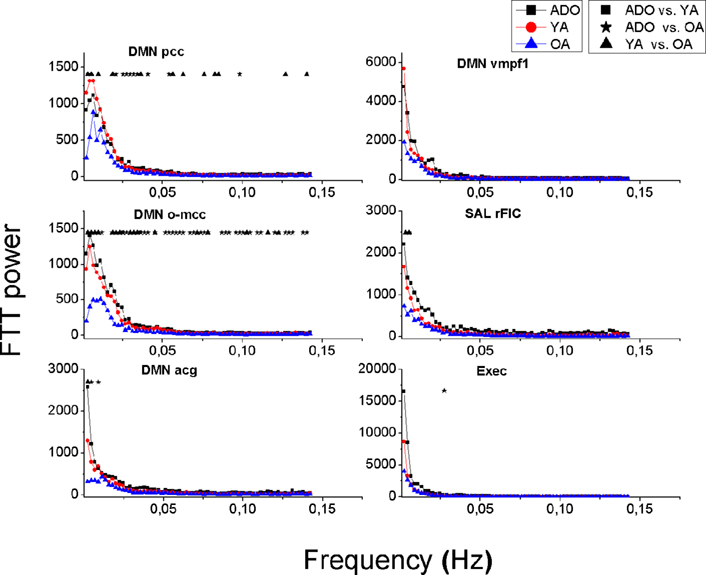
Figure 3. Mean power spectra of the DMN, salience and executive signal sources in each group. Older adults (OA, blue triangles) have less power in all their signal sources compared to younger adults (YA, red circle) and to adolescents (ADO, black box). Significant differences between the groups are marked with symbols ■★▲ above the spectra.
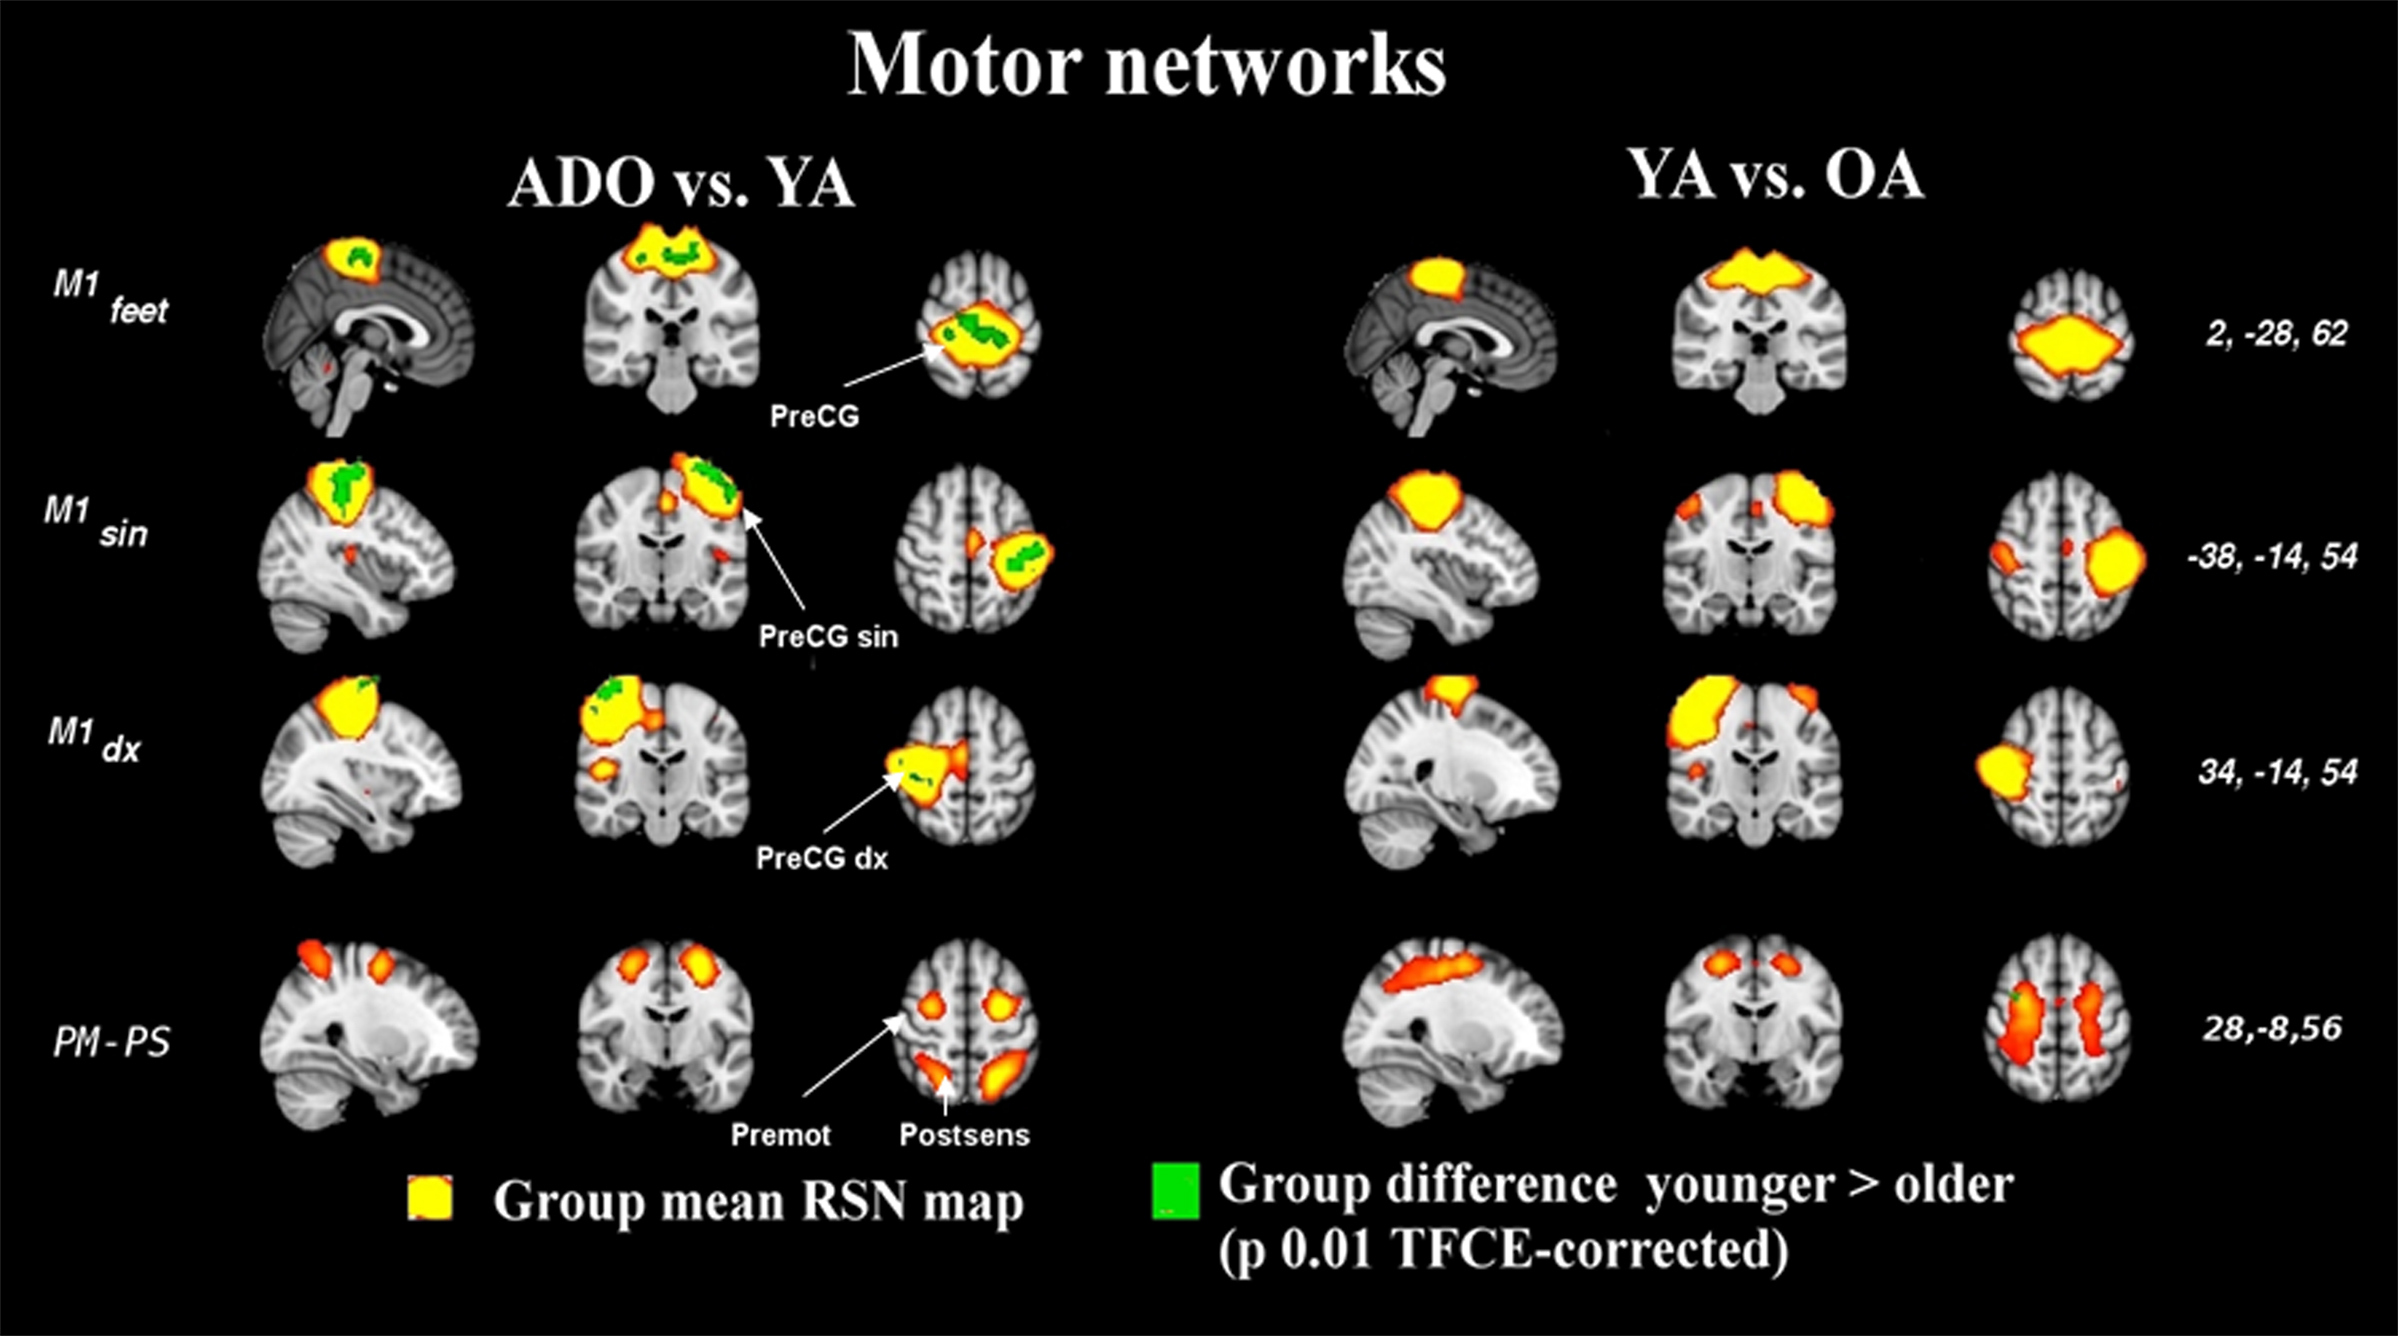
Figure 4. The image parameters and thresholding are the same as in Figure 1. Notably, the changes occur at a young age. The quadrate PM–PS RSN looses integrity in older adulthood altogether, c.f. Figure S2 in supplementary material. CG, central gyrus, premot, pre-motor cortex, post sens, dorsal to somatosensory cortex.
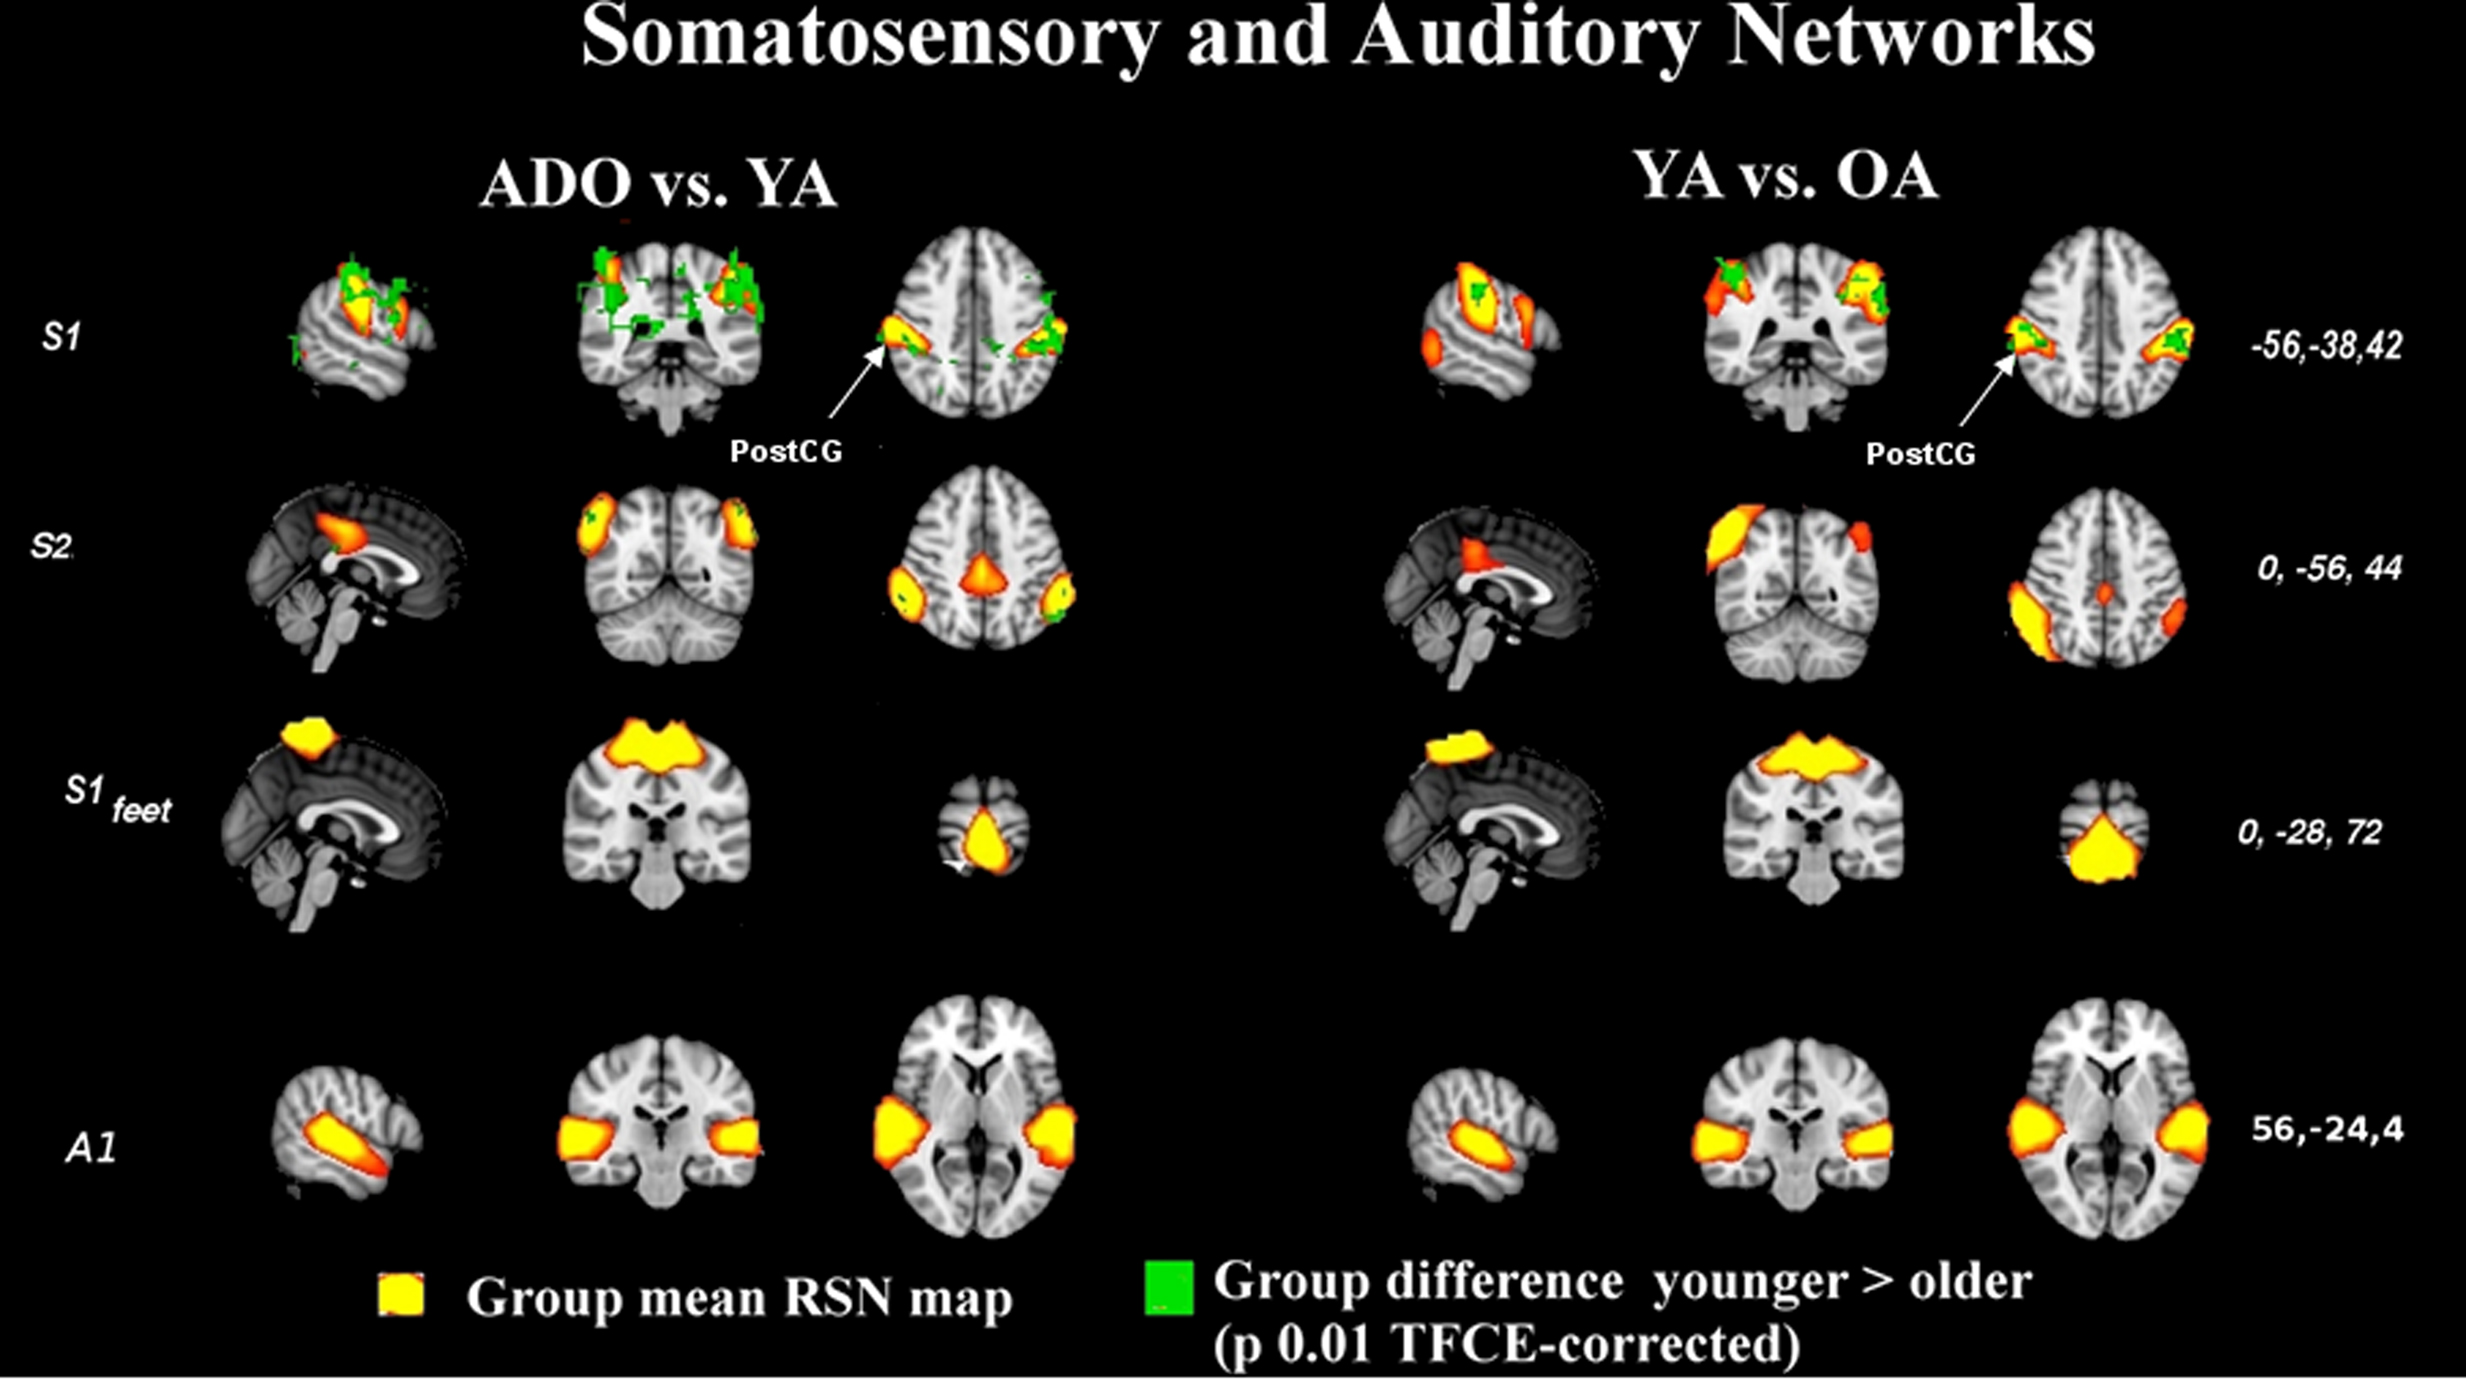
Figure 5. Auditory and somatosensory results shown in the manner as Figure 1. S1 alters through life but the rest of the sources do not alter significantly through time. CG, central gyrus.
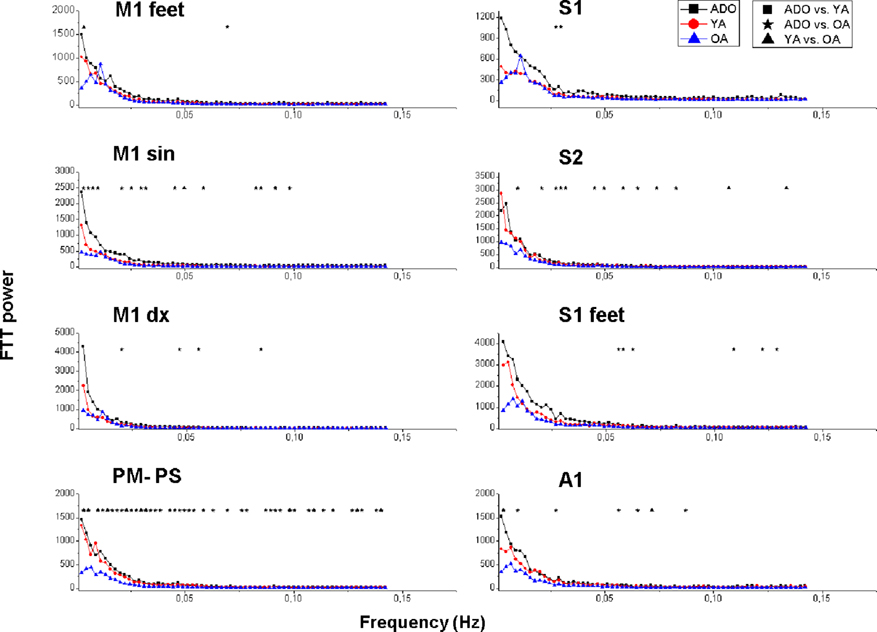
Figure 6. Mean power spectra of in peri-rolandic signal sources presented in a similar way as the power spectral results in Figure 3. The signal sources are visualized in Figures 4 and 5.
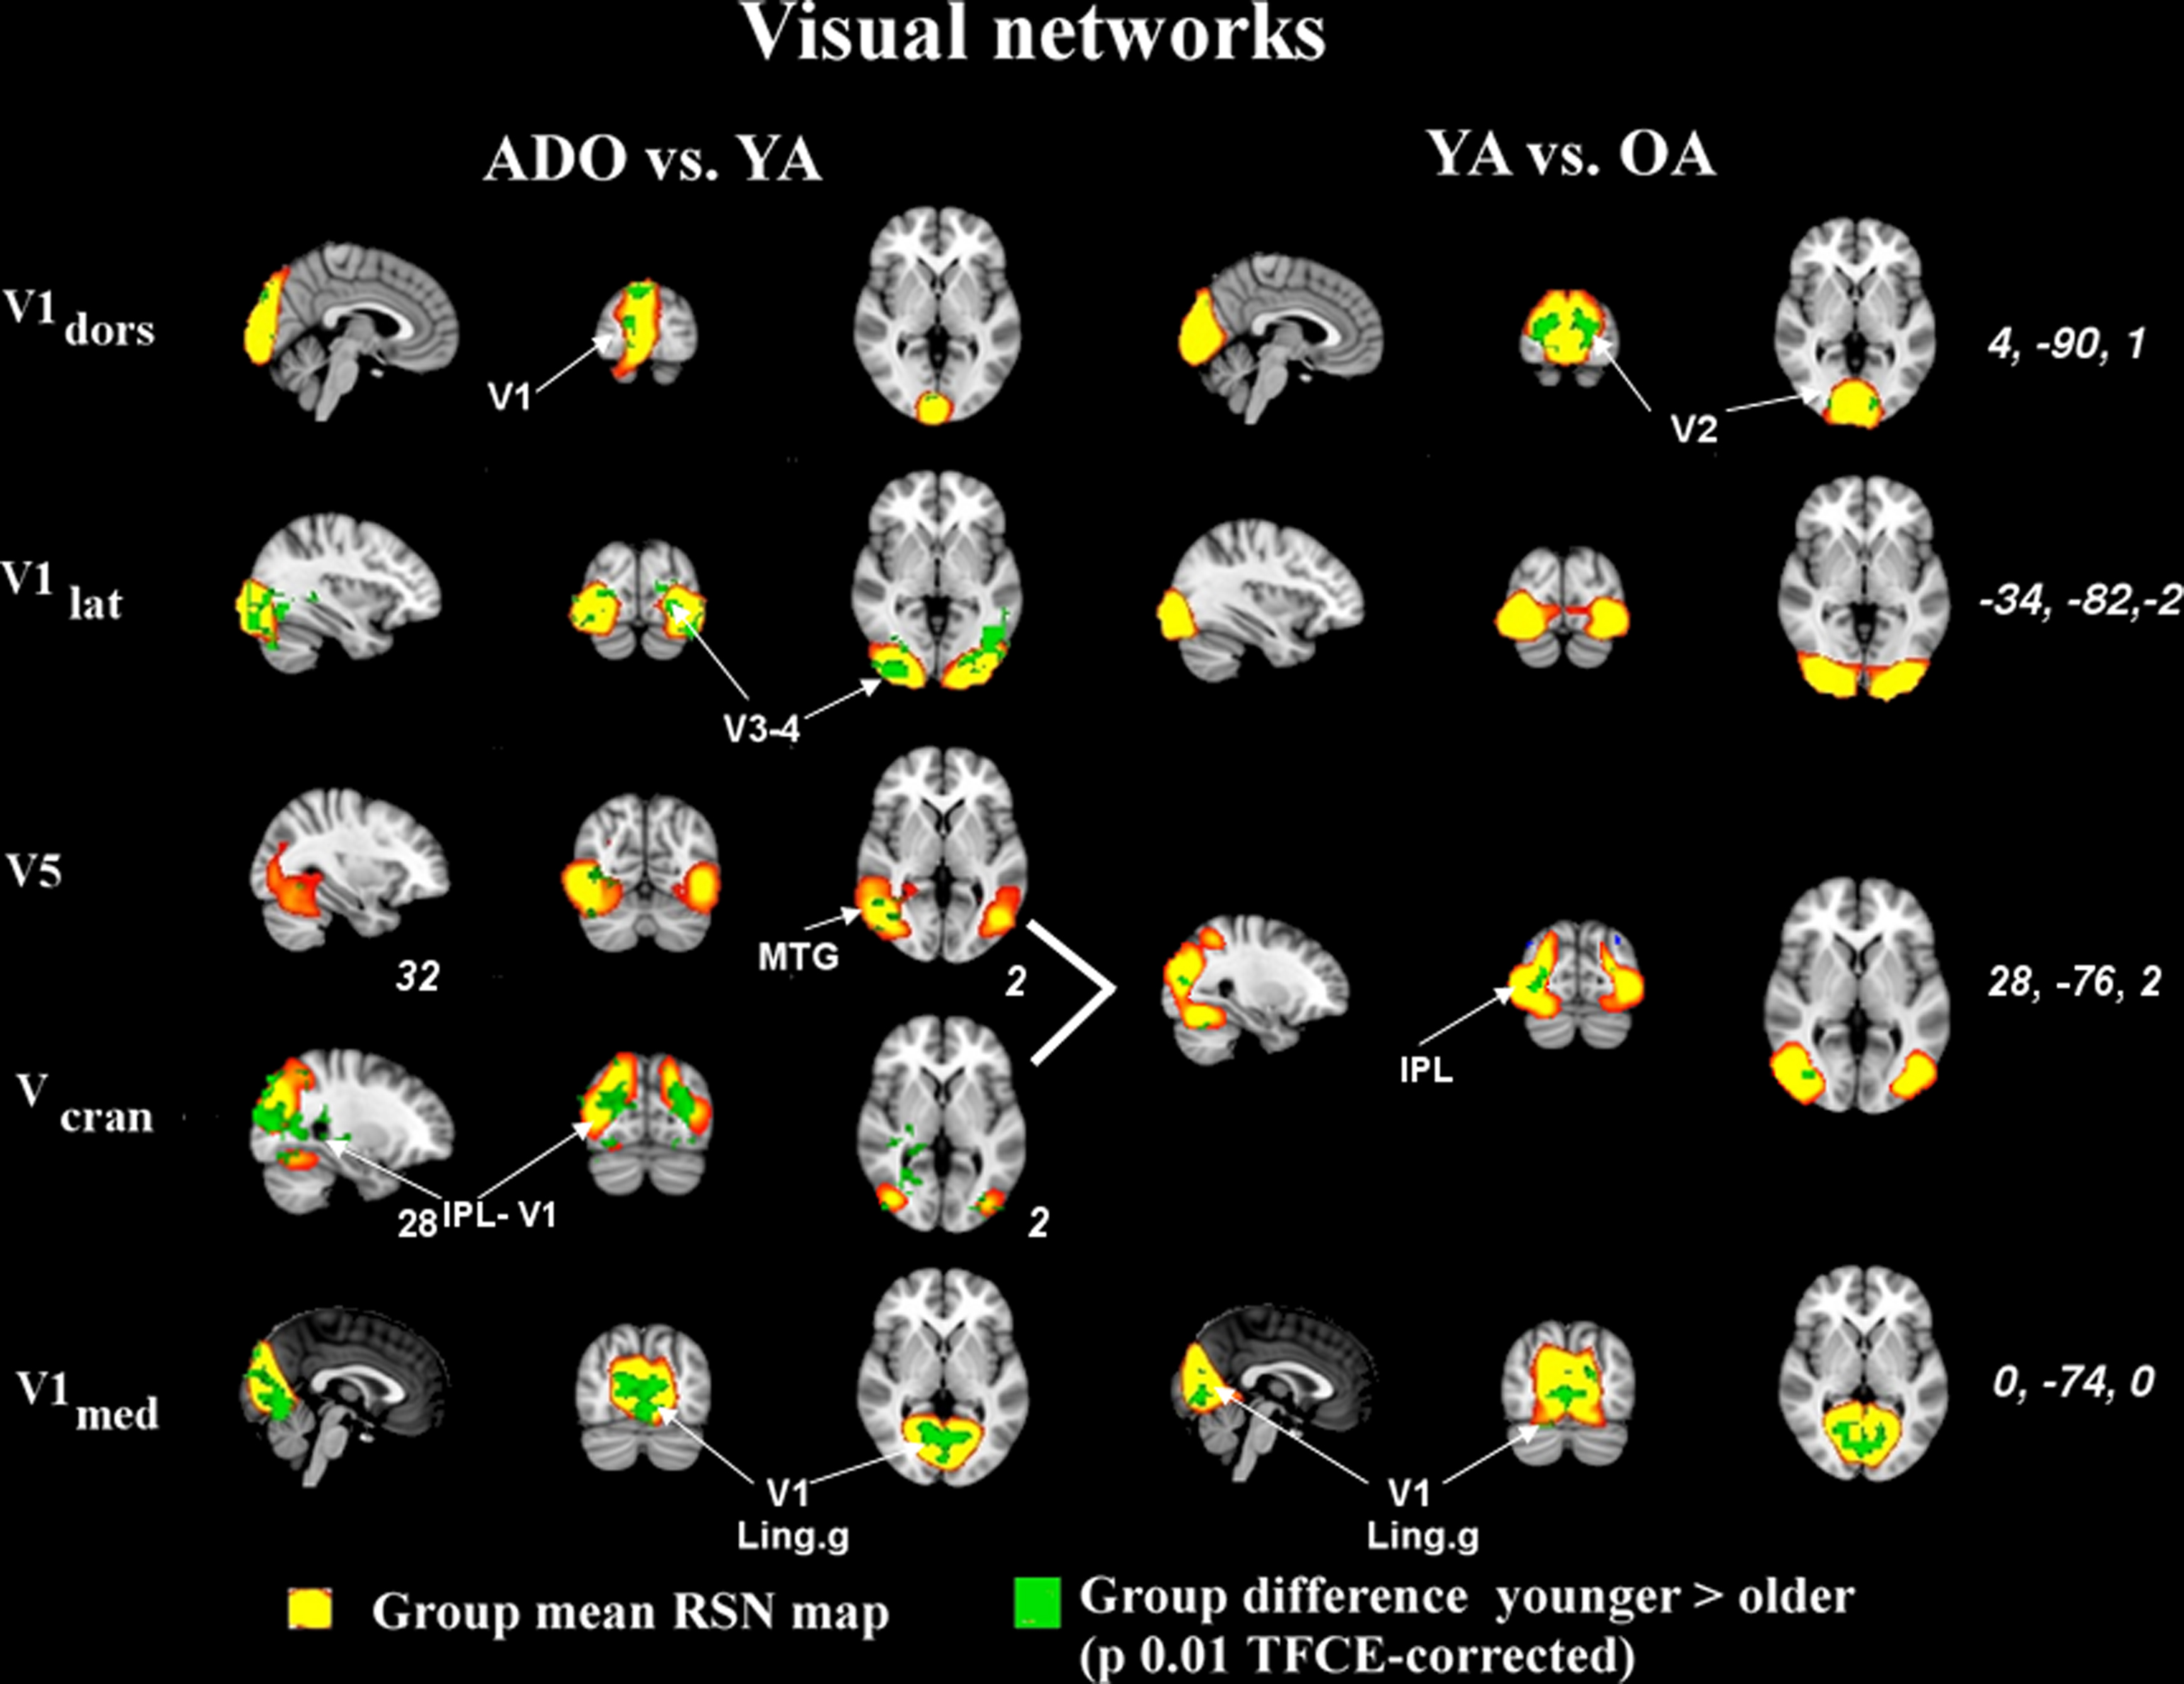
Figure 7. Age-related alterations in visual networks shown with identical thresholding as in the previous images. The younger age groups have more power in their signal sources in general. The difference is smaller between the two older age groups. V5 and Vcran fuse in the older age group into a single large source. IPL, inferior parietal lobule; MTG, medial temporal gyrus; Ling g, lingual gyrus; V1, primary; V2, secondary; V3, tertiary, and, V4, quadrature visual cortex, respectively.
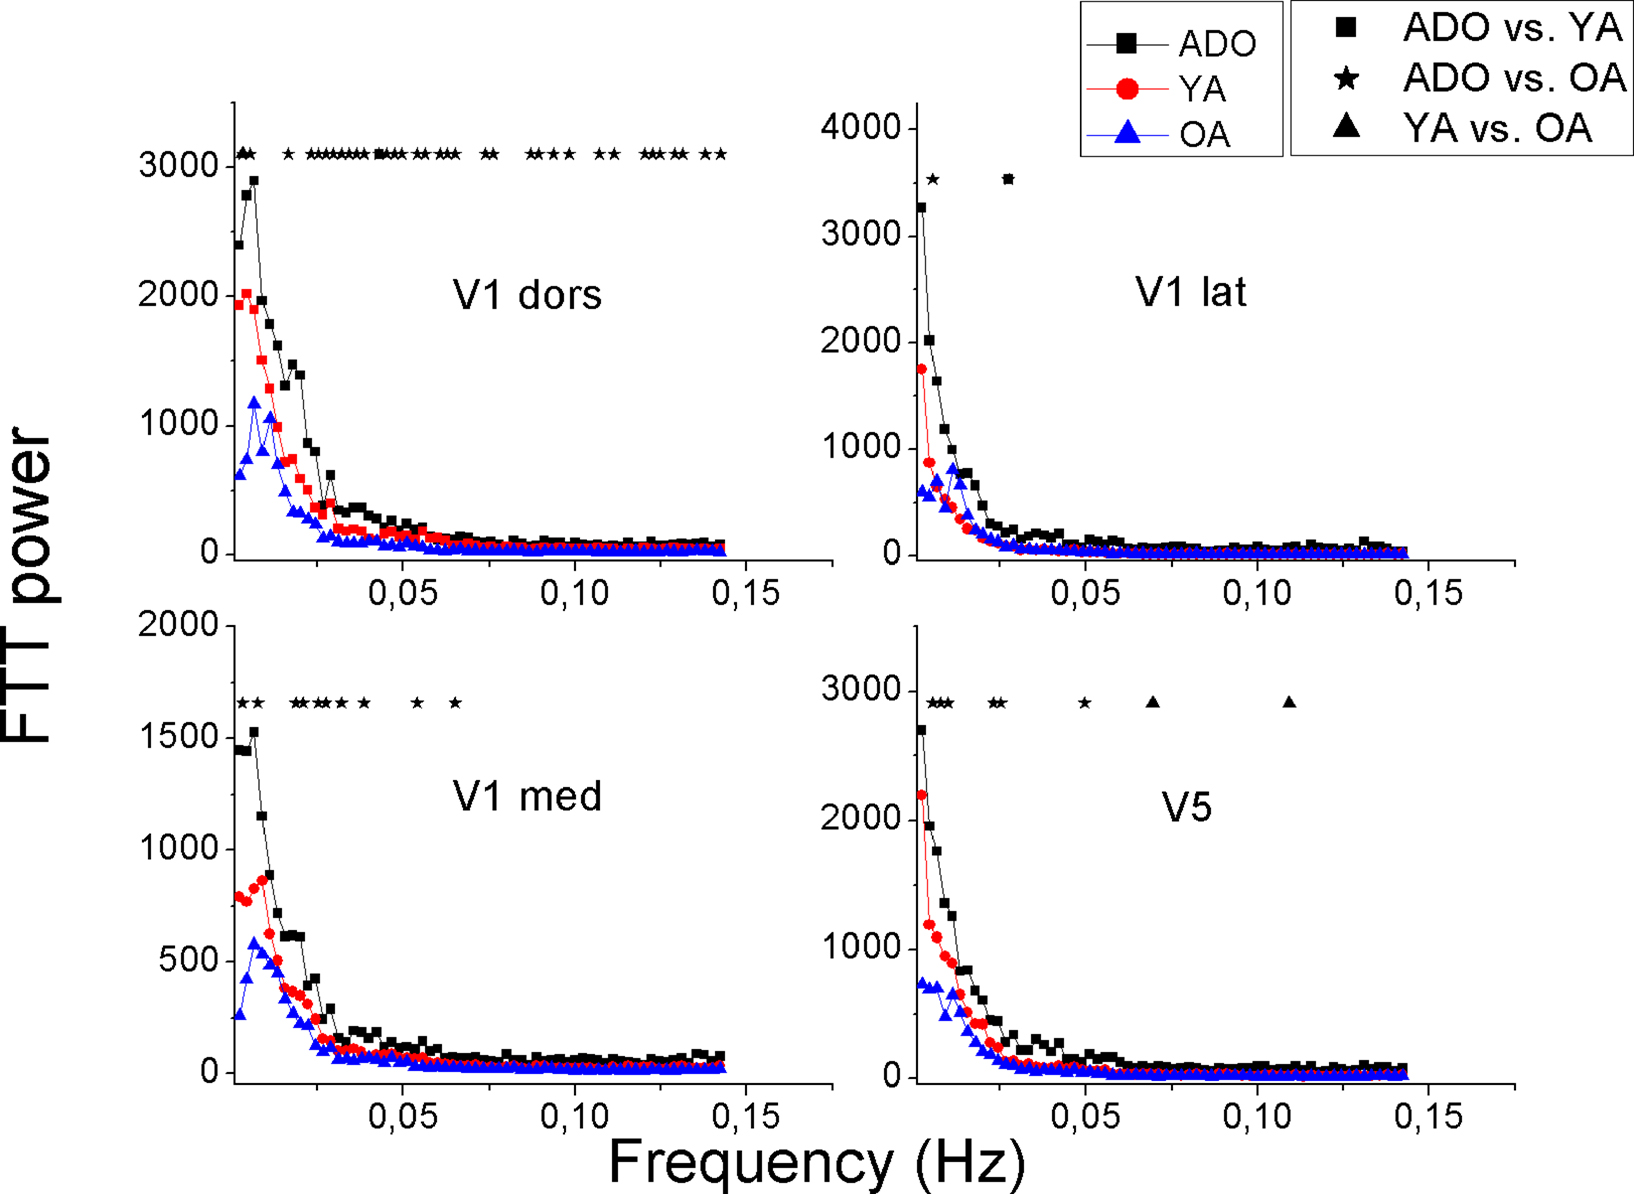
Figure 8. Mean power spectra of Visual signal sources with identical illustration of groups and significant changes as in Figures 3 and 6. The signal sources are shown in Figure 7.
The power of the primary motor cortex of the right hand (M1 sin) shows the most clear alterations in power with significant changes over a wide range of frequencies. The left hand motor source M1dx has a similar pattern but the differences are less marked between the sources. There are some interesting exceptions in the Peri-Rolandic sources that can be depicted. The PM–PS and secondary somatosensory cortex source S2 have in common a nearly identical power spectra in both the ADO and YA groups high above the AO group spectrum with a very significant difference, c.f. Figure 6. The feet motor source M1 on the other hand has almost no difference in the power spectra between any of the groups. The primary somatosensory cortex source S1’s power in the ADO group seems to be higher but the adult groups have a relatively high power around 0.01 Hz, with a peak in the OA group. In the occipital visual sources a pattern of group differences prevail; the OA group power is below the ADO and the YA group power in each of the selected sources.
Notably the power decrease in the lowest frequencies also alters the shape of the spectrum as a function of the age; increasing age reduces the steepness of the power spectrum. A third aspect related to age is peaks in the power spectra; the OA group has more peaks in the spectrum in 16 spectra, YA in 9 and 7 peaks are in the ADO group. In other words the reducing power seems to reveal peaks from underneath the 1/f curve. In the control networks (DMNpcc,o-mcc,acg) there are spectral peaks with dominating frequencies in occipital sources and the more frontal sources (Sal, Exec, DMNvmpf) there are no clear peaks but rather the spectra have more of a 1/f outline. Also the more medial visual (V1med,dors), auditory and somatosensory sources are more dominated by peaked sources with characteristic frequencies. Motor (M1dx,sin) and lateral visual (V1lat, V5) have more of a 1/f power spectral outline.
Discussion
Our study shows two general changes in resting state sources related to age with dual-regression analysis of high model order group PICA sources. First of all, spatially the sources consolidate and reduce in size with increasing age. This is perfectly in line with the observation by a previous finding by Fair et al. (2007), who detected reduced localized connectivity patterns as a sign of local segregation of brain processes. Developmental changes in whole brain functional connectivity have also been studied by Supekar et al. (2009). Children (ages 7–9 years) and young adults (ages 19–22 years) were scanned and rsfMRI-data was analyzed by using a graphic theoretical approach. Children and young adults’ brain had similar organization at the global level, but there were several differences in connectivity. It was shown that the dynamic process of over-connectivity followed by pruning, which rewires connectivity at the neuronal level, also operates at the systems level.
Secondly, the power of the low frequency fluctuations in the independent source time courses also reduces with increasing age. The findings are in line with some of the age-related findings of fractional amplitude of low frequency fluctuations (fALFF) over a group of 1000 subjects, where low model order PICA, seed voxel connectivity and the amplitude of BOLD signal power were analyzed (Biswal et al., 2010). However, the higher model order analysis used in this study offers a more in depth analysis of some of the sources due to increased sensitivity to detect subtle sub-network sources undetected in lower model orders (Kiviniemi et al., 2009; Abou-Elseoud et al., 2010). In addition, the subject data pool in this study is ethnically more homogenous and the same 1.5 T GE HDx scanner has been used to image the data.
Although these changes are quite general, also some specific alterations exist. Notably the control networks such as default mode, salience, and executive RSN undergo changes still between 22 to 44 years of age, which is not so clearly the case in sensori-motor and visual sources, where the differences between the groups are predominantly between the younger age groups ADO vs. YA. Also previously unpresented shifting can be depicted in DMN-variant (DMNo-mcc and DMNaCG) sources that are connected to medial parts of the cingulate gyrus. There are interesting vanishing sources that seem to disappear from the OA group (PM–PS, DMNpcc-caudal). A salience-executive network type source SalpCG is split into several sources, none of which can be identified with a strong source in the paracingulate area. In the ADO and YA groups this map is clearly evident, c.f. Figure S1 in Supplementary material. Although the cause of the vanishing sources is unclear it may be related to reduced motion of the adult subjects compared to younger ones or simply to age-related degeneration.
Age also alters the spontaneous fluctuation of the networks. The reduced frequency seems to reveal characteristic low frequency power peaks that are not so evident in the younger age groups. Children have higher cerebral blood flow and metabolism than adults (Chugani and Phelps, 1991). The high flow is accompanied by a vasodilatation and relatively large blood vessels. It is a known fact that when blood pressure and volume are decreased the fluctuation amplitude increases and frequency reduces ( Jones et al., 1995; Hudetz et al., 1998; Kannurpatti et al., 2008). Since the flow reduces as a function of age then the BOLD fluctuation amplitude should increase and not vice versa as they do. Therefore it is probable that the origin of the decrease of BOLD fluctuations with increasing age is related to non-vascular factors, such as neuronal firing or metabolism (Yang et al., 2007; Kiviniemi, 2008; Wu et al., 2009; Zou et al., 2009).
A study of age-related effects on causality between ICA sources revealed a reduction in causal density by ages between 12 and 30 years (Stevens et al., 2009). Our results agree with these results since the power of the low frequency fluctuation also reduces as a function of age. Previously we have shown that low power on BOLD fluctuations was related to low connectivity, and increasing of the BOLD fluctuation also led to increased connectivity (Kiviniemi et al., 2005). Although speculative, but still causality reductions may also reflect reduction in amplitude of BOLD signal fluctuation (Stevens et al., 2009; Biswal et al., 2010).
We found alterations in DMN from childhood to older adulthood. There are more differences between young adults and older adults than between adolescents and young adults. Adult type DMN has not been detected in sleeping preterm and term infants (Fransson et al., 2007, 2009). It has been observed that neonates have a rather primitive, incomplete default network consisting of six brain regions (Gao et al., 2009). But it has to be mentioned that sleep, in which the young children have to be imaged, there is also reduced DMN activity (Horowitz et al., 2009). It is also found that the default network at 1 year old became more complex and then its changes from 1 to 2 years were more subtle (Gao et al., 2009). In 7–9 year-old children the DMN has been found to be sparsely connected compared to adults (Fair et al., 2008). In our results this connection between occipital and frontal parts of the DMNpcc does still reduce as a function of age. However, the frontal variant DMNvmpf actually does the reverse as a function of age; the connectivity node in the posterior cingulate cortex becomes more strongly connected to the source with increasing age.
Gender differences play a role in the activity of the networks (Biswal et al., 2010). We have not regressed the data with gender or handedness and this remains to be investigated in another study. We chose not to use physiological correction or global mean signal regression methods to improve BOLD data quality. We have done analyses showing that physiological corrections do not improve the ICA results significantly at least at 1.5 T (Starck et al., 2010). Also some of the regression corrections may alter the data and shift the data distributions, which is the domain that ICA uses to define independence.
In conclusion, age-related alterations in human brain cortex networks are mostly reductions in the spatial extent and consolidation of network hubs. Some of the networks alter so much that they cannot be identified in the oldest 44 years age group. Primary sensory and motor networks change more in adolescence while higher control networks like default mode, salience and executive networks show alterations between 20 and 40 s. The spectral power of the low frequency fluctuations of the networks also reduces as a function of age in all networks, with each having a unique change through the years. These changes can be interpreted as a sign of normal pruning via focusing of activity to less distributed local hubs. However, it remains to be seen how much these changes are in fact age-related decline in brain functionality.
Conflict of Interest Statement
The authors declare that the research was conducted in the absence of any commercial or financial relationships that could be construed as a potential conflict of interest.
Acknowledgments
Nick Hayward MA, MSc is cordially acknowledged for excellent editorial assistance with language. Academy of Finland grants # 117111,123772, 124257, 212181, 214273; Finnish Medical Foundation, and Finnish Neurological Association grants were used in the production of this research in Department of Radiology. Arvo and Lea Ylppö Foundation, the Alma and K.A. Snellman Foundation, the Foundation for Paediatric Research, the Maire Taponen Foundation, and Special State Grants for Health Research in the Department of Paediatrics and Adolescence, Oulu University Hospital, Finland were supporting pediatric neurology department with grants. Emil Aaltonen Foundation, Sigrid Juselius Foundation, Thule Institute at the University of Oulu, Northern Ostrobothnia Hospital District, Alma, and KA Snellmann Foundation, Oulu, Finland grants were also supporting the study for pediatric psychiatry. Academy of Finland, Sigrid Juselius Foundation, Stanley Medical Research Institute, NARSAD was supporting Department of Psychiatry.
Supplementary Material
The Supplementary Material for this article can be found online at http://www.frontiersin.org/neuroscience/systemsneuroscience/paper/10.3389/fnsys.2010.00032/
References
Abou-Elseoud, A., Starck, T., Remes, J., Nikkinen, J., Tervonen, O., and Kiviniemi, V. (2010). The effect of model order selection in group PICA. Hum. Brain Mapp. doi: 10.1002/hbm.20929
Beckmann, C. F., DeLuca, M., Devlin, J. T., and Smith, S. M. (2005). Investigations into resting-state connectivity using independent component analysis. Philos. Trans. R. Soc. Lond. B. Biol. Sci. 360, 1001–1013.
Beckmann, C. F., and Smith, S. M. (2004). Probabilistic independent component analysis for functional magnetic resonance imaging. IEEE Trans. Med. Imaging 23, 137–152.
Biswal, B. B., Mennes, M., Zuo, X. N., Gohel, S., Kelly, C., Smith, S. M., Beckmann, C. F., Adelstein, J. S., Buckner, R. L., Colcombe, S., Dogonowski, A. M., Ernst, M., Fair, D., Hampson, M., Hoptman, M. J., Hyde, J. S., Kiviniemi, V. J., Kötter, R., Li, S. J., Lin, C. P., Lowe, M. J., Mackay, C., Madden, D. J., Madsen, K. H., Margulies, D. S., Mayberg, H. S., McMahon, K., Monk, C. S., Mostofsky, S. H., Nagel, B. J., Pekar, J. J., Peltier, S. J., Petersen, S. E., Riedl, V., Rombouts, S. A., Rypma, B., Schlaggar, B. L., Schmidt, S., Seidler, R. D., Siegle, G. J., Sorg, C., Teng, G. J., Veijola, J., Villringer, A., Walter, M., Wang, L., Weng, X. C., Whitfield-Gabrieli, S., Williamson, P., Windischberger, C., Zang, Y. F., Zhang, H. Y., Castellanos, F. X., and Milham, M. P. (2010). Toward discovery science of human brain function. Proc. Natl. Acad. Sci. USA 107, 4734–4739.
Birn, R. M., Diamond, J. B., Smith, M. A., and Bandettini, P. A. (2006). Separating respiratory-variation-related fluctuations from neuronal-activity-related fluctuations in fMRI. Neuroimage 31, 1536–1548.
Biswal, B., Yetkin, F. Z., Haughton, V. M., and Hyde, J. S. (1995). Functional connectivity in the motor cortex of resting human brain using echo-planar MRI. Magn. Reson. Med. 34, 537–541.
Calhoun, V. D., Adali, T., McGinty, V. B., Pekar, J. J., Watson, T. D., and Pearlson, G. D. (2001). fMRI activation in a visual-perception task: network of areas detected using the general linear model and independent components analysis. Neuroimage 14, 1080–1088.
Chugani, H. T., and Phelps, M. E. (1991). Imaging human brain development with positron emission tomography. J. Nucl. Med. 32, 23–26.
Eichele, T., Debener, S., Calhoun, V. D., Specht, K., Engel, A. K., Hugdahl, K., von Cramon, D. Y., and Ullsperger, M. (2008). Prediction of human errors by maladaptive changes in event-related brain networks. Proc. Natl. Acad. Sci. U.S.A. 105, 6173–6178.
Fair, D. A., Cohen, A. L., Dosenbach, N. U., Church, J. A., Miezin, F. M., Barch, D. M., Raichle, M. E., Petersen, S. E., and Schlaggar, B. L. (2008). The maturing architecture of the brain’s default network. Proc. Natl. Acad. Sci. U.S.A. 105, 4028–4032.
Fair, D. A., Dosenbach, N. U., Church, J. A., Cohen, A. L., Brahmbhatt, S., Miezin, F. M., Barch, D. M., Raichle, M. E., Petersen, S. E., and Schlaggar, B. L. (2007). Development of distinct control networks through segregation and integration. Proc. Natl. Acad. Sci. U.S.A. 104, 13507–13512.
Filippini, N., MacIntosh, B. J., Hough, M. G., Goodwin, G. M., Frisoni, G. B., Smith, S. M., Matthews, P. M., Beckmann, C. F., and Mackay, C. E. (2009). Distinct patterns of brain activity in young carriers of the APOE-epsilon4 allele. Proc. Natl. Acad. Sci. U.S.A. 106, 7209–7214.
Fox, M. D., Snyder, A. Z., Vincent, J. L., and Raichle, M. E. (2007). Intrinsic fluctuations within cortical systems account for intertrial variability in human behavior. Neuron 56, 171–184.
Fransson, P. (2005). Spontaneous low-frequency BOLD signal fluctuations: an fMRI investigation of the resting-state default mode of brain function hypothesis. Hum. Brain Mapp. 26, 15–29.
Fransson, P., Skiold, B., Engstrom, M., Hallberg, B., Mosskin, M., Aden, U., Lagercrantz, H., and Blennow, M. (2009). Spontaneous brain activity in the newborn brain during natural sleep--an fMRI study in infants born at full term. Pediatr. Res. 66, 301–305.
Fransson, P., Skiold, B., Horsch, S., Nordell, A., Blennow, M., Lagercrantz, H., and Aden, U. (2007). Resting-state networks in the infant brain. Proc. Natl. Acad. Sci. U.S.A. 104, 15531–15536.
Gao, W., Zhu, H., Giovanello, K. S., Smith, J. K., Shen, D., Gilmore, J. H., and Lin, W. (2009). Evidence on the emergence of the brain’s default network from 2-week-old to 2-year-old healthy pediatric subjects. Proc. Natl. Acad. Sci. U.S.A 106, 6790–6795.
Horovitz, S. G., Braun, A. R., Carr, W. S., Picchioni, D., Balkin, T. J., Fukunaga, M., and Duyn, J. H. (2009). Decoupling of the brain’s default mode network during deep sleep. Proc. Natl. Acad. Sci. U.S.A. 106, 11376–11381.
Hudetz, A. G., Biswal, B. B., Shen, H., Lauer, K. K., and Kampine, J. P. (1998).Spontaneous fluctuations in cerebral oxygen supply. An introduction. Adv. Exp. Med. Biol. 454, 551–559.
Jenkinson, M., Bannister, P., Brady, M., and Smith, S. (2002). Improved optimization for the robust and accurate linear registration and motion correction of brain images. Neuroimage 17, 825–841.
Jones, S. C., Williams, J. L., Shea, M., Easley, K. A., and Wie, D. (1995). Cortical cerebral blood flow cycling: anesthesia and arterial blood pressure. Am. J. Physiol. 37, H569–H575.
Kannurpatti, S. S., Biswal, B. B., Kim, Y. R., and Rosen, B. R. (2008). Spatio-temporal characteristics of low-frequency BOLD signal fluctuations in isoflurane-anesthetized rat brain. Neuroimage 40, 1738–1747.
Kiviniemi, V. (2008). Endogenous brain fluctuations and diagnostic imaging. Hum. Brain Mapp. 29, 810–817.
Kiviniemi, V., Jauhiainen, J., Tervonen, O., Paakko, E., Oikarinen, J., Vainionpaa, V., Rantala, H., and Biswal, B. (2000). Slow vasomotor fluctuation in fMRI of anesthetized child brain. Magn. Reson. Med. 44, 373–378.
Kiviniemi, V., Kantola, J. H., Jauhiainen, J., Hyvarinen, A., and Tervonen, O. (2003). Independent component analysis of nondeterministic fMRI signal sources. Neuroimage 19, 253–260.
Kiviniemi, V., Remes, J., Starck, T., Nikkinen, J., Haapea, M., Silven, O., and Tervonen, O. (2009). Mapping transient hyperventilation induced alterations with estimates of the multi-scale dynamics of BOLD signal. Front. Neuroinformatics 3, 18. doi:10.3389/neuro.11.018.2009.
Kiviniemi, V., Ruohonen, J., and Tervonen, O. (2005). Separation of physiological very low frequency fluctuation from aliasing by switched sampling interval fMRI scans. Magn. Reson. Imaging 23, 41–46.
Li, Y. O., Adali, T., and Calhoun, V. D. (2007). Estimating the number of independent components for functional magnetic resonance imaging data. Hum. Brain Mapp. 28, 1251–1266.
Long, X. Y., Zuo, X. N., Kiviniemi, V., Yang, Y., Zou, Q. H., Zhu, C. Z., Jiang, T. Z., Yang, H., Gong, Q. Y., Wang, L., Li, K. C., Xie, S., and Zang, Y. F. (2008). Default mode network as revealed with multiple methods for resting-state functional MRI analysis. J. Neurosci. Methods 171, 349–355.
Ma, L., Wang, B., Chen, X., and Xiong, J. (2007). Detecting functional connectivity in the resting brain: a comparison between ICA and CCA. Magn. Reson. Imaging 25, 47–56.
Malinen, S., Hlushchuk, Y., and Hari, R. (2007). Towards natural stimulation in fMRI–issues of data analysis. Neuroimage 35, 131–139.
McKeown, M. J., Jung, T. P., Makeig, S., Brown, G., Kindermann, S. S., Lee, T. W., and Sejnowski, T. J. (1998). Spatially independent activity patterns in functional MRI data during the stroop color-naming task. Proc. Natl. Acad. Sci. U.S.A. 95, 803–810.
Smith, S. M., Fox, P. T., Miller, K. L., Glahn, D. C., Fox, P. M., Mackay, C. E., Filippini, N., Watkins, K. E., Toro, R., Laird, A. R., and Beckmann, C. F. (2009). Correspondence of the brain’s functional architecture during activation and rest. Proc. Natl. Acad. Sci. U.S.A 106, 13040–13045.
Starck, T., Remes, J., Nikkinen, J., Tervonen, O., and Kiviniemi, V. (2010). Correction of low-frequency physiological noise from the resting state BOLD fMRI – effect on ICA default mode analysis at 1.5 T. J. Neurosci. Methods 186, 179–185.
Stevens, M. C., Pearlson, G. D., and Calhoun, V. D. (2009). Changes in the interaction of resting-state neural networks from adolescence to adulthood. Hum. Brain Mapp. 30, 2356–2366.
Supekar, K., Musen, M., and Menon, V. (2009). Development of large-scale functional brain networks in children. PLoS Biol. 7, e1000157. doi:10.1371/journal.pbio.1000157.
Supekar, K., Uddin, L. Q., Prater, K., Amin, H., Greicius, M. D., and Menon, V. (2010). Development of functional and structural connectivity within the default mode network in young children 1. Neuroimage 52, 290–301.
van de Ven, V. G., Formisano, E., Prvulovic, D., Roeder, C. H., and Linden, D. E. (2004). Functional connectivity as revealed by spatial independent component analysis of fMRI measurements during rest. Hum. Brain Mapp. 22, 165–178.
Vincent, J. L., Patel, G. H., Fox, M. D., Snyder, A. Z., Baker, J. T., Van, E., Zempel, J. M., Snyder, L. H., Corbetta, M., and Raichle, M. E. (2007). Intrinsic functional architecture in the anaesthetized monkey brain. Nature 447, 83–86.
Wu, C. W., Gu, H., Lu, H., Stein, E. A., Chen, J. H., and Yang, Y. (2009). Mapping functional connectivity based on synchronized CMRO2 fluctuations during the resting state. Neuroimage 45, 694–701.
Yang, H., Long, X. Y., Yang, Y., Yan, H., Zhu, C. Z., Zhou, X. P., Zang, Y. F., and Gong, Q. Y. (2007). Amplitude of low frequency fluctuation within visual areas revealed by resting-state functional MRI. Neuroimage 36, 144–152.
Keywords: functional magnetic resonance imaging, blood oxygen dependent, independent component analysis, resting state, age, networks, hub
Citation: Littow H, Abou Elseoud A, Haapea M, Isohanni M, Moilanen I ,Mankinen K, Nikkinen J, Rahko J, Rantala H, Remes J, Starck T, Tervonen O, Veijola J, Beckmann C and Kiviniemi VJ (2010) Age-related differences in functional nodes of the brain cortex - a high model order group ICA study. Front. Syst. Neurosci. 4:32. doi: 10.3389/fnsys.2010.00032
Received: 05 February 2010;
Paper pending published: 16 April 2010;
Accepted: 18 June 2010;
Published online: 26 August 2010.
Edited by:
Lucina Q. Uddin, Stanford University, USAReviewed by:
Habib Benali, Laboratoire d’Imagerie Fonctionnelle, FranceLucina Q. Uddin, Stanford University, USA
Copyright: © 2010 Littow, Abou Elseoud, Haapea, Isohanni, Moilanen, Mankinen, Nikkinen, Rahko, Rantala, Remes, Starck, Tervonen, Veijola, Beckmann and Kiviniemi. This is an open-access article subject to an exclusive license agreement between the authors and the Frontiers Research Foundation, which permits unrestricted use, distribution, and reproduction in any medium, provided the original authors and source are credited.
*Correspondence: Vesa J. Kiviniemi, Department of Diagnostic Radiology, Oulu University Hospital, P.O. Box 50, 90029 OYS, Oulu, Finland. e-mail: vesa.kiviniemi@oulu.fi