 Dawei Liu1
 Hans J. Johnson
 Jeffrey D. Long
 Vincent A. Magnotta
 Jane S. Paulsen
- 1Department of Psychiatry, Carver College of Medicine, University of Iowa, Iowa City, IA, USA
- 2Department of Electrical and Computer Engineering, College of Engineering, University of Iowa, Iowa City, IA, USA
- 3Department of Biomedical Engineering, College of Engineering, University of Iowa, Iowa City, IA, USA
- 4Department of Biostatistics, College of Public Health, University of Iowa, Iowa City, IA, USA
- 5Department of Radiology, Carver College of Medicine, University of Iowa, Iowa City, IA, USA
- 6Department of Neurology, Carver College of Medicine, University of Iowa, Iowa City, IA, USA
- 7Department of Psychology, University of Iowa, Iowa City, IA, USA
In volumetric brain imaging analysis, volumes of brain structures are typically assumed to be proportional or linearly related to intracranial volume (ICV). However, evidence abounds that many brain structures have power law relationships with ICV. To take this relationship into account in volumetric imaging analysis, we propose a power law based method—the power-proportion method—for ICV correction. The performance of the new method is demonstrated using data from the PREDICT-HD study.
Introduction
In magnetic resonance imaging (MRI) studies of the human brain, volumetric analysis of anatomical brain regions plays an important role in studying disease states. Regional volumetric changes are linked to various brain diseases. For example, reduced basal ganglia volume is a hallmark of Huntington disease (Aylward et al., 1997, 2012). Reduced hippocampal volume has been shown to be predictive of memory loss (Ystad et al., 2009). Atrophy of the frontal and temporal lobes are associated with frontotemporal dementia (Hodges et al., 1999; Marra et al., 2007); and patients with autism tend to have an enlarged amygdala (Schumann et al., 2009). An accurate evaluation of the volumetric difference in brain regions between groups of individuals is not only a critical step toward a better understanding of brain related disorders, but also vital for the discovery of neuroimaging biomarkers for these disorders.
It is a challenging task to precisely quantify the volumetric differences in a brain region of interest between individuals. The major difficulty lies in the fact that individuals vary in overall head size, which naturally leads to variations in the regional volume of interest (VOI). Therefore, when comparing a VOI between groups of people, it is crucial that the confounding effect of head size be controlled. In brain imaging, intracranial volume (ICV) is a popular measure of head size, thus the control of the confounding effect of head size is often carried out through ICV correction.
There are a couple of widely used methods for ICV correction in neuroimaging research. One popular practice is to divide a raw VOI by ICV and use the VOI-to-ICV ratio in statistical analysis (Hubbard and Anderson, 1981; Mathalon et al., 1993; Sanfilipo et al., 2004; Kruggel, 2006; O'Brien et al., 2011). The method is called the “proportion method.” The implicit assumption underlying this method is that a VOI is proportional to ICV. Another popular method is the analysis of covariance (ANCOVA) method (Andreasen et al., 1986; Mathalon et al., 1993; Sanfilipo et al., 2004; O'Brien et al., 2011), in which ICV is included as a covariate in a regression model whose dependent variable is a VOI. It has been shown to perform better than the proportion method (Sanfilipo et al., 2004; O'Brien et al., 2011). The ANCOVA method relaxes the proportionality assumption on the relationship between a VOI and ICV, but assumes that VOI is linearly related to ICV.
However, evidence abounds that most brain structures relationships to ICV are neither proportional nor linear. Studies have shown that the relationships between many VOIs and ICV follow the power law principle (Zhang and Sejnowski, 2000; Lüders et al., 2002; Im et al., 2008; Barnes et al., 2010), that is, a VOI is related to ICV through the relationship VOI = α * ICVβ. For example, in the study of Im et al. (2008), the authors investigated the relationships between ICV and lobar cortical volume based on a sample of 148 normal individuals and found the relationships follow power law, and the scaling exponents for four lobes are between 0.836 and 0.901. In an article by Barnes et al. (2010), they studied a number of brain VOIs, including gray and white matter, lateral ventricles and some subcortical structures, and concluded that all the VOIs, except for the lateral ventricles, were related to ICV according to the power law, with the scaling exponent less than one. From a different perspective, Zhang and Sejnowski (2000) reported the relationships between gray and white matter volumes in 59 species follow the power law. Lüders et al. (2002) also illustrated the power law phenomenon between brain size and gray matter volume. These studies suggested that the power law may be a fundamental principle governing many biological processes.
With more and more evidence showing that the power law principle is behind the relationships between brain VOIs and ICV, an effective ICV correction method should utilize the power law relationship. In this paper, we propose a power law based ICV correction method—the “power-proportion method.”
Materials and Methods
Ethics Statement
The research protocol was approved by the University of Iowa Institutional Review Board, and all participants gave written informed consent and were treated in accordance with the principles expressed in the Declaration of Helsinki.
Participants
PREDICT-HD is a multi-site longitudinal observational study of individuals who were known to have the genetic risk for Huntington diseased (HD) (Paulsen et al., 2006, 2008). There are both healthy controls and at-risk participants in PREDICT-HD, but only healthy controls were included in the analysis. To eliminate the nuisance effects of different scanner manufacturers and field strengths, only participants who were scanned on the 1.5T GE Signa MR scanner were included. All data came from the baseline visit.
There were 141 eligible participants in our study sample, with 92 of them being female. Descriptive statistics for the sample are summarized in Table 1. The males were on average 2.1 years younger than the females, but the difference was not statistically significant. There was a significant difference in ICV between males and females, with males being on average 198.12 cc larger than females.
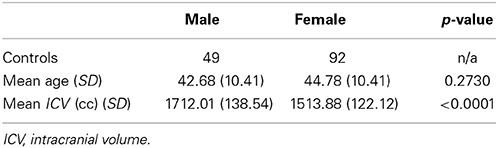
Table 1. Demographic information of the sample.
MRI Acquisition
All MRI images were obtained on a 1.5T GE Signa MR scanner. Three different sequences were acquired for each participant: T1- and T2-weighted images as well as proton-density (PD) weighted images. The T1-weighted images were collected using an axial 3D volumetric spoiled-gradient echo sequence, with a flip angle of 40°, TE = 5 ms, TR = 24 ms, FOV = 24 cm, 124 coronal slices at 1.5 mm/slice, matrix dimension 256 × 192 and NEX = 2. Only the T1 images were used in the image processing and analysis.
Image Analysis
Imaging analysis was performed using FreeSurfer (version 5.0, http://surfer.nmr.mgh.harvard.edu), an automated surface reconstruction and tissue classification and segmentation software. Each participant's MRI scan was analyzed in original space using the standard FreeSurfer analysis pipeline. Briefly, processing included removal of non-brain tissue by a hybrid watershed/surface deformation procedure (Ségonne et al., 2004), subcortical structures were segmented (Fischl et al., 2002), and further intensity normalization was conducted. This was followed by white-matter segmentation, tessellation of the gray-white matter boundary, and automated topology correction (Fischl et al., 2001). Then surface deformation following intensity gradients optimally places the gray/white and gray/cerebrospinal fluid (CSF) borders at the location where the greatest shift in intensity defines the transition to the other tissue class (Fischl et al., 2001). Once the cortical models were complete, additional data processing and analysis were performed with deformable procedures, including parcellation of the cerebral cortex into 34 (Desikan et al., 2006) or 74 (Destrieux et al., 2010) conventional gyral- and sulcal-based neuroanatomical regions in each hemisphere. In automatic subcortical segmentation, each voxel in the normalized brain volume was assigned one of 37 labels. The ICV was estimated using the method described by Buckner et al. (2004). Previous studies have shown that FreeSurfer-derived volumetric measures of ICV (Buckner et al., 2004; Jovicich et al., 2009), cortical structures (Wonderlick et al., 2009) and subcortical structures (Jovicich et al., 2009; Wonderlick et al., 2009) all have high reliabilities.
Empirical Evidence of the Non-Proportionality between VOIs and ICV
As discussed earlier, some studies already reported the proportional relationships between VOIs and ICV may not always hold. In this subsection, we use data from the PREDICT-HD study to further demonstrate the non-proportionality between VOIs and ICV. Four brain structures are used as examples: caudate, putamen, superior frontal cortex, and precuneus. Figure 1 shows the scatter plots of these four VOIs vs. ICV. All plots show that each VOI is positively correlated with ICV, which verifies that these VOIs increase with head size. After dividing each VOI by ICV, which is the proportion method of ICV correction, the scatterplots of VOI-to-ICV ratios vs. ICV are shown in Figure 2. All plots show a negative trend, with varying degrees, between the proportion-corrected volume and ICV: The larger the ICV, the smaller the corrected volume, and vice versa. If each VOI is proportional to ICV, there should be no trend in any plot. These plots demonstrate that a brain VOI is in general not proportional to ICV.
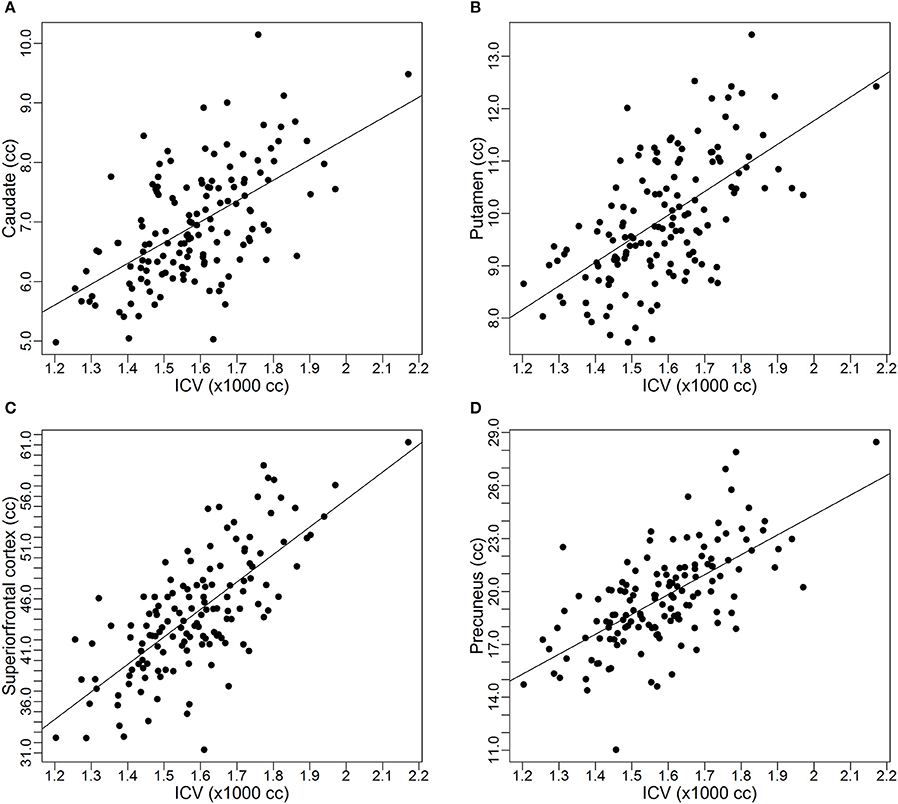
Figure 1. Scatterplots and linear regression lines of the raw volumes vs. intracranial volume. (A) Caudate; (B) putamen; (C) superior frontal cortex; (D) precuneus. ICV, intracranial volume.
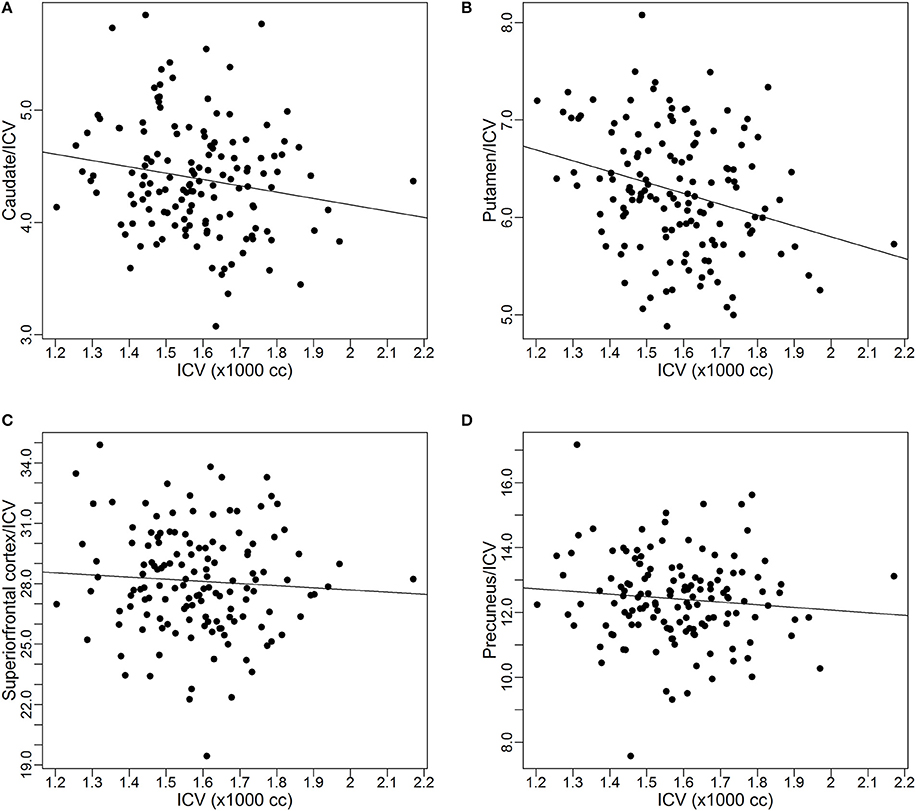
Figure 2. Scatterplots and linear regression lines of the proportion corrected volumes vs. intracranial volume. (A) Caudate; (B) putamen; (C) superior frontal cortex; (D) precuneus. ICV, intracranial volume.
The Power-Proportion Correction Method
In this subsection, we present the power-proportion method that employs the power law principle to correct for individual differences in ICV. As was stated earlier, the power law principle stipulates that a VOI is related to ICV through the relationship:
where α is a constant and β is the scaling exponent of the power function. Both α and β can depend on the VOI. When β = 1, the VOI is in proportion to ICV. When β < 1, for a certain percentage increase in ICV, the percentage increase in VOI will be smaller; when β > 1, for a certain percentage increase in ICV, the percentage increase in VOI will be larger.
For the estimation of α and β, the following nonlinear model is utilized
where ε is the random noise that is assumed to follow an independent and identical (iid) normal distribution with mean 0 and some variance σ2, that is ε ~ N(0, σ2). It is noted that in this model formulation, the random noise is assumed to have an additive effect on the VOI. The implication of the additive assumption is that the variance of the noise is about constant across ICV values. This assumption is supported by the empirical evidence provided by our data. For example, in Figure 1, although each VOI is increasing with ICV, the variability is about the same at different values of ICV.
The estimate of β, denoted by b, is obtained from fitting Model 1 using sample data. Then b can be used in the power-proportion correction of ICV using the following formula:
where VOIPPC denotes the power-proportion corrected VOI. Note that this correction formula takes a similar form as the proportion method. The difference lies in the denominator. In the proportion method, the exponent of ICV is fixed to be b = 1 for all regions and all studies, whereas in the power-proportion correction method, ICV is a power function with the exponent being estimated from the study sample. If b is equal to 1, then the nonlinear corrected VOI is equivalent to the traditional proportion method. As b diverges away from 1, then the power-proportion corrected VOI diverges from the proportion method.
Results
The power-proportion method as described in the previous subsection was applied to data from the PREDICT-HD study. Analysis was conducted on 34 cortical regions based on the parcellation scheme of Desikan et al. (2006), the CSF and eight subcortical regions from the FreeSurfer output, and the results were tabulated.
Before presenting results from all these 43 VOIs, estimates for the four ROIs that were used as examples in the previous subsection were extracted: caudate, putamen, superior frontal cortex, and precuneus. Table 2 shows the estimates of the exponent parameter β and their standard errors (in parentheses) from the fitting of Model 1. The table shows the estimated exponents for all four VOIs are smaller than 1. The β estimates for two of the VOIs (caudate and putamen) are significantly smaller than 1 (95% confidence interval does not contain 1), which suggests that the proportional relationship between these VOIs and ICV does not hold and explains why the proportion-corrected VOIs are strongly negatively correlated with ICV, as illustrated in Figure 2. The estimates for prefrontal cortex and precuneus are not significantly different from 1 (95% confidence interval contains 1), which indicates the proportional relationship approximately holds between these VOIs and ICV. This result also demonstrates the proposed power-proportion method includes the proportion method as a special case: When the proportional relationship between a VOI and ICV holds, the former reduces to the latter.
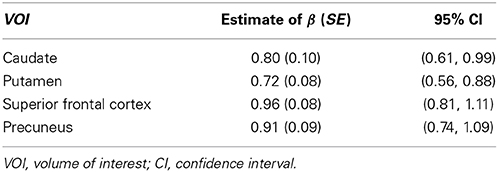
Table 2. Regression estimates and their standard errors (SE) of the exponent of the power function of intracranial volume for each volume of interest.
To visually inspect the performance of the power-proportion method in removing the confounding effect of ICV, scatterplots of VOIPPC vs. ICV for the four VOIs are presented in Figure 3. The straight line in each plot represents the regression line between VOIPPC and ICV. The plots show each line is parallel to the x-axis, which indicates after the power-proportion correction, the ICV-corrected VOIs are uncorrelated with ICV. This is in contrast to the plots in Figure 2 based on the proportion correction method, where almost all regression lines have a negative trend.
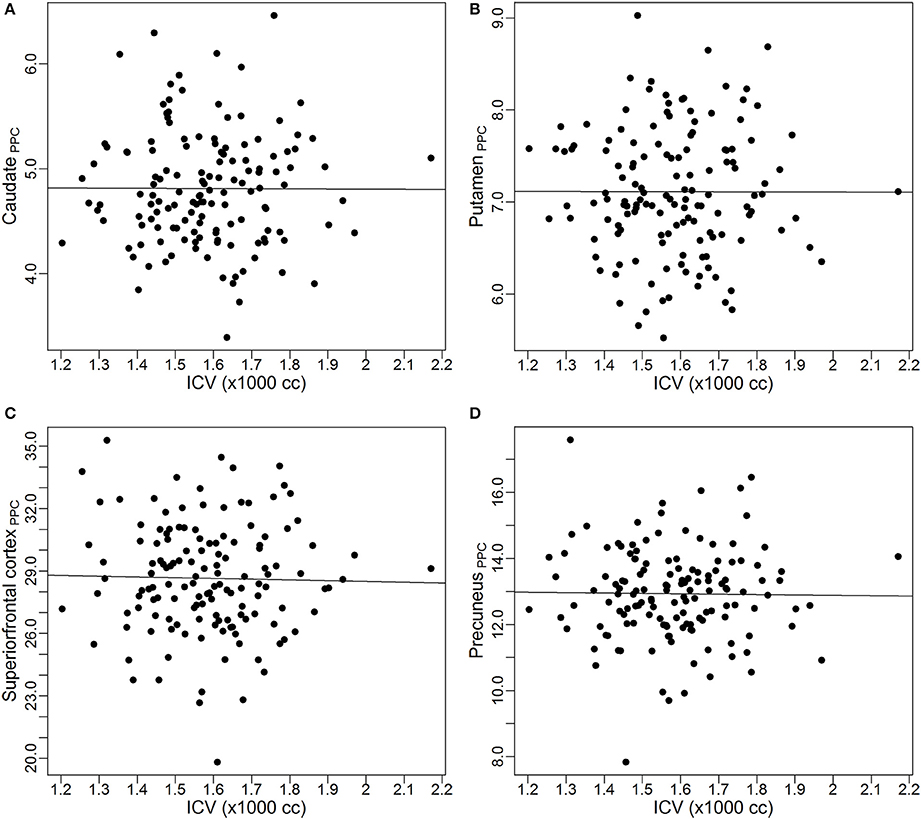
Figure 3. Scatterplots and linear regression lines of the power-proportion corrected volumes vs. intracranial volume. (A) Caudate; (B) putamen; (C) superior frontal cortex; (D) precuneus. ICV, intracranial volume. The subscript “PPC” in the label of y-axis represents “power-proportion correction.”
Tables 3, 4 summarized the estimates for nine subcortical VOIs (including CSF) and 34 cortical VOIs, respectively. From these tables it is clear that the estimated exponent parameter β for many VOIs are significantly less than 1, such as the caudate, putamen, amygdala, hippocampus, pallidum, caudal anterior cingulate, cuneus, temporal pole, among others. This indicates when ICV increases by a certain percentage, these VOIs do not increase by the same percentage. Rather, they increase at a lower rate.
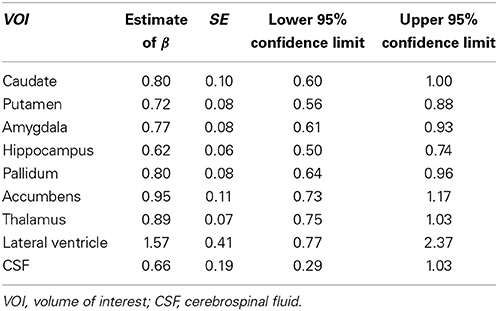
Table 3. Regression estimates of the exponent of the power function of intracranial volume for subcortical volumes of interest.
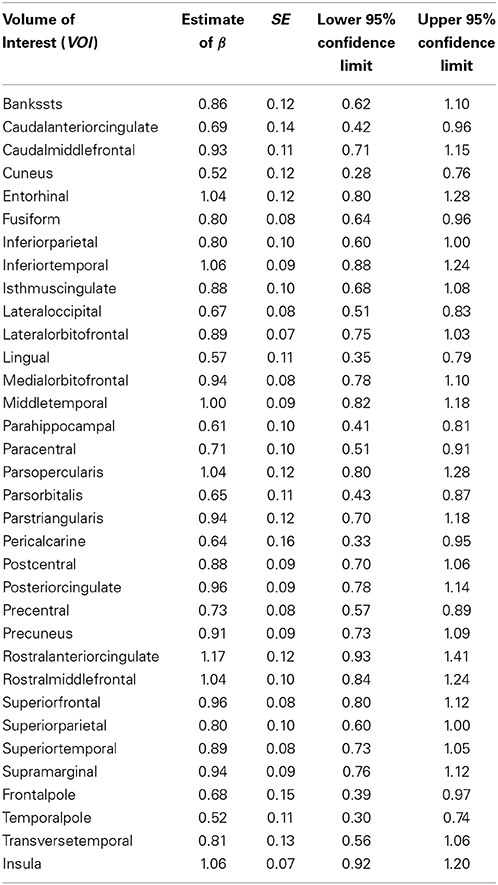
Table 4. Regression estimates of the exponent of the power function of intracranial volume for cortical volumes of interest.
To formally compare the performance of the power-proportion method and the ANCOVA method in describing the relationship between a VOI and ICV, leave-one-out cross-validation was conducted and the prediction error (sum of the squared differences between observed and predicted responses) was calculated. Scatterplots of prediction errors from the two methods are shown in Figure 4, where the straight line in each plot represents the line with 45° angle. From these plots it is clear that when the nonlinear relationship between a VOI and ICV is strong (the exponent of the power function is significantly different from 1), the prediction error based on the power-proportion method are smaller than that based on the ANCOVA method (plot A); whereas when the linear relationship between a VOI and ICV approximately holds, the prediction errors are very similar (plot B). This is not surprising as the power-proportion method includes ANCOVA method as a special case.
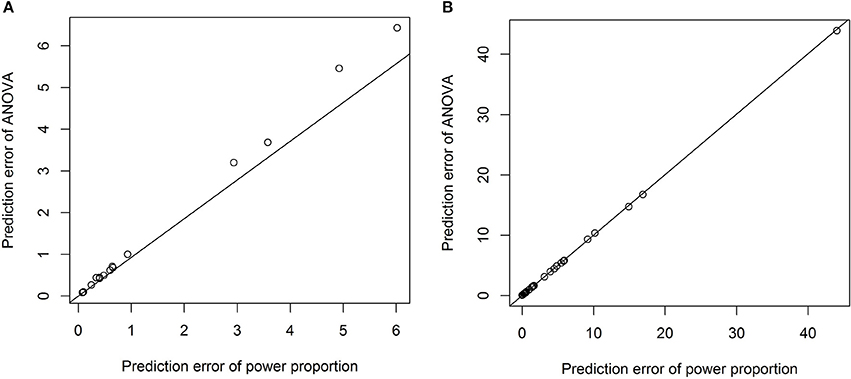
Figure 4. Scatterplots of prediction errors based on the power-proportion method and the ANCOVA method. (A) When the exponent parameter is significantly different from 1; (B) when the exponent parameter is not significantly different from 1.
Discussion
In volumetric comparison of a brain region between groups of individuals, the proportion method is often applied to correct for individual differences in head size. The underlying assumption of this method is that a VOI is proportional to ICV. Using examples from previous publications as well as from the PREDICT-HD study, we showed for many brain structures, their relationships to ICV are not proportional. Rather, the relationships follow the power law.
Many studies have explicitly (for example, Im et al., 2008) or implicitly (for example, Barnes et al., 2010) reported the power law phenomenon for different brain structures. Our own data also supported this finding. To take into account the power law relationship, we proposed the power-proportion method for ICV correction. Our analyses have shown the new method achieves better performance compared to the proportion method in that the new ICV-corrected VOI has a near-zero correlation with ICV. The new method has the potential to increase the likelihood of valid volumetric comparisons between groups by effectively removing the confounding effect of ICV.
One advantage of our proposed method is that the exponential parameter of the power-law relation is estimated from the data rather than specified a priori. For example, we have tested the quadratic relation between each VOI and ICV and it turned out that the quadratic relationship is significant only for three out of forty three VOIs. The prediction errors from the model with the quadratic term and those from the power-proportion method are compared and summarized using scatterplots in Figure 5. Comparing Figure 5 to Figure 4, we can see that the prediction errors from the model with the quadratic term are reduced compared to the ones from the linear model, but they are still larger than those from the power-proportion method. This indicates the existence of nonlinear relationship between VOIs and ICV and highlights the importance of estimating rather pre-specifying the potential nonlinear relationship between a VOI and ICV.
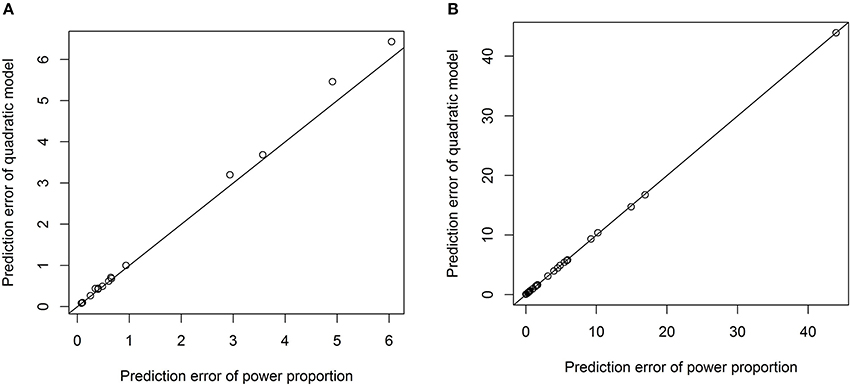
Figure 5. Scatterplots of prediction errors based on the power-proportion method and the ANCOVA method with the quadratic term. (A) When the exponent parameter is significantly different from 1; (B) when the exponent parameter is not significantly different from 1.
We would like to point out that our proposed method also has close connection to the residual or ANCOVA method for ICV correction (Mathalon et al., 1993; Sanfilipo et al., 2004; O'Brien et al., 2011). If in the analysis of volumetric data, both the VOI and ICV are log-transformed and a linear regression is fitted based on the log-transformed data (which is the idea of residual or ANCOVA method), the modeling practice is similar to the nonlinear regression as presented in Model 1. However, there is a critical difference between these two modeling strategies. For the regression on log-transformed data, the underlying assumption for the effect of random noise is that it affects VOI in a multiplicative manner. A consequence of this assumption is that the variability of VOI increases with ICV. On the other hand, our nonlinear model formulation assumes the additive effect of random noise. The implication of this assumption is that the variability of the VOI is constant across values of ICV. Our data suggest that the variability of a VOI does not increase with ICV, which is also consistent with other published data. Therefore, we believe the nonlinear regression of Model 1 more closely reflects the noise mechanism underlying volumetric imaging measures.
There are some limitations to our study. First, our method was applied only on data processed by FreeSurfer. We believe the proposed nonlinear correction should be valid for data obtained from other neuroimaging software packages, but this remains to be seen. Second, the newly proposed method depends on model fitting, which is not as straightforward as the proportion method. We hope, however, that the power law formulation of Model 1 is clear enough for applied researchers to use with minimal burden. Third, the question of the reliability of the proposed power-proportion method has not been addressed (see, for example, Sanfilipo et al., 2004). Reliability will be examined in a follow-up study.
In conclusion, we proposed a power-proportion method for ICV correction in volumetric brain imaging analysis. The correction was based on the power law principle and motivated by the empirical evidence that volumes of many brain regions are not proportional to ICV. The new method was demonstrated to successfully remove the confounding effect of ICV using data from the PREDICT-HD study.
Conflict of Interest Statement
The authors declare that the research was conducted in the absence of any commercial or financial relationships that could be construed as a potential conflict of interest.
Acknowledgments
We thank the PREDICT-HD sites, the study participants, the National Research Roster for Huntington Disease Patients and Families, the Huntington's Disease Society of America and the Huntington Study Group. University of Iowa Carver College of Medicine staff Sean Thompson and Madeleine Hoofnagle assisted with manuscript preparation.
References
Andreasen, N., Nasrallah, H. A., Dunn, V., Olson, S. C., Grove, W. M., Ehrhardt, J. C., et al. (1986). Structural abnormalities in the frontal system in schizophrenia. A magnetic resonance imaging study. Arch. Gen. Psychiatry 43, 136–144. doi: 10.1001/archpsyc.1986.01800020042006
Pubmed Abstract | Pubmed Full Text | CrossRef Full Text | Google Scholar
Aylward, E. H., Liu, D., Nopoulos, P., Ross, P. A., Pierson, R., Mills, J. A., et al. (2012). Striatal volume contributes to the prediction of onset of Huntington disease in incidence cases. Biol. Psychiatry 71, 822–828. doi: 10.1016/j.biopsych.2011.07.030
Pubmed Abstract | Pubmed Full Text | CrossRef Full Text | Google Scholar
Aylward, E. H., Li, Q., Stine, O. C., Ranen, N., Sherr, M., Barta, P. E., et al. (1997). Longitudinal change in basal ganglia volume in patients with Huntington's disease. Neurology 48, 394–399. doi: 10.1212/WNL.48.2.394
Pubmed Abstract | Pubmed Full Text | CrossRef Full Text | Google Scholar
Barnes, J., Ridgway, G. R., Bartlett, J., Henley, S. M., Lehmann, M., Hobbs, N., et al. (2010). Head size, age and gender adjustment in MRI studies: a necessary nuisance? Neuroimage 53, 1244–1255. doi: 10.1016/j.neuroimage.2010.06.025
Pubmed Abstract | Pubmed Full Text | CrossRef Full Text | Google Scholar
Buckner, R. L., Head, D., Parker, J., Fotenos, A. F., Marcus, D., Morris, J. C., et al. (2004). A unified approach for morphometric and functional data analysis in young, old, and demented adults using automated atlas-based head size normalization: reliability and validation against manual measurement of total intracranial volume. Neuroimage 23, 724–738. doi: 10.1016/j.neuroimage.2004.06.018
Pubmed Abstract | Pubmed Full Text | CrossRef Full Text | Google Scholar
Desikan, R. S., Segonne, F., Fischl, B., Quinn, B. T., Dickerson, B. C., Blacker, D., et al. (2006). An automated labeling system for subdividing the human cerebral cortex on MRI scans into gyral based regions of interest. Neuroimage 31, 968–980. doi: 10.1016/j.neuroimage.2006.01.021
Pubmed Abstract | Pubmed Full Text | CrossRef Full Text | Google Scholar
Destrieux, C., Fischl, B., Dale, A., and Halgren, E. (2010). Automatic parcellation of human cortical gyri and sulci using standard anatomical nomenclature. Neuroimage 53, 1–15. doi: 10.1016/j.neuroimage.2010.06.010
Pubmed Abstract | Pubmed Full Text | CrossRef Full Text | Google Scholar
Fischl, B., Liu, A., and Dale, A. M. (2001). Automated manifold surgery: constructing geometrically accurate and topologically correct models of the human cerebral cortex. IEEE Trans. Med. Imaging 20, 70–80. doi: 10.1109/42.906426
Pubmed Abstract | Pubmed Full Text | CrossRef Full Text | Google Scholar
Fischl, B., Salat, D. H., Busa, E., Albert, M., Dieterich, M., Haselgrove, C., et al. (2002). Whole brain segmentation: automated labeling of neuroanatomical structures in the human brain. Neuron 33, 341–355. doi: 10.1016/S0896-6273(02)00569-X
Pubmed Abstract | Pubmed Full Text | CrossRef Full Text | Google Scholar
Hodges, J. R., Patterson, K., Ward, R., Garrard, P., Bak, T., Perry, R., et al. (1999). The differentiation of semantic dementia and frontal lobe dementia (temporal and frontal variants of frontotemporal dementia) from early Alzheimer's disease: a comparative neuropsychological study. Neuropsychology 13, 31–40. doi: 10.1037/0894-4105.13.1.31
Pubmed Abstract | Pubmed Full Text | CrossRef Full Text | Google Scholar
Hubbard, B. M., and Anderson, J. M. (1981). A quantitative study of cerebral atrophy in old age and senile dementia. J. Neurol. Sci. 50, 135–145. doi: 10.1016/0022-510X(81)90048-4
Pubmed Abstract | Pubmed Full Text | CrossRef Full Text | Google Scholar
Im, K., Lee, J. M., Lyttelton, O., Kim, S. H., Evans, A. C., and Kim, S. I. (2008). Brain size and cortical structure in the adult human brain. Cereb. Cortex 18, 2181–2191. doi: 10.1093/cercor/bhm244
Pubmed Abstract | Pubmed Full Text | CrossRef Full Text | Google Scholar
Jovicich, J., Czanner, S., Han, X., Salat, D., van der Kouwe, A., Quinn, B., et al. (2009). MRI-derived measurements of human subcortical, ventricular and intracranial brain volumes: reliability effects of scan sessions, acquisition sequences, data analyses, scanner upgrade, scanner vendors and field strengths. Neuroimage 46, 177–192. doi: 10.1016/j.neuroimage.2009.02.010
Pubmed Abstract | Pubmed Full Text | CrossRef Full Text | Google Scholar
Kruggel, F. (2006). MRI-based volumetry of head compartments: normative values of healthy adults. Neuroimage 30, 1–11. doi: 10.1016/j.neuroimage.2005.09.063
Pubmed Abstract | Pubmed Full Text | CrossRef Full Text | Google Scholar
Lüders, E., Steinmetz, H., and Jäncke, L. (2002). Brain size and grey matter volume in the healthy human brain. Neuroreport 13, 2371–2374. doi: 10.1097/00001756-200212030-00040
Pubmed Abstract | Pubmed Full Text | CrossRef Full Text | Google Scholar
Marra, C., Quaranta, D., Zinno, M., Misciagna, S., Bizzarro, A., Masullo, C., et al. (2007). Clusters of cognitive and behavioural disorders clearly distinguish primary progressive aphasia from frontal lobe dementia, and Alzheimer's disease. Dement. Geriatr. Cogn. Disord. 24, 317–326. doi: 10.1159/000108115
Mathalon, D. H., Sullivan, E. V., Rawls, J. M., and Pfefferbaum, A. (1993). Correction for head size in brain-imaging measurements. Psychiatry Res. 50, 121–139. doi: 10.1016/0925-4927(93)90016-B
Pubmed Abstract | Pubmed Full Text | CrossRef Full Text | Google Scholar
O'Brien, L. M., Ziegler, D. A., Deutsch, C. K., Frazier, J. A., Herbert, M. R., Locascio, J. J. (2011). Statistical adjustments for brain size in volumetric neuroimaging studies: some practical implications in methods. Psychiatry Res. 193, 113–122. doi: 10.1016/j.pscychresns.2011.01.007
Pubmed Abstract | Pubmed Full Text | CrossRef Full Text | Google Scholar
Paulsen, J. S., Langbehn, D. R., Stout, J. C., Aylward, E., Ross, C. A., Nance, M., et al. (2008). Detection of Huntington's disease decades before diagnosis: the Predict-HD study. J. Neurol. Neurosurg. Psychiatry 79, 874–880. doi: 10.1136/jnnp.2007.128728
Pubmed Abstract | Pubmed Full Text | CrossRef Full Text | Google Scholar
Paulsen, J. S., Magnotta, V. A., Mikos, A. E., Paulson, H. L., Penziner, E., Andreasen, N. C., et al. (2006). Brain structure in preclinical Huntington's disease. Biol. Psychiatry 59, 57–63. doi: 10.1016/j.biopsych.2005.06.003
Pubmed Abstract | Pubmed Full Text | CrossRef Full Text | Google Scholar
Sanfilipo, M. P., Benedict, R. H., Zivadinov, R., and Bakshi, R. (2004). Correction for intracranial volume in analysis of whole brain atrophy in multiple sclerosis: the proportion vs. residual method. Neuroimage 22, 1732–1743. doi: 10.1016/j.neuroimage.2004.03.037
Pubmed Abstract | Pubmed Full Text | CrossRef Full Text | Google Scholar
Schumann, C. M., Barnes, C. C., Lord, C., and Courchesne, E. (2009). Amygdala enlargement in toddlers with autism related to severity of social and communication impairments. Biol. Psychiatry 66, 942–949. doi: 10.1016/j.biopsych.2009.07.007
Pubmed Abstract | Pubmed Full Text | CrossRef Full Text | Google Scholar
Ségonne, F., Dale, A. M., Busa, E., Glessner, M., Salat, D., Hahn, H. K., et al. (2004). A hybrid approach to the skull stripping problem in MRI. Neuroimage 22, 1060–1075. doi: 10.1016/j.neuroimage.2004.03.032
Pubmed Abstract | Pubmed Full Text | CrossRef Full Text | Google Scholar
Wonderlick, J. S., Ziegler, D. A., Hosseini-Varnamkhasti, P., Locascio, J. J., Bakkour, A., van der Kouwe, A., et al. (2009). Reliability of MRI-derived cortical and subcortical morphometric measures: effects of pulse sequence, voxel geometry, and parallel imaging. Neuroimage 44, 1324–1333. doi: 10.1016/j.neuroimage.2008.10.037
Pubmed Abstract | Pubmed Full Text | CrossRef Full Text | Google Scholar
Ystad, M. A., Lundervold, A. J., Wehling, E., Espeseth, T., Rootwelt, H., Westlye, L. T., et al. (2009). Hippocampal volumes are important predictors for memory function in elderly women. BMC Med. Imaging 9:17. doi: 10.1186/1471-2342-9-17
Pubmed Abstract | Pubmed Full Text | CrossRef Full Text | Google Scholar
Zhang, K., and Sejnowski, T. J. (2000). A universal scaling law between gray matter and white matter of cerebral cortex. Proc. Natl. Acad. Sci. U.S.A. 97, 5621–5626. doi: 10.1073/pnas.090504197
Pubmed Abstract | Pubmed Full Text | CrossRef Full Text | Google Scholar
Keywords: magnetic resonance imaging, intracranial volume, nonlinear model, power function, power-proportion correction
Citation: Liu D, Johnson HJ, Long JD, Magnotta VA and Paulsen JS (2014) The power-proportion method for intracranial volume correction in volumetric imaging analysis. Front. Neurosci. 8:356. doi: 10.3389/fnins.2014.00356
Received: 25 April 2014; Accepted: 16 October 2014;
Published online: 06 November 2014.
Edited by:
Russell A. Poldrack, University of Texas, USAReviewed by:
Matthew Brett, University of Cambridge, UKAviv Abraham Mezer, Stanford University, USA
Copyright © 2014 Liu, Johnson, Long, Magnotta and Paulsen. This is an open-access article distributed under the terms of the Creative Commons Attribution License (CC BY). The use, distribution or reproduction in other forums is permitted, provided the original author(s) or licensor are credited and that the original publication in this journal is cited, in accordance with accepted academic practice. No use, distribution or reproduction is permitted which does not comply with these terms.
*Correspondence: Jane S. Paulsen, Carver College of Medicine, The University of Iowa, 1-305 Medical Education Building, Iowa City, IA 52242-1000, USA e-mail: predict-publications@uiowa.edu; jane-paulsen@uiowa.edu