 Arshad M. Khan1,2*
- 1UTEP Systems Neuroscience Laboratory, Department of Biological Sciences, Border Biomedical Research Center, University of Texas at El Paso, El Paso, TX, USA
- 2Neurobiology Section, Department of Biological Sciences, University of Southern California, Los Angeles, CA, USA
Intracranial chemical injection (ICI) methods have been used to identify the locations in the brain where feeding behavior can be controlled acutely. Scientists conducting ICI studies often document their injection site locations, thereby leaving kernels of valuable location data for others to use to further characterize feeding control circuits. Unfortunately, this rich dataset has not yet been formally contextualized with other published neuroanatomical data. In particular, axonal tracing studies have delineated several neural circuits originating in the same areas where ICI injection feeding-control sites have been documented, but it remains unclear whether these circuits participate in feeding control. Comparing injection sites with other types of location data would require careful anatomical registration between the datasets. Here, a conceptual framework is presented for how such anatomical registration efforts can be performed. For example, by using a simple atlas alignment tool, a hypothalamic locus sensitive to the orexigenic effects of neuropeptide Y (NPY) can be aligned accurately with the locations of neurons labeled by anterograde tracers or those known to express NPY receptors or feeding-related peptides. This approach can also be applied to those intracranial “gene-directed” injection (IGI) methods (e.g., site-specific recombinase methods, RNA expression or interference, optogenetics, and pharmacosynthetics) that involve viral injections to targeted neuronal populations. Spatial alignment efforts can be accelerated if location data from ICI/IGI methods are mapped to stereotaxic brain atlases to allow powerful neuroinformatics tools to overlay different types of data in the same reference space. Atlas-based mapping will be critical for community-based sharing of location data for feeding control circuits, and will accelerate our understanding of structure-function relationships in the brain for mammalian models of obesity and metabolic disorders.
1. Introduction
In the past two decades, our abilities to acutely manipulate neural substrates controlling behavior in the living animal have transformed substantially. New transgenic methods to control brain circuits, such as in vivo site-specific recombinase technology (Lakso et al., 1992; Orban et al., 1992; Gu et al., 1994), viral-mediated expression or RNA interference (RNAi) (Davidson et al., 1993; Chamberlin et al., 1998; Hommel et al., 2003), optogenetics (Boyden et al., 2005; Lima and Miesenböck, 2005; Bernstein et al., 2012) and pharmacosynthetics (Armbruster et al., 2007; Farrell and Roth, 2013), are now being used to address how complex, goal-directed behaviors occur from organized networks of neurons. At present, only a few laboratories have used these methods to study feeding behavior. These state-of-the-art methods are now rapidly finding their place in our scientific literature alongside studies involving acute chemical microinjection methods to control behavior that were first developed over a century ago, and first used for studying acute feeding control in 1954.
In this review, these methods will be examined in relation to the neuroanatomical information they have provided to scientists trying to identify brain regions and circuits controlling feeding behavior. Section 2 includes a brief history of central microinjection methods, focusing on injection sites and maps of feeding control regions. I found the excellent handbook by Myers (1974) to be an indispensible resource for most studies published between 1915 and 1972. In Section 3, I review gene-directed studies used to study feeding behavior, including site-specific recombinase technology, viral-mediated expression, and RNAi, optogenetics, and pharmacosynthetics; highlighting special experimental considerations related to these techniques for documenting injection and probe sites, as well as populations of neurons activated or transduced by viruses. In Section 4, a framework is proposed for examining location data in the brain in a manner that allows one to interrelate such data from multiple studies of the same brain region. I compare location data obtained from chemical injection studies with those using newer gene-directed methods. In Section 5, I argue that within studies using intracranial injection methods, the careful documentation of the locations of the injection sites or the cell populations affected by such injections is critical for interrelating these location data with data found in other types of studies. For example, neuroanatomical tract-tracing studies have provided much information concerning the circuit connections of neurons in key feeding control regions of the brain. Many of these regions have also been targets of various intracranial central injection methods. Placing the injection sites found in one study in anatomical registration with traced circuits documented in another can aid in the formulation of plausible, constrained hypotheses concerning how functional feeding circuits are controlled and organized. The proposal is made, also in Section 5, that neuroinformatics approaches provide a set of powerful tools to analyze diverse sets of data that are linked by the location information they each contain.
In this article, the focus is not on the circuits controlling food intake (i.e., the biology), but rather how to contextualize neuroanatomical data with chemical and/or gene-directed microinjection data (i.e., methodology). Several cogent reviews cover details about feeding (and related) control circuits (Stevenson, 1969; Myers, 1974; Swanson, 1987, 2000c; Loewy and Spyer, 1990; Blessing, 1997; Elmquist et al., 1999; Watts and Swanson, 2002; Llewellyn-Smith and Verberne, 2011). Since most chemical injection studies concerning feeding control have been focused on manipulations of rat hypothalamus, this structure is emphasized in this article, but a few key studies performed in other brain regions [e.g., prefrontal cortex, nucleus accumbens, ventral tegmental area (VTA), nucleus of the solitary tract] and in other species (goat, rabbit, guinea pig, mouse) are also highlighted. For newer methods involving viral injections, the reader will find attention shifted more to the mouse, reflecting the greater importance this animal model now has for scientists investigating feeding control. Before we discuss these topics, it is useful to compare chemical injection studies with newer gene-directed approaches used to control behavior.
1.1. Intracranial Injection Methods to Acutely Control Behavior
For our purposes here, the terms intracranial chemical injections (ICI) and intracranial gene-directed injections (IGI) will be used to differentiate traditional, acute chemical injection methods (Myers, 1974) from recently developed methods involving cell type-specific insertion of engineered molecules, such as in vivo site-specific recombinase technology (Lakso et al., 1992; Orban et al., 1992; Gu et al., 1994), viral-mediated RNA expression or interference (Davidson et al., 1993; Chamberlin et al., 1998; Hommel et al., 2003), optogenetics (Boyden et al., 2005; Lima and Miesenböck, 2005; Bernstein et al., 2012), and pharmacosynthetics (Armbruster et al., 2007; Farrell and Roth, 2013). While not fully inclusive of the possible combinatorial strategies that can be employed to control engineered molecules in the brain, the term IGI is being used deliberately to emphasize those variants of gene-directed methods that specifically involve injections of various constructs into the brain. Also, in vivo microdialysis and other related methods (push-pull perfusion, amperometry, etc.) are not covered in this article, but the concepts discussed here also apply to these methods.
Although ICI and IGI methods were developed nearly a century apart from one another (Maxwell, 1906a,b; Hommel et al., 2003; Balthasar et al., 2005; Adamantidis et al., 2007; Alexander et al., 2009), both rely on the use of intracranial injections to either deliver chemical ligands (ICI) or various genetically engineered sequences (IGI), such as those encoding Cre recombinase, short hairpin RNA (shRNA), neuropeptides, enzymes, ion channels, ion transporters, or receptors; deep within brain tissue to control behavioral output. With ICI, the chemicals travel to their targets either from crystalline or wax deposits slowly dissolving in the brain after implantation, or as pre-dissolved solutes within inert “vehicle,” or carrier solutions; in rare instances, such chemicals are also delivered by being secreted from tissue grafts implanted at the site of interest (e.g., Flerkó and Szentágothai, 1957; see Myers, 1974). With IGI, the genetic sequences are packaged within modified viruses that are injected into the brain (e.g., Davidson et al., 1993), where the sequences are transduced and expressed within neuronal populations, often in a promoter-specific fashion (e.g., Zhang et al., 2010). Once expressed, these molecules can be engaged in various ways that depend upon the specific IGI approach used. For site-specific recombinase technology [(Sauer, 1987; Sauer and Henderson, 1988; Lakso et al., 1992; Orban et al., 1992; Gu et al., 1994); reviewed in Sauer (1998)], the viruses deliver a sequence encoding the enzyme, Cre recombinase, to cells in a transgenic animal harboring LoxP sequences genetically inserted to flank genes intended for deletion, insertion, translocation, or inversion. For site-specific gene deletion, the expressed Cre recombinase initiates splicing of the sequence at LoxP sites within the specific cells where it has been delivered by the virus. In viral-mediated RNAi, shRNA inhibits the expression of particular molecules within the cell (Hommel et al., 2003). In optogenetic methods, neurons can be activated or inhibited via light pulses of specific wavelengths delivered from implanted optical fibers situated in the vicinity of the expressed light-sensitive ion channels (Boyden et al., 2005). In pharmacosynthetic methods (Armbruster et al., 2007; Farrell and Roth, 2013), activation or inhibition of “designer” receptors inserted into cells by viral transduction occurs by “designer” ligands injected centrally or that are delivered systemically and cross the blood-brain barrier, such as the prototypical synthetic molecule, clozapine-N-oxide (CNO).
Another similarity between ICI and IGI methods is that they often involve combinations of intracranial manipulations. Thus, prior to the injection of chemicals or viruses, these techniques may first require the implantation of chronically indwelling guide cannulas that facilitate rapid and reproducible insertion of the injector needles or optical fibers into brain tissue. The first tissue perturbation would therefore be from the cannula implantation, and the second from the injector needle or fiber itself. In such cases, the tissue is subjected to more than one invasive manipulation. As discussed in the next section, the tissue itself supplies a critical type of datum in ICI and IGI studies: location information about the experimental manipulation.
1.2. Sites and Cells: the Only Visual References Left by ICI and IGI about Location
“… [N]etwork visualization is also the cartography of the indiscernible, depicting intangible structures that are invisible and undetected by the human eye, from eccentric visualizations of the World Wide Web to representations of the brain's neural network. In some cases, the maps of these hidden structures are the only visual reference we have, constituting its own alternative reality.”
Visual Complexity: Mapping Patterns of Information
ICI and IGI studies of feeding behavior are conducted to achieve certain goals. First, there is a need to understand the qualitative and quantitative aspects of feeding behavior itself, such as feeding duration, latency to eat, timing and sizes of meals, inter-meal interval durations, or responses to conditioned cues (Brobeck, 1955; Le Magnen, 1985). Second, there is also a need to localize the effects of intracranial manipulations to a set of defined neural substrates. This is done by “identifying” brain regions and the circuits within them that are responsible for producing the behavior observed, based on probe locations in the brain.
It is this process of “identification” that is the main concern of this review. What can be identified within the tissue after using ICI or IGI methods to mark the site of experimental stimulation or suppression of feeding behavior? As will be detailed in Section 4.4.9.1. ICI and IGI methods leave several physical signs of experimental perturbation: (1) tissue displacement from the delivery of solutions carrying viral particles or dissolved chemicals; (2) tissue damage from glass micropipettes, needles, or optical fibers; (3) tissue damage from any indwelling cannulas used to guide probes to target locations; (4) histochemically detectable reporter molecules or tracers expressed or visualized in association with experimental manipulation or viral transduction.
Echoing Lima's statement above, the only visual references that usually remain about the location of an ICI or IGI manipulation, from which we can try and begin inferring the locations of underlying feeding circuits, is what has been documented within the published study for others to utilize. Importantly, it is useful to consider this published documentation as the type of “alternative reality” Lima describes. By being consciously aware of the rather underappreciated notion that the visual documentations of injection sites and cell location data—within a published report—constitute a proxy for that which is unseen and inaccessible in the brain, we might be more attentive in making sure that our published descriptions of such data, as a community, are as informative as possible. In doing so, we are ensuring that future scientists can fully access our datasets and bring them into register with their own as yet uncollected data. I approach the ingestive behavior community here with this argument, but it also has been made elsewhere for functional human brain imaging data (Devlin and Poldrack, 2007; Toga and Thompson, 2007; Van Essen and Dierker, 2007). In Sections 4 and 5, we will see how visual representations of data from the same brain region can be interrelated across published studies. Before beginning this topic, let us examine visual representations historically used to document intracranial microinjections (ICI methods) controlling feeding behavior.
2. The Experimental Control of Food Intake Using ICI: a Brief History
From the 1900s to the 1950s, various electrical stimulation or lesioning methods were used to investigate the neural substrates underlying feeding, autonomic and neuroendocrine control [e.g., the work of Karplus and Kreidl (Gehirn und Sympathicus, Parts I–VIII: 1909, 1910, 1911, 1918, 1924, 1927, 1928; Einthoven et al., 1927); the work of Hess in the 1920s and 1930s, reviewed by Hess (1954, 1956, 1957), Camus and Roussy, 1920; Ranson et al., 1935; Hetherington and Ranson, 1939, 1940; Anand and Brobeck, 1951a,b; Delgado and Anand, 1953; reviewed by Ingram (1939); Stevenson (1969)]. Moreover, studies of self-stimulation since the 1950s [(Olds and Milner, 1954; Hoebel and Teitelbaum, 1962); reviewed by Olds (1977); Wise (2005); Berthoud and Münzberg (2011)], linked feeding control to larger ideas about drive and reinforcement. Alongside these methods, ICI methods also contributed richly to our understanding of how neural substrates are causally linked to complex, goal-directed behaviors such as feeding. A few pioneering scientists first established this causal link during the 1950s and 1960s, by acutely delivering chemical substances into the brain of the freely moving animal to control feeding behavior (Larsson, 1954; Grossman, 1960; Epstein, 1960a,b). In this section, I trace the origins of such chemical control and note a few key historical studies that will be discussed within a larger theoretical framework in Section 4 and 5.
2.1. Nineteenth Century Antecedents
The chemical control of brain function originated within the larger intellectual discourse of the early to mid-nineteenth century concerning the localization of nervous system function (Fearing, 1930; Young, 1990). Table 1 shows some key developments during this time for chemical control studies of the brain. Intracranial injections were ostensibly popularized by these developments, which laid the groundwork for a more careful examination of chemical agents upon central nervous system function. By the early twentieth century, chemical studies became practical laboratory textbook exercises (e.g., Jackson, 1917; Sherrington, 1919; Barbour, 1932).
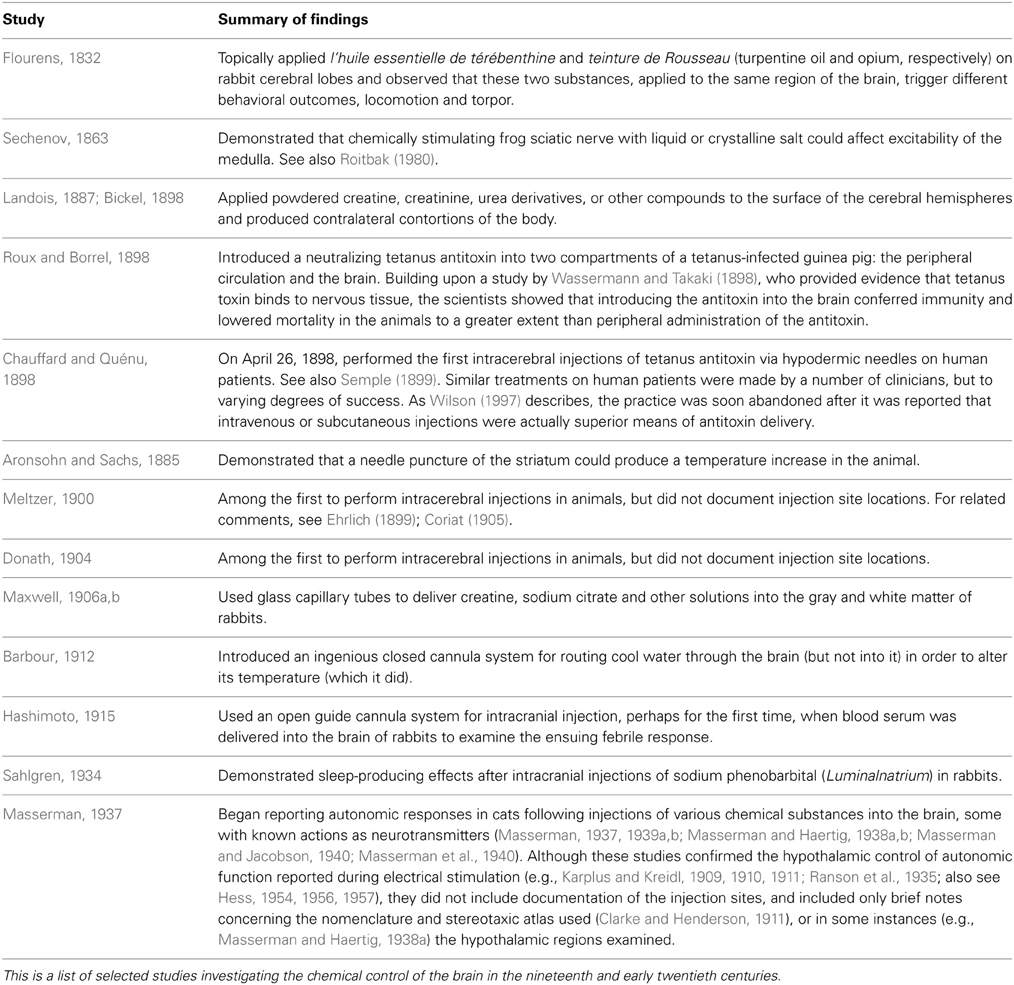
Table 1. Early studies investigating the chemical control of the brain.
2.2. A Century of Injection Sites
Figure 1 shows brain injection sites chronologically appearing in selected scientific studies from the early 1900s to the present day, beginning with Maxwell's documentation of needle tracks in the brain (1906a,b, Table 1), perhaps the first to be published (Figure 1A). In the early twentieth century, several scientists working in European laboratories were focused on ascertaining the locations of “centers” for the production of heat (Wärmzentrum) and sleep (Schlafzone). For example, while trying to study how calcium chloride injections might produce a febrile response in cats, Demole (1927) found that the injections produced sleep and that potassium chloride injections triggered arousal. Injections were marked using carmine or black dye (Figure 1B).
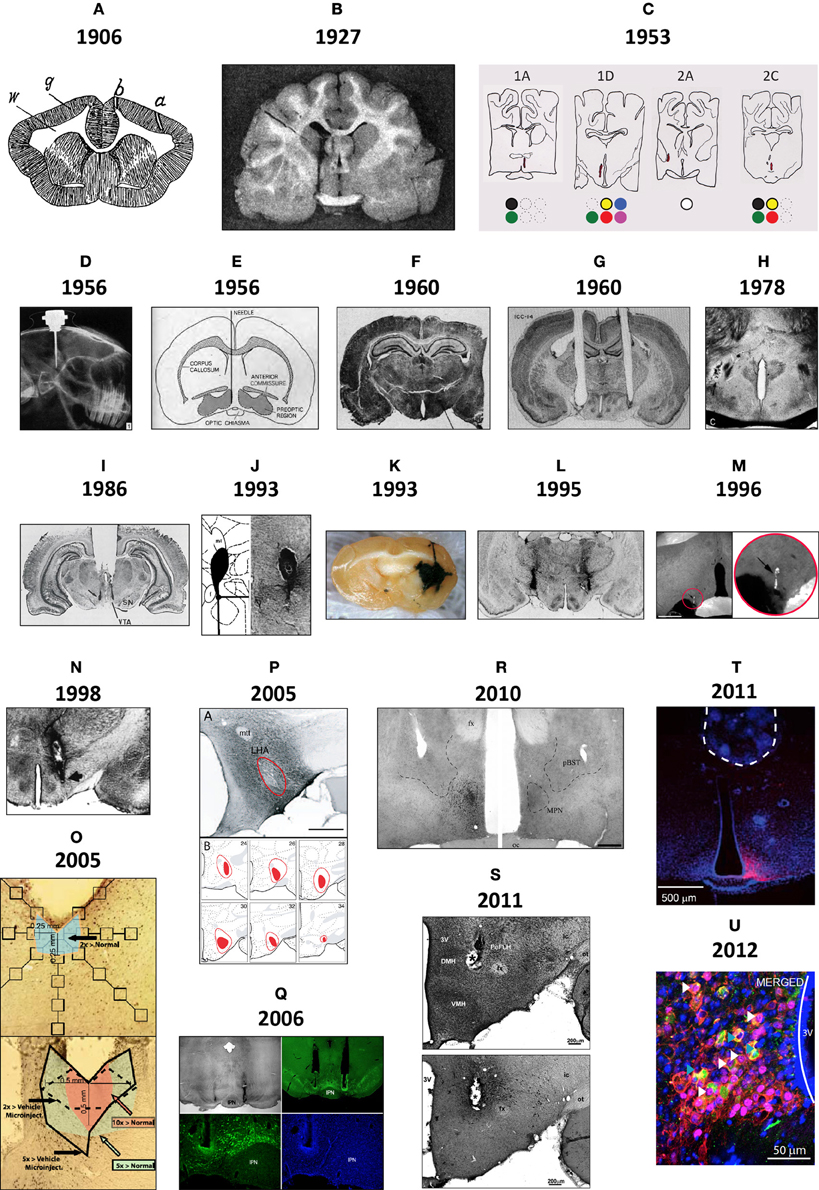
Figure 1. (A) This drawing is of a frontal section from a rabbit, first published in 1906 by Samuel S. Maxwell at the University of California (Maxwell, 1906b). It shows injection sites made into the cerebral cortex, either at the superficial level of the upper gray (g) matter (needle track shown by a), or more deeper into the white (w) matter (needle track shown by b). Injections of calcium oxalate were made to evoke movements in the animal; these were only observed with injections into the white matter. Maxwell also performed similar experiments on cats. (B) This drawing is Figure 1 of Demole (1927), which provides a view of how injection sites were marked. CaCl2 injections were made into the anterior hypothalamus of cats to produce sleep. Note the needle track and its final termination, the injection site, are marked by black dye that was included in the CaCl2 solution at the time of injection. Formalin-fixed tissue was used so that the tissue was relatively clear of blood, and gross anatomical landmarks were used within the tissue to aid in documenting the location. (C) A portion of the hand drawings included in the unpublished medical school thesis of Eglin (1953), reproduced here with permission. Needle tracks are colored red in each drawing. The colored dots have been added by the present author to denote the observations Eglin recorded for each of the corresponding injections: white circles: no effect; black: pupillary dilation; green: locomotion; yellow: piloerection; red: growling; blue: licking; magenta: salivation. (D) X-ray image of guide cannula and injector assembly within a rabbit test subject's skull; the acrylic holding the assembly has been drawn on the image as a white outline (von Euler and Holmgren, 1956). (E) A diagram showing the representative location of Fisher's injection placements (1956) in the medial preoptic region to trigger switching between sexual and maternal behaviors in male rats (the diagram is from a review by Fisher published in 1964). (F) The Nissl-counterstained photomicrograph included in Grossman's report (1960) of norepinephrine feeding following crystalline administration of norepinephrine or carbachol into the perifornical hypothalamus. (G) The Nissl-counterstained photograph showing needle tracks from the studies of Epstein (1960b). (H) A modification of the Klüver–Barrera stain was used by Leibowitz (1975) to stain the tissue from subjects given amphetamine injections in to the lateral hypothalamus. This photo is from Figure 2C of her study. (I) Representative injection site in the vicinity of the ventral tegmental area, from Figure 4C of Cador et al. (1986), where enkephalin injection stimulated food intake. (J) Injection site and accompanying map (from Paxinos and Watson, 1986) where 10 nl of NPY was injected into the perifornical hypothalamus to stimulate food intake (from Stanley et al., 1993a,b,c). (K) Beta-galactosidase-stained needle track and injection site marking extent of viral induction following injection of an adeno-associated virus by Davidson et al. (1993) within an unstained brain. (L) Bilateral injection sites where the GABAA receptor agonist, muscimol, was injected into the lateral hypothalamus to attenuate feeding produced by subsequent injections of glutamate receptor antagonists into the nucleus accumbens within the same animal (Maldonado-Irizarry et al., 1995). (M) Injection site produced by Scammell et al. (1996) within the preoptic region where prostaglandins induce a febrile response; the injection site is marked by fluorescent beads (enlarged by the present author in the inset to the right). (N) Injection site in the perifornical hypothalamus where cyclic AMP analogs stimulate feeding (Gillard et al., 1998). (O) Example of a vehicle-injected (top) and DAMGO-injected (bottom) subject stained for Fos; Fos “plume” areas, as measured by the authors, are indicated diagrammatically (from Peciña and Berridge, 2005). (P) Fluorogold injection site and accompanying maps in Swanson atlas space (Swanson, 1999) reported by Petrovich et al. (2005), which retrogradely labeled neurons subsequently examined for activation responses during cue-initiated feeding. (Q) Injection site characterization within the ventral tegmental area by Hommel et al. (2006; from their supplementary data) using immunocytochemistry staining patterns for tyrosine hydroxylase (green panels) and the nuclear stain, DAPI (blue). (R) Injection sites marked by immunostaining for the androgen receptor following delivery of either vehicle (right side) or testosterone (left side); from Williamson et al. (2010) (S) Photomicrographs reproduced from Lin et al. (2011) in which a Nissl stain has been applied to a tissue section to help localize an injection site made into the medial hypothalamus (S, top), along with an adjacent tissue section stained for the peptide hypocretin/orexin (S, bottom). (T) Location of the optical fiber used to drive Channelrhodopsin-2 (ChR2)-expressing AgRP neurons in the mouse arcuate hypothalamus and stimulate feeding behavior. This fluorescence photomicrograph shows the ChR2-expressing neurons in red, as visualized by the reporter molecule, mCherry. The tissue has been counterstained blue using the nuclear label, DAPI. From the supplementary data in Aponte et al. (2011). (U) Fos activation (magenta) in POMC neurons (green) transduced with Channelrhodopsin-2 (tdtomato reporter expression; red) in the mouse ARH (from supplementary data in Atasoy et al., 2012). Figures are reproduced with permission of their original publishers, as noted here: Panel (D) (John Wiley & Sons, Ltd.); (E) (Scientific American); (F) (The American Association for the Advancement of Science); (G) (The American Physiological Society); (H,I and S) (Elsevier); (J,L–P, and R) (Society for Neuroscience); (K,T and U) (Nature Publishing Group); and (Q) (Cell Press, Inc.).
Bengt Andersson in Sweden first demonstrated the intracranial chemical control of a motivated behavior by showing that drinking behavior could be elicited by sodium chloride injections into the goat diencephalon (Andersson, 1952, 1953; Andersson et al., 1958). In 1954, Andersson's student, Stig Larsson, reported that an intrahypothalamically injected sodium chloride solution also triggered feeding in sheep or goats. In the wake of these findings, two Yale University laboratories, directed by Neal Miller and Paul MacLean, respectively, began exploring central injection techniques (see Miller et al., 1955, 1956; Miller, 1956, 1957, 1965, 1992; MacLean, 1957a,b). In 1953, James Eglin, Jr., a MacLean lab student, provided in his completed medical school thesis what was perhaps the first anatomic documentation of injection sites producing autonomic responses by chemical injection. Unfortunately, Eglin's drawings (some reproduced for the first time in Figure 1C) were never published. von Euler and Holmgren (1956) took X-ray images of the implanted skull (Figure 1D) to show cannula locations for their thyroxine injections into the anterior pituitary, which inhibited radiolabeled iodine release from the thyroid gland. That same year, Fisher reported that intrahypothalamic testosterone induced nest building and “maternal care” behaviors in male rats; conversely, co-injected estrogen and progesterone induced heat in female rats (Fisher, 1956 also see Fisher, 1964; Figure 1E). Also, intrahypothalamically grafted ovary fragments (to introduce estrogen) suppressed rat gonadotropin secretion (Flerkó and Szentágothai, 1957).
In 1960, Sebastian Grossman, a Miller lab graduate student, reported that feeding or drinking could be elicited in rats receiving intrahypothalamic crystalline deposits of norepinephrine (NE) or carbachol, respectively. In parallel work, Alan N. Epstein at the University of Pennsylvania reported similar findings, albeit with procaine hydrochloride, hypertonic saline, and dextrose; substances without “neurotransmitter” actions (Epstein, 1960a,b). Both investigators photographed injection sites within Nissl-stained tissue (Figures 1F,G). Although many have used Nissl stains to help visualize injection site locations in brain tissue, a few have combined these with other treatments. For example, Leibowitz (1975) used a protocol (Wolf and Yen, 1968) modified from the original method of Klüver and Barrera (1953) to visualize anterior lateral hypothalamic sites where amphetamine suppresses feeding in rats, by labeling cells (using a Nissl stain) and myelin sheaths (using Luxol Fast Blue) in the same tissue (Figure 1H). Finally, extending work done by the Stanley laboratory establishing a role for glutamate and its receptor agonists in feeding control through actions within the lateral hypothalamic area (Stanley et al., 1993a,b,c, 1996; Khan et al., 1999, 2004; Duva et al., 2001, 2002, 2005; Hettes et al., 2003, 2007, 2010; see Stanley et al., 2011), Li et al. (2011) have carefully delineated the locations of feeding-sensitive sites for the glutamate receptor agonists NMDA and AMPA by using rigorous methods for situating the locations of their hypothalamic injections that triggered feeding behavior (Figure 1S).
2.2.1. A note on peptides and feeding
The 1970s marked early efforts to deliver peptides, such as insulin, directly into the hypothalamus (Debons et al., 1970; Panksepp and Nance, 1972). Crystalline insulin deposited into the ventromedial hypothalamus reduced food intake in normal and diabetic rats (Hatfield et al., 1974). In contrast, β-endorphin stimulated feeding when injected into this region (Grandison and Guidotti, 1977). Documenting peptide injection sites gained currency in the 1980s. Cador et al. (1986), for example, found enkephalin injected into the VTA had a marked effect on feeding (Figure 1I). Similarly, following reports that intracerebroventricular neuropeptide Y (NPY) injection stimulated food intake (Clark et al., 1984; Levine and Morley, 1984), Stanley and Leibowitz (1984) reported feeding produced by NPY injected directly into the hypothalamic paraventricular nucleus (also see Stanley et al., 1986), and that the perifornical hypothalamus is the region most sensitive to NPY's effects on feeding (Stanley et al., 1993a,b,c) (Figure 1J). Several studies have since reported feeding induced or suppressed by peptides, including: bombesin, cholecystokinin, hypocretin/orexin (H/O), Agouti-related peptide (AgRP), melanin-concentrating hormone, alpha-melanocyte stimulating hormone, and ghrelin (reviewed by Kalra et al. (1999); Berthoud and Morrison (2008)].
2.3. A Century of Maps
For ICI methods, issues concerning the spread of injected solutions led to scientists using more sophisticated “cannula mapping” strategies to isolate the site(s) most sensitive to the autonomic or behavioral effects of injected solutions. Any injection site photographs included in these studies were now accompanied by location data “mapped” to standardized brain atlases.
2.3.1. Early maps
Demole (1927) not only published some of the earliest photographs of brain injection sites (see Section 2.2), but also the first detailed “map” of sites in the cat hypothalamus where injections produced sleep (Figure 2A). This work also included what is possibly the first documentation of effective and ineffective injection sites in relation to gross anatomical landmarks on the ventral surface of the brain. The two types of site were mapped to opposite sides of the midline for diagrammatic purposes; stylistically, this use of mirrored hemispheres finds currency in later injection site maps (e.g., Stanley et al., 1993a,b,c). Comparing Figure 1A with Figure 2A, it is clear that although Demole cut brains in the coronal (transverse) plane, the “map” is in the horizontal plane. Therefore, the clearly subjective transformation involved to map the sites from one plane to another likely introduced a degree of inaccuracy.
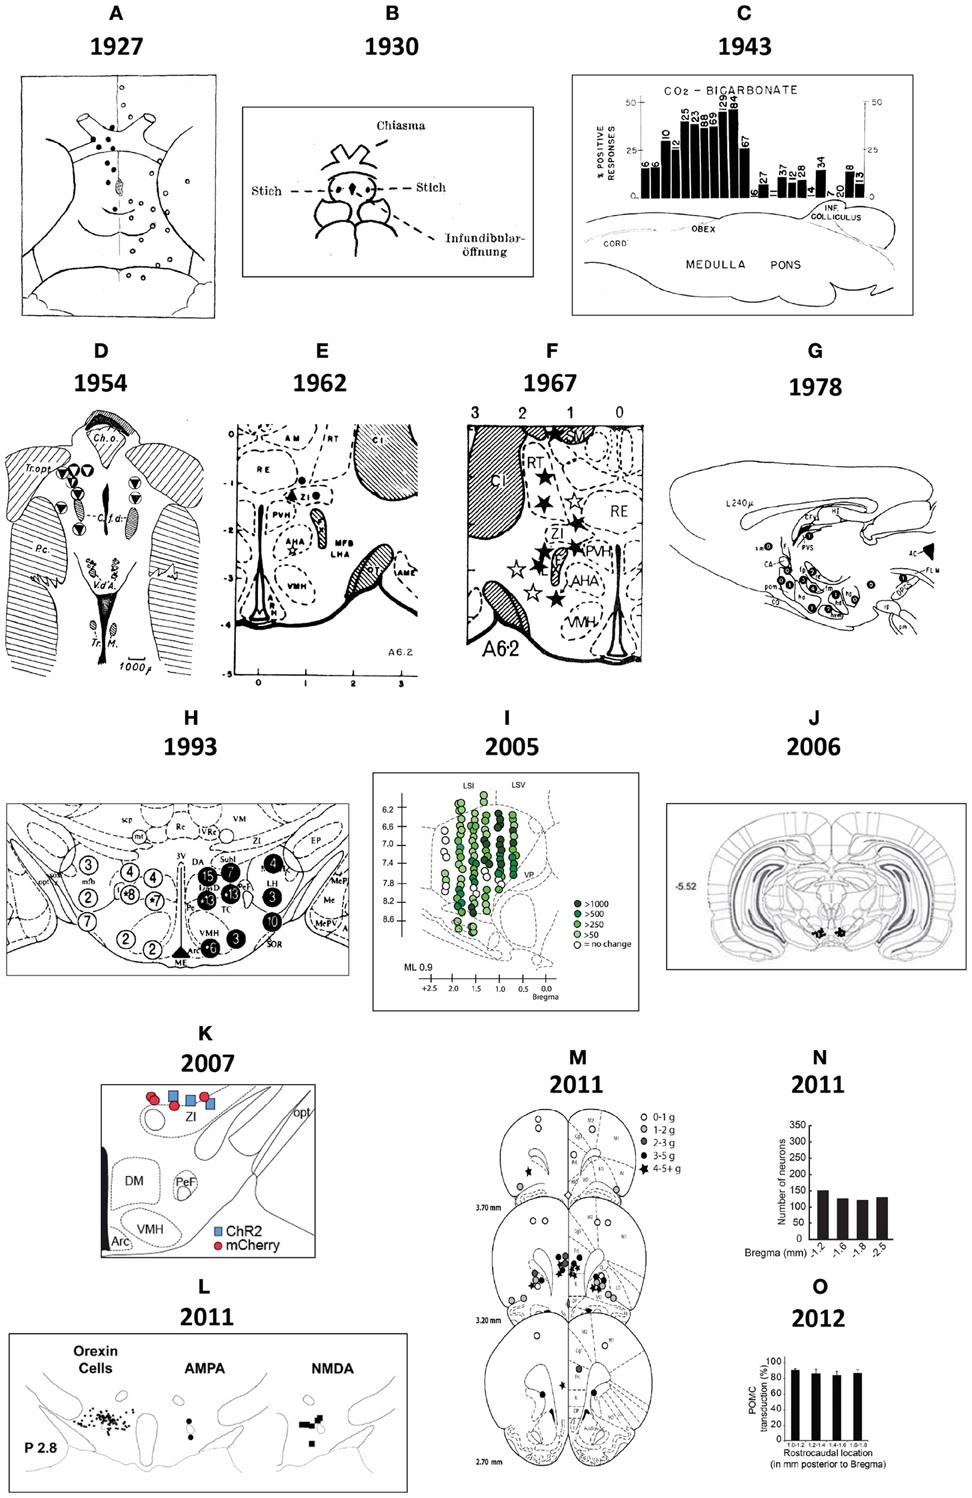
Figure 2. (A) This drawing is Figure 9 of Demole (1927), which provides what is likely the first published map of central chemical injection sites for the hypothalamus. CaCl2 injections were made into the anterior hypothalamus of cats to produce sleep. The ventral surface of the brain is shown, with locations of effective (black circles) and ineffective (white circles) injection sites. Note that the effective injection sites cluster near the optic chiasm and optic tracts, in the vicinity of the preoptic area and the anterior hypothalamus. (B) Drawing of injection sites near the infundibular region from the study by Clöetta and Fischer (1930). The labels are in the German language; injection sites are labeled “Stich.” (C) A generalized diagram by Comroe (1943) showing functional activation of respiration as a result of injections of bicarbonate solutions into various hindbrain locations. The responses are plotted in relation to the sagittal drawing below them to denote from where the responses were elicited. (D) This drawing is Figure 11 of Larsson (1954), which shows injection sites where sodium chloride administration was effective in triggering food intake (white circles with black triangles) or rumination (black circles with white triangles) in a goat. The injection sites are mapped with respect to “gross anatomic” visualizable space, as described in the text. Abbreviations: C. a., anterior commissure; C. f. d., columna fornix descendens; Ch. Opt., optic chiasm; C. M., mammillary body; Hyp, hypophysis with pars post. and pars ant. being the posterior and anterior pituitaries, respectively. M. i., massa intermedia; T. M., tractus Meynert; V. d'A. = mammillothalamic tract. (E–G). These maps are from successive studies (Grossman, 1962; Booth, 1967; Leibowitz, 1978) attempting to resolve the effective stimulation sites where norepinephrine produces feeding. The first two maps (E,F) are plotted to the reference atlas of de Groot (1959a,b) and are directly comparable. In (E), filled circles are indicative of positive effects of adrenergic and cholinergic stimulation; white stars indicate cholinergic effects; black triangles represent negative placements. In (F), effective sites are solid stars; ineffective sites are open stars. In contrast, the sagittal map (G) furnished by Leibowitz (1978) is from the atlas of König and Klippel (1963). Numbers on the map in (G) indicate grams of food intake consumed following an injection in to that site. (H) Figure 3 of Stanley et al. (1993b) is partly reproduced and shown. The figure shows a portion of the Paxinos and Watson (1986) reference atlas, with locations of injection sites (circles) diagrammatically superimposed on a portion of the atlas plate. Numbers within the circles indicate grams of food intake following injection of a 10 nl solution containing 78 pmol of neuropeptide Y into the locations beneath each number. Note that the numbers on the left hemisphere (in white circles) correspond to 1 h food intakes following injection, whereas numbers on the right hemisphere (in black circles) correspond to 4 h food intake scores. (I) A sagittal map from the atlas of Paxinos and Watson (1998) showing effective feeding stimulation sites following injections of the μ-opioid agonist, DAMGO, into the nucleus accumbens by Peciña and Berridge (2005). The scale listed denotes the color scheme to show increasing magnitudes of food intake consumed. (J) Cannula placements within the ventral tegmental area where leptin injections were examined for their ability to reduce food intake. From Hommel et al. (2006). (K) A map of cannula placements for mice transduced with Channelrhodopsin-2 constructs within neurons expressing hypocretin/orexin, included as supplementary material for the study by Adamantidis et al. (2007). Optical fibers were inserted to stimulate these neurons and wake mice up from sleep. Blue squares denote animals with Channelrhodopsin-2 expression; red circles denote controls that displayed only reporter molecule expression (mCherry). (L) Camera lucida drawings of locations of hypocretin/orexin neurons in relation to injection sites locations where NMDA and AMPA stimulated food intake. From Li et al. (2011). (M) Injection sites in the vicinity of the ventromedial prefrontal cortex, from Mena et al. (2011), mapped onto Paxinos and Watson atlas space, where DAMGO injections triggered food intake. The legend shows the symbols and the amount of food intake denoted by each. (N) Distribution of ChR2-expressing AgRP neurons in mice optically stimulated to eat voraciously. The numbers of transduced neurons are plotted in relation to inferred stereotaxic coordinates to align their location with mouse brain atlas plates. From the supplementary data accompanying the report by Aponte et al. (2011). (O) Distribution of POMC neurons expressing the DREADD, hM4D in a Pomc-Cre mouse, from the study by Atasoy et al. (2012). The distribution is plotted along Bregma coordinates using inferred stereotaxic space. All figures are reproduced with permission of their original publishers, as noted here: Panels (C and E) (American Physiological Society); (D) (John Wiley & Sons, Ltd.); (F) (American Association for the Advancement of Science); (G,H,L,M) (Elsevier/Dr. Brian A. Baldo); (I) (Society for Neuroscience); (J) (Cell Press, Inc.); (K,N,O) (Nature Publishing Group).
Clöetta and Fischer (1930) supplied a similar map, albeit with fewer injection sites, for their injections of inorganic salts into the infundibular region of rabbits, rats and cats; to examine effects on respiration (Figure 2B). Like Demole (1927), they found that calcium chloride injections produced somnolence. However, Myers (1974) noted that their large injections (12–50 μl) likely resulted in their entry into the ventricles. Comroe (1943) performed an extensive study of the hindbrain respiratory center of 115 cats, each anesthetized in a stereotaxic frame so that chemical injections (bicarbonate, acids, potassium chloride, acetylcholine, nicotine, strychnine) could be documented in stereotaxic space. Rather than photograph each injection site (a task not feasible for so many subjects), Comroe reported the physiological outcomes of these experiments in the form of a functional map, shown in Figure 2C. Larsson (1954), who provided the first evidence that food intake can be controlled through chemical manipulations, also published the first map of effective feeding stimulation sites in the brain. In this study, the skull of the subject was first visualized by X-rays to record where the embedded steel needles were located. Effective injection sites lay posterior to the optic chiasm and lateral to the fornix (Figure 2D).
2.3.2. Anatomical specificity and central injections
During the late 1960's and early 1970's, controversy surrounded ICI methods from the gradual realization in the scientific community that centrally injected carbachol and angiotensin II triggered drinking behavior that, in fact, was not necessarily due to actions within deep brain tissue sites, but because of actions through the ventricular system of the brain upon circumventricular structures such as the subfornical organ (Baxter, 1967; Myers and Sharpe, 1968; Montgomery et al., 1969; Epstein et al., 1970; Routtenberg, 1972; Singer and Montgomery, 1973; Johnson and Epstein, 1975; Epstein, 1978). Although space precludes detailed review of the shifting tides of this discussion during that period of time, the lessons learned from this controversy may be summarized as follows (see also Wise and Hoffman, 1992): (1) anatomical specificity of an injection site requires careful controls, especially since injected solutions can diffuse up and around the cannula needle and spill into the ventricular circulation if the needle has traversed through the ventricular compartment; (2) the injection volume will determine its likelihood of entry into the ventricular system, especially if injections are near the ventricles; (3) careful “mapping” experiments are necessary to provide a convergence of evidence that the concluded “site of action” for a substance is indeed the most sensitive site. This lesson is exemplified by the discussion in the next section concerning the locus of noradrenergic actions to produce feeding. As we shall see, careful cannula mapping studies were conducted in successive fashion by a few investigators to gradually refine the map of effective sites where NE injections triggered food intake.
2.3.3. Mapping the feeding effects of norepinephrine (NE)
Following Grossman's (1960) report (see Section 2.2), the locations of hypothalamic loci effective for noradrenergic feeding were refined. Grossman (1962) published a more detailed set of data concerning the effects of carbachol and NE on feeding and drinking, respectively; which included a map of effective and ineffective injection sites (Figure 2E). These sites were plotted onto Jacob de Groot's stereotaxic rat brain atlas, first published for the whole forebrain in August of 1959, and then specifically for the hypothalamus in December of the same year [de Groot (1959a,b)]. The atlas plates for the hypothalamus were sampled at slightly better than twice the resolution of Wendell Krieg's 1946 atlas (the only other published for the rat brain at the time), and provided greater detail. (Apparently, Krieg had a more detailed rat brain atlas he had prepared in 1935, but which he had never published; see Krieg, 1975, p. 80). Importantly, Grossman (1962) set a new standard for mapping the effects of centrally injected compounds into the brain on food intake. Documentation using the de Groot atlas allowed for reproducibility and re-examination of the same brain regions by others with greater precision. However, as for the first report (Grossman, 1960), NE crystals were tapped into the cannula, preventing precise determinations of effective concentrations in vivo (see also Routtenberg, 1972; Wise and Hoffman, 1992).
In 1990, Booth, a biochemist in Neal Miller's lab, mapped the effects of centrally injected NE, dissolved in solution, on food intake. Locations plotted on de Groot plates allowed direct comparisons to be made with Grossman's (1962) study (Figures 2E,F). Booth showed that a hypothalamic region anterior and medial (A6.2, A6.6; Figure 2F) to Grossman's reported site (A5.4; Figure 2E) was the most sensitive site for adrenergic agonists to stimulate feeding. It is unclear whether Booth's injection volume (0.675 μl) delivered more or less NE than Grossman's crystal deposits did, but is perhaps a main reason why their results differ with respect to the site of action for NE. Indeed, data from Wagner and de Groot (1963) supported Grossman's finding that the lateral hypothalamus was a sensitive site, but large injection volumes (5 μl) were used. Using 1.0 μl NE, Slangen and Miller (1969) published histology (but not atlas plots) that generally confirmed Booth's anterior and medial locus for the feeding effects of NE, but also concluded that the perifornical region, in the vicinity of their injections, was likely to be a sensitive site. In contrast, Davis and Keesey (1971), who mapped their NE injections (0.5–1.0 μl) using the rat brain stereotaxic atlas produced by König and Klippel (1963) did not find the perifornical locus to be sensitive. Leibowitz (1978) published a systematic injection mapping study in over 500 animals across 35 separate locations within and outside of the hypothalamus. Using 0.5 μl of NE, she confirmed Booth's observations that the most sensitive site was in the medial and not lateral hypothalamus, and further provided compelling evidence that the area most sensitive was within the paraventricular nucleus of the hypothalamus (Figure 2G).
2.3.4. Mapping the effects of peptides on feeding behavior
In Section 2.2, selected studies were highlighted that reported the acute control of feeding by peptide injections. Feeding stimulation sites have been mapped for opioids (Woods and Leibowitz, 1985; Stanley et al., 1988; Bakshi and Kelley, 1993; Peciña and Berridge, 2000, 2005; Smith and Berridge, 2005; Mena et al., 2011, 2013), H/O (Dube et al., 1999; Sweet et al., 1999); and AgRP (Kim et al., 2000), among many others. Similarly, the feeding-suppressive effects of several peptides have been mapped or at least partially localized, including bombesin (Kyrkouli et al., 1987); α-melanocyte stimulating hormone (Kim et al., 2000); cholecystokinin (Blevins et al., 2000); glucagon-like peptide 1-(7-36) amide (Schick et al., 2003), and pituitary adenylate cyclase-activating polypeptide (Resch et al., 2011). Below, NPY feeding stimulation is examined in detail.
2.3.4.1. NPY and feeding: spatial considerations. Stanley et al. (1993b) undertook an extensive cannula mapping study to identify hypothalamic sites sensitive to the orexigenic effects of NPY. Injections (78 pmol) were made in the very small volume of 10 nl into 47 brain regions in rats fed to satiety prior to injection, and food intake was measured 1 and 4 h post-injection. An area centered on the perifornical hypothalamus at the level of the caudal paraventricular hypothalamus was identified as a site where NPY exerted its most powerful effects on food intake, producing about 12.5 g of intake within the first hour. Additional sites near this locus also displayed strong sensitivity to NPY's orexigenic effects. Figure 2H shows some of these NPY-sensitive sites at the level of the dorsomedial hypothalamus (DMH).
To determine how far 10 nl of injected solution spread to sites surrounding the injection site, Stanley et al. (1993b) also injected 10 nl of radiolabeled neuropeptide Y ([125I]-NPY) into the perifornical hypothalamus and tracked the anterior-posterior spread of the injected solution in sections taken at 100 μm intervals from the injection site. Radioactivity from these sections was measured as a function of both time and distance from the injection. In addition, an attempt was made to account for 100% of the radiolabel in the experiment by carefully measuring the radioactivity in the tissue as well as residual radioactivity associated with the guide cannula itself. Approximately 95% of the total amount of radiolabel was accounted for by its presence in the tissue and cannula, and 100% of the tissue label could be recovered at distances no more than 0.8 mm from the injection site. Importantly, 95% of this label spread to as little as 400 μm away from the injection site (Figure 3). As we shall see in Section 4.4.9, several approaches have been used to track the spread of an injected solution using various labeling strategies. However, this study has remained unique in using such small volumes to do so, and by using the same peptide that was producing the observed behavior. In Section 4, these unique data will be integrated within a spatial analysis of possible neural substrates underlying NPY-induced feeding behavior.
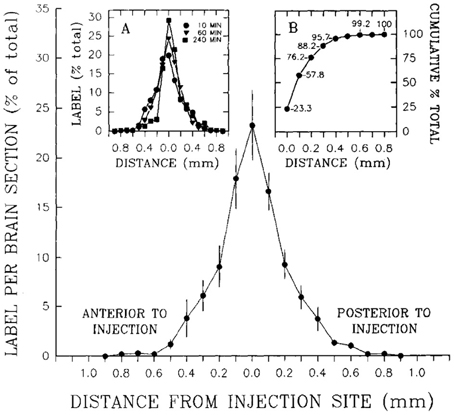
Figure 3. A reproduction of Figure 2 of Stanley et al. (1993a,b,c), which describes the relationship between the percent recovery of radiolabeled neuropeptide Y (10 nl) within brain tissue 10 min following its injection into the brains of rats. The percent recovery values are plotted against distance from the injection site in millimeters. Brain tissue sections were taken at 0.1 mm intervals from each injection site and the amount of radioactive NPY analyzed. The left inset in this figure (labeled A) shows the same relationship, but with 10, 60, and 240 min recovery times compared. The right inset (labeled B) shows the cumulative recovery of the radioactive peptide in relation to the distance at which the recovery was achieved; the numbers indicate cumulative percent recovery values. Note that the distance scale marks only the spread of the solution along the anterior-posterior axis, and does not speak necessarily to movement of the injected solution along any other dimensions. Reproduced with permission from Elsevier.
2.3.4.2. Opioids and feeding: spatial and functional considerations. Studies from the Berridge laboratory delineated novel feeding-sensitive subregions of the accumbens and ventral pallidum using a variety of carefully designed anatomical validation approaches. These were based on a novel functional approach to examine centrally injected chemical solutions first developed by Peciña and Berridge (2000), based on the detection of the transcription factor, Fos, in neurons following their activation by stimuli (Morgan et al., 1987; Sagar et al., 1988). The authors reasoned that although the diffusion of injected chemical solutions are difficult to track in vivo, and difficult to infer post-mortem from an injection site alone, they could track the functional activation of receptors at the injection site using Fos to mark neurons actively affected by the injections. Although the Fos transcription factor is a neuronal activation marker, its induction is not invariably correlated with increases in neuronal firing rates (Luckman et al., 1994; Watts et al., 2006). However, although this has not been examined systematically across several different brain regions, the association between Fos induction and neuronal activation is often assumed to be strong (Fos as a functional marker is discussed further in Section 4.4.8).
The authors used Fos immunohistochemistry to track neuronal activation in the injection site vicinity, and reasoned that by “subtracting” from their maps those Fos patterns that did not correlate with the appropriate behavior, they would isolate activation positively linked to the injections producing the behavior. From their behavioral experiments, they found that opioid receptor agonist injections into the shell of the nucleus accumbens triggered food intake. Morphine injections into this “eating site” also increased hedonic responses to an oral glucose solution, but failed to significantly change aversive responses to oral quinine infusions. “Fos plume” patterns marked a circumscribed area of the nucleus accumbens shell where hedonic reactions to sucrose were enhanced by intra-accumbens morphine. In a follow-up study, Peciña and Berridge (2005) furnished maps of the sites where hedonic and aversive reactions were affected by intra-accumbens injections of DAMGO, the synthetic enkephalin analog that is a μ-opioid receptor-selective agonist (Figures 1O, 2I). Importantly, for these studies, the authors were careful to point out that the Fos-expressing cells were not necessarily being activated directly by the injected opioids acting at opioid receptors on those cells. Indeed, evidence exists for both excitatory and inhibitory actions of opioids on neuronal excitability and synaptic transmission in the nucleus accumbens (Yuan et al., 1992; Chieng and Bekkers, 2001). Opioids are also capable of exerting disinhibitory actions by inhibiting interneurons synaptically interacting with local circuit neurons, which are thereby indirectly excited (e.g., see Zieglgänsberger et al., 1979). These caveats notwithstanding, the activation patterns did indicate that only a circumscribed set of neurons in the vicinity of the injection site was being recruited by the chemical injections.
Smith and Berridge (2005) used the Fos plume functional mapping procedure to examine the effects of opioids on feeding and reward mechanisms in the ventral pallidum. Injections of DAMGO had differential effects on hedonic “liking” reactions to sucrose, depending on whether the injections were centered in the posterior ventral pallidum (increased “liking”) or the anterior or central ventral pallidum (where “liking” reactions were suppressed). Similarly, DAMGO increased food intake in a parallel fashion, increasing feeding in the posterior ventral pallidum, but suppressing it when injected into the other subregions. Additionally, the authors found that injections of the GABAA receptor antagonist, bicuculline, increased feeding at all ventral pallidum sites tested, but failed to enhance sucrose hedonic responses at any of them.
In addition to these findings, the authors extended the methodological approach of Peciña and Berridge (2000) in a number of important ways. First, the authors sought to define the boundaries of the ventral pallidum by immunohistochemically labeling the region using antibodies against leu-enkephalin in three planes of section, which is a peptide enriched in this region. They opted to document the immunolabeling patterns on a horizontal atlas level, since this plane of section includes a more or less complete representation of the ventral pallidum within one atlas section, thereby facilitating a simpler mapping template on which to plot all of their injections. Second, using the coronal atlas level of Paxinos and Watson that best fit with the section containing their injection site, the authors then defined the mediolateral and dorsoventral coordinates of the injection site off of the coronal atlas level axes (in mm). For the dorsoventral coordinate, the authors marked their injection sites with ink and then delineated the “center” of the injection site along the dorsoventral axis as the midpoint between the bottom of the microinjector needle and the furthest extent of the ink spread directly below the needle. In this fashion, they estimated sagittal and horizontal mappings for their coronal placements, in order to derive three-dimensional maps of injection site center points. For determinations of the anteroposterior atlas level, they noted cases that fell between atlas levels and chose the midpoint between two levels as the coordinate for the “between level” sections.
All of these approaches are noteworthy in that they impart to the reader the serious commitment the authors made in trying to document their placements to the best degree of certainty (for further details regarding the challenges of mapping these injection sites, please see Section 4 of Richard et al., 2013). A few additional improvements notwithstanding, these approaches stand out for the significance the authors place on experimental documentation as seen from the multiple sets of information provided: immunolabeling, ink deposits, Fos plumes, mapping along one plane of section rigorously, and extrapolations to additional planes of section. Minor “wish list” items that could have been added to these excellent approaches include: explicit delineations by symbols of those placements for which anteroposterior estimations fell between atlas levels (also see the concluding discussion of Section 4.6.1); tabulated data concerning the deviations of three dimensional physical coordinates for injection site centers from true, measured stereotaxic coordinates used to implant the cannulas; and a representative photograph of a brain section after ink has been injected. Overall, however, these studies constitute a signal example of how anatomical considerations can enrich any functional or behavioral study; indeed, the authors have set a higher standard by the thoughtfulness of their approach.
2.3.4.3. Using phospho-STAT3 to track microinjected leptin. Scientists have taken advantage of the fact that the adipose-derived hormone, leptin, activates specific signal transduction pathways with molecules that can be used as inducible markers of activation. For example, the spread of leptin following its microinjection into specific brain regions can be evaluated by monitoring the phosphorylation of STAT3 using a phospho-specific antibody raised against this molecule. Phospho-STAT3 labeling has been observed, for example, following injections of leptin into the VTA of mice (Hommel et al., 2006).
3. IGI Methods: Applications to Feeding Control and Discussion of Technical Issues
3.1. IGI Methods and Feeding
Since the introduction of intracranial gene-directed strategies to drive expression of specific constructs into the brain using viral vectors, a number of investigators have used this approach to examine feeding and other motivated behaviors. Initial viral delivery strategies incorporated reporter molecules, such as β-galactosidase, to mark injection sites where virus was delivered (Davidson et al., 1993; Figure 1K). Table 2 highlights IGI methods used to study feeding control, including in vivo site-specific recombinase technology (Balthasar et al., 2005; Donato et al., 2011; Wu et al., 2012; Zhan et al., 2013) and viral-mediated expression or RNAi techniques. For example, Hommel et al. (2006) injected a construct that knocked down the leptin receptor gene, Lepr, in the VTA and produced altered feeding effects. The injection sites were carefully documented with respect to tyrosine hydroxylase-immunolabeled cell populations of the VTA and nearby substantia nigra (Figures 1Q, 2J), and also by phospho-STAT3 activation patterns (Section 2.3.4.2).
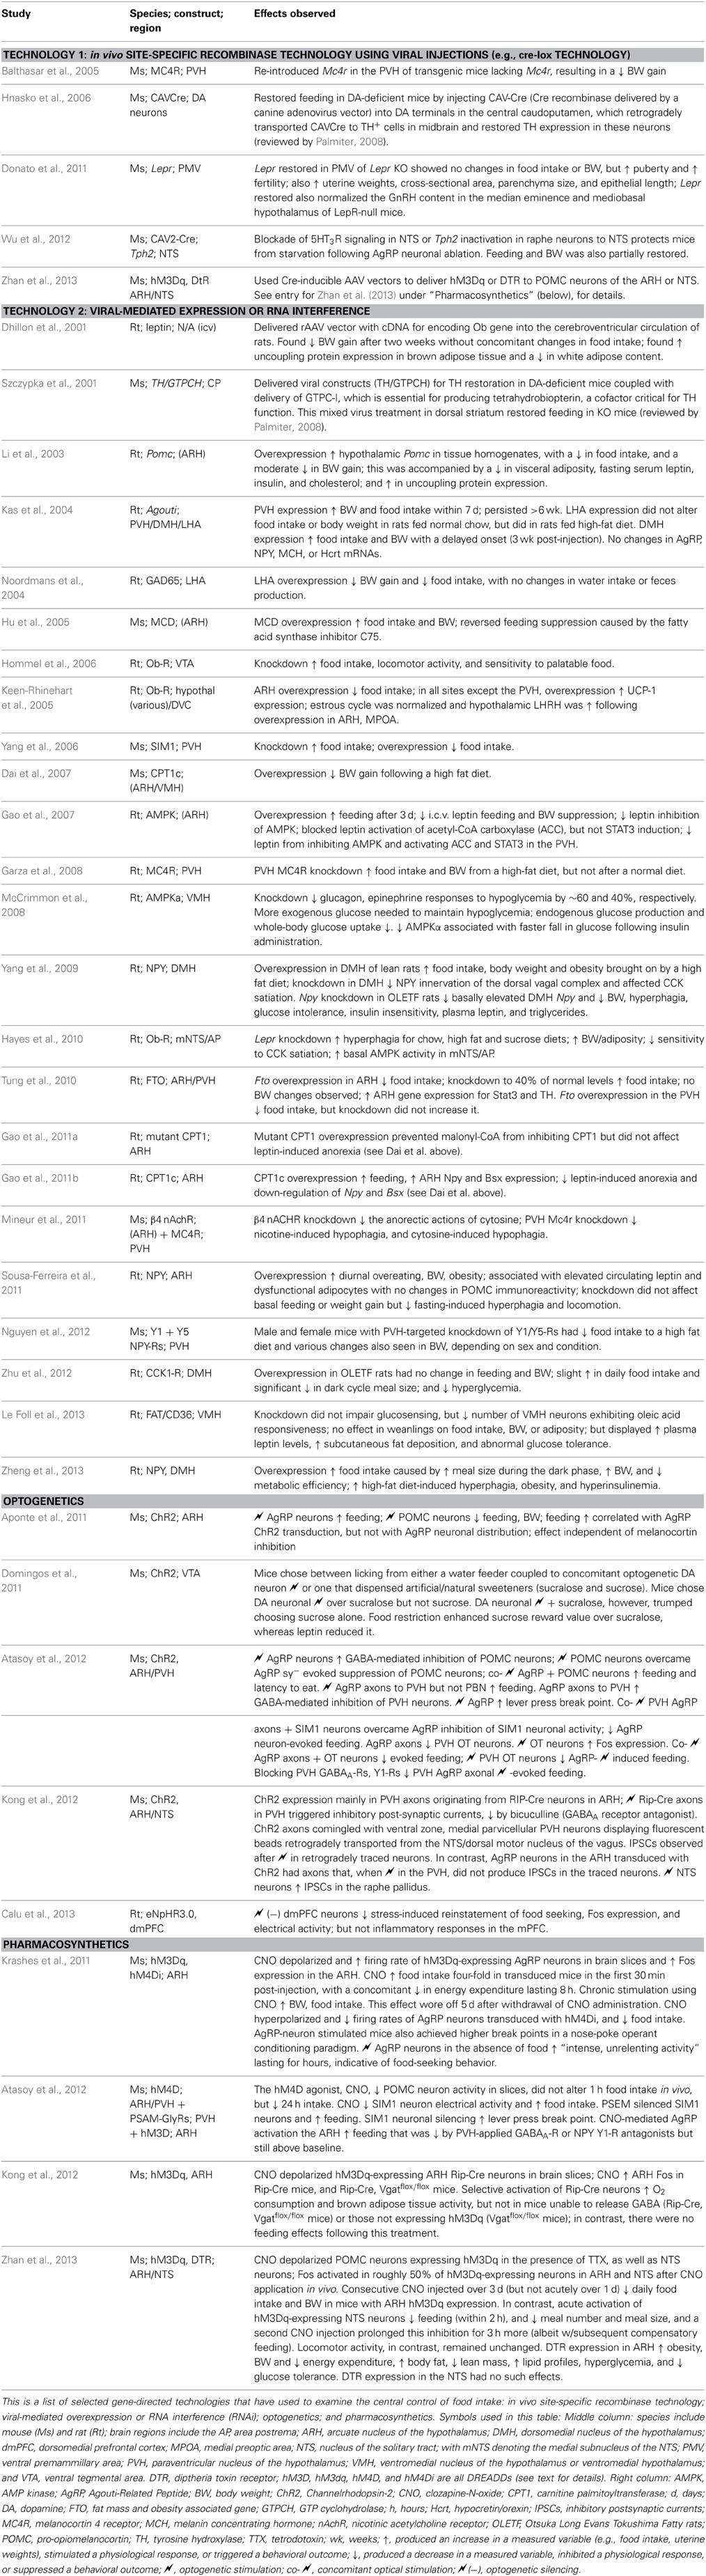
Table 2. Transgenic technologies employed in selected IGI studies on feeding control.
More recently developed IGI methods include optogenetics and pharmacosynthetics (Table 2). The first demonstration of acute, optogenetically-driven behavioral control in a rodent model was reported by the de Lecea laboratory at Stanford University, who demonstrated that optogenetic stimulation of H/O neurons in mice was sufficient to wake them up from sleep (Adamantidis et al., 2007; see also Carter et al., 2013). Figure 2K shows their cannula placement map for mice transduced with Channelrhodopsin-2 (ChR2) in H/O neurons, and control rats transduced only with the reporter molecule, mCherry; plotted in relation to the subthalamic region and hypothalamus. Others have since used optogenetic methods to probe hypothalamic substrates to control other behaviors. For example, the Anderson laboratory delineated a ventromedial hypothalamic “locus” controlling aggression and documented their optical fiber placements [(Lin et al., 2011); reviewed by Anderson (2012)]. Konadhode et al. (2013) also showed that optogenetic stimulation of melanin concentrating hormone neurons increases sleep. Nieh et al. (2013) have presented a cogent summary of recent optogenetic work demonstrating a role for key loci throughout the brain in controlling motivated behaviors.
In relation to feeding behavior, a few studies using optogenetics and pharmacosynthetics have now been published (Table 2), a few of which will be noted here. Aponte et al. (2011) inserted ChR2 constructs into AgRP-containing neurons within the mouse arcuate hypothalamus. Activation of the transduced neurons triggered a robust feeding response. In their study, an optical fiber placement was documented over transduced neurons (Figure 1T), and maps of the mouse brain were provided upon which the total numbers of neurons transduced with ChR2 were indicated. A summary of these cell counts was also plotted with respect to Bregma coordinates from the corresponding atlas plates (Figure 2N), suggesting the use of inferred stereotaxic space, a concept discussed in Section 4.6.2.1.1. A similar strategy was employed for an elegant follow-up study from the same laboratory [(Atasoy et al., 2012); reviewed by Sternson (2013); Sternson et al. (2013); see Table 2]. Specifically, the authors showed that optically stimulated ChR2-transduced AgRP neurons drive feeding responses through inhibition of oxytocin-containing neurons of the paraventricular hypothalamus. They showed further that the synthetic and brain-penetrable ligand, CNO, could produce long-term inhibition of POMC neurons transduced with hM4D, a DREADD (Designer Receptor Exclusively Activated upon by a Designer Drug); and that this inhibition also increased feeding. The authors provided distribution data for the rostrocaudal spread of their transduced POMC population (Figure 2N). Although ChR2-transduced POMC neurons are Fos-activated by optogenetic stimulation (Figure 1U), the authors did not report the rostrocaudal distribution of the Fos-activated neurons, which ostensibly would be a subset of the ChR2-expressing population. In another elegant study, the Lowell laboratory showed Fos activation in pharmacosynthetically activated AgRP neurons (but without a mapped distribution) that was accompanied by robust feeding (Krashes et al., 2011). Their approach showed, as did the optogenetic studies, that AgRP neuronal activation was sufficient to trigger feeding behavior. Finally, Calu et al. (2013) recently used optogenetic neuronal silencing to examine feeding control by targeted a light sensitive halorhodopsin bilaterally to the dorsal medial prefrontal cortex and examined stress-induced reinstatement of palatable food seeking in female rats.
3.2. Methodological Issues Concerning Anatomical Documentation for IGI Methods
3.2.1. Virus transduction efficacy and variability
One important consideration with IGI studies is the extent to which a neuronal population that is being targeted by a virally delivered construct has successfully been transduced with this construct. In rat brain, for example, where the tissue expanse is larger than that of a mouse brain, multiple injections of a lentivirus or adeno-associated virus typically are employed in order to effectively deliver virus to broadly distributed cell populations. In such cases, mapping the successfully transduced neurons is an important documentation procedure that aids readers in independently evaluating the effects of the gene-directed delivery, whether it is for optogenetic stimulation or silencing, or knockdown or overexpression of a particular molecule. In their seminal study establishing the feasibility of adenoviral vector mediated delivery of a transgene into the brain, Davidson et al. (1993) used β-galactosidase as a reporter construct within their vector; the staining for which showed the extent of viral transduction in the brain (Figure 1K). Similar approaches have been used for other IGI studies. For example, in their study (Abbott et al., 2011) of the effects of optogenetic stimulation on Phox2b-expressing neurons in the rat retrotrapezoid nucleus, which produced an activation of multiple components of breathing (respiratory rate, inspiration, expiration), Patrice Guyenet and colleagues not only carefully mapped the locations of all of their ChR2-expressing neurons across various hindbrain levels, but did so for all twelve subjects they were examining (see their Figure 8). This approach nicely illustrates the careful documentation of transduction efficacy that also takes into consideration inter-subject variability.
3.2.2. Promoter specificity and strength
Yizhar et al. (2011) discuss the types of promoter fragments that have been used for optogenetic studies. The use of strong promoters over a long period of time may result in ChR2 expression being associated with abnormal axonal morphology and changes in the targeting of axons to particular locations (Miyashita et al., 2013).
3.2.3. Methodological considerations unique to optogenetics or pharmacosynthetics
3.2.3.1. Optogenetics: inferring connections originating from single neurons within a stimulated population, and c-Fos activation. A consideration especially important for optogenetic applications concerns the degree to which one can gauge the selective recruitment of transduced neurons following in vivo light stimulation. Just because a group of neurons has been transduced successfully for ChR2 gene expression does not mean they all fire with equal fidelity to optical pulses. Those that do may be intermingled and co-distributed with those that do not. Are the axonal connections for all optically stimulated or unstimulated neurons the same with respect to target neurons? The outputs of subsets of the activated, driven cells may be differential with respect to the outputs of other subsets. In this regard, Fos activation studies in vivo following light pulses could help to delineate activated cells and allow one to infer subpopulations that may be involved. The data from Aponte et al. (2011) and Atasoy et al. (2012), for example, demonstrate that a population of arcuate hypothalamic (ARH) neurons expressing the neuropeptide AgRP are sufficient to orchestrate robust feeding behavior. The rostrocaudal distribution of the Channelrhodopsin-expressing neurons is known from their studies, but the specific neurons along this axis that were Fos-activated and that produce specific feeding responses is unclear. Knowing the locations of these neurons through the rostrocaudal extent of the arcuate hypothalamus would be very beneficial so as to understand their spatial relation with other cell populations in the hypothalamus. Similarly, the delineated distribution and mapping to an atlas of the CNO-activated subset of Fos-labeled arcuate neurons in the report by Krashes et al. (2011) would allow others to interrelate those data with the anatomical locations of activated neurons in their own experiments.
3.2.3.2. Optogenetics: activating labeled axons. Atasoy et al. (2012) identified a pathway from mouse ARH neurons to oxytocin-expressing paraventricular hypothalamic (PVH) neurons with descending connections to the hindbrain. Similarly, Kong et al. (2012) identified GABAergic “RIP-Cre” neurons in the mouse ARH that control PVH neurons with descending projections to the nucleus of the solitary tract to selectively control energy expenditure without concomitant changes in food intake [reviewed by Bouret (2012)]. These studies demonstrated behavioral or autonomic changes brought about by selective stimulation of descending PVH connections. Mendelowitz and colleagues have highlighted how strong promoters are required to drive ChR2 expression in descending axonal projections originating from pre-autonomic PVH neurons (Piñol et al., 2012). It remains possible that weak or inefficient expression of a reporter molecule accompanying ChR2 expression in axons (e.g., EGFP) may also result in an incomplete labeling of all axons arising from transduced neurons. Thus, although reporter expression in tissue sections distal to the location of transduced cell bodies may allow for selective fiber-delimited stimulation or silencing, the labeling of such projections may not reflect the complete set of fibers that arise from a transduced population. Ideally, one should have data regarding the locations of axonal projections of a particular group of neurons prior to designing an optogenetics experiment.
3.2.3.3. Optogenetics: spatial disposition and penetrance of light. Another issue related to optogenetic experiments is the need for the experimenter to estimate the degree to which light is penetrating deep tissue locations such as those found in the hypothalamus. Recent modeling of ChR2 mediated action potential generation in cortical pyramidal cells, for example, demonstrates that the threshold for action potential generation is highly dependent, in part, on light irradiance (Foutz et al., 2012). Using a 20-mW 488-nm diode laser on mouse tissue slices containing lateral hypothalamic neurons transfected with ChR2, it was estimated that 0.5 mm3 of tissue receives light of at least 1 mW/mm2 (Adamantidis et al., 2007). Laser light delivered by conventional optical fibers escapes as a cone of illumination with an intensity that attenuates as a function of distance the light travels from the fiber tip. Recently, μ-iLEDs have been shown to provide a more uniform, omnidirectional light delivery than conventional optical fibers; μ-iLEDs can also be fabricated for directionally selective light delivery [see Figure 3B in Kim et al. (2013b)]. Light penetrance in optogenetic applications involving deep brain stimulation has been addressed at the level of brain tissue itself. Specifically, the light scattering properties of mouse brain regions have been estimated in vivo, and a mouse brain atlas and accompanying software application (http://www.optogeneticsapp.com) have been created to assist researchers in designing their optogenetic experiments in a manner that ensures adequate light penetrance for their target brain region (Al-Juboori et al., 2013).
3.2.3.4. Optogenetics: thermal changes associated with light pulse delivery. Blue light laser stimulation to drive ChR2-mediated depolarization in transduced neurons may give rise to thermal confounds. Recently, for example, Christie et al. (2013) reported that rat cortical surface temperatures increased during blue light (445 nm) laser stimulation, with linear rises in temperature (0.5–7°C) for light transmitted at powers ranging from 0.6–16 mW, respectively.
3.2.4. Summary of technical issues related to using IGI methods for feeding control studies
To recapitulate the main points of Section 3.2, the locations of probe placements, transduced neurons, and activated transduced neurons are all important to document as thoroughly as possible in IGI studies. Documentation about light and heat penetrance for optogenetics studies is also warranted. Documentation is also important for electrophysiologically recorded neurons labeled after validation assays using tissue slices ex vivo (often used in conjunction with IGI methods), which can be mapped if they are dye-filled or labeled in other ways in relation to the total population of surrounding neurons. Finally, atlas-based mapping of circuits probed using IGI methods is fundamental to establishing legacy datasets upon which to build further discoveries. As resources such as Cre recombinase-driver rats (Witten et al., 2011; see also Sato et al., 2004), certain ChR2-transgenic rats (Ting and Feng, 2013), and tools such as Brainbow adeno-associated viral vectors (Cai et al., 2013) gain more widespread use, then the lessons we have learned so far using rat models will also remain applicable to these newer technologies.
3.3. A Note about ICI and IGI Methods, Feeding Control, and “Chemical Coded Behavior”
Before we turn to the next section, which is focused on applying concepts derived from functional neuroanatomy to feeding control, it is useful to interrelate ICI and IGI methods in terms of how they have helped to shape our understanding concerning general aspects of feeding behavior, such as the way behavior is coded by complex chemical circuits.
From the early applications of ICI methodology to feeding control described in Sections 2.2 and 2.3.3, emerged the concept of the “chemical coding of behavior,” which posits that distinct behaviors can be linked to actions of different chemicals acting within the same or different brain locations (Grossman, 1960; Miller, 1965). Despite the many benefits derived from using ICI methods, it is important to note the limitations of such approaches insofar as what they can tell us about the endogenous operation of chemical networks in the brain. For example, in the past 25 years, the field of ingestive behavior has generally paid closer attention to peptides acting to control food intake rather than small neurotransmitters; in part, because peptides are easier to localize than small transmitters in post-mortem tissue, and many have been shown (see Section 2) to acutely stimulate or suppress feeding following central injection. However, it appears from electrophysiological work that the primary ongoing synaptic activity for the endogenous operation of hypothalamic and other networks controlling feeding is driven by small neurotransmitters such as GABA and glutamate, and that peptides may exert a neuromodulatory function superimposed upon their continuous actions (see van den Pol, 2003, 2012; Marder, 2012). Thus, the results of behavioral and electrophysiological experiments, along with the interpretations of these experiments by many investigators, appear to differentially emphasize certain elements of chemical space and their importance with respect to the endogenous operations of circuits participating in feeding control. Nevertheless, scientists have drawn conclusions about the endogenous or native chemoarchitecture of the hypothalamus from the effects they observe when certain chemicals, including proteins, are injected. It remains to be seen whether this “chemical coding” is a concept that is incorrect, or correct but inaccurately and/or incompletely determined by ICI methodology [see, for example, the criticisms by Booth (1990), p. 474].
Moreover, while it is still too early to ascertain whether newer IGI methods will completely resolve this issue, they are already clarifying aspects of it in relation to feeding control. For example, recent IGI studies (e.g., Atasoy et al., 2012; see Section 3.1) have identified only a role for GABA co-localized within AgRP neurons in controlling food intake, but not necessarily AgRP itself. In contrast, central injection data indicate that AgRP can trigger feeding stimulation (Rossi et al., 1998; Hagan et al., 2000; Kim et al., 2000; Semjonous et al., 2009). Thus, the roles in feeding control for GABA, AgRP, and NPY (all normally produced within AgRP neurons) have been relatively unclear. This matter was addressed in an elegant study by Krashes et al. (2013), in which IGI methods were used to insert DREADDs (see Sections 1.1 and 3.1) in AgRP neurons of the arcuate hypothalamus within mice harboring single, site-specific deletions of genes encoding for NPY, GABA, or AgRP transmission, or in mice that had triple-gene deletions or bore double gene deletions (to remove GABA and NPY). The authors found that CNO-mediated stimulation of these animals resulted in food intake that appears to rely differentially on all three molecules: NPY or GABA are required for rapid feeding and can compensate for each other's absence, whereas AgRP can only mediate more prolonged, chronic feeding. The temporal differences in the actions of these molecules help to explain their roles in orchestrating feeding behavior over short and prolonged time scales. This is one example of how an IGI method (pharmacosynthetics), in combination with other transgenic methods, can help validate and clarify the data produced by ICI and other IGI (optogenetic) methods to advance our understanding of the role of various chemical constituents within neural circuits controlling feeding behavior. In the next section, we will examine how thinking about functional neuroanatomy in the context of ICI and IGI methods can further broaden and deepen our knowledge and understanding of feeding control.
4. A Conceptual Framework for Thinking about Feeding Control Sites in the Brain
4.1. Central Questions from Central Injections
In Sections 2 and 3, a review of some of the major central injection studies examining food intake was provided, with an emphasis placed on those studies that have included anatomical documentation in the form of injection site locations or maps of such locations. In this section, we discuss these studies in relation to a wider view of how injection sites and the neural substrates controlling feeding and other motivated behaviors can be contextualized in relation to neuroanatomy. Anatomical considerations are critical in answering three fundamental questions that arise from the targeted manipulation of neural substrates controlling food intake (or any other behavior for that matter). These questions are:
(1) where is the injection site?
(2) what (and where) are the neural substrates that are affected by the injected substance?
(3) which, if any, of the affected neural substrates contribute to the behavior(s) observed?
In evaluating how these questions can be answered using knowledge of neuroanatomy, it is useful to remember that the answers to these questions (location of the injection site, the location and identity of the cellular machinery affected by the injections, and the subset of such machinery that contributes to the observed behaviors); all reside within the brain. The starting point to answer all of these questions, therefore, resides in analyzing the physical substance of the manipulated brain. Traditionally, this has usually been conducted post-mortem, although non-invasive functional magnetic resonance imaging (fMRI) of the living brain in the intact organism has been performed following pharmacological manipulations known to affect feeding (Stark et al., 2006, 2008; Dodd et al., 2009, 2010). Modified fMRI and positron emission tomography (PET) methods have also has been used to obtain real-time data confirming the efficacy of in vivo optogenetic stimulation (Domingos et al., 2011; Thanos et al., 2013; but see Christie et al., 2013). The state-of-the-art for these applications, however, is not yet at cellular resolution.
Remembering that the physical brain itself is the object of analysis is, on one level, rather obvious. But on another level, the concept acquires profundity, especially when one asks if all of the questions posed above for a particular study can be answered by post-mortem analysis of a single subject's brain. Does visualizing the injection site in a selected brain specimen, for example, methodologically preclude one from examining the affected neural substrates in the same tissue? If so, then one must resort to examining certain animals from a given cohort for particular data, some for the injection site, and others for a view of the affected neural substrates. But if this latter approach is used, how does one compare histology from different brains to interrelate these two distinct sets of data? The questions, then, are reduced down to those concerning histology; it is therefore worth examining what happens in this process more closely.
4.2. Localizing Injection Sites
“The gains in brain are mainly in the stain.”
Bloom's famous adage, which is a useful starting point to begin our discussion of histological matters, informs us that our understanding of the structure of the brain is dependent on the methodologies used to visualize it. The type of histology performed will, to varying degrees, provide information about the location of the intracranial manipulation and/or the neural substrates affected by such a manipulation. Consider, for example, how the studies outlined in Sections 2 and 3 were conducted. The investigators who performed these studies localized their injection sites and probe locations in various ways. One approach was through the use of gross anatomical landmarks, either provided by the appearance of the skull prior to injection, or from within the brain tissue itself. For example, recall that Demole (1927) used dyes such as ammoniacal carmine, Immedial black or India ink to mark injection sites within the living brain and examine these sites post-mortem (Figure 1B). In contrast, von Euler and Holmgren (1956) took X-rays of their cannula implants in the skull (Figure 1D) and others (Epstein, 1960b; Grossman, 1960) used a Nissl stain to see the injection near neighboring groups of neurons (Figures 1F,G).
4.3. “Visualizable Spaces” of the Brain: an Introduction
Section 4.4.9 provides more information concerning the diverse ways in which injection sites have been localized (see Akert and Welker, 1962 for similar issues for electrode probes). From these few examples, however, emerges the general principle that the brain can be visualized in a variety of ways and each of these ways requires its own special methodology. Although we have just examined how a few scientists have tried answering the first of the three questions posed earlier (where is the injection site?), this principle requires further delineation to help address this question more fully and to also address the other two questions which do not concern the location of the injection site, but deal instead with the neural substrates affected by the injection.
Figure 4 illustrates a simple formalization of the ideas just discussed. In panels A and B, basic topological relations are shown for the skull, the brain it contains, and empirical location (injection site, for example) within the brain. Figure 4C then defines the brain as the sum of all possible “visualizable spaces” contained within it. Many of these visualizable spaces are topologically distinct, that is, it is not possible to interconvert them. Thus, an arterial lumen is topologically outside of the brain tissue proper, even though the vessel may be coursing inside the three-dimensional volume of the brain mass itself. This topological relation is analogous to a finger being carefully and slowly pushed against the taut skin of a gas-filled, transparent balloon: the finger is outside the balloon but might eventually be seen in “the center” of the balloon's dimensions. Thus, angioarchitectonic space is one visualizable space that is topologically outside the brain but physically still contained within its dimensions. Although the unique structural features of topologically distinct visualizable spaces preclude them from being interconverted, they all share the common feature of residing within the brain itself. Other spaces shown in Figure 4C are topologically within the brain and potentially interconvertible with other spaces. For example, functional space is such a space, since it can incorporate elements belonging to other spaces, depending on the functional marker used (protein, mRNA, etc.). Finally, many of these visualizable spaces are conceptually indistinct. Thus, blood vessels in the brain will inform both gross anatomic and angioarchitectonic spaces. Fos expression will inform both functional and chemoarchitectonic (proteomic) spaces, and so on.
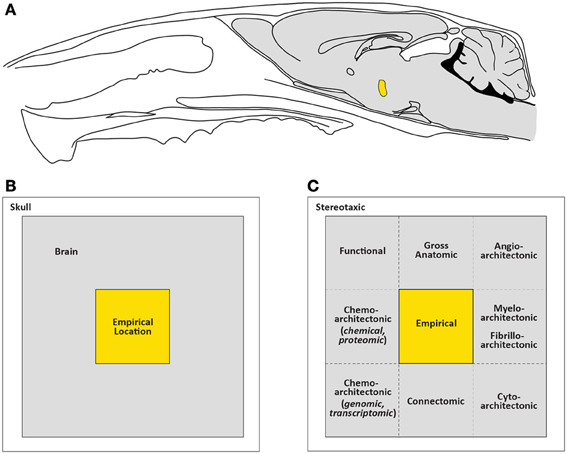
Figure 4. A conceptual framework for organizing thoughts concerning injection site localization. (A) Outline of a rat skull (black outline only), rat brain (gray), and injection site (gold); showing the topological relations of these three spaces. The drawing is adapted from König and Klippel (1963). (B) The topological relations shown in (A) are simplified in a nested square arrangement here. Note the names given to each space. (C) A conversion of the relationships presented in (B) within the context of methodologically visualizable spaces. Stereotaxic space is derived from skull measures and is therefore listed in the space corresponding to the location of the skull. This topological relationship affords stereotaxic space with the privileged position of being a reference for all other spaces. The space occupied by the brain can be visualized as any of the spaces listed. Dotted lines signify that each space is not the only one visualizable; but several can be detected simultaneously, depending on the compatibility of methods used. See text for further explanations.
4.4. “Visualizable Spaces” of the Brain: a Closer Look
Before we explore how visualizable spaces can help us organize our thinking about anatomical localization and registration in simple ways, it is important to define them more precisely. As will become evident from the introduction of each of these spaces below, technological developments over the years have allowed the visualization of certain neural elements to extend from one visualizable space to another. Table 3 highlights details for studies mentioned in this section and includes additional references related to each visualizable space as it has been studied in relation to feeding control.
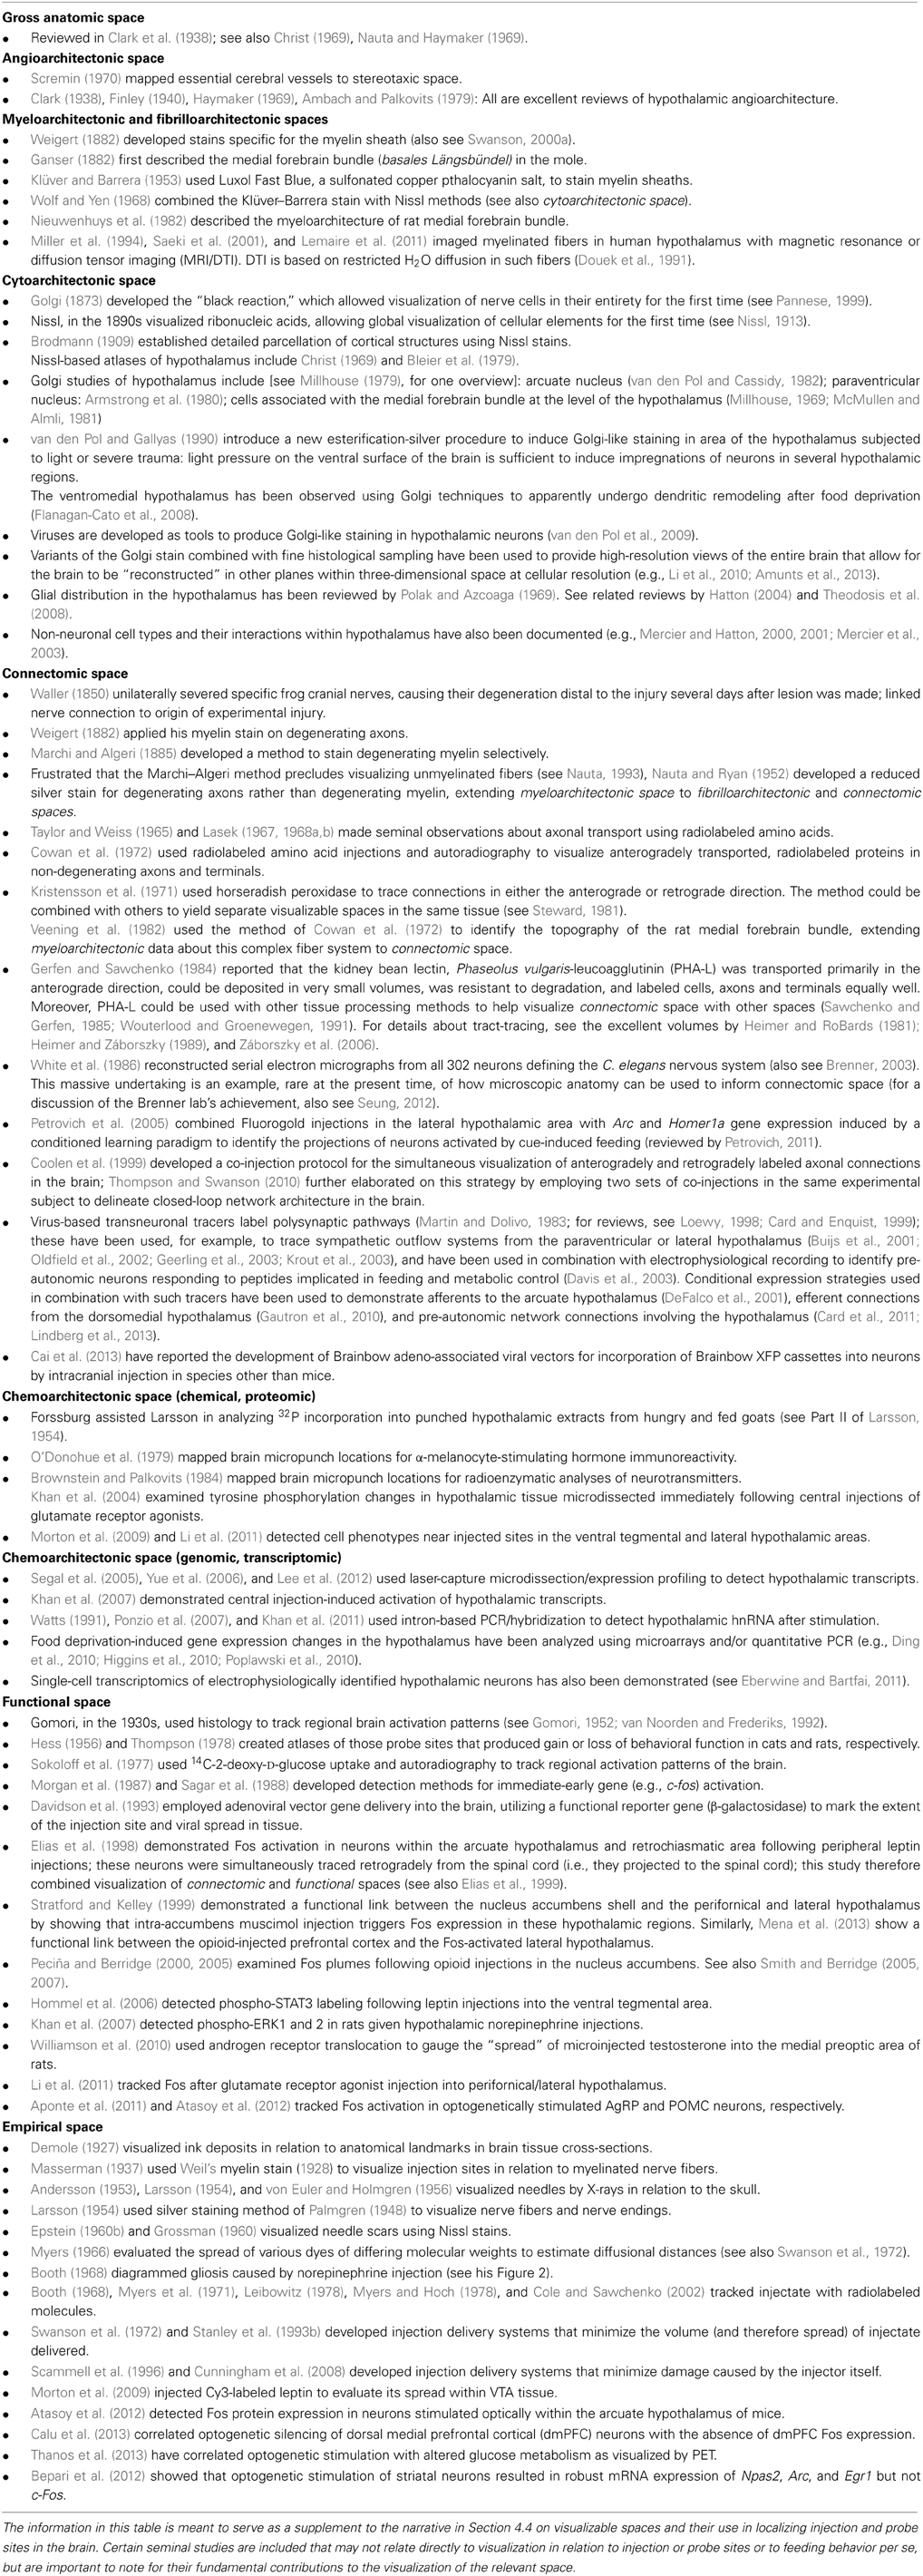
Table 3. The development of visualizable spaces and their use in ICI and IGI studies.
4.4.1. Gross anatomic space
Gross anatomic space represents the basic macrostructure within fixed or unfixed brain tissue, and is defined here as those features of a whole or sectioned brain that are visible to the naked eye during a gross dissection. Major landmarks, such as the cerebral ventricles, major cerebral vessels, and major white matter tracts are included in such space, and are often used to help delineate the basic location of the entry of a cannula, injection needle, microdialysis probe, or optical fiber into the brain. A good example of the effective use of gross anatomic features can be seen in the data from Eglin (1953) shown in Figure 1C, where simple drawings of sectioned cat brain indicate locations where acetylcholine and eserine produced autonomic responses.
4.4.2. Angioarchitectonic space
Angioarchitectonic space is defined as the space occupied by cerebral blood vessels that can be used as landmarks to help localize injections. As illustrated in Figure 5C, angioarchitectonic space can be visualized with other spaces in the brain.
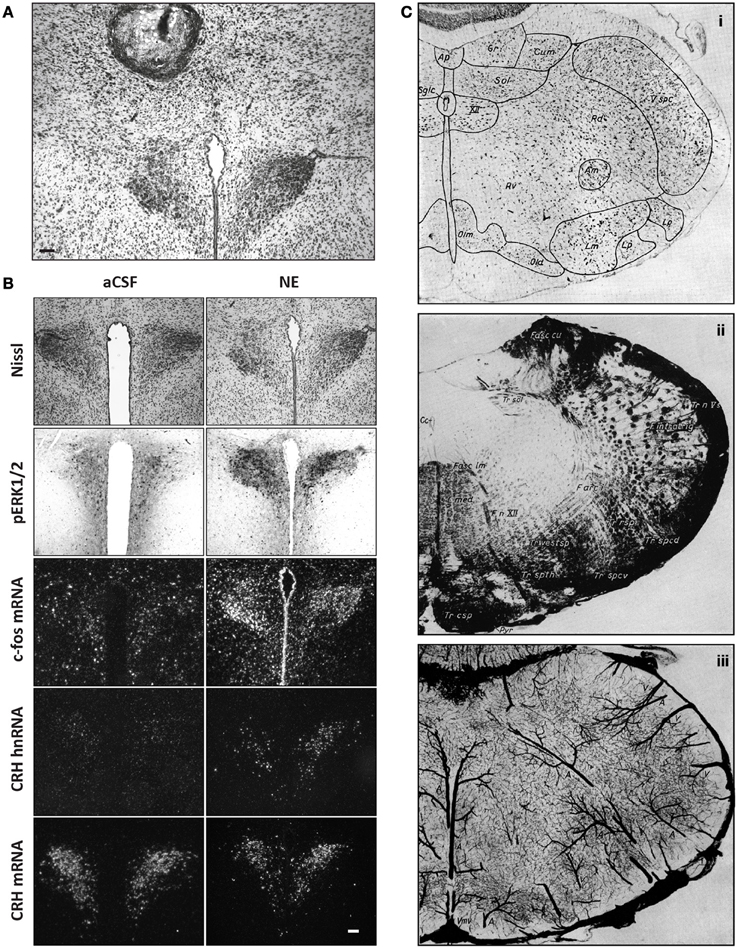
Figure 5. Serial sections allow for intra-brain registration of multiple visualizable spaces. (A) Nissl-counterstained tissue showing the location of an injection site in the vicinity of the hypothalamic paraventricular nucleus, as published by Khan et al. (2007). (B) Effects of artificial cerebrospinal fluid (aCSF) injection (left column) or norepinephrine injection (right column) on activation of paraventricular hypothalamic neurons. The first row shows the structures in cytoarchitectonic space (Nissl stain). The second row shows the structures in functional space (the label is the activation marker, phospho-ERK1/2). The third, fourth, and fifth rows show the structure in transcriptomic spaces for the molecules c-fos (mRNA), CRH (hnRNA), and CRH (mRNA). (C) Adjacent sections from the atlas of Wünscher et al. (1965), showing cytoarchitectonic (i), myeloarchitectonic (ii), and angioarchitectonic (iii) spaces for the same portion of the rat hindbrain. All photomicrographs in this figure were reproduced with permission from the publishers. (Panels A and B: The Society for Neuroscience; Panel C: Hirzel Verlag).
4.4.3. Myeloarchitectonic and fibrilloarchitectonic spaces
To reflect all methods used, both terms are being included here. Myeloarchitectonic space is occupied by myelinated axons as they traverse through brain structures, whereas fibrilloarchitectonic space, a term adapted here from Brodmann (1909), refers to all nerve fibers, myelinated, and unmyelinated, within the central nervous system. Although the hypothalamus is generally thought to have few myelinated fibers apart from large fiber tracts, a few investigators have stained myelin sheaths to localize injection sites in this structure. For example, recall from Section 2.2 and Figure 1H that the Leibowitz lab employed a method to simultaneously visualize cells and myelinated fibers in the same brain tissue (Table 3). Many investigators have also produced detailed studies of the myelinated components of the major fiber systems traversing the hypothalamus (Table 3). More recently, promising efforts have been made for non-invasively imaging white matter tracts in the hypothalamus using innovations of basic magnetic resonance imaging (MRI) techniques (Table 3).
4.4.4. Cytoarchitectonic space
Cytoarchitectonic space refers to the cellular elements in the nervous system that are histologically identifiable from “elemental” or “cell type” properties (e.g., cell size and shape) or the more population-based properties for “cell groupings” (e.g., cell packing and density, regions of lamination, or clustering into larger nuclei; see Brodmann, 1909, for details). Traditional staining techniques used to determine cytoarchitecture include those developed by Golgi (1873) and Franz Nissl in the 1890's (see Nissl, 1913). In addition to stereotaxic atlases of the rat brain that include photographs of Nissl-stained material (Table 4), several other Nissl representations of the hypothalamus have been published (e.g., Bleier et al., 1979). Some investigators, however, have questioned the importance of using Nissl stains to establish cytoarchitectonic groupings of nerve cell populations (see p. 49 of Blessing, 1997). Golgi-stained material has also been generated for a number of locations in the hypothalamus (Table 3).
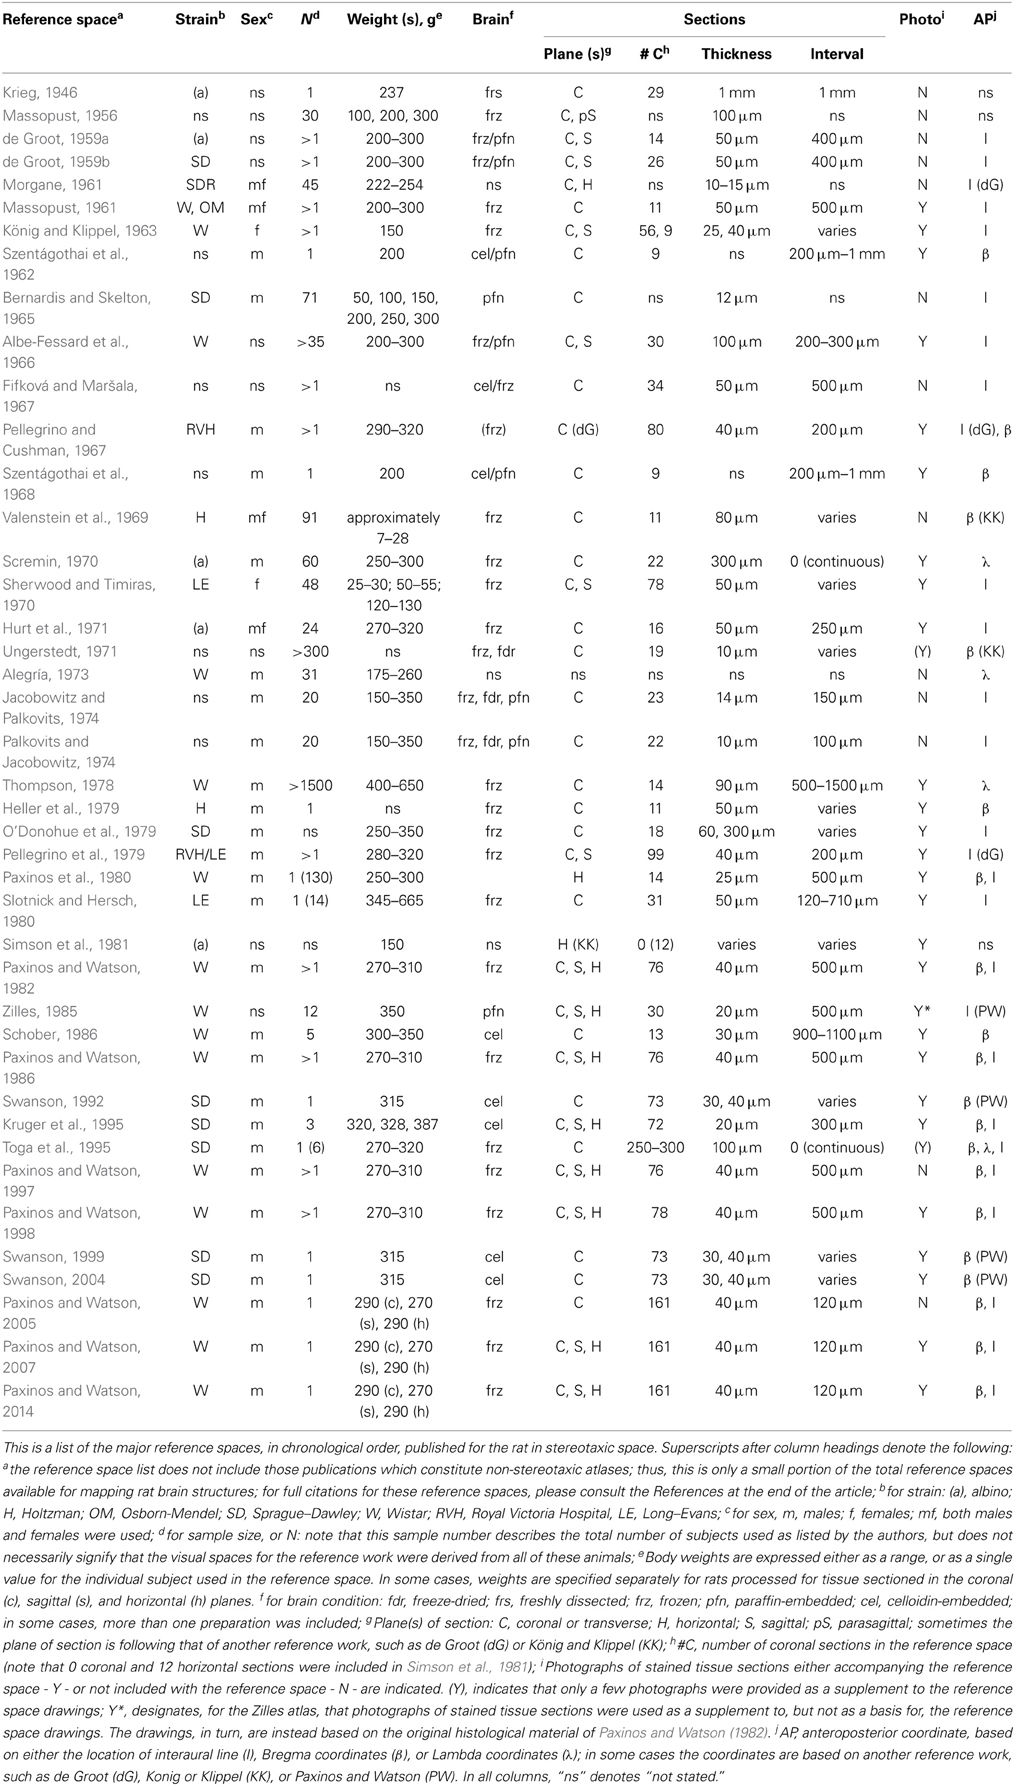
Table 4. Reference spaces for the rat brain using coordinates in stereotaxic space.
4.4.5. Connectomic space
Sporns et al. (2005) defined the human connectome as “a comprehensive structural description of the network of elements and connections forming the human brain” (p. 0245). For our purposes here, connectomic space is the space in the brain occupied by its large-scale network of axonal connections. These connections have been traced using a variety of methods, as summarized in Table 3. Importantly, IGI methods also involved early studies demonstrating virus-assisted tract-tracing methods to delineate feeding-related circuits in the hypothalamus (DeFalco et al., 2001), thereby marking explorations of connectomic space as one entry point for IGI methods to be applied to feeding control.
4.4.6. Chemoarchitectonic (chemical and proteomic) space
Chemical and proteomic types of chemoarchitectonic space are usually “visualized” in one of three ways: inferences derived from actions of a chemical injection, microdissection of tissue, and immunocytochemistry. Strictly speaking, the first two of these methods—inferring chemical space from the actions of centrally injected chemicals or linking molecules analyzed in dissected tissue to locations in the brain—are reciprocally incomplete. In the first case, numerous studies (some of which were highlighted in Section 2) have employed ICI methods to deliver chemicals into brain regions to control food intake. These studies usually provide (a) the site of injection (i.e., location), and (b) a record of what the injected chemical did (e.g., behavior, etc.), but the identity of the endogenous chemical space affected by the injected chemical is rarely distinct. As discussed in Section 3.3 the concept of behavior as “chemically coded,” which emerged from this approach, emphasized the anatomical location of neural substrates underlying the triggering of a complex behavior.
The second method to probe chemical space, which involves microdissection and homogenization of restricted, pre-determined locations within fresh or freshly frozen brain tissue, is incomplete for just the opposite reason: the chemical information obtained from the tissue is generally accurate, but the location information provided is limited at best. Strictly speaking, this method is not “architectonic,” since the intact structure of the tissue itself is not preserved. However, microdissection atlases (e.g., Palkovits and Brownstein (1988) facilitate cataloguing of chemical space that is anchored to the physical, mapped structure of the intact tissue itself. In a general sense, then, such data constitute a form of chemoarchitecture. However, since the punches are usually quite large and encompass tissue that includes more than one brain region, it is often difficult to attribute a chemical constituent of the homogenate as being from a particular location. Sample sizes become smaller by using laser-capture microdissection techniques (Table 3).
The third (and premier form) of identification that identifies and preserves chemoarchitecture is immunocytochemical staining [reviewed by Polak and Van Noorden (1997)]. Although this method can, in principle, be used for any molecule type that is immunogenic in an animal, it has been used primarily to localize proteins in the nervous system, and hence visualize proteomic space. Numerous studies have used this technique to visualize feeding-related molecules, axonal pathways, cell populations, and structural and functional representations of activated feeding control circuits. These antibody-based techniques allow for intact preserved tissue sections to retain labeling for key molecules targeted by the antibodies selected. Importantly, tract-tracing experiments as well as IGI methods involving optogenetics and pharmacosynthetics can utilize antibody-based methods to localize tracers, reporter molecules, and activated neurons. This technique can be combined with counterstaining procedures to help visualize proteomic space simultaneously with other spaces, or with in situ hybridization procedures (discussed below) to co-label molecules in proteomic and transcriptomic spaces (e.g., Khan and Watts, 2004).
4.4.7. Chemoarchitectonic (genomic, transcriptomic) spaces
Akin to chemical and proteomic determinations, these spaces are through which chemoarchitecture is visualized at the DNA or RNA levels. Central injection-induced activation of transcripts has been demonstrated in the hypothalamus (e.g., Khan et al., 2007; Figure 5). Within the context of feeding behavior, tract-tracing techniques to visualize connectomic space have been employed in combination with in situ hybridization methods to visualize transcriptomic space to determine connectivity between brain regions activated during a conditioned feeding paradigm [(Petrovich et al., 2005); reviewed by Petrovich (2011)]. Specifically, the authors injected the retrograde tracer, Fluorogold, into a portion of the lateral hypothalamic area and observed retrogradely labeled neurons in the prefrontal cortex and portions of the amygdala. Figure 1P shows the location of a representative Fluorogold injection site and its careful boundary delineations as mapped onto atlas plates from Swanson (1999). Rats traced in this manner and trained to associate food presented in their cage with an auditory cue (a tone) displayed greater levels of mRNA expression for the immediate-early genes Arc and Homer1a in the traced neurons, as compared to traced rats that did not form this association (control group). This elegant study provided the first evidence that learning associated with feeding specifically activated forebrain circuits that were connected directly to lateral hypothalamic substrates implicated in feeding control.
4.4.8. Functional space
Functional space is defined as that space which contains elements that become visualizable depending on the behavioral or physiological state of the experimental subject. The study by Petrovich and colleagues discussed in the previous section is a great example of the combined visualization of multiple spaces in the brain: connectomic, transcriptomic … and functional. This is because the immediate early gene expression in the traced neurons provided evidence that activation in these cells occurred in association with a conditioned cue. Under our definition then, the distribution of these neurons in the brain constitutes functional space since the activation is associated with a behavioral change. The discussion in Sections 2.3.4.2 and 2.3.4.3 regarding the Fos plume maps of Berridge and colleagues, and the phospho-STAT3 activation following central leptin injections, respectively; are also examples of the use of activation markers to visualize functional space. Another clever instance of the adroit use of activation markers was reported by the laboratory of Victor Viau, in which they used the testosterone-dependent translocation of the androgen receptor from the cytoplasm to the nucleus as an index to gauge the extent to which testosterone delivered into the medial preoptic area had spread (Williamson et al., 2010). Figure 1R reproduces a portion of the data from their study, illustrating the punctate labeling of the androgen receptor as detected by immunocytochemistry. Table 3 provides a snapshot of a few additional studies exploring the visualization of functional space in the context of feeding control and other motivated behaviors. Large-scale efforts are now underway to map the functional space of the mammalian brain, as part of the Brain Activity Map project (Alivisatos et al., 2013).
4.4.9. Empirical space
This space is defined as that which has been physically or functionally affected by the mechanical and chemical forces of the intracranial injection itself or the injectate that was delivered, or both. These spaces are by definition also located within the brain, but can be considered as distinctly topological. Empirical space therefore includes any area within the brain that is visualizable as having been affected by intracranial manipulation. Several distinct types of empirical space are discussed below.
4.4.9.1. Damaged tissue left by a probe (e.g., cannula, needle, micropipette, fiber, light) constitutes empirical space. In Section 1.2, we introduced several possible tissue perturbations caused by ICI and IGI methods. In the case of ICI, the delivery of a chemical solution usually causes some displacement of the tissue and the needle itself leaves a tissue scar that can be visualized, often accompanied by gliosis. If the needle was inserted through an indwelling guide cannula, the cannula itself also causes tissue damage. Investigators conducting ICI studies often localize the effects of their injections by documenting the locations of these tissue perturbations.
In the case of IGI methods such as optogenetics or pharmacosynthetics, the process of injecting solutions containing virus particles results in tissue damage similar to that found in ICI, especially if the delivery is done using blunt metal needles rather than glass micropipettes (which typically leave less visible damage; e.g., see Chamberlin et al., 1998). To ensure that a broad area of the brain receives the efficient delivery of a virus, arrays of injectors have also been used to deliver viral particles simultaneously to several adjacent regions of the same brain (Chan et al., 2010); such methods will ostensibly leave multiple injector scars. With certain IGI methods, such as optogenetics, another tissue perturbation is of the optical fiber used to stimulate or silence transduced neurons using light pulses. However, recent breakthroughs in the fabrication of microscale, inorganic light-emitting diodes (μ-ILEDs) result in intracranial optical probes leaving much less tissue damage than that left by conventional optical fibers (Kim et al., 2013b). Another consideration in optogenetics is the cellular damage that could be caused by light itself, especially if pulsed for prolonged periods of time in vivo. In some situations, when experimental design demands prolonged bouts of steady illumination, investigators pay special consideration to this issue by examining cellular markers of damage or inflammation (e.g., microglia or astrocytes contributing to gliosis) in the area receiving illumination (Calu et al., 2013).
4.4.9.2. The site of injection is empirical space. In Section 4.2, I described a few approaches by which investigators have visualized their central injection sites using ICI methods. Although many investigators have used stainless steel injector needles to deliver chemical solutions, a few investigators have opted to avoid both the greater damage and spread caused by such injectors by using glass micropipettes drawn to very small tips. A fine example of this was demonstrated by Scammell et al. (1996), who showed that 100 nl injections of prostaglandin E2 into the medial preoptic area produced fever in rats. Figure 1M shows a representative injection site from their study, which was visualized in a few ways. First the injection site was marked by injection of fluorescent beads. Second, the fluorescence image of the site was superimposed digitally onto a dark field photomicrograph of the region. Very little tissue damage accompanied the injection, and the small volumes employed helped ensure a finer degree of control over the localization of effective sites producing fever.
Knobloch et al. (2012) employed a similar strategy when they reported that optogenetic stimulation of hypothalamic-originating oxytocinergic projections to the central nucleus of the amygdala attenuates fear responses in rats. In their study, which also examined other locations of oxytocinergic innervation in the brain, the authors carefully document both the stereotaxic coordinates as well as injection volumes for their viral injectate within various brain regions, citing the nomenclature of Paxinos and Watson. Accompanying these data are also mapped locations of optical fiber placements within the central amygdala and a photograph of a glass micropipette injection site where fluorescent beads were injected at locations corresponding to where optical fibers were implanted (their Figure 5A). This is a good example of stereotaxic, diagrammatic and photomicrographic documentation of optogenetic manipulations. Finally, because neuroanatomical tract-tracing techniques involve the central microinjection of tracer molecules, empirical space technically can overlap with connectomic space. This is because the injection site where tracer deposits are found, along with all traced cell bodies and axonal connections that contain exogenous materials (tracer), also technically constitute empirical space.
4.4.9.3. The area physically exposed to diffused injectate is empirical space. Empirical space also includes that space which can be visualized for the purposes of tracking the spread of injected solutions (see discussion in Routtenberg, 1972), a task that is probably one of the most difficult challenges when using ICI methods. Recall from Section 2.3.4.1 that Stanley et al. (1993b) injected radiolabeled NPY in the small volume of 10 nl into various areas of the hypothalamus and surrounding regions, and tracked the spread of this solution in tissue by monitoring the distribution of radioactivity as a function of distance and time (Figure 3). Table 3 lists several studies that have included injections of variously labeled compounds to track diffusion of injected solutions; in all cases, differences in the molecular weights and solubilities of the tracking substance (e.g., dye) and the injected substance of interest (e.g., receptor agonist) should be taken into consideration, as well as the fact that the local concentration of drug, acting at the final receptive site in vivo is difficult to estimate, but will be less than the concentration at the injection site itself.
4.4.9.4. The area functionally affected by diffused injectate: functional space as empirical space. Finally, as discussed in the preceding section in relation to functional space, the activation of the underlying neural substrates affected by an injected solution can also be tracked, and the extent of this activated area is used to infer the extent to which the solution has diffused. As reviewed in Table 3, for ICI methods, these approaches have included identifying Fos plumes, phospho-ERK1/2 activation, or nuclear translocation of hormone receptors in neurons under the injected solution. As discussed in Section 3.2.3.1 for optogenetics, Fos activation following light stimulation also allows one to infer if light from the optical fiber has affected the excitability of neurons underneath the illumination, and again renders the use of functional space as empirical space.
For IGI methods, the viruses injected often carry constructs that not only encode the engineered construct to be delivered, but also a “reporter molecule,” such as a histochemically or fluorescently detectable protein (e.g., β-galactosidase; mCherry, tdtomato, EGFP). This was demonstrated early in the introduction of viral vectors as tools for gene delivery (e.g., Davidson et al., 1993; Figure 1K). When transduced within a neuron, the presence of the expressed reporter molecule signifies that the labeled cell has successfully incorporated the sequence delivered by the virus into its cellular machinery and has presumably also expressed the engineered construct as a functional protein. The distribution of the reporter molecule expression within brain tissue is therefore not only an important indicator of the total pool of neurons that are possibly receptive to optogenetic or pharmacosynthetic manipulation, but also allows one to infer the successful spread of virus to that location. Noordmans et al. (2004) adopted this approach for their overexpression of a GAD65 (glutamic acid decarboxylase) construct into the lateral hypothalamus of rats (Table 2). Their work is exemplary in that they used reporter molecule expression to estimate both the volume of the transduced area as well as the error in their stereotaxic procedure, parameters that are rarely included as documentation in IGI studies. In their optogenetic study of cardiorespiratory activity in the mouse hindbrain, Abbott et al. (2013) offer a good example of how optical fiber placements can be mapped carefully in empirical space and how these locations can be linked, using stereotaxic coordinates, to the distributions of reporter-expressing molecules at these locations documented in functional and stereotaxic spaces (see their Figure 2). Also, placing reporter molecule expression patterns in register with the tips of optical fibers is a useful means to establish the plausible area of the tissue that would be most likely to receive light illumination from the fiber (Calu et al., 2013). Similarly, viral-mediated RNAi methods also utilize the “reporter molecule strategy”; in such cases, cells expressing the reporter molecule mark their receipt of shRNA molecules, which then knock down expression selectively in the transduced cells (Hommel et al., 2003). Viral-mediated RNAi and overexpression have been demonstrated to affect food intake when targeted against various molecules in a number of different regions (Table 2). Collectively, these strategies effectively transform functional space as empirical space.
4.4.10. Summary: visualizable spaces
At a basic, holistic level, this proposed organization of the brain into “visualizable spaces” is obvious: the brain will contain basic structures that inform its overall gross anatomy (gross anatomic space), including blood vessels (angioarchitecture), myelinated, and unmyelinated fiber tracts (myeloarchitecture; fibrilloarchitecture), axonal connections (connectomic space), cell populations (cytoarchitecture), including specialized chemical cell types and systems defined by the expressed, functional proteins and other small molecules, and the genes and transcripts within these cells (chemoarchitecture). If one's intention is to publish as much location information about a food intake manipulation in vivo, then data should be extracted from one or more of these visualizable spaces once the behavioral component of the study is completed. Operationally, however, it is usually the case that only one or a few of these spaces is examined histologically for any single brain specimen. That is the reason why the emphasis here is to call these methodologically separable spaces as visualizable spaces: the space, although always there, is essentially absent if it is not the space chosen by the investigator to be visualized histologically or documented diligently. As we shall see, such choices lead to profound consequences about the limits that investigators place upon their own studies.
4.5. Seeing Visualizable Spaces
“Exact information about the functional significance of the deep sections of the brain is only obtained by working through the brain histologically in serial section. To avoid far too great delays, the experiments must be fitted in together as it were in time, and it is only possible to keep the material collected under control by using a carefully organized system of registration.”
Nobel Lecture (1949)
How can we use “visualizable spaces” to address questions about central injection sites and the neural substrates affected by such injections? The simplest case is that of histological localization of an injection site in a single brain, because this allows all visualizable spaces to be easily placed into anatomical registration with one another (intra-brain registration). Applying now the names of the visualizable spaces to our earlier discussion, using a Nissl stain to mark cellular populations allows one to visualize the brain in cytoarchitectonic space. The presence of an India ink-labeled injection site, in contrast, allows us to visualize the brain in empirical space. Thus, whereas Demole's ink-stained injection sites within the unstained brain in 1927 (Figure 1B) are localizable within empirical space and gross anatomical space, Epstein's Nissl-stained injection sites (Epstein, 1960b), which also contained needle tracks (Figure 1E), are localizable within empirical space, cytoarchitectonic space, and gross anatomical space. Similarly, the Klüver-Barrera-stained injection sites (Figure 1G) in Leibowitz (1975) are visualizable in empirical, cytoarchitectonic, and myeloarchitectonic spaces, and the β-galactosidase stained injection site (Figure 1K) within the unstained brain shown in Davidson et al. (1993) marks functional, gross anatomical, and empirical spaces. Similarly, fluorescent bead-marked injection sites in superimposed dark field images (Figure 1M) in Scammell et al. (1996) are visualizable in empirical and myeloarchitectonic spaces. In all of these cases, the tissue is being visualized simultaneously in two or three separate visualizable spaces because the methods that allow for such visualization do not interfere with each other, and all can be applied together to the same tissue section (e.g., see introductory comments in Steward, 1981). The use of these separate methods to the same tissue section is the simplest form of ensuring that there is 100% (perfect) registration between the visualizable spaces, since the tissue for each space is identical.
The issue becomes a bit more complicated if the methods to localize the injection site within two or more visualizable spaces are mutually exclusive of one another, or are technically difficult to perform simultaneously. For example, performing an immunofluorescence procedure to visualize a particular class of molecules under a fluorescent microscope may not always be fully compatible with the tissue processing steps needed to view Nissl-stained material in the same tissue section using bright field microscopy. In such instances, collecting adjacent series of tissue sections spaced closely together helps to solve the problem. Depending on the brain region one wishes to analyze, the degree of separation between closely adjacent tissue sections is such that the full extent of a relatively homogenous region is represented more or less equally within multiple, serially collected sections. This allows for each tissue section to be processed separately for each method one desires to use for visualizing the injection site.
Figure 5 shows this for a study in which NE or its artificial cerebrospinal fluid (aCSF) vehicle was injected near the hypothalamic paraventricular nucleus (PVH) to trigger the expression of c-fos and corticotropin-releasing hormone (Crh) genes (Khan et al., 2007). The PVH was sampled within adjacent tissue series so that at least five separate tissue-processing steps could be performed separately on the same injected region, one for each tissue series collected. This allowed for the following visualizable spaces to be examined simultaneously for the PVH in a single brain: in Figure 5A: (1) empirical space (injection site); in Figure 5B: (2) cytoarchitectonic space (Nissl series); (3–5) transcriptomic spaces for c-Fos mRNA, CRH mRNA, and CRH hnRNA (in situ hybridization series); and (6) functional space (induction of phosphorylated MAP kinases, pERK1/2; immunocytochemistry series). Also, Figure 20.5 of Watts and Khan (2013) shows a similar set of tissue views for other transcriptomic and proteomic spaces.
Using serially collected sections that sample one region uniformly still allows one to place the visualizable spaces from each series in registration with one another. Taking again the data in Figure 5 as an example, if one wished to examine the tissue series labeled for c-fos mRNA and ask in what brain region is the mRNA being expressed in response to an injection of NE in the region, one merely has to examine the adjacent Nissl series (panel B, top), and conclude that the c-Fos mRNA is in a region that is co-spatial with the region in the Nissl series that stains as a densely packed collection of cells corresponding to the paraventricular hypothalamus. Thus, to draw a conclusion about the cytoarchitectonic space for a tissue section containing only mRNA, one can “consult” adjacent cytoarchitectonic space containing the same brain region. Figure 5C illustrates how neuroanatomical reference works often include multiple serial tissue series for a region, each processed for separate visualizable spaces. In the case illustrated, which is from a beautiful atlas of the rat hindbrain by Wünscher et al. (1965), the hindbrain regions that contain integration structures relevant for feeding and metabolic control, such as the area postrema and nucleus of the solitary tract, can be visualized in the context of cytoarchitectonic (Figure 5Ci), myeloarchitectonic (Figure 5Cii), and angioarchitectonic (Figure 5Ciii) spaces. Similarly, the chemoarchitectonic rat brain atlas of Paxinos et al. (2009) includes stained sections for seven cellular markers, each from a separate series from a single brain.
4.5.1. Visualizable spaces within the intact, unsectioned brain: clarity as a solution to the intra-brain registration problem
Recently, the Deisseroth laboratory at Stanford University has reported the development of a tissue clearing method called CLARITY, which allows for the selective removal of lipids from the intact brain and their replacement by a nanoporous hydrogel that cross-links effectively with proteins, nucleic acids, and small molecules within cells; thereby preserving the overall cellular structure of the brain as a “tissue-hydrogel hybrid” (Chung and Deisseroth, 2013; Chung et al., 2013). Although the announcement of this new technology is very recent at the time of this writing, evaluation of the initial reports of its development suggest that the approach has the potential to greatly simplify the problem of having limited visualizable spaces within the brain that can be examined simultaneously. For one thing, tissue from a brain treated by CLARITY does not require sectioning; therefore, there are no sections that have to be placed in registration with one another. However, this is only one half of the challenge; the other would be to ensure that the brain, if not sectioned into adjacent series, would still be visualizable with multiple labels that would be chemically compatible with one another. This half of the challenge, too, seems surmountable with CLARITY, as the technique allows multiple rounds of immunocytochemistry, for example, to label the same brain structures through the use of electrophoretic tissue clearing (ETC) (Chung et al., 2013). In principle, the labeled (and transparent) brain could be imaged before each new round of labeling, so that the images could be superimposed upon each other in the same holistic visualizable space (which perhaps should be called “clarified space”). Intra-brain registration issues, therefore, appear soluble using this technique; however, as introduced in the next section, the challenge of inter-brain registration may well remain for some time even for this exciting new technology. Indeed, Chung et al. note (p. 510): “Turning immense data sets into useful insights remains a key challenge. Computational approaches to image segmentation, three-dimensional registration and automated tracing require further development.”
4.6. Registration of Visualizable Spaces within Two or More Separate Brains
“A concept (e.g., of a neuron) is the fruit of one's investigative approach to an object of nature. If one's approach had led to knowing the object, one would possess the truth with respect to it. It is for me an apriorism that so successful an approach is non-existent: truth is not to be had. The most we attain is an image of truth: a concept.”
“The History of the Neuron”
I open this section with the insight of van der Loos, because the registration of visualizable spaces becomes most powerful if it can be achieved with two or more separate brains; that is, if the visualized space in one brain can be “snapped into place” with a different space in another brain. The benefits of such a marriage are obvious: data across multiple studies, generated by separate labs in separate lands, could, in principle, be interrelated together. Inter-brain registration is a holy grail in neuroanatomy, the attempted solutions for which have involved complex registration efforts (e.g., Zitová and Flusser, 2003; Zaslavsky et al., 2010). Yet, even if we were to somehow place into registration, say, spatial information about an injection site from one brain with the spatial information provided by neuroanatomically traced neurons corresponding to that location in another brain, the most we attain is, as van der Loos states, an image of truth: a concept. This is to emphasize that there is no substitute for empirically determining your injection site or probe location in relation to the structures within the same brain. Anything short of this starts one upon a path of determining placement locations with ever-increasing sources of error, an idea that will become clearer as we explore ways to interrelate the visualizable spaces of different brains. As there are two possible scenarios for inter-brain registration of visualizable spaces, each with its own challenges, each will be dealt in turn.
4.6.1. Reference space as a solution to the first scenario
In the first scenario, two visualizable spaces in two separate brains appear to be in close correspondence with one another but it is difficult to verify this precisely. For example, the injection sites from one study may be in similar locations to those in another study, but differences in the plane of section of the tissue, or how the tissue was visualized, or how the visualizable space was documented in the study, or all three factors; may prevent precise knowledge of this fact. The solution to this scenario, as with many others like it, is to experimentally map the locations of the injection sites from one experiment to a reference space (Figure 6A), and to use the same reference space to map the injection sites of the second study. Thus, the relation becomes 1:R:2, where the visualizable space in one brain (1) and another (2) are mapped to a common reference space (R), as shown in Figure 6B. We have already dealt with an example of this in the first part of this article: recall in Figure 2E that the crystalline deposit sites for NE mapped by Grossman (1962) were in the reference space of de Groot's atlas, and the same reference space was used by Booth (1967) (Figure 2F) to map locations where he had injected the same neurotransmitter. The de Groot atlas, therefore, serves as one reference space that permits juxtaposing two datasets generated five years apart and in two separate laboratories.
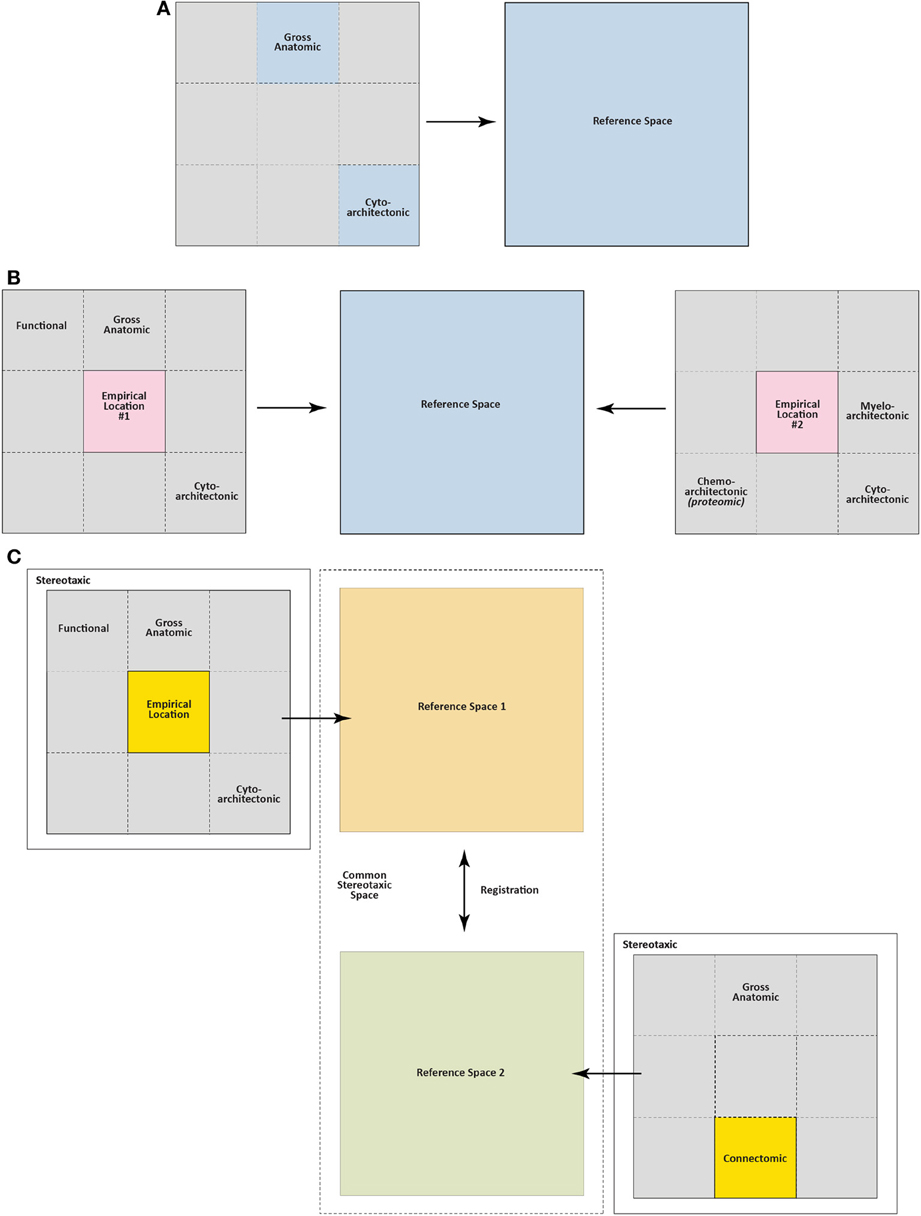
Figure 6. Reference space, stereotaxic space, and anatomical registration. (A) A reference space derived from the spatial analysis of a rodent brain. In this case, the visualizable spaces used to create the reference space include gross anatomic space and cytoarchitectonic space. (B) “Scenario One” for inter-brain registration, as described in Reference space as a solution to the first scenario. Mapping of two empirical locations (injection sites, for example) from two different brains to a common reference space. (C) “Scenario Two” for inter-brain registration, as described in Stereotaxic space as a coarse but viable solution to the second scenario. Datasets from two different visualizable spaces (empirical and connectomic) and from two different brains have each already been mapped to two different reference spaces, respectively. To bring these into registration (at least along a rostrocaudal axis) requires that they share common stereotaxic coordinates.
The beauty of using a reference space is that it links datasets in space and time, and the number of possible datasets such a space can hold is theoretically limitless, especially if the reference space exists in a digitally extensible format. Table 4 provides a list of reference spaces, for the rat brain or structures within it, that take advantage of stereotaxic coordinate space, which will be discussed shortly. Many of the more recently published reference spaces listed in the table have vector graphics files, such as atlas templates, in digital formats to accompany them. These digital atlas templates are incredibly useful for mapping experimental data in a reproducible and efficient manner. Although we have focused on the rat in this discussion, there are many other reference atlases available that can and are aiding behavioral studies. Some, such as the Allen Brain Atlas for the mouse (Lein et al., 2007), are searchable on the web (http://mouse.brain-map.org/), accompanied by a reference atlas in print form (Dong, 2008), and are being used as a springboard for new resources for facilitating IGI studies (e.g., Madisen et al., 2010). High-resolution atlases of the mouse brain (Li et al., 2010) and human brain (Amunts et al., 2013) have been published. Reference brain atlases for invertebrates also have been created, such as those for the C. elegans nematode (White et al., 1986; Hall and Russell, 1991), Heliothis, and Manduca moths (Kvello et al., 2009; Huetteroth et al., 2010), Tribolium red flour beetle (Dreyer et al., 2010), locust (el Jundi et al., 2010), honeybee (Rybak et al., 2010), and Drosophila fruit fly (Chiang et al., 2011; Shinomiya et al., 2011; Milyaev et al., 2012).
Of course, there are caveats with “jumping into” a reference space: expert knowledge is required to accurately “map” experimental data to such a space. It is important to remember that a reference space is originally created from the histological examination of a brain or set of brains in a few key visualizable spaces (Figure 6A). Therefore, your own experimental data, within the brain specimen you have processed, is being compared to another brain or set of brains. Just as you make choices about which visualizable spaces to detect in your tissue sample (e.g., “Should I use a Nissl stain, Weil stain or in situ hybridization on this tissue series?”), so too, have the authors in Table 4 made choices as to how to represent their reference spaces, and on what basis to create such spaces. For example, as shown in Figure 5C, for the atlas of Wünscher et al. (1965), the authors decided to utilize three visualizable spaces: cytoarchitectonic (Figure 5Ci), myeloarchitectonic (Figure 5Cii), and angioarchitectonic (Figure 5Ciii).
How does one accurately map experimental data to a reference space? Extensive discussion of this intricate issue is outside the scope of this article, but readers can turn to Swanson (2001, 2004), and Simmons and Swanson (2009); for one viewpoint concerning this topic. Essentially, experimentalists must choose structures within the visualizable spaces they can view, and utilize these chosen structures as fiducials with which to map their data onto a reference atlas. Of course, it is highly preferred to plan ahead and section the material from the completed experiment as close as possible to the plane of section used by the reference atlas chosen. The preferred fiducial structures to choose in one's sample are those basic landmarks that are included in the reference space as well, which will allow one to match one set of structures to the other. In making such selections, it is helpful to remember that it less likely for structures along the midline of the brain to vary drastically in the left vs. right hemispheres if a transverse section is sectioned with the intention of keeping both hemispheres similar in appearance to one another. Thus, “stable” structures such as the anterior commissure, or midline hypothalamic structures such as the suprachiasmatic nucleus, paraventricular hypothalamus, and rostral pole of the arcuate hypothalamus; are good fiducial structures that can be matched to the corresponding structures in a reference atlas. Comparing both sets of structures allows one to determine how close or far in plane the experimental tissue has been sectioned from that of the brain sectioned for use in the selected reference atlas. Although mapping experimental data to a reference space is not always straightforward, the rewards of careful effort are that investigators can now interrelate their data with any other data mapped to the same reference space.
One final note deserves mention about the use of reference spaces to map probe locations in the brain. Depending on how the brain used to produce the reference space is sectioned, a certain interval will exist between sections, which usually can vary for that space depending on which portion of the brain is sampled. For example, many atlases typically sample only a small portion of the olfactory bulb in the rat brain, and show therefore only a few representative plates from this generally longitudinally invariant structure. In other parts of the brain, the sampling frequency may be higher. Because of this, situations will arise when the experimenter finds the probe location they wish to map to fall exactly between reference plates in an atlas. In such situations, a choice is made to either map the location of the injection to the nearest atlas plate, or to forego mapping the location for that particular case. In rare instances, the authors will have access to the original tissue sections that form the basis of the reference atlas and find the unpublished section from the original series that falls between the mapped sections, and have a new map drawn for it (Kelly and Watts, 1998; Watts and Sanchez-Watts, 2007). To date, this author is not aware of chemical injection studies that have explicitly indicated on their maps whether they include injection site locations falling between reference atlas intervals. It is interesting that in his systematic exploration of electrical stimulation sites within the brain, Hess would distinguish sites “fitted” to the nearest reference plates from those “in register” with them through the use of distinguishable symbols marked on the summary maps themselves [e.g., see pp. 30–31 and pp. 64–65 of Hess (1957) for a description and representative maps, respectively, for his symbols]. Perhaps this practice should be revived.
4.6.2. Stereotaxic space as a coarse but viable solution to the second scenario
In the second scenario, two visualizable spaces in two separate brains have been mapped to two separate reference spaces, and the experimentalist does not have access to the original tissue sections for either brain, just the maps within the two separate reference spaces. Thus, the relations are, 1:R1 and 2:R2—where 1 and 2 are visualizable spaces from two separate brains and R1 and R2 are two different reference spaces. How does one reconcile these separate datasets? In this case, something must tether one set of data to the other. Fortunately, if both reference spaces contain information from stereotaxic coordinate space, such information could provide the tether needed to link the datasets (Figure 6C), provided that certain conditions are met.
4.6.2.1. Stereotaxic space. This is the only visualizable space discussed so far that is not residing in the brain per se, but is usually considered before intracranial manipulations are made in the live animal, when a stereotaxic atlas is consulted. Notice in Figure 4C its privileged position as a “visualizable space” surrounding the brain's other visualizable spaces, in relation to the complementary position held topologically by the skull (Figures 4A,B). Table 4 provides a list of stereotaxic atlases or individual stereotaxic studies for the rat. Stereotaxic space is three-dimensional space that is calibrated using skull reference points that, for the most part, do not change drastically so long as subjects fixed within the stereotaxic frame fall within a body weight range similar to that for the subjects used in the stereotaxic atlas (e.g., Paxinos et al., 1985), and the atlas ‘horizontal plane’ is used to place the subject in a similar orientation using the incisor bar of the stereotaxic instrument.
4.6.2.1.1. True vs. inferred stereotaxic space. Before an experiment, stereotaxic space is “visualizable” insofar as the movement of the stereotaxically held probe is concerned during the course of an experimental manipulation. This is when the coordinates are used to move glass pipettes or other delivery devices to deposit tracers, toxins, viruses, or chemical solutions (or implant chronic cannulas, microdialysis fibers, carbon fibers, electrodes, or optrodes, etc.) into pre-determined target locations based on Cartesian coordinates calibrated from surface features of the skull, which serve as “zero” points of origin. I refer to this as true stereotaxic space. After an experiment, stereotaxic space remains useful for estimating the position of histological material as it may have appeared in the original coordinate space, thereby allowing visualizable material to be mapped to a stereotaxic atlas. Of course, other criteria are needed to map such material, but the post-hoc invocation of an estimated coordinate in the anteroposterior axis, for example, is useful for basic registration purposes. I refer to this as inferred stereotaxic space (i.e., that which was not truly measured using a stereotaxic instrument firsthand).
True stereotaxic space may still play a role after an experiment under a few conditions. First, positional needles can be inserted into the brain, while it is still in the skull and the skull is in the stereotaxic instrument. The needles can be inserted in various orientations, and if their complete tracks appear during tissue sectioning, the experimenter knows that the tissue is being cut in register with the needle's original orientation (e.g., Paxinos and Watson, 1986). Thus, a full-length needle track appearing on the face of the tissue block marks the correct plane of section. Although the tissue is being processed after the experiment, it retains a mark of something positioned in true stereotaxic space. Second, brains can first be sectioned in stereotaxic space by keeping the skull in the stereotaxic instrument, chipping away the dorsal surface of the skull to expose the brain, and then using a blade fitted within the stereotaxic manipulator arm to produce large slabs of the brain at fixed intervals. For example, Burke et al. (2009) have used this method for the brain of a non-human primate. A slab could be cut further on a microtome to produce thinner sections that are parallel to its cut surface (Ireland and MacLeod, 1993).
Figure 7 illustrates tissue sections that exemplify both outcomes of stereotaxy: true and inferred. In Figure 7A, a portion of Plate 31 from the 1998 Paxinos and Watson atlas is shown, which has been sectioned “in plane” to the remaining atlas as seen from the needle track in the tissue that runs more or less continuously through its dorsoventral aspect on one side. Plate 31 was sampled at a Bregma coordinate of −2.80 mm; that is, 2.80 mm behind the Bregma suture on the skull. In contrast, Figure 7B shows a portion of immunohistochemical labeling for the Y1 subtype of the NPY receptor family in rat brain tissue, which was published by the Hökfelt laboratory (Kopp et al., 2002). The image was photographed under dark field illumination and the bright white labeling marks the immunoreactivity. Notice that in the upper right corner of this figure is a pair of coordinates: “−2.85v/−3.25d”; which indicate that the lower portion of the section is estimated to be in a transverse plane located 2.85 mm posterior to Bregma, whereas the dorsal portion of the section would be in a plane 3.25 mm posterior to Bregma. Clearly, the section was not cut a priori to align itself uniformly with any one level of a reference space, but the authors were careful in not only trying to helpfully provide inferred stereotaxic space information for this section, but to distinguish between differences in plane between the upper and lower parts of the section. This valuable information allows a reader of their report to independently align this labeling pattern to a stereotaxic reference space of their choosing. For example, consulting these inferred coordinates against the rat brain atlas of Swanson (2004), one can conclude that this tissue section falls somewhere within levels 28 and 29 of that atlas.
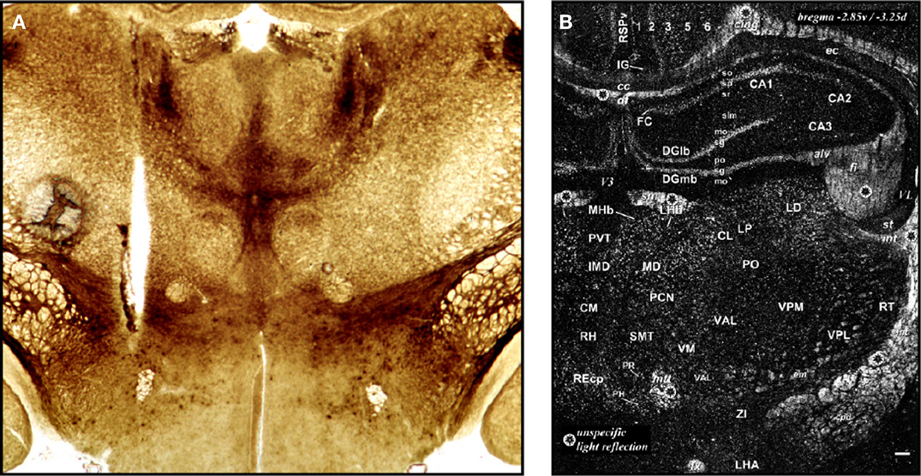
Figure 7. True vs. inferred stereotaxic space. In (A), which is a coronal section from a plate in Paxinos and Watson (1986), an example of tissue visualized using true stereotaxic space is shown. The needle track marks the location of a needle traversing the section through its cut plane while the subject was placed in a stereotaxic frame. (B) In contrast, stereotaxic location is only inferred in the histochemical labeling of the NPY Y1 receptor by Kopp et al. (2002). Note in the upper right corner the coordinates listed in relation to the dorsal or ventral aspects of the tissue section. Both panels reproduced with permission from Elsevier.
The distinction between true and inferred stereotaxic space is not simply semantic. The use of the word “true” for one space is not meant to indicate the other as “false”; indeed, both are equally useful depending on the situation. Moreover, both are just as easily prone to be inaccurate because of methodological error. The major differences, however, are the sources of the error for each type of space measure. For true stereotaxic space, incorrect probe or needle movements in any one of the three dimensions will throw a coordinate off its true mark. Many factors can make the final probe location vary from the intended location. For example, differences between the size and age of the animal used in one's study relative to that used for the reference atlas being consulted can introduce errors in stereotaxic placements. In the case of inferred space, the within-tissue patterns of labeling and fiducials that one uses to infer positional information is a matter of correct interpretation; incorrect judgments can introduce error to the estimate.
Thus, true stereotaxic space is space that is being navigated before and during the journey, when the ship's captain is “plotting a course” and “holding course”: in such cases, poor navigation and a failure at course correction will render the ship off course. In contrast, inferred stereotaxic space is unnavigated space that is being assessed after the journey has been made: in these cases, a failure to estimate one's position based on landmarks at the destination (azimuth, compass heading, coastlines) will result in a grossly overestimated or underestimated final position. Examine both panels of Figure 7 closely: from the tissue alone (ignoring labels and needle track), one does not necessarily know if (a) the stereotaxic space was measured; or (b) if it was measured, whether it is true or inferred. Generally speaking, details about the methods must provide that information (e.g., see Noordmans et al., 2004; discussed in Section 4.4.9.4). If they do not, the data are not so easily interpretable with respect to stereotaxic space. When interpreting an injection site location, it is critical to know how the location was measured, so as to be aware of the types and sources of error for the measurement.
4.6.2.2. Stereotaxic coordinates in publications protect location data. Information about stereotaxic coordinate space is critical to document alongside any dataset for which a precise localization of a probe, injection, or field of affected cells is needed, especially if the atlas used in conjunction with the coordinates falls out of common use over time, or if data from other types of visualizable space are not included in a publication containing the dataset. This is because the stereotaxic measurements are with respect to skull surface landmarks that are independent of the atlas being used. This fact has enormous implications: the proper documentation of coordinates within a publication prevent the anatomical data of an injection study from become un-interpretable by allowing for the locations of the injection sites to potentially be placed in register with a more current stereotaxic atlas. Since the newer atlas also is calibrated with respect to skull landmark position, the inclusion of coordinates for stereotaxic space within the older study could potentially liberate its data, preventing them from languishing in a reference space that few people use any longer.
4.6.2.3. Atlas registration. Returning, then to the second scenario discussed earlier: 1:R1 and 2:R2; two separate visualizable spaces, mapped in two separate reference spaces, can be placed in registration with one another by using stereotaxic coordinates that both reference spaces can relate to. However, this is possible only if certain conditions are met. For example, if R1 and R2 both have atlas plates that are calibrated to Bregma (the reference point on the skull surface where the coronal and sagittal sutures intersect), then they are potentially registerable with one another. Another critical factor is whether the basic angle of the surface of the skull with respect to the horizontal plane of reference used by each reference space is similar for both R1 and R2.
Figure 8 presents a system for registering two families of atlases for the rat brain that have been in popular use: those published by Paxinos and Watson (1982, 1986, 1997, 1998, 2005, 2007, 2014) and Swanson (1992, 1999, 2004), hereafter referred to as PW and S, respectively. For the following descriptions, the reader is asked to refer to the left side of Figure 8. The PW atlases actually fall into two subgroups: PW1 refers to the first four editions of the atlas (1982, 1986, 1997, and 1998; PW82, PW86, PW97, PW98, respectively) all of which contain the same histological dataset (i.e., they all use the same brain tissue from the same subjects). Each new edition in the PW1 grouping is an improvement upon the previous edition in important ways: PW86 and PW97 contain a revised nomenclature over PW82, PW97 and PW98 include two additional atlas plates that were not included in PW82 and PW86. In contrast, PW05, PW07 and PW14, which form PW2 reference space, are based on a completely different rat brain, one processed to create the atlases anew.
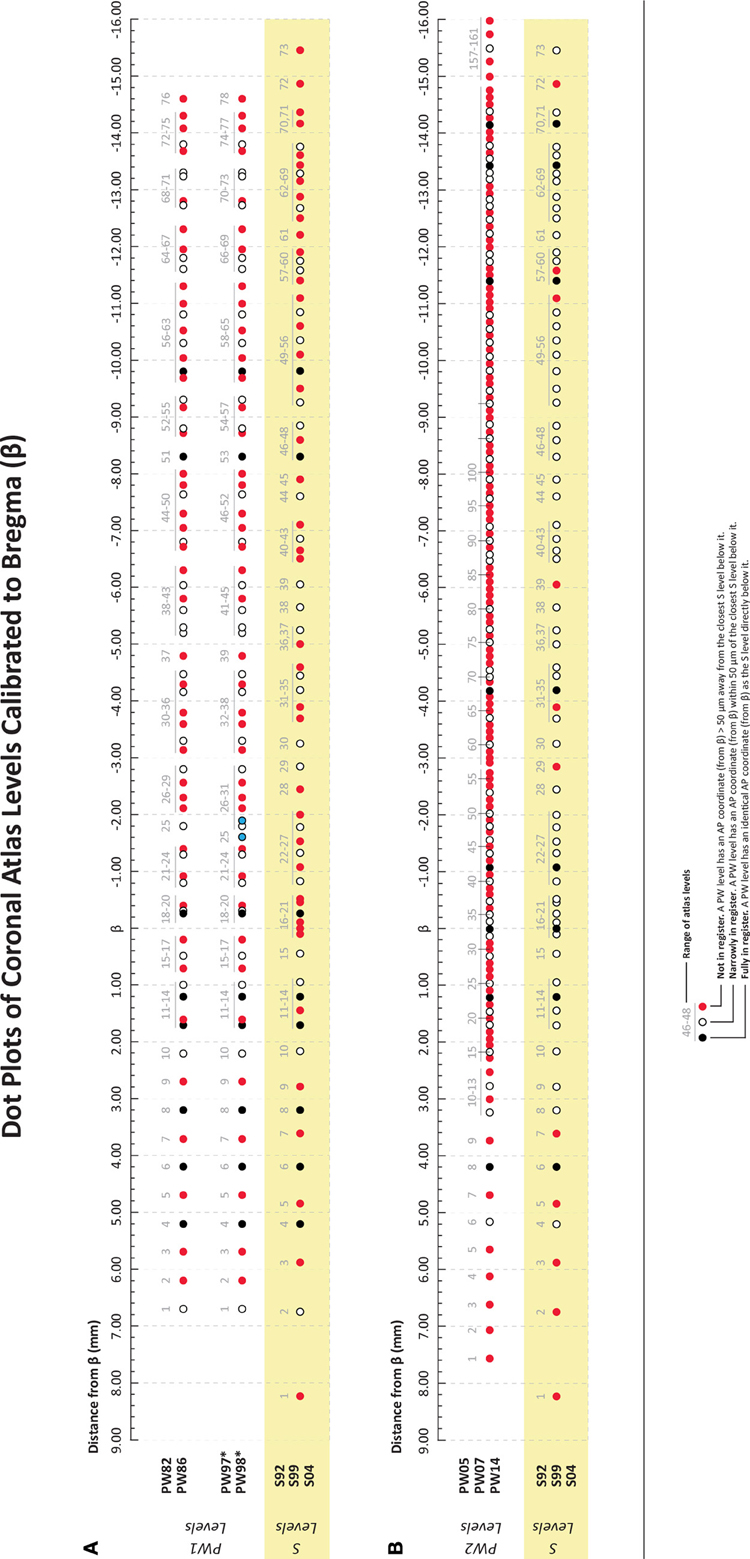
Figure 8. A reference chart to align ten canonical rat brain atlases along a uni-dimensional coordinate. (A) PW1 Levels = Atlas Levels from Paxinos and Watson Reference Space 1. This reference space consists of atlas levels from the first four editions of The Rat Brain in Stereotaxic Coordinates by George Paxinos and Charles Watson, published in 1982, 1986, 1997, and 1998 (designated PW82, PW86, PW97, and PW98), respectively. Editions 2–4 contain refinements of the atlas drawings in the first edition, but the actual tissue sections on which the drawings are based are the same as those used in the original edition. *The only exception to this rule is that PW97 and PW98 differ from PW82/86 in the addition of two levels from the original tissue set that had not been published in the earlier editions. These are highlighted as blue-colored dots. Because these additions alter the numbering scheme for the PW97 and PW98 levels from those of previous PW editions, they have been displayed separately from those editions. (B) PW2 Levels = Atlas Levels from Paxinos and Watson Reference Space 2. This second reference space for Paxinos and Watson consists of atlas levels from the fifth, sixth, and seventh editions of The Rat Brain in Stereotaxic Coordinates by George Paxinos and Charles Watson, published in 2005, 2007, and 2014 (designated PW05, PW07, PW14), respectively. They are in a separate reference space because the tissue used was from a different animal than that used for the earlier editions, which were actually based on tissue sections from several animals. For both panels (A,B): S Levels = Atlas Levels from Swanson Reference Space. This reference space for Swanson consists of atlas levels from all three editions of Brain Maps: The Structure of the Rat Brain by Larry W. Swanson, published in 1992, 1999, and 2004 (designated S92, S99, and S04), respectively. They are all within one reference space because the same tissue set has been used for each edition, with the editions differing primarily in the refinement of the drawings from this single tissue set. The atlas levels in PW1 or PW2 can be aligned with those in S space along the anteroposterior axis using a millimeter scale based on the skull suture landmark, Bregma. Atlas levels from PW1 or PW2 space that are in 100% registration along this dimension with a corresponding level of S space shown directly below it are depicted by a black dot (signifying “fully in register”). Those levels of PW1 or PW2 space that are within 50 μm of corresponding levels in S space are marked as white dots (with black borders). These levels are “narrowly in register” with one another. Finally, those levels between PW1 or PW2 spaces and S space that are greater than 50 μm apart are marked by red dots as “not in register.” See text for details.
The upper scale in Figure 8 is in millimeters rostral or caudal to the skull suture landmark, Bregma. Two sets of comparisons are made. In the upper panel, PW1 reference space is compared to S reference space, with atlas levels for these spaces marked by dots aligned along the Bregma scale to the nearest hundredths of a millimeter. Thus, PW82 and PW86, which share the same numerical scheme for atlas level numbering, are shown along the top row, with identical dots for their levels. The inclusion of two extra plates in PW97 and PW98 shifts the atlas level numbering scheme by two, thereby requiring a separate row of dots alongside PW82 and PW86 (with the new plate additions noted by blue dots). Finally the lowest row in the upper panel is for S92, S99, and S04 atlases of S space, all of which are from one brain and share the same numerical atlas level designations. In the lower panel, the same system has been constructed for PW2 reference space in comparison to S space (which is reproduced from the upper panel).
The final set of information that allows for the reader to interpret the chart in Figure 8 is about the dot symbols themselves. One reference space's levels (colored dots) need to be seen in relation to the other reference space's levels above or below it. Red dots signify atlas plates between PW and S spaces that are not in register with one another with respect to the Bregma coordinate. Black dots, in contrast, represent atlas levels in each space that are fully in register with one another by Bregma coordinate, out to the hundredths of a millimeter. Finally, white dots denote atlas levels within 50 μm of one another, i.e., narrowly in register.
A few observations can be made about these alignments. First, the outer diameter of a 33-gauge needle (typically among the smallest used for ICI methods) is 120 μm. Optical fibers for use in rats are typically between 100–500 μm in diameter (Zhang et al., 2010). Thus, the resolution of the atlas level registration conducted here between the reference spaces is well within the resolution of a single optical fiber or cannula needle, or recently developed μ-iLED-based semiconductor probes (with integrated assemblies being 200–400 mm wide; Kim et al., 2013b). The resolution is also far greater than the diameters of optical imaging probes (~350 μm) being developed for deep, direct visualization of hypothalamic and other structures (Kim et al., 2013a), and about the same order of magnitude as the diameter of a glass micropipette delivering virus or tracer (typically 10–50 μm).
Second, although details of this are being readied for publication elsewhere, key fiducials (tissue landmarks) within atlas photomicrographs of Nissl-stained sections corresponding to levels marked by “black” dots, which represent levels between the two atlas systems that are in full register with one another, appear to match up very well. Thus, two sets of structural information, one dependent on the planes of section and nearest neighbor relations within the tissue (fiducials), and the other independent of the brains (stereotaxic coordinates along Bregma), are consistent with one another and serve as a validation of this arrangement (Wells and Khan, 2013). Third, notice how levels in PW2 space are much more closely spaced than those in PW1 space: this is because tissue was sampled every 120 μm from the brain used to create the atlas in PW2 space; therefore, there is slightly more than twice the sampling frequency for PW2 over PW1 space. A consequence of this is that the ability to register levels of S space changes with respect to the two PW spaces: notice how more S levels are red (“not in register”) alongside PW1 levels, than when they are alongside PW2 levels. The greater sampling frequency of PW2 space allows for greater amounts of data between the two atlases to be in register with one another, underscoring the interdependency of different reference systems as they evolve and improve over time.
A major limitation of this atlas interconversion system is that it is only valid along one dimension of the three-dimensional Cartesian system that represents stereotaxic space. This is a critical point. Indeed, the mediolateral and dorsoventral dimensions between the two brains are very different, since the brains were histologically processed in different ways for each reference space (Wells and Khan, 2013). In PW atlases, the brains were frozen and then sectioned; in S space the brain was embedded in celloidin and therefore underwent a shrinkage that requires correction factors in both of these dimensions (the reader is referred to the front matter of the atlases for details about these processing steps). As noted by Swanson (2001), S space was actually aligned and linearly rescaled to be placed in register with PW space in the anteroposterior dimension; it is this rescaling that allowed stereotaxic coordinates to be inferred for S space [see pp. 173–174 of Swanson (2001)]. Thus, PW space is true stereotaxic space, and S space is inferred stereotaxic space based on alignments and linear re-scaling of S space to PW space. This alignment and rescaling is possible because the two reference spaces are based on brains cut in very similar planes of section, using the brains of relatively similar sized rats (albeit different strains). Importantly, this conversion system allows for only a somewhat coarse atlas registration along the rostrocaudal coordinate for studies that have probe placements in the dimensions specified above. True reference space inter-registration requires computational power, a topic that has received much attention in the field of brain imaging (e.g., see Toga and Thompson, 2001).
4.7. To Map or not to Map?
“The constraint of organized life offers a better approach to truth than does an uncontrolled imagination.”
The Anatomy of Mountain Ranges
There are perfectly defensible reasons why atlas-based approaches in neuroanatomy are not necessary for gaining an understanding of the location of probe placements or elements forming neural circuits underlying behavioral control. Armed with a Nissl-stained tissue series and a simple camera lucida set-up, one can describe with great accuracy where one's placements might be located in the brain and how these placements are related to surrounding populations of neurons. In some ways, representing histology through camera lucida drawings or photomicrographs of the stained tissue itself more accurately represents such data than a “reference map” would. However, as we shall see, a limitation of this approach is that it is very difficult to participate within a community-based effort to understand complex neural circuitry without placing one's dataset within a reference space that allows for inter-brain registration of data and for sophisticated databasing and computational tools to be brought to bear on the shared datasets. To be sure, mapping raw data to a reference space is an act of transformation that necessarily renders them into a form that is constrained by the interpretations inherent in the parcellation schemes of the reference space itself. But so long as the scientific community understands that a map of such data in reference space constitutes a data-constrained model of how circuits controlling behavior might be organized, which leads to one being able to test the model and refine it, then the approach has great merit. Of course, a conceptual model can be formulated without mapping to a reference atlas, but the model is based solely on the accumulated informal understanding by scientists of the locations where behavioral effects occur across multiple studies, without actually having the data from those studies integrated together formally (i.e., conventional wisdom). One therefore can easily suppose that a traced circuit in one study might be involved in feeding control, based on examining the injection sites in another study. Atlas-based data integration constrains and tests such suppositions so that a shared conceptual model becomes a shared data-constrained model, thereby allowing what is known about the organization of the brain itself, as Schaer notes above, to limit the “uncontrolled imagination” about how such organization might look like. In the next section, I discuss how data integration could allow for new insights to form and new hypotheses to be constructed that are constrained carefully by the shared information provided by accurately juxtaposed datasets.
5. Proposal: Toward a Community-Based Understanding of Feeding Control Circuits
In 1854, the English physician John Snow made history in the fields of epidemiology and medical geography by superimposing two seemingly unrelated location datasets of the Soho district of London upon one another. The first dataset was on a map and consisted of locations of the water pumps distributed throughout the neighborhood. The second dataset was his tally, by street, of the number of deaths in each household within that neighborhood, brought about as a result of a devastating cholera outbreak. While the mode of transmission for cholera was still believed to be airborne, Snow had long felt that the illness was transmitted through water: the superimposed locations of the water pumps and deaths served to illustrate this convincingly. He published his “spot map” (Dean, 1976) to illustrate his prior conclusions, providing visual evidence that the source of the outbreak was the Broad Street water pump (Brody et al., 2000; Johnson, 2006). The lesson here is that superimposing different datasets onto a common reference space can help communicate important insights about biology, or in Snow's case, pathobiology.
In the preceding sections, I have made the case for the close examination of neuroanatomical data within central microinjection studies. I first reviewed this field in Sections 2 and 3 highlighted ways to contextualize these studies within a theoretical framework of “visualizable spaces” in Section 4, and also discussed in Section 4 how intra-brain and inter-brain registration of datasets can be accomplished to a first approximation. Here, I illustrate the payoffs of adopting such approaches, with a worked example of how spatial information within diverse visualizable spaces can be juxtaposed to powerfully inform us about feeding control substrates and circuits. As we shall see, the field of ingestive behavior research is potentially poised to act in a manner analogous to Snow in superimposing various datasets upon one another, with the hopes of gaining new insights about feeding control circuits in the process.
5.1. Example: NPY Feeding Circuits
Recall from Section 2.3.4.1 that the feeding effects of NPY were examined systematically in a cannula-mapping study performed by Stanley et al. (1993b). In that study, they identified the perifornical hypothalamus as a site most sensitive to the orexigenic effects of centrally nanoinjected NPY. They also identified several other regions in the vicinity of the perifornical hypothalamus that also contained neural substrates sensitive to the peptide. Importantly, Stanley et al. also tracked the spread of radiolabeled NPY within tissue and were able to plot its recovery as a function of distance and time traveled from the injection site rostrocaudally. Finally, the locations of their effective injection sites were plotted within a reference space, the stereotaxic rat brain atlas of Paxinos and Watson (1986), which in the system of atlas registration presented in Figure 8, is part of PW1 reference space.
In the context of the topics discussed in Section 4 concerning visualizable spaces, atlas registration and atlas-based mapping, a few important facts present themselves concerning the NPY data just described: (1) the spread of the injected solution was empirically determined through defined distances in tissue; (2) certain atlas plates in PW1 reference space, containing NPY-sensitive sites, are partly or fully in register with levels of S reference space; (3) anterograde tracers such as PHA-L have been deposited at rostrocaudal levels that are in the vicinity of the NPY injection sites, thereby delineating neural efferent pathways from those regions; (4) these traced cells have been mapped in S reference space; and (5) the feeding-sensitive sites are situated near the known distributions of key feeding-related cell populations and receptors.
5.1.1. Aligning empirical, stereotaxic, and reference spaces to evaluate NPY feeding circuits
Given these facts, the schema in Figure 9 is presented. At the top of this figure, data obtained from the radiolabeling experiment (see Figure 3) of Stanley et al. (1993b) are re-plotted to reflect the hypothesis that the NPY is spreading from injection site “s,” which corresponds to the locus of NPY's effects as mapped in Figure 2H (see right side of Figure 2H; black circles representing intakes; the site that produced 13 g of food intake in 4 h). The percentages listed are those established by Stanley et al. (1993b), as the % of radiolabeled NPY recovered from the tissue (original inset B in Figure 3). The distance scale corresponding to the original data is re-plotted as the visualizable space called empirical space, in mm from the injection site. Given that the effective site is on a PW reference plate corresponding to a Bregma of −2.80 mm, this has been aligned to the empirical space as stereotaxic space (see panel A in Figure 9). In panel B, using the atlas conversion chart in Figure 8, PW atlas plates (labeled as “Reference Space 1”) are aligned with those S plates (“Reference Space 2”) that are in the vicinity of the rostrocaudal expanse traveled by the radiolabeled NPY.
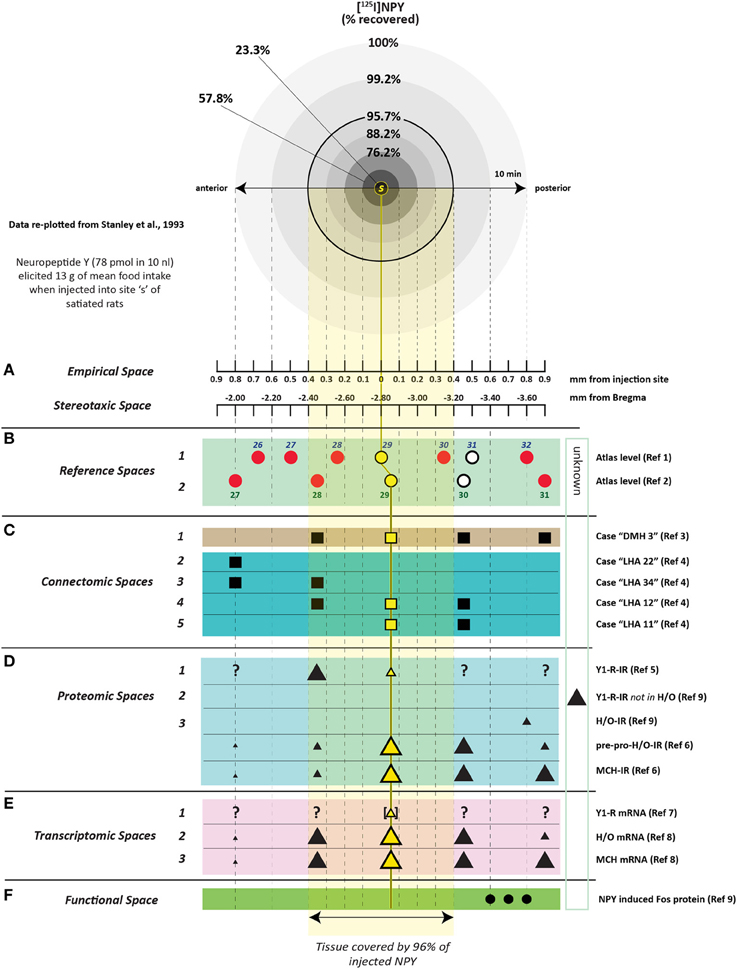
Figure 9. An example of how visualizable spaces can be aligned to help identify neural substrates underlying feeding triggered by an injection of neuropeptide Y. Data in the radial spread at the top of the figure are derived from the diffusion data of Stanley et al. (1993b) shown in Figure 3 in this article. The distance traveled by the diffusing solution of injected radiolabeled neuropeptide Y, is noted along a millimeter axis representing Empirical Space (A). This space, in turn, is aligned with Stereotaxic Space (also panel A), and then aligned with (B) Reference Space 1 (Paxinos and Watson, 1986) and Reference Space 2 (Swanson, 2004). Alignment to these Reference Spaces allows further registration and alignment with datasets mapped to these spaces, including (C) Connectomic Spaces; (D) Proteomic Spaces; (E) Transcriptomic Spaces; and (F) Functional Space. Reference numbers listed on the right side of the figure refer to the following studies in this articles reference list: Ref 1: (Paxinos and Watson, 1986); Ref 2: (Swanson, 2004); Ref 3: Thompson et al. (1996); Ref 4: Hahn and Swanson (2010); Ref 5: Kopp et al. (2002); Ref 6: Hahn (2010); Ref 7: (Kishi et al., 2005); Ref 8: (Swanson et al., 2005); Ref 9: (Campbell et al., 2003). See text for a detailed explanation of this figure.
5.1.2. Alignment of additional visualizable spaces
The consequences of placing these levels from two reference spaces in register is apparent from the data summarized in panels C–F of Figure 9, which describe the locations of elements in connectomic, proteomic, transcriptomic, and functional visualizable spaces, respectively.
5.1.2.1. Connectomic space alignment of traced circuits potentially affected by NPY injections. In panel C, Thompson et al. (1996) used the anterograde tracer, PHA-L, to label cell bodies within the DMH, which they subsequently mapped to Level 29 of Swanson (case “DMH3” in their study). Similarly, Hahn and Swanson (2010) mapped PHA-L-labeled cells at Level 29, located within the lateral hypothalamic area; see cases “LHA11” and “LHA12” in panel B. The implications of placing these tracer data in register with the NPY injection site is clear: given the general anatomical proximity of the LHA and DMH to the injection site at Level 29, and the spread of the injected NPY, it is very likely that NPY solution spread to the areas where the anterogradely traced neurons are located. If NPY receptors are located on these neurons, then this would suggest further that these traced neurons could have been activated by the injected NPY. So the next question we can ask is: are NPY receptors located in the DMH and LHA, and if so, have they been mapped to Level 29?
5.1.2.2. Chemoarchitectonic space alignments for NPY receptive neuronal phenotypes. The Y1 subtype of the NPY receptor (Y1-R) is believed to mediate, in part, the feeding effects of NPY in rats and mice (Stanley et al., 1992; Lopez-Valpuesta et al., 1996; Kanatani et al., 2000; see Gehlert, 1999 for a discussion of the contributions of NPY receptor subtypes in food intake control). Knowing the distribution of NPY receptors, particularly the Y1-R, in relation to the location of the NPY injection site is important to begin understanding how NPY's orexigenic effects might be mediated. For proteomic spaces (panel D), recall from Section 4.6.2.1.1 that Kopp et al. (2002) reported the distribution of immunoreactivity for the Y1-R, and their inferred coordinates corresponded to Levels 28 and 29 of Swanson (2004) (e.g., see inferred Bregma coordinates listed at the upper right of Figure 7B). Thus, it is likely that Y1-Rs are expressed at these atlas levels.
Within proteomic space, however, it would be of further benefit if the neuronal phenotype (or phenotypes) that expresses the Y1-R has been identified at these atlas levels. What phenotypes are present at or near these levels and what is known about their abilities to respond to NPY via the Y1-R? Campbell et al. (2003) and Hahn (2010) have noted the existence of hypocretin/orexin (H/O)-expressing neurons in and around this region, and Hahn (2010) has also reported melanin concentrating hormone (MCH)-immunoreactive neurons at Levels 28 and 29. Along these same lines, panel E of Figure 9 shows “transcriptomic spaces” corresponding to the known distributions of mRNA for Y1-Rs (Kishi et al., 2005); H/O (Swanson et al., 2005); and MCH mRNAs (Swanson et al., 2005), which again corroborate distributions at these levels.
With respect to proteomic space and Y1-Rs on H/O or MCH phenotypes, a few other studies merit attention. Campbell et al. (2003) reported that Y1-R-immunoreactivity is not present on H/O neurons, but this observation was not specified to a rostrocaudal level. This absence of location data is noted as “unknown” (Figure 9, light blue box to the right). Fetissov et al. (2003) also reported the absence of Y1-Rs on H/O neurons. Y1-R presence or absence on H/O neurons notwithstanding, it also has been shown for mouse hypothalamic slices that the predominant electrophysiological action of NPY on H/O neurons is inhibitory (Fu et al., 2004). Assuming, therefore, that these findings generalize to rats and are also observed in vivo, any speculation on NPY triggering feeding through actions at H/O neurons would have to reconcile this direct inhibitory effect of NPY on H/O neurons with NPY's ability to activate a feeding circuit via the Y1-R following its central nanoinjection into the perifornical region. Indeed, Fu et al. (2004) also showed that Y1-R agonists reproduced NPY's inhibitory effect on H/O neurons: even if H/O neurons had Y1-Rs, they would likely be inhibited by these receptors. What about MCH neurons at these levels? Y1-Rs are also reportedly absent on MCH neurons [(Fetissov et al., 2003); unpublished observations of Campbell et al. (2003), p. 1495], and again, Fu et al. (2004) reported that NPY directly inhibits MCH neurons, so any model suggesting MCH neurons could represent the neuronal phenotype mediating NPY's orexigenic actions must also incorporate this as a constraint. Whether putative orexigenic actions of NPY on H/O or MCH neurons involves inhibition of an inhibitory circuit (disinhibition) remains to be seen.
Fetissov et al. (2003) also reported the presence of Y1-Rs on neurons that express nitric oxide synthase (NOS). These neurons were found in the ventromedial hypothalamus, and to a lesser extent the perifornical hypothalamus, although it again is unclear at what rostrocaudal level within the hypothalamus these neurons are found. However, in their Chemoarchitectonic Atlas of the Rat Brain, Paxinos et al. (2009) provide photomicrographic documentation for neurons stained for NOS at an inferred stereotaxic coordinate of 2.913 mm posterior to Bregma (see their Figure 193). These neurons, which were stained for NOS using a nicotinamide adenine dinucleotide phosphate diaphorase (NADPH diaphorase) stain (which marks NOS in a manner that does not require antibody staining), were located within the ventromedial and perifornical hypothalamus, confirming the findings of Fetissov et al. Importantly, the inferred stereotaxic space helps to strengthen the likelihood that the Y1-R-positive NOS neurons identified by Fetissov et al. (2003) are at or near Levels 28 or 29 of Swanson reference space.
Functional space has also been mapped in relation to NPY stimulation, which, according to the report from Campbell et al. (2003), triggered Fos protein at one level of Reference Space 1 and two additional locations not registerable to any reference space level (Figure 9F). However, the investigators noted that intra-hypothalamic injection of NPY in the vicinity of the perifornical region did not trigger Fos expression in H/O or MCH neurons, consistent with the observations of Fu et al. (2004) that NPY inhibits these neurons. Finally, notice that the registration of all of these visualizable spaces allows us to extrapolate on the basis of Stanley et al. (1993b) that 96% of the radiolabeled NPY injected into site “s” will spread to rostral and caudal sites up to 0.4 mm away (as illustrated by the yellow box in Figure 9). Level 29 of Swanson marks the “epicenter” of the manipulation, and all cellular elements shown in yellow are located at the same anteroposterior level as the NPY injection site.
5.2. Neuroinformatics Tools to Automate the Reasoning Process
The example just worked through (Figure 9) illustrates the power of utilizing visualizable spaces, atlas registration, and empirical data concerning central injection of an orexigenic agent (e.g., NPY) to create a model where the influence of this neuropeptide is constrained across space and time to a few mapped cellular elements, some of which have established, traced connections to other regions of the brain. Ideally, then, such an exercise ought not to be performed by a human experimentalist but by a computational program that interacts with neuroinformatics-based databases containing records of curated experimental data from tract-tracing experiments.
The Swanson laboratory has constructed such a system for use with multiple animal models, especially the rat (Bota et al., 2012). Specifically, the Brain Architecture Management System (or BAMS; http://brancusi.usc.edu/), is a neuroinformatics workbench that allows one to query connections that have been mapped to the Swanson reference space or other reference spaces, including Paxinos and Watson reference spaces. As of 2013, over 70,000 connection reports exist in the BAMS database (Bota et al., 2012; Bota and Talpalaru, 2013). The main argument, then, for creating a system whereby information can be placed in basic registration with the Swanson reference space is to thereby access all the mapped connections in S space that are found in BAMS. Since multiple experimental datasets are present within BAMS, generated by diverse investigators, the mapping of one's experimental data to the S reference space allows one to participate in a community-based project focused on understanding brain circuits. A prototype co-registration system, called NeuARt II has been released by the Swanson group as a proof-of-concept that allows for the superimposition of location data from a variety of visualizable spaces (connectomic, proteomic, empirical, etc.) onto horizontal and transverse templates of S reference space (Burns et al., 2006). Other proofs-of-concept related to these efforts include electronic laboratory notebook tools and knowledge management systems to help sort and organize the data obtained for multiple visualizable spaces (Burns et al., 2003; Khan et al., 2006), and proposed formalizations of modeling language to manage connectivity data (Brown and Swanson, 2013). Finally, the second and third editions of the Swanson atlas (Swanson, 1999, 2004) include digital templates of each atlas plate in Adobe Illustrator format (discussed in Swanson, 2001). One can readily superimpose datasets onto these atlas plates by using the layer manager palette in Illustrator to overlay a transparent layer onto the atlas map and place location data in register with other data drawn onto different layers.
6. Concluding Remarks
Pioneering creatures, when venturing or peering into uncharted places, usually return helpful information about the locations of such places to their companions. Subsequent journeys or observations then refine the initial maps that are formed of these places, in a form of culture- and community-based quorum sensing (Huth, 2013). Evidence for this is well documented for honeybees (von Frisch, 1953; Seeley and Visscher, 2004; Visscher, 2007; Seeley et al., 2012), cosmologists (Ferris, 1983; Rowan-Robinson, 1985), Antarctic explorers (Shackleton, 1919; Byrd, 1938; Sullivan, 1957; Pulsifer and Taylor, 2005; Pulsifer et al., 2005, 2007), and neuroscientists (Table 4; see also Figure 2 in Swanson, 2000b). Members of the last group, venturing out for their first time, are just as likely as the first three groups, if not more, to become lost if the valuable spatial information provided by their pioneers is ignored, forgotten, or misunderstood.
7. Note Added in Proof
The Stuber laboratory has recently reported that optogenetic stimulation of GABAergic neurons in the bed nucleus of the stria terminalis suppresses the activity of lateral hypothalamic glutamatergic neurons to stimulate food intake (Jennings et al., 2013). In their published Supplementary Material, optical fiber placements are plotted in gross anatomic and stereotaxic space.
Conflict of Interest Statement
The author declares that the research was conducted in the absence of any commercial or financial relationships that could be construed as a potential conflict of interest.
Acknowledgments
The author is indebted to Dr. Sabiha Khan for translation of some primary source material, for critical editing of the manuscript, and for encouragement and support during the various stages of this project. The author also thanks Drs. Kent Berridge, Glenn Stanley, Larry Swanson, Alan Watts, and especially Richard H. Thompson for thoughtful discussions; and Dr. James Eglin, Jr., for permission to reproduce a portion of the data from his unpublished thesis. The author also thanks Ms. Karina Castillo at the Branson Library of New Mexico State University for assistance with information for Table 4. Research in the UTEP Systems Neuroscience Laboratory is supported by a grant from the National Institute of Diabetes and Digestive and Kidney Disorders (DK081937) and by funds awarded from a grant to the Border Biomedical Research Center from the National Center for Research Resources (RR008124) and the National Institute on Minority Health and Health Disparities (MD007592). The author also thanks Dr. Robert Kirken (UTEP) for support of this project, and all the students in the UTEP Systems Neuroscience Laboratory for intellectually stimulating discussions regarding topics covered in this article.
References
Abbott, S. B. G., DePuy, S. D., Nguyen, T., Coates, M. B., Stornetta, R. L., and Guyenet, P. G. (2013). Selective optogenetic activation of rostral ventrolateral medullary catecholaminergic neurons produces cardiorespiratory stimulation in conscious mice. J. Neurosci. 33, 3164–3177. doi: 10.1523/JNEUROSCI.1046-12.2013
Abbott, S. B. G., Stornetta, R. L., Coates, M. B., and Guyenet, P. G. (2011). Phox2b-expressing neurons of the parafacial region regulate breathing rate, inspiration, and expiration in conscious rats. J. Neurosci. 31, 16410–16422. doi: 10.1523/JNEUROSCI.3280-11.2011
Adamantidis, A., Zhang, F., Aravanis, A. M., Deisseroth, K., and de Lecea, L. (2007). Neural substrates of awakening probed with optogenetic control of hypocretin neurons. Nature 450, 420–424. doi: 10.1038/nature06310
Akert, K., and Welker, W. I. (1962). “Problems and methods of anatomical localization,” in Electrical Stimulation of the Brain: an Interdisciplinary Survey of Neurobehavioral Integrative Systems, ed D. E. Sheer (Austin, TX: University of Texas Press), 251–260.
Albe-Fessard, D., Stutinsky, F., and Libouban, S. (1966). Atlas Stéréotaxique du Diencéphale du Rat Blanc. Paris: Editions du Centre National de la Recherche Scientifique.
Alegría, F. A. (1973). Método estereotáxico para la electroencefalografía en la rata. Rev. Med. Univ. Navarra 17, 79–83.
Alexander, G. M., Rogan, S. C., Abbas, A. I., Armbruster, B. N., Pei, Y., Allen, J. A., et al. (2009). Remote control of neuronal activity in transgenic mice expressing evolved G protein-coupled receptors. Neuron 63, 27–39. doi: 10.1016/j.neuron.2009.06.014
Alivisatos, A. P., Chun, M., Church, G. M., Deisseroth, K., Donoghue, J. P., Greenspan, R. J., et al. (2013). The brain activity map. Science 339, 1284–1285. doi: 10.1126/science.1236939
Al-Juboori, S. I., Dondzillo, A., Stubblefield, E. A., Felsen, G., Lei, T. C., and Klug, A. (2013). Light scattering properties vary across different regions of the adult mouse brain. PLoS ONE 8:e67626. doi: 10.1371/journal.pone.0067626
Ambach, G., and Palkovits, M. (1979). “The blood supply of the hypothalamus in the rat,” in Handbook of the Hypothalamus, Volume 1: Anatomy of the Hypothalamus, eds P. J. Morgane and J. Panksepp (New York, NY: Marcel Dekker), 267–378.
Amunts, K., Lepage, C., Borgeat, L., Mohlberg, H., Dickscheid, T., Rousseau, M.-E., et al. (2013). BigBrain: an ultrahigh-resolution 3D human brain model. Science 340, 1472–1475. doi: 10.1126/science.1235381
Anand, B. K., and Brobeck, J. R. (1951a). Localization of a “feeding center” in the hypothalamus of the rat. Proc. Soc. Exp. Biol. Med. 77, 323–324. doi: 10.3181/00379727-77-18766
Anand, B. K., and Brobeck, J. R. (1951b). Hypothalamic control of food intake in rats and cats. Yale J. Biol. Med. 24, 123–140.
Anderson, D. J. (2012). Optogenetics, sex, and violence in the brain: implications for psychiatry. Biol. Psychiatry 71, 1081–1089. doi: 10.1016/j.biopsych.2011.11.012
Andersson, B. (1952). Polydipsia caused by intrahypothalamic injections of hypertonic-NaCl solutions. Experientia 8, 157–159. Cell. Mol. Life Sci. doi: 10.1007/BF02170230
Andersson, B. (1953). The effect of injections of hypertonic NaCl-solutions into different parts of the hypothalamus of goats. Acta Physiol. Scand. 28, 188–201. doi: 10.1111/j.1748-1716.1953.tb00969.x
Andersson, B., Jewell, P. A., and Larsson, S. (1958). “An appraisal of the effects of diencephalic stimulation of conscious animals in terms of normal behaviour,” in A CIBA Foundation Symposium on the Neurological Basis of Behaviour, eds G. E. W. Wolstenholme and C. M. O'Connor (London: J. and A., Churchill, Ltd), 76–85. discussion: 85–89.
Aponte, Y., Atasoy, D., and Sternson, S. M. (2011). AGRP neurons are sufficient to orchestrate feeding behavior rapidly and without training. Nat. Neurosci. 14, 351–355. doi: 10.1038/nn.2739
Armbruster, B. N., Li, X., Pausch, M. H., Herlitze, S., and Roth, B. L. (2007). Evolving the lock to fit the key to create a family of G protein-coupled receptors potently activated by an inert ligand. Proc. Natl. Acad. Sci. U.S.A. 104, 5163–5168. doi: 10.1073/pnas.0700293104
Armstrong, W. E., Warach, S., Hatton, G. I., and McNeill, T. H. (1980). Subnuclei in the rat hypothalamic paraventricular nucleus: a cytoarchitectural, horseradish peroxidase and immunocytochemical analysis. Neuroscience 5, 1931–1958. doi: 10.1016/0306-4522(80)90040-8
Aronsohn, E., and Sachs, J. (1885). Die Beziehungen des Gehirns zur Körperwärme und zum Fieber. Pflügers Arch. 37, 232–301. doi: 10.1007/BF01752423
Atasoy, D., Betley, J. N., Su, H. H., and Sternson, S. M. (2012). Deconstruction of a neural circuit for hunger. Nature 488, 172–177. doi: 10.1038/nature11270
Bakshi, V. P., and Kelley, A. E. (1993). Striatal regulation of morphine-induced hyperphagia: an anatomical mapping study. Psychopharmacology (Berl.) 111, 207–214. doi: 10.1007/BF02245525
Balthasar, N., Dalgaard, L. T., Lee, C. E., Yu, J., Funahashi, H., Williams, T., et al. (2005). Divergence of melanocortin pathways in the control of food intake and energy expenditure. Cell 123, 493–505. doi: 10.1016/j.cell.2005.08.035
Barbour, H. G. (1912). Die Wirkung unmittelbarer Erwärmung und Abkühlung der Wärmezentra auf die Körpertemperatur. Arch. Exp. Pathol. Pharmakol. 70, 1–26. Naunyn-Schmiedeberg's Arch. Pharmacol. doi: 10.1007/BF01865333
Barbour, H. G. (1932). Experimental Pharmacology and Toxicology: a Selected Laboratory Course. Philadelphia: Lea and Febiger.
Baxter, B. L. (1967). Comparison of the behavioral effects of electrical or chemical stimulation applied at the same brain loci. Exp. Neurol. 19, 412–432. doi: 10.1016/0014-4886(67)90162-8
Bepari, A. K., Sano, H., Tamamaki, N., Nambu, A., Tanaka, K. F., and Takebayashi, H. (2012). Identification of optogenetically activated striatal medium spiny neurons by Npas4 expression. PLoS ONE 7:e52783. doi: 10.1371/journal.pone.0052783
Bernardis, L. L., and Skelton, F. R. (1965). Stereotaxic localization of supraoptic, ventromedial and mammillary nuclei in the hypothalamus of weanling to mature rats. Am. J. Anat. 116, 69–73. doi: 10.1002/aja.1001160104
Bernstein, J. G., Garrity, P. A., and Boyden, E. S. (2012). Optogenetics and thermogenetics: technologies for controlling the activity of targeted cells within intact neural circuits. Curr. Opin. Neurobiol. 22, 61–71. doi: 10.1016/j.conb.2011.10.023
Berthoud, H.-R., and Morrison, C. (2008). The brain, appetite, and obesity. Annu. Rev. Psychol. 59, 55–92. doi: 10.1146/annurev.psych.59.103006.093551
Berthoud, H.-R., and Münzberg, H. (2011). The lateral hypothalamus as integrator of metabolic and environmental needs: from electrical self-stimulation to opto-genetics. Physiol. Behav. 104, 29–39. doi: 10.1016/j.physbeh.2011.04.051
Bickel, A. (1898). Zur vergleichenden physiologie des grosshirns. Pflügers Arch. 72, 190–215. doi: 10.1007/BF01662292
Bleier, R., Cohn, P., and Siggelkow, I. R. (1979). “A cytoarchitectonic atlas of the hypothalamus and hypothalamic third ventricle of the rat,” in Handbook of the Hypothalamus, Volume 1: Anatomy of the Hypothalamus, eds P. J. Morgane and J. Panksepp (New York, NY: Marcel Dekker), 137–220.
Blevins, J. E., Stanley, B. G., and Reidelberger, R. D. (2000). Brain regions where cholecystokinin suppresses feeding in rats. Brain Res. 860, 1–10. doi: 10.1016/S0006-8993(99)02477-4
Bloom, F. E. (1975). “The gains in brain are mainly in the stain,” in The Neurosciences: Paths of Discovery, eds F. G. Worden, J. P. Swazey, and G. Adelman (Cambridge: MIT Press), 211–227.
Booth, D. A. (1967). Localization of the adrenergic feeding system in the rat diencephalon. Science 158, 515–517. doi: 10.1126/science.158.3800.515
Booth, D. A. (1968). Mechanism of action of norepinephrine in eliciting an eating response on injection into the rat hypothalamus. J. Pharmacol. Exp. Ther. 160, 336–348.
Booth, D. A. (1990). “The behavioral and neural sciences of ingestion,” in Handbook of Behavioral Neurobiology. Vol. 10: Neurobiology of Food and Fluid Intake, ed E. M. Stricker (New York, NY: Plenum), 465–488. doi: 10.1007/978-1-4613-0577-4_17
Bota, M., Dong, H., and Swanson, L. W. (2012). Combining collation and annotation efforts toward completion of the rat and mouse connectomes in BAMS. Front. Neuroinform. 6:2. doi: 10.3389/fninf.2012.00002
Bota, M., and Talpalaru, S. (2013). “BAMS2: an online platform for handling connectome data. Program No. 101.01.” in 2013 Neuroscience Meeting Planner. (San Diego, CA: Society for Neuroscience, 2013).
Bouret, S. G. (2012). RIPping off GABA release in hypothalamic circuits causes obesity. Cell Metab. 16, 557–558. doi: 10.1016/j.cmet.2012.10.014
Boyden, E. S., Zhang, F., Bamberg, E., Nagel, G., and Deisseroth, K. (2005). Millisecond-timescale, genetically targeted optical control of neural activity. Nat. Neurosci. 8, 1263–1268. doi: 10.1038/nn1525
Brobeck, J. R. (1955). Neural regulation of food intake. Ann. N.Y. Acad. Sci. 63, 44–55. doi: 10.1111/j.1749-6632.1955.tb36544.x
Brodmann, K. (1909). Vergleichende Lokalisationslehre der Groβ hirnrinde: in ihren Prinzipien dargestellt auf Grund des Zellenbaues (English translation published as Brodmann's Localisation in the Cerebral Cortex: The Principles of Comparative Localization in the Cerebral Cortex Based on Cytoarchitectonics), Transl. ed L. J. Garey (Leipzig: Johann Ambrosius Barth; New York, NY: Springer).
Brody, H., Rip, M. R., Vinten-Johansen, P., Paneth, N., and Rachman, S. (2000). Map-making and myth-making in Broad Street: the London cholera epidemic, 1854. Lancet 356, 64–68. doi: 10.1016/S0140-6736(00)02442-9
Brown, R. A., and Swanson, L. W. (2013). Neural systems language: a formal modeling language for the systematic description, unambiguous communication, and automated digital curation of neural connectivity. J. Comp. Neurol. 521, 2889–2906. doi: 10.1002/cne.23348
Brownstein, M. J., and Palkovits, M. (1984). “Catecholamines, serotonin, acetylcholine and γ-aminobutyric acid in the rat brain: biochemical studies,” in Handbook of Chemical Neuroanatomy, Vol. 2 Classical Transmitters in the CNS, Part, I, eds A. Björklund and T. Hökfelt (Amsterdam: Elsevier), 23–54.
Buijs, R. M., Chun, S. J., Niijima, A., Romjin, H. J., and Nagai, K. (2001). Parasympathetic and sympathetic control of the pancreas: a role for the suprachiasmatic nucleus and other hypothalamic centers that are involved in the regulation of food intake. J. Comp. Neurol. 431, 405–423. doi: 10.1002/1096-9861(20010319)431:4<405::AID-CNE1079>3.0.CO;2-D
Burke, M. W., Zangenehpour, S., Boire, D., and Ptito, M. (2009). Dissecting the non-human primate brain in stereotaxic space. J. Vis. Exp. 29, 1259. doi: 10.3791/1259
Burns, G. A., Cheng, W.-C., Thompson, R. H., and Swanson, L. W. (2006). The NeuARt II system: a viewing tool for neuroanatomical data based on published neuroanatomical atlases. BMC Bioinformatics 7:531. doi: 10.1186/1471-2105-7-531
Burns, G. A., Khan, A. M., Ghandeharizadeh, S., O'Neill, M. A., and Chen, Y. S. (2003). Tools and approaches for the construction of knowledge models from the neuroscientific literature. Neuroinformatics 1, 81–109. doi: 10.1385/NI:1:1:081
Cador, M., Leyyey, A. E., Le Moal, M., and Stinus, L. (1986). Ventral tegmental area infusion of Substance, P, neurotensin and encephalin: differential effects on feeding behavior. Neuroscience 18, 659–669. doi: 10.1016/0306-4522(86)90061-8
Cai, D., Cohen, K. B., Luo, T., Lichtman, J. W., and Sanes, J. R. (2013). Improved tools for the Brainbow toolbox. Nat. Methods 10, 540–547. doi: 10.1038/nmeth.2450
Calu, D. J., Kawa, A. B., Marchant, N. J., Navarre, B. M., Henderson, M. J., Chen, B., et al. (2013). Optogenetic inhibition of dorsal medial prefrontal cortex attenuates stress-induced reinstatement of palatable food seeking in female rats. J. Neurosci. 33, 214–226. doi: 10.1523/JNEUROSCI.2016-12.2013
Campbell, R. E., Smith, M. S., Allen, S. E., Grayson, B. E., Ffrench-Mullen, J. M., and Grove, K. L. (2003). Orexin neurons express a functional pancreatic polypeptide Y4 receptor. J. Neurosci. 23, 1487–1497.
Camus, J., and Roussy, G. (1920). Experimental researches on the pituitary body: diabetes insipidus, glycosuria and those dystrophies considered as hypophyseal in origin. Endocrinology 4, 507–522. doi: 10.1210/endo-4-4-507
Card, J. P., and Enquist, L. W. (1999). Transneuronal circuit analysis with pseudorabies viruses. Curr. Protoc. Neurosci. Unit 1.5(Suppl. 9), 1.51–51.5.28. doi: 10.1002/0471142301.ns0105s09
Card, J. P., Kobiler, O., McCambridge, J., Ebdlahad, S., Shan, Z., Raizada, M. K., et al. (2011). Microdissection of neural networks by conditional expression from a Brainbow herpesvirus. Proc. Natl. Acad. Sci. U.S.A. 108, 3377–3382. doi: 10.1073/pnas.1015033108
Carter, M. E., de Lecea, L., and Adamantidis, A. (2013). Functional wiring of hypocretin and LC-NE neurons: implications for arousal. Front. Behav. Neurosci. 7:43. doi: 10.3389/fnbeh.2013.00043
Chamberlin, N. L., Du, B., de Lacalle, S., and Saper, C. B. (1998). Recombinant adeno-associated virus vector: use for transgene expression and anterograde tract tracing in the CNS. Brain Res. 793, 169–175. doi: 10.1016/S0006-8993(98)00169-3
Chan, S., Bernstein, J., and Boyden, E. (2010). Scalable fluidic injector arrays for viral targeting of intact 3-D brain circuits. J. Vis. Exp. 35, 1489. doi: 10.3791/1489
Chauffard, A., and Quénu, V. (1898). Tétanos traumatique traité et guéri par injection intracérébrale d'antitoxine, méthode de E. Roux et A. Borrel. Presse Méd. Par. 1, 325–327.
Chiang, A. S., Lin, C.-Y., Chuang, C.-C., Chang, H.-M., Hsieh, C.-H., Yeh, C.-W., et al. (2011). Three-dimensional reconstruction of brain-wide wiring networks in Drosophila at single-cell resolution. Curr. Biol. 21, 1–11. doi: 10.1016/j.cub.2010.11.056
Chieng, B., and Bekkers, J. M. (2001). Inhibition of calcium channels by opioid- and adenosine-receptor agonists in neurons of the nucleus accumbens. Br. J. Pharmacol. 133, 337–344. doi: 10.1038/sj.bjp.0704072
Christ, J. F. (1969). “Derivation and boundaries of the hypothalamus, with atlas of hypothalamic grisea,” in The Hypothalamus, eds W. Haymaker, E. Anderson, and W. J. H. Nauta (Springfield, IL: Charles, C. Thomas Publisher), 13–60.
Christie, I. N., Wells, J. A., Southern, P., Marina, N., Kasparov, S., Gourine, A. V., et al. (2013). fMRI response to blue light delivery in the naïve brain: implications for combined optogenetic fMRI studies. Neuroimage 66, 634–641. doi: 10.1016/j.neuroimage.2012.10.074
Chung, K., and Deisseroth, K. (2013). CLARITY for mapping the nervous system. Nat. Methods 10, 508–513. doi: 10.1038/nmeth.2481
Chung, K., Wallace, J., Kim, S.-Y., Kalyanasundaram, S., Andalman, A. S., Davidson, T. J., et al. (2013). Structural and molecular interrogation of intact biological systems. Nature 497, 332–337. doi: 10.1038/nature12107
Clark, J. T., Kalra, P. S., Crowley, W. R., and Kalra, S. P. (1984). Neuropeptide Y and human pancreatic polypeptide stimulate feeding behavior in rats. Endocrinology 115, 427–429. doi: 10.1210/endo-115-1-427
Clark, W. E. L. (1938). “Morphological aspects of the hypothalamus,” in The Hypothalamus: Morphological, Functional, Clinical, and Surgical Aspects, eds W. E. Le Gros Clark, J. Beattie, G. Riddoch, and N. M. Dott (Edinburgh: Oliver and Boyd), 1–68.
Clark, W. E. L., Beattie, J., Riddoch, G., and Dott, N. M. (Eds.). (1938). The Hypothalamus: Morphological, Functional, Clinical, and Surgical Aspects. Edinburgh: Oliver and Boyd.
Clarke, R. H., and Henderson, E. E. (1911). Atlas of photographs of sections of the frozen brain and cranium of the cat (Felis domestica). J. Psychol. Neurol. 18, 119–137.
Clöetta, M., and Fischer, H. (1930). Über die Wirkung der Kationen Ca, Mg, Sr, Ba, K, und Na bei intrazerebraler Injektion. Archiv für experiment. Pathol. und Pharmakol. 158, 254–281. doi: 10.1007/BF01861237
Cole, R. L., and Sawchenko, P. E. (2002). Neurotransmitter regulation of cellular activation and neuropeptide gene expression in the paraventricular nucleus of the hypothalamus. J. Neurosci. 22, 959–969.
Comroe, J. H. (1943). The effects of direct chemical and electrical stimulation of the respiratory center in the cat. Am. J. Physiol. 139, 490–498.
Coolen, L. M., Jansen, H. T., Goodman, R. L., Wood, R. I., and Lehman, M. N. (1999). A new method for simultaneous demonstration of anterograde and retrograde connections in the brain: co-injections of biotinylated dextran amine and the beta subunit of cholera toxin. J. Neurosci. Meth. 91, 1–8. doi: 10.1016/S0165-0270(99)00055-2
Coriat, I. H. (1905). A review of some recent literature on the chemistry of the central nervous system. J. Comp. Neurol. Psychol. 15, 148–159. doi: 10.1002/cne.920150208
Cowan, W. M., Gottlieb, D. I., Hendrickson, A. E., Price, J. L., and Woolsey, T. A. (1972). The autoradiographic demonstration of axonal connections in the central nervous system. Brain Res. 37, 21–51. doi: 10.1016/0006-8993(72)90344-7
Cunningham, M. G., O'Connor, R. P., and Wong, S. E. (2008). Construction and implantation of a microinfusion system for continuous delivery of neuroactive agents. J. Vis. Exp. 13, 716. doi: 10.3791/716
Dai, Y., Wolfgang, M. J., Cha, S. H., and Lane, M. D. (2007). Localization and effect of ectopic expression of CPT1c in CNS feeding centers. Biochem. Biophys. Res. Commun. 359, 469–474. doi: 10.1016/j.bbrc.2007.05.161
Davidson, B. L., Allen, E. D., Kozarsky, K. F., Wilson, J. M., and Roessler, B. J. (1993). A model system for in vivo gene transfer into the central nervous system using an adenoviral vector. Nat. Genet. 3, 219–223. doi: 10.1038/ng0393-219
Davis, J. R., and Keesey, R. E. (1971). Norepinephrine-induced eating: its hypothalamic locus and an alternate interpretation of action. J. Comp. Physiol. Psychol. 77, 394–402. doi: 10.1037/h0031864
Davis, S. F., Williams, K. W., Xu, W., Glatzer, N. R., and Smith, B. N. (2003). Selective enhancement of synaptic inhibition by hypocretin (orexin) in rat vagal motor neurons: implications for autonomic regulation. J. Neurosci. 23, 3844–3854.
Dean, A. G. (1976). Population-based spot maps: an epidemiologic technique. Am. J. Public Health 66, 988–989. doi: 10.2105/AJPH.66.10.988
Debons, A. F., Krimsky, I., and From, A. (1970). A direct action of insulin on the hypothalamic satiety center. Am. J. Physiol. 219, 938–943.
DeFalco, J., Tomishima, M., Liu, H., Zhao, C., Cai, X., Marth, J. D., et al. (2001). Virus-assisted mapping of neural inputs to a feeding center in the hypothalamus. Science 291, 2608–2613. doi: 10.1126/science.1056602
de Groot, J. (1959a). The Rat Forebrain in Stereotaxic Coordinates. Amsterdam: Noord-Hollandsche Uitgevers Maatschappij, N. V. North-Holland Publishing Company.
de Groot, J. (1959b). The rat hypothalamus in stereotaxic coordinates. J. Comp. Neurol. 113, 389–400. doi: 10.1002/cne.901130304
Delgado, J. M. R., and Anand, B. K. (1953). Increase of food intake induced by electrical stimulation of the lateral hypothalamus. Am. J. Physiol. 172, 162.
Demole, V. (1927). Pharmakologisch-anatomische untersuchungen zum problem des schlafes. Archiv für experiment. Pathol. und Pharmakol. 120, 229–258. doi: 10.1007/BF01861262
Devlin, J. T., and Poldrack, R. A. (2007). In praise of tedious anatomy. Neuroimage 37, 1033–1041, 1050–1058. doi: 10.1016/j.neuroimage.2006.09.055
Dhillon, H., Kalra, S. P., Prima, V., Zolotukhin, S., Scarpace, P. J., Moldawer, L. L., et al. (2001). Central leptin gene therapy suppresses body weight gain, adiposity and serum insulin without affecting food consumption in normal rats: a long-term study. Regul. Pept. 99, 69–77. doi: 10.1016/S0167-0115(01)00237-3
Ding, F., Li, H. H., Li, J., Myers, R. M., and Francke, U. (2010). Neonatal maternal deprivation response and developmental changes in gene expression revealed by hypothalamic gene expression profiling in mice. PLoS ONE 5:e9402. doi: 10.1371/journal.pone.0009402
Dodd, G. T., Stark, J. A., McKie, S., Williams, S. R., and Luckman, S. M. (2009). Central cannabinoid signaling mediating food intake: a pharmacological-challenge magnetic resonance imaging and functional histology study in rat. Neuroscience 163, 1192–1200. doi: 10.1016/j.neuroscience.2009.07.022
Dodd, G. T., Williams, S. R., and Luckman, S. M. (2010). Functional magnetic resonance imaging and c-Fos mapping in rats following a glucoprivic dose of 2-deoxy-D-glucose. J. Neurochem. 113, 1123–1132. doi: 10.1111/j.1471-4159.2010.06671.x
Domingos, A. I., Vaynshteyn, J., Voss, H. U., Ren, X., Gradinaru, V., Zang, F., et al. (2011). Leptin regulates the reward value of nutrient. Nat. Neurosci. 14, 1562–1568. doi: 10.1038/nn.2977
Donath, J. (1904). Die Bedeutung des Cholins in der Epilepsie. Nebst Beiträgen zur Wirkung des Cholins und Neurins sowie zur Chemie der Cerebrospinalflüssigkeit. Deutsche Zeitschrift für Nervenheilkunde 27, 71–113. doi: 10.1007/BF01667338
Donato, J. Jr., Cravo, R. M., Frazão, R., Gautron, L., Scott, M. M., Lachey, J., et al. (2011). Leptin's effect on puberty in mice is relayed by the ventral premammillary nucleus and does not require signaling in Kiss1 neurons. J. Clin. Invest. 121, 355–368. doi: 10.1172/JCI45106
Dong, H.-W. (2008). Allen Reference Atlas: A Digital Color Brain Atlas of the C57BL/6J Male Mouse. Hoboken, N. J: Wiley
Douek, P., Turner, R., Pekar, J., Patronas, N., and Le Bihan, D. (1991). MR color mapping of myelin fiber orientation. J. Comput. Assist. Tomogr. 15, 923–929. doi: 10.1097/00004728-199111000-00003
Dreyer, D., Vitt, H., Dippel, S., Goetz, B., el Jundi, B., Kollmann, M., et al. (2010). 3D standard brain of the red flour beetle Tribolium castaneum: a tool to study metamorphic development and adult plasticity. Front. Syst. Neurosci. 4:3. doi: 10.3389/neuro.06.003.2010
Dube, M. G., Kalra, S. P., and Kalra, P. S. (1999). Food intake elicited by central administration of orexins/hypocretins: identification of hypothalamic sites of action. Brain Res. 842, 473–477. doi: 10.1016/S0006-8993(99)01824-7
Duva, M. A., Tomkins, E. M., Moranda, L. M., Kaplan, R., Sukhaseum, A., and Stanley, B. G. (2005). Origins of lateral hypothalamic afferents associated with N-methyl-D-aspartic acid-elicited eating studied using reverse microdialysis of NMDA and Fluorogold. Neurosci. Res. 52, 95–106. doi: 10.1016/j.neures.2005.02.001
Duva, M. A., Tomkins, E. M., Moranda, L. M., Kaplan, R., Sukhaseum, A., Bernardo, J. P., et al. (2002). Regional differences in feeding and other behaviors elicited by N-methyl-D-aspartic acid in the rodent hypothalamus: a reverse microdialysis study. Brain Res. 925, 141–147. doi: 10.1016/S0006-8993(01)03269-3
Duva, M. A., Tomkins, E. M., Moranda, L. M., Kaplan, R., Sukhaseum, A., Jiminez, A., et al. (2001). Reverse microdialysis of N-methyl-D-aspartic acid into the lateral hypothalamus of rats: effects on feeding and other behaviors. Brain Res. 921, 122–132. doi: 10.1016/S0006-8993(01)03108-0
Eberwine, J., and Bartfai, T. (2011). Single cell transcriptomics of hypothalamic warm sensitive neurons that control core body temperature and fever response. Signaling asymmetry and an extension of chemical neuroanatomy. Pharmacol. Ther. 129, 241–259. doi: 10.1016/j.pharmthera.2010.09.010
Eglin, J. M. (1953). A Study of Behavioral Effects Following Intrahypothalamic Injection of Acetylcholine with Eserine in the Waking Animal. Unpublished Thesis, Yale University School of Medicine.
Ehrlich, P. (1899). Croonian Lecture: on immunity with special reference to cell life. Proc. R. Soc. Lond. 66, 424–448. doi: 10.1098/rspl.1899.0121
Einthoven, W., Hoogerwerf, S., Karplus, J. P., and Kreidl, A. (1927). Gehirn und sympathicus. VI. Pflügers Arch. 215, 443–452. doi: 10.1007/BF01731326
Elias, C. F., Aschkenasi, C., Lee, C., Kelly, J., Ahima, R. S., Bjorbæk, C., et al. (1999). Leptin differentially regulates NPY and POMC neurons projecting to the lateral hypothalamic area. Neuron 23, 775–786. doi: 10.1016/S0896-6273(01)80035-0
Elias, C. F., Lee, C., Kelly, J., Aschkenasi, C., Ahima, R. S., Couceyro, P. R., et al. (1998). Leptin activates hypothalamic CART neurons projecting to the spinal cord. Neuron 21, 1375–1385. doi: 10.1016/S0896-6273(00)80656-X
el Jundi, B., Heinze, S., Lenschow, C., Kurylas, A., Rohlfing, T., and Homberg, U. (2010). The locust standard brain: a 3D standard of the central complex as a platform for neural network analysis. Front. Syst. Neurosci. 3:21. doi: 10.3389/neuro.06.021.2009
Elmquist, J. K., Elias, C. F., and Saper, C. B. (1999). From lesions to leptin: hypothalamic control of food intake and body weight. Neuron 22, 221–232. doi: 10.1016/S0896-6273(00)81084-3
Epstein, A. N. (1960a). Elicitation and suppression of feeding behavior by intrahypothalamic chemical injections. Anat. Rec. 136, 188.
Epstein, A. N. (1960b). Reciprocal changes in feeding behavior produced by intrahypothalamic chemical injections. Am. J. Physiol. 199, 969–974.
Epstein, A. N., Fitzsimons, J. T., and Rolls, B. J. (1970). Drinking induced by injection of angiotensin into the brain of the rat. J. Physiol. 210, 457–474.
Farrell, M. S., and Roth, B. L. (2013). Pharmacosynthetics: reimagining the pharmacogenetic approach. Brain Res. 1511, 6–20. doi: 10.1016/j.brainres.2012.09.043
Fearing, F. (1930). Reflex Action: A Study in the History of Physiological Psychology. Baltimore, MD: Williams and Wilkins Co.
Ferris, T. (1983). The Red Limit: The Search for the Edge of the Universe, 2nd Edn. New York, NY: HarperCollins Publishers.
Fetissov, S. O., Xu, Z. Q., Byrne, L. C., Hassani, H., Ernfors, P., and Hökfelt, T. (2003). Neuropeptide y targets in the hypothalamus: nitric oxide synthesizing neurons express Y1 receptor. J. Neuroendocrinol. 15, 754–760. doi: 10.1046/j.1365-2826.2003.01051.x
Fifková, E., and Maršala, J. (1967). “Stereotaxic atlases for the cat, rabbit and rat,” in Electrophysiological Methods in Biological Research, 3rd revised Edn. eds J. Bureš, M. Petráň, and J. Zachar (New York, NY: Academic Press), 653–695.
Finley, K. H. (1940). “Angio-architecture of the hypothalamus and its peculiarities,” in The Hypothalamus and Central Levels of Autonomic Function, eds J. F. Fulton, S. R. Ranson, and A. M. Frantz (Baltimore, MD: The Williams and Wilkins Company), 286–309.
Fisher, A. E. (1956). Maternal and sexual behavior induced by intracranial chemical stimulation. Science 124, 228–229. doi: 10.1126/science.124.3214.228-a
Fisher, A. E. (1964). Chemical stimulation of the brain. Sci. Am. 210, 60–68. doi: 10.1038/scientificamerican0664-60
Flanagan-Cato, L. M., Fluharty, S. J., Weinreb, E. B., and LaBelle, D. R. (2008). Food restriction alters neuronal morphology in the hypothalamic ventromedial nucleus of male rats. Endocrinology 149, 93–99. doi: 10.1210/en.2007-0008
Flerkó, B., and Szentágothai, J. (1957). Oestrogen sensitive nervous structures in the hypothalamus. Acta Endocrinol. (copenh) 26, 121–127. doi: 10.1530/acta.0.0260121
Flourens, P. (1832). Expériences sur l'action qu'exercent certaines substances lorsqu'elles sont immédiatement appliquées sur les différentes parties du cerveau. Memoires de L'Academie des Sciences de L'Institut de France 11, 383–391.
Foutz, T. J., Arlow, R. L., and McIntyre, C. C. (2012). Theoretical principles underlying optical stimulation of a channelrhodopsin-2 positive pyramidal neuron. J. Neurophysiol. 107, 3235–3245. doi: 10.1152/jn.00501.2011
Fu, L.-Y., Acuna-Goycolea, C., and van den Pol, A. N. (2004). Neuropeptide Y inhibits hypocretin/orexin neurons by multiple presynaptic and postsynaptic mechanisms: tonic depression of the hypothalamic arousal system. J. Neurosci. 24, 8741–8751. doi: 10.1523/JNEUROSCI.2268-04.2004
Ganser, S. (1882). “Vergleichend-anatomische Studien uber das Gehirn des Maulwurfs,” in Morphologisches Jahrbuch, Vol. 7, ed C. Gegenbaur (Leipzig: Wilhem Engelmann), 591–725, also plates XXVIII-XXXII.
Gao, S., Keung, W., Serra, D., Wang, W., Carrasco, P., Casals, N., et al. (2011a). Malonyl-CoA mediates leptin hypothalamic control of feeding independent of inhibition of CPT-1a. Am. J. Physiol. Regul. Integr. Comp. Physiol. 301, R209–R217. doi: 10.1152/ajpregu.00092.2011
Gao, S., Zhu, G., Gao, X., Wu, D., Carrasco, P., Casals, N., et al. (2011b). Important roles of brain-specific carnitine palmitoyltransferase and ceramide metabolism in leptin hypothalamic control of feeding. Proc. Natl. Acad. Sci. U.S.A. 108, 9691–9696. doi: 10.1073/pnas.1103267108
Gao, S., Kinzig, K. P., Aja, S., Scott, K. A., Keung, W., Kelly, S., et al. (2007). Leptin activates hypothalamic acetyl-CoA carboxylase to inhibit food intake. Proc. Natl. Acad. Sci. U.S.A. 104, 17358–17363. doi: 10.1073/pnas.0708385104
Garza, J. C., Kim, C. S., Liu, J., and Lu, X.-Y. (2008). Adeno-associated virus-mediated knockdown of melanocortin-4 receptor in the paraventricular nucleus of the hypothalamus promotes high-fat diet-induced hyperphagia and obesity. J. Endocrinol. 197, 471–482. doi: 10.1677/JOE-08-0009
Gautron, L., Lazarus, M., Scott, M. M., Saper, C. B., and Elmquist, J. K. (2010). Identifying the efferent projections of leptin-responsive neurons in the dorsomedial hypothalamus using a novel conditional tracing approach. J. Comp. Neurol. 518, 2090–2108. doi: 10.1002/cne.22323
Geerling, J. C., Mettenleiter, T. C., and Loewy, A. D. (2003). Orexin neurons project to diverse sympathetic outflow systems. Neuroscience 122, 541–550. doi: 10.1016/j.neuroscience.2003.07.008
Gehlert, D. R. (1999). Role of hypothalamic neuropeptide Y in feeding and obesity. Neuropeptides 33, 329–338. doi: 10.1054/npep.1999.0057
Gerfen, C. R., and Sawchenko, P. E. (1984). An anterograde neuroanatomical tracing method that shows the detailed morphology of neurons, their axons and terminals: immunohistochemical localization of an axonally transported lectin, Phaseolus vulgaris-leucoagglutinin. Brain Res. 290, 219–238. doi: 10.1016/0006-8993(84)90940-5
Gillard, E. R., Khan, A. M., Grewal, R. S., Mouradi, B., Wolfsohn, S. D., and Stanley, B. G. (1998). The second messenger cAMP elicits eating by an anatomically specific action in the perifornical hypothalamus. J. Neurosci. 18, 2646–2652.
Golgi, C. (1873). Sulla struttura della sostanze grigia del cervello. Gazzetta Medica Italiana Lombardia 33, 244–246.
Gomori, G. (1952). Microscopic Histochemistry: Principles and Practices. Chicago, IL: University of Chicago Press.
Grandison, L., and Guidotti, A. (1977). Stimulation of food intake by muscimol and beta endorphin. Neuropharmacology 16, 533–536. doi: 10.1016/0028-3908(77)90019-3
Grossman, S. P. (1960). Eating or drinking elicited by direct adrenergic or cholinergic stimulation of the hypothalamus. Science 132, 301–302. doi: 10.1126/science.132.3422.301
Grossman, S. P. (1962). Direct adrenergic and cholinergic stimulation of hypothalamic mechanisms. Am. J. Physiol. 202, 872–882.
Gu, H., Marth, J. D., Orban, P. C., Mossmann, H., and Rajewsky, K. (1994). Deletion of a DNA polymerase β gene segment in T cells using cell type-specific gene targeting. Science 265, 103–106. doi: 10.1126/science.8016642
Hagan, M. M., Rushing, P. A., Pritchard, L. M., Schwartz, M. W., Strack, A. M., van der Ploeg, L. H. T., et al. (2000). Long-term orexigenic effects of AgRP-(83-132) involve mechanisms other than melanocortin receptor blockade. Am. J. Physiol. Regul. Integr. Comp. Physiol. 279, R47–R52.
Hahn, J. D. (2010). Comparison of melanin-concentrating hormone and hypocretin/orexin peptide expression patterns in a current parceling scheme of the lateral hypothalamic zone. Neurosci. Lett. 468, 12–17. doi: 10.1016/j.neulet.2009.10.047
Hahn, J. D., and Swanson, L. W. (2010). Distinct patterns of neuronal inputs and outputs of the juxtaparaventricular and suprafornical regions of the lateral hypothalamic area in the male rat. Brain Res. Rev. 64, 14–103. doi: 10.1016/j.brainresrev.2010.02.002
Hall, D. H., and Russell, R. L. (1991). The posterior nervous system of the nematode Caenorhabditis elegans: Serial reconstruction of identified neurons and complete pattern of synaptic interactions. J. Neurosci. 11, 1–22.
Hashimoto, M. (1915). Fieberstudien. I. Mitteilung: Über die spezifiche Überempfindlichkeit des Wärmzentrums an sensibilisierten tieren. Archiv für experiment. Pathol. und Pharmakol. 70, 370–393. [Note that this journal is now called Naunyn-Schmiedeberg's Archives of Pharmacology]. doi: 10.1007/BF01879893
Hatfield, J. S., Millard, W. J., and Smith, C. J. (1974). Short-term influence of intra-ventromedial hypothalamic administration of insulin on feeding in normal and diabetic rats. Pharmacol. Biochem. Behav. 2, 223–226. doi: 10.1016/0091-3057(74)90056-2
Hatton, G. I. (2004). Dynamic neuronal-glial interactions: an overview 20 years later. Peptides 25, 403–411. doi: 10.1016/j.peptides.2003.12.001
Hayes, M. R., Skibicka, K. P., Leichner, T. M., Guarnieri, D. J., DiLeone, R. J., Bence, K. K., et al. (2010). Endogenous leptin signaling in the caudal nucleus tractus solitarius and area postrema is required for energy balance regulation. Cell Metab. 11, 77–83. doi: 10.1016/j.cmet.2009.10.009
Haymaker, W. (1969). “Blood supply of the human hypothalamus,” in The Hypothalamus, eds W. Haymaker, E. Anderson, and W. J. H. Nauta (Springfield, IL: Charles, C. Thomas Publisher), 210–218.
Heimer, L., and RoBards, M. J. (eds.). (1981). Neuroanatomical Tract-Tracing Methods. New York, NY: Plenum Press. doi: 10.1007/978-1-4613-3189-6
Heimer, L., and Záborszky, L. (eds.). (1989). Neuroanatomical Tract-Tracing Methods 2: Recent Progress. New York, NY: Plenum Press.
Heller, A., Hutchens, J. O., Kirby, M. L., Karapas, F., and Fernandez, C. (1979). Stereotaxic electrode placement in the neonatal rat. J. Neurosci. Meth. 1, 41–76. doi: 10.1016/0165-0270(79)90006-2
Hess, W. R. (1949). “Nobel lecture,” in Nobel Lectures, Physiology or Medicine (1942-1962). Amsterdam: Elsevier.
Hess, W. R. (1954). Diencephalon: Autonomic and Extrapyramidal Functions. New York, NY: Grune and Stratton.
Hess, W. R. (1956). Hypothalamus and Thalamus: Documentary Pictures. Stuttgart: Georg Thieme Verlag.
Hess, W. R. (1957). The Functional Organization of the Diencephalon, ed J. R. Hughes (New York, NY: Grune and Stratton).
Hetherington, A. W., and Ranson, S. W. (1939). Experimental hypothalamico-hypophyseal obesity in the rat. Proc. Soc. Exp. Biol. Med. 41, 465–466. doi: 10.3181/00379727-41-10711P
Hetherington, A. W., and Ranson, S. W. (1940). Hypothalamic lesions and adiposity in the rat. Anat. Rec. 78, 149–172. doi: 10.1002/ar.1090780203
Hettes, S. R., Gonzaga, J., Heyming, T. W., Perez, S., Wolfsohn, S., and Stanley, B. G. (2003). Dual roles in feeding for AMPA/kainite receptors: receptor activation or inactivation within distinct hypothalamic regions elicits feeding behavior. Brain Res. 992, 167–178. doi: 10.1016/j.brainres.2003.08.032
Hettes, S. R., Gonzaga, W. J., Heyming, T. W., Nguyen, J. K., Perez, S., and Stanley, B. G. (2010). Stimulation of lateral hypothalamic AMPA receptors may induce feeding in rats. Brain Res. 1346, 112–120. doi: 10.1016/j.brainres.2010.05.008
Hettes, S. R., Heyming, T., and Stanley, B. G. (2007). Stimulation of lateral hypothalamic kainate receptors selectively elicits feeding behavior. Brain Res. 1184, 178–185. doi: 10.1016/j.brainres.2007.09.060
Higgins, S. E., Ellestad, L. E., Trakooljul, N., McCarthy, F., Saliba, J., Cogburn, L. A., et al. (2010). Transcriptional and pathway analysis in the hypothalamus of newly hatched chicks during fasting and delayed feeding. BMC Genomics 11:162. doi: 10.1186/1471-2164-11-162
Hnasko, T. S., Perez, F. A., Scouras, A. D., Stoll, E. A., Gale, S. D., Luquet, S., et al. (2006). Cre recombinase-mediated restoration of nigrostriatal dopamine in dopamine-deficient mice reverses hypophagia and bradykinesia. Proc. Natl. Acad. Sci. U.S.A. 103, 8858–8863. doi: 10.1073/pnas.0603081103
Hoebel, B. G., and Teitelbaum, P. (1962). Hypothalamic control of feeding and self-stimulation. Science 135, 375–377. doi: 10.1126/science.135.3501.375
Hommel, J. D., Sears, R. M., Georgescu, D., Simmons, D. L., and DiLeone, R. J. (2003). Local gene knockdown in the brain using viral-mediated RNA interference. Nat. Med. 9, 1539–1544. doi: 10.1038/nm964
Hommel, J. D., Trinko, R., Sears, R. M., Georgescu, D., and Liu, Z. W. (2006). Leptin receptor signaling in midbrain dopamine neurons regulates feeding. Neuron 51, 801–810. doi: 10.1016/j.neuron.2006.08.023
Hu, Z., Dai, Y., Prentki, M., Chohnan, S., and Lane, M. D. (2005). A role for hypothalamic malonyl-CoA in the control of food intake. J. Biol. Chem. 280, 39681–39683. doi: 10.1074/jbc.C500398200
Huetteroth, W., el Jundi, B., el Jundi, S., and Schachtner, J. (2010). 3D-reconstructions and virtual 4D-visualization to study metamorphic brain development in the sphinx moth Manduca sexta. Front. Syst. Neurosci. 4:7. doi: 10.3389/fnsys.2010.00007
Hurt, G. A., Hanaway, J., and Netsky, M. G. (1971). Stereotaxic atlas of the mesencephalon in the albino rat. Confin. Neurol. 33, 93–115. doi: 10.1159/000103106
Huth, J. E. (2013). The Lost Art of Finding Our Way. Cambridge, MA: Harvard University Press. doi: 10.4159/harvard.9780674074811
Ingram, W. R. (1939). The hypothalamus: a review of the experimental data. Psychosom. Med. 1, 48–91.
Ireland, W. P., and MacLeod, W. J. (1993). A method for finding stereotaxic coordinates from brain sections. J. Neurosci. Methods 49, 93–96. doi: 10.1016/0165-0270(93)90112-5
Jacobowitz, D. M., and Palkovits, M. (1974). Topographic atlas of catecholamine and acetylcholinesterase-containing neurons in the rat brain. I. Forebrain (telencephalon, diencephalon). J. Comp. Neurol. 157, 13–28. doi: 10.1002/cne.901570103
Jennings, J. H., Rizzi, G., Stamatakis, A. M., Ung, R. L., and Stuber, G. D. (2013). The inhibitory circuit architecture of the lateral hypothalamus orchestrates feeding. Science 341, 1517–1521. doi: 10.1126/science.1241812
Johnson, A. K., and Epstein, A. N. (1975). The cerebral ventricles as the avenue for the dipsogenic action of intracranial angiotensin. Brain Res. 86, 399–418. doi: 10.1016/0006-8993(75)90891-4
Johnson, S. (2006). The Ghost Map: The Story of London's Most Terrifying Epidemic – And How It Changed Science, Cities, and the Modern World. New York, NY: Riverhead Books.
Kalra, S. P., Dube, M. G., Pu, S., Xu, B., Horvath, T. L., and Kalra, P. S. (1999). Interacting appetite-regulating pathways in the hypothalamic regulation of body weight. Endocr. Rev. 20, 68–100. doi: 10.1210/er.20.1.68
Kanatani, A., Mashiko, S., Murai, N., Sugimoto, N., Ito, J., Fukuroda, T., et al. (2000). Role of the Y1 receptor in the regulation of neuropeptide Y-mediated feeding: comparison of wild-type, Y1 receptor-deficient, and Y5 receptor-deficient mice. Endocrinology 141, 1011–1016. doi: 10.1210/en.141.3.1011
Karplus, J. P., and Kreidl, A. (1909). Gehirn und sympathicus. I. Zwischenhirnbasis und Halssympathicus. Pflügers Arch. 129, 138–144. doi: 10.1007/BF01677525
Karplus, J. P., and Kreidl, A. (1910). Gehirn und sympathicus. II. Ein Sympathicuszentrum im Zwischenhirn. Pflügers Arch. 135, 401–416. doi: 10.1007/BF01680226
Karplus, J. P., and Kreidl, A. (1911). Gehirn und sympathicus. III. Sympathicusleitung im Gehirn und Halsmark. Pflügers Arch. 143, 109–127. doi: 10.1007/BF01691338
Karplus, J. P., and Kreidl, A. (1918). Gehirn und sympathicus. IV. Pflügers Arch. 171, 192–200. doi: 10.1007/BF01722089
Karplus, J. P., and Kreidl, A. (1924). Gehirn und sympathicus. V. Latenzbestimmungen unter Anwendung einer neuen Methode. Pflügers Arch. 201, 533–538. doi: 10.1007/BF01722457
Karplus, J. P., and Kreidl, A. (1927). Gehirn und sympathicus. VII. Mitteilung Über Beziehungen der Hypothalamuszentren zu Blutdruck und innerer Sekretion. Pflügers Arch. 215, 667–670. doi: 10.1007/BF01731342
Karplus, J. P., and Kreidl, A. (1928). Gehirn und sympathicus. VIII. Pflügers Arch. 219, 613–618. doi: 10.1007/BF01723444
Kas, M. J. H., Tiesjema, B., van Dijk, G., Garner, K. M., Barsh, G. S., ter Brake, O., et al. (2004). Induction of brain-region-specific forms of obesity by Agouti. J. Neurosci. 24, 10176–10181. doi: 10.1523/JNEUROSCI.3442-04.2004
Keen-Rhinehart, E., Kalra, S. P., and Kalra, P. S. (2005). AAV-mediated leptin receptor installation improves energy balance and the reproductive status of obese female Koletsky rats. Peptides 26, 2567–2578. doi: 10.1016/j.peptides.2005.05.027
Kelly, A. B., and Watts, A. G. (1998). The region of the pontine parabrachial nucleus is a major target of dehydration-sensitive CRH neurons in the rat lateral hypothalamic area. J. Comp. Neurol. 394, 48–63. doi: 10.1002/(SICI)1096-9861(19980427)394:1<48::AID-CNE5>3.0.CO;2-H
Khan, A. M., Cheung, H. H., Gillard, E. R., Palarca, J. A., Welsbie, D. S., Gurd, J. W., et al. (2004). Lateral hypothalamic signaling mechanisms underlying feeding stimulation: differential contributions of Src family tyrosine kinases to feeding triggered either by NMDA injection or by food deprivation. J. Neurosci. 24, 10603–10615. doi: 10.1523/JNEUROSCI.3390-04.2004
Khan, A. M., Currás, M. C., Dao, J., Jamal, F. A., Turkowski, C. A., Goel, R. K., et al. (1999). Lateral hypothalamic NMDA receptor subunits NR2A and/or NR2B mediate eating: immunochemical/behavioral evidence. Am. J. Physiol. Regul. Integr. Comp. Physiol. 276(3 Pt 2), R880–R891.
Khan, A. M., Hahn, J. D., Cheng, W.-C., Watts, A. G., and Burns, G. A. (2006). NeuroScholar's electronic laboratory notebook and its application to neuroendocrinology. Neuroinformatics 4, 139–162. doi: 10.1385/NI:4:2:139
Khan, A. M., Kaminski, K. L., Sanchez-Watts, G., Ponzio, T. A., Kuzmiski, J. B., Bains, J. S., et al. (2011). MAP kinases couple hindbrain-derived catecholamine signals to hypothalamic adrenocortical control mechanisms during glycemia-related challenges. J. Neurosci. 31, 18479–18491. doi: 10.1523/JNEUROSCI.4785-11.2011
Khan, A. M., Ponzio, T. A., Sanchez-Watts, G., Stanley, B. G., Hatton, G. I., and Watts, A. G. (2007). Catecholaminergic control of mitogen-activated protein kinase signaling in vivo and in vitro: a proposed role during glycemic challenges. J. Neurosci. 27, 7344–7360. doi: 10.1523/JNEUROSCI.0873-07.2007
Khan, A. M., and Watts, A. G. (2004). Intravenous 2-deoxy-D-glucose injection rapidly elevates levels of the phosphorylated forms of p44/42 mitogen-activated protein kinases (Extracellularly regulated kinases 1/2) in rat hypothalamic parvicellular paraventricular neurons. Endocrinology 145, 351–359. doi: 10.1210/en.2003-0539
Kim, J. K., Choi, J. W., and Yun, S. H. (2013a). 350-μm side-view optical probe for imaging the murine brain in vivo from the cortex to the hypothalamus. J. Biomed. Opt. 18, 050502. doi: 10.1117/1.JBO.18.5.050502
Kim, T.-i., McCall, J. G., Jung, Y. H., Huang, X., Siuda, E. R., Li, Y., et al. (2013b). Injectable, cellular-scale optoelectronics with applications for wireless optogenetics. Science 340, 211–216. doi: 10.1126/science.1232437
Kim, M. S., Rossi, M., Abusnana, S., Sunter, D., Morgan, D. G. A., Small, C. J., et al. (2000). Hypothalamic localization of the feeding effect of Agouti-related peptide and alpha-melanocyte-stimulating hormone. Diabetes 49, 177–182. doi: 10.2337/diabetes.49.2.177
Kishi, T., Aschkenasi, C. J., Choi, B. J., Lopez, M. E., Lee, C. E., Liu, H., et al. (2005). Neuropeptide Y Y1 receptor mRNA in rodent brain: distribution and colocalization with melanocortin-4 receptor. J. Comp. Neurol. 482, 217–243. doi: 10.1002/cne.20432
Klüver, H., and Barrera, E. (1953). A method for the combined staining of cells and fibers in the nervous system. J. Neuropathol. Exp. Neurol. 12, 400–403. doi: 10.1097/00005072-195312040-00008
Knobloch, H. S., Charlet, A., Hoffmann, L. C., Eliava, M., Khrulev, S., Cetin, A. H., et al. (2012). Evoked axonal oxytocin release in the central amygdala attenuates fear response. Neuron 73, 553–566. doi: 10.1016/j.neuron.2011.11.030
Konadhode, R. R., Pelluru, D., Blanco-Centurion, C., Zayachkivsky, A., Liu, M., Uhde, T., et al. (2013). Optogenetic stimulation of MCH neurons increases sleep. J. Neurosci. 33, 10257–10263. doi: 10.1523/JNEUROSCI.1225-13.2013
König, J. F. R., and Klippel, R. A. (1963). The Rat Brain: A Stereotaxic Atlas of the Forebrain and Lower Parts of the Brain Stem. Baltimore, MD: Williams and Wilkins.
Kong, D., Tong, Q., Ye, C., Koda, S., Fuller, P. M., Krashes, M. J., et al. (2012). GABAergic RIP-Cre neurons in the arcuate nucleus selectively regulate energy expenditure. Cell 151, 645–657. doi: 10.1016/j.cell.2012.09.020
Kopp, J., Xu, Z. Q., Zhang, X., Pedrazzini, T., Herzog, H., Kresse, A., et al. (2002). Expression of the neuropeptide Y Y1 receptor in the CNS of rat and of wild-type and Y1 receptor knock-out mice. Focus on immunohistochemical localization. Neuroscience 111, 443–532. doi: 10.1016/S0306-4522(01)00463-8
Krashes, M. J., Koda, S., Ye, C., Rogan, S. C., Adams, A. C., Cusher, D. S., et al. (2011). Rapid, reversible activation of AgRP neurons drives feeding behavior in mice. J. Clin. Invest. 121, 1424–1428. doi: 10.1172/JCI46229
Krashes, M. J., Shah, B. P., Koda, S., and Lowell, B. B. (2013). Rapid versus delayed stimulation of feeding by the endogenously released AgRP neuron mediators GABA, NPY and AgRP. Cell Metab. 18, 588–595. doi: 10.1016/j.cmet.2013.09.009
Krieg, W. J. S. (1946). Accurate placement of minute lesions in the brain of the albino rat. Q. Bull. Northwest. Univ. Med. Sch. 20, 199–208.
Kristensson, K., Olsson, Y., and Sjöstrand, J. (1971). Axonal uptake and retrograde transport of exogenous proteins in the hypoglossal nerve. Brain Res. 32, 399–406. doi: 10.1016/0006-8993(71)90332-5
Krout, K. E., Mettenleiter, T. C., and Loewy, A. D. (2003). Single CNS neurons link both the central motor and cardiosympathetic systems: a double-virus tracing study. Neuroscience 118, 853–866. doi: 10.1016/S0306-4522(02)00997-1
Kruger, L., Saporta, S., and Swanson, L. W. (1995). A Photographic Atlas of the Rat Brain: The Cell and Fiber Architecture Illustrated in Three Planes with Stereotaxic Coordinates. Cambridge: Cambridge University Press.
Kvello, P., Løfaldli, B. B., Rybak, J., Menzel, R., and Mustaparta, H. (2009). Digital, three-dimensional average shaped atlas of the Heliothis virescens brain with integrated gustatory and olfactory neurons. Front. Syst. Neurosci. 3:14. doi: 10.3389/neuro.06.014.2009
Kyrkouli, S. E., Stanley, B. G., and Leibowitz, S. F. (1987). Bombesin-induced anorexia: sites of action in the rat brain. Peptides 8, 237–241. doi: 10.1016/0196-9781(87)90096-9
Lakso, M., Sauer, B., Mosinger, B. Jr., Lee, E. J., Manning, R. W., Yu, S.-H., et al. (1992). Targeted oncogene activation by site-specific recombination in transgenic mice. Proc. Natl. Acad. Sci. U.S.A. 89, 6232–6236. doi: 10.1073/pnas.89.14.6232
Landois, L. (1887). Ueber typische, recidivirende Krampfanfälle, erzeugt durch Behandlung der Grosshirnrinde mittelst chemisch wirksamer Substanzen und über cerebrale Chorea. Deutsche Medizinische Wochenschrift 13, 685–686. doi: 10.1055/s-0029-1197878
Larsson, S. (1954). On the hypothalamic organisation of the nervous mechanism regulating food intake. Acta Physiol. Scand. Suppl. 32, 7–63.
Lasek, R. J. (1967). Bidirectional transport of radioactively labeled axoplasmic components. Nature 216, 1212–1214. doi: 10.1038/2161212a0
Lasek, R. J. (1968a). Axoplasmic transport of labeled proteins in rat ventral motoneurons. Exp. Neurol. 21, 41–51. doi: 10.1016/0014-4886(68)90032-0
Lasek, R. J. (1968b). Axoplasmic transport in cat dorsal ganglion cells; as studied with [3H]-L-leucine. Brain Res. 7, 360–377. doi: 10.1016/0006-8993(68)90003-6
Lee, S., Bookout, A. L., Lee, C. F., Gautron, L., Harper, M. J., Elias, C. F., et al. (2012). Laser-capture microdissection and transcriptional profiling of the dorsomedial nucleus of the hypothalamus. J. Comp. Neurol. 520, 3617–3632. doi: 10.1002/cne.23116
Le Foll, C., Dunn-Meynell, A., Musatov, S., Magnan, C., and Levin, B. E. (2013). FAT/CD36: a major regulator of neuronal fatty acid sensing and energy homeostasis in rats and mice. Diabetes 62, 2709–2716. doi: 10.2337/db12-1689
Leibowitz, S. F. (1975). Amphetamine: possible site and mode of action for producing anorexia in the rat. Brain Res. 84, 160–167. doi: 10.1016/0006-8993(75)90811-2
Leibowitz, S. F. (1978). Paraventricular nucleus: a primary site mediating adrenergic stimulation of feeding and drinking. Pharmacol. Biochem. Behav. 8, 163–175. doi: 10.1016/0091-3057(78)90333-7
Lein, E. S., Hawrylycz, M. J., Ao, N., Ayres, M., Bensinger, A., Bernard, A., et al. (2007). Genome-wide atlas of gene expression in the adult mouse brain. Nature 445, 168–176. doi: 10.1038/nature05453
Lemaire, J.-J., Frew, A. J., McArthur, D., Gorgulho, A. A., Alger, J. R., Salomon, N., et al. (2011). White matter connectivity of human hypothalamus. Brain Res. 1371, 43–64. doi: 10.1016/j.brainres.2010.11.072
Levine, A. S., and Morley, J. E. (1984). Neuropeptide Y; a potent inducer of consummatory behavior in rats. Peptides 5, 1025–1029. doi: 10.1016/0196-9781(84)90165-7
Li, A., Gong, H., Zhang, B., Wang, Q., Yan, C., Wu, J., et al. (2010). Micro-optical sectioning tomography to obtain a high-resolution atlas of the mouse brain. Science 330, 1404–1408. doi: 10.1126/science.1191776
Li, F. W., Deurveilher, S., and Semba, K. (2011). Behavioural and neuronal activation after microinjections of AMPA and NMDA into the perifornical lateral hypothalamus in rats. Behav. Brain Res. 224, 376–386. doi: 10.1016/j.bbr.2011.06.021
Li, G., Mobbs, C. V., and Scarpace, P. J. (2003). Central pro-opiomelanocortin gene delivery results in hypophagia, reduced visceral adiposity, and improved insulin sensitivity in genetically obese Zucker rats. Diabetes 52, 1951–1957. doi: 10.2337/diabetes.52.8.1951
Lima, M. (2011). Visual Complexity: Mapping Patterns of Information. New York, NY: Princeton Architectural Press.
Lima, S. Q., and Miesenböck, G. (2005). Remote control of behavior through genetically targeted photostimulation of neurons. Cell 121, 141–152. doi: 10.1016/j.cell.2005.02.004
Lin, D., Boyle, M. P., Dollar, P., Lee, H., Lein, E. S., Perona, P., et al. (2011). Functional identification of an aggression locus in the mouse hypothalamus. Nature 470, 221–226. doi: 10.1038/nature09736
Lindberg, D., Chen, P., and Li, C. (2013). Conditional viral tracing reveals that steroidogenic factor 1-positive neurons of the dorsomedial subdivision of the ventromedial hypothalamus project to autonomic centers and hindbrain. J. Comp. Neurol. 521, 3167–3190. doi: 10.1002/cne.23338
Llewellyn-Smith, I. J., and Verberne, A. J. M. (eds.). (2011). Central Regulation of Autonomic Functions, 2nd Edn. New York, NY: Oxford University Press. doi: 10.1093/acprof:oso/9780195306637.001.0001
Loewy, A. D. (1998). Viruses as transneuronal tracers for defining neural circuits. Neurosci. Biobehav. Rev. 22, 679–684. doi: 10.1016/S0149-7634(98)00006-2
Loewy, A. D., and Spyer, K. M. (eds.). (1990). Central Regulation of Autonomic Functions. New York, NY: Oxford University Press.
Lopez-Valpuesta, F. J., Nyce, J. W., Griffin-Biggs, T. A., Ice, J. C., and Myers, R. D. (1996). Antisense to NPY-Y1 demonstrates that Y1 receptors in the hypothalamus underlie NPY hypothermia and feeding in rats. Proc. Biol. Sci. 263, 881–886. doi: 10.1098/rspb.1996.0130
Luckman, S. M., Dyball, R. E., and Leng, G. (1994). Induction of c-fos expression in hypothalamic magnocellular cells requires synaptic activation and not simply increased spike activity. J. Neurosci. 14, 4825–4830.
MacLean, P. D. (1957a). Chemical and electrical stimulation of hippocampus in unrestrained animals. I. Methods and electroencephalographic findings. AMA Arch. Neurol. Psychiatry 78, 113–127. doi: 10.1001/archneurpsyc.1957.02330380003001
MacLean, P. D. (1957b). Chemical and electrical stimulation of hippocampus in unrestrained animals. II. Behavioral findings. AMA Arch. Neurol. Psychiatry 78, 128–142. doi: 10.1001/archneurpsyc.1957.02330380018002
Madisen, L., Madisen, L., Zwingman, T. A., Sunkin, S. M., Oh, S. W., Zariwala, H. A., et al. (2010). A robust and high-throughput Cre reporting and characterization system for the whole mouse brain. Nat. Neurosci. 13, 133–140. doi: 10.1038/nn.2467
Maldonado-Irizarry, C. S., Swanson, C. J., and Kelley, A. E. (1995). Glutamate receptors in the nucleus accumbens shell control feeding behavior via the lateral hypothalamus. J. Neurosci. 15, 6779–6788.
Marchi, V., and Algeri, G. (1885). Sulle degenerazioni discendenti consecutive a lesioni sperimentale in diverse zone della corteccia cerebrale. Riv. Sper. Freniatr. Med. Leg. Alienzioni Ment. 11, 492–494.
Marder, E. (2012). Neuromodulation of neuronal circuits: back to the future. Neuron 76, 1–11. doi: 10.1016/j.neuron.2012.09.010
Martin, X., and Dolivo, M. (1983). Neuronal and transneuronal tracing in the trigeminal system of the rat using the herpes virus suis. Brain Res. 273, 253–276. doi: 10.1016/0006-8993(83)90850-8
Masserman, J. H. (1937). Effects of sodium amytal and other drugs on the reactivity of the hypothalamus of the cat. AMA Arch. Neurol. Psychiatry 37, 617–628. doi: 10.1001/archneurpsyc.1937.02260150147008
Masserman, J. H. (1939a). Effects of morphine sulphate on hypothalamus of the cat. Proc. Soc. Exp. Biol. Med. 42, 315–317. doi: 10.3181/00379727-42-10890
Masserman, J. H. (1939b). Action of metrazol (pentamethylenetetrazol) on the hypothalamus of the cat. AMA Arch. Neurol. Psychiatrry 41, 504–510. doi: 10.1001/archneurpsyc.1939.02270150078007
Masserman, J. H., Beal, J., and Sanders, R. (1940). Stimulant effects of ethyl alcohol in cortico-hypothalamic functions. J. Pharmacol. Exp. Ther. 70, 450–453.
Masserman, J. H., and Haertig, E. W. (1938a). The effect of strychnine sulphate on the emotional mimetic functions of the hypothalamus of the cat. J. Pharmacol. Exp. Ther. 64, 335–354.
Masserman, J. H., and Haertig, E. W. (1938b). The influence of hypothalamic stimulation on intestinal activity. J. Neurophysiol. 1, 350–356.
Masserman, J. H., and Jacobson, L. (1940). Effects of ethyl alcohol on the cerebral cortex and the hypothalamus of the cat. AMA Arch. Neurol. Psychiatrry 43, 334–340. doi: 10.1001/archneurpsyc.1940.02280020142012
Massopust, L. C. Jr. (1956). “The rat brain in stereotaxic coordinates,” in Unpublished; demonstration at the 69th Annual Session of the American Association of Anatomists, (Marquette, WI), abstract published in Anat. Rec. 124, 463–464.
Massopust, L. C. Jr. (1961). “Stereotaxic atlases: diencephalon of the rat,” in Electrical Stimulation of the Brain: An Interdisciplinary Survey of Neurobehavioral Integrative Systems, ed D. E. Sheer (Austin, TX: University of Texas Press), 182–202.
Maxwell, S. S. (1906b). Chemical stimulation of the motor areas of the cerebral hemispheres. J. Biol. Chem. 2, 183–194.
McCrimmon, R. J., Shaw, M., Fan, X., Cheng, H., Ding, Y., Vella, M. C., et al. (2008). Key role for AMP-activated protein kinase in the ventromedial hypothalamus in regulating counterregulatory hormone responses to acute hypoglycemia. Diabetes 57, 444–450. doi: 10.2337/db07-0837
McMullen, N. T., and Almli, C. R. (1981). Cell types within the medial forebrain bundle: a Golgi study of preoptic and hypothalamic neurons in the rat. Am. J. Anat. 161, 323–340. doi: 10.1002/aja.1001610306
Meltzer, S. J. (1900). On the toxicology of potassium chlorate, with a demonstration of the effects of intracerebral injections. Am. J. Physiol. 3, 9–10.
Mena, J. D., Sadeghian, K., and Baldo, B. A. (2011). Induction of hyperphagia and carbohydrate intake by μ-opioid receptor stimulation in circumscribed regions of frontal cortex. J. Neurosci. 31, 3249–3260. doi: 10.1523/JNEUROSCI.2050-10.2011
Mena, J. D., Selleck, R. A., and Baldo, R. A. (2013). Mu-opioid stimulation in rat prefrontal cortex engages hypothalamic orexin/hypocretin-containing neurons, and reveals dissociable roles of nucleus accumbens and hypothalamus in cortically driven feeding. J. Neurosci. 33, 18540–18552. doi: 10.1523/JNEUROSCI.3323-12.2013
Mercier, F., and Hatton, G. I. (2000). Immunocytochemical basis for a meningeo-glial network. J. Comp. Neurol. 420, 445–465. doi: 10.1002/(SICI)1096-9861(20000515)420:4<445::AID-CNE4>3.0.CO;2-3
Mercier, F., and Hatton, G. I. (2001). Connexin 26 and basic fibroblast growth factor are expressed primarily in the subpial and subependymal layers in adult brain parenchyma: roles in stem cell proliferation and morphological plasticity. J. Comp. Neurol. 431, 88–104. doi: 10.1002/1096-9861(20010226)431:1<88::AID-CNE1057>3.0.CO;2-D
Mercier, F., Kitasako, J., and Hatton, G. I. (2003). Fractones and other basal laminae in the hypothalamus. J. Comp. Neurol. 455, 324–340. doi: 10.1002/cne.10496
Miller, M. J., Mark, L. P., Yetkin, F. Z., Ho, K. C., Haughton, V. M., Estkowski, L., et al. (1994). Imaging white matter tracts and nuclei of the hypothalamus: an MR-anatomic comparative study. Am. J. Neuroradiol. 15, 117–121.
Miller, N. E. (1956). Experiments on motivation: studies combining psychological, physiological, and pharmacological techniques. Science 126, 1271–1278. doi: 10.1126/science.126.3286.1271
Miller, N. E. (1957). “Learning and performance motivated by direct stimulation of the brain,” in Electrical Stimulation of the Brain: An Interdisciplinary Survey of Neurobehavioral Integrative Systems, ed D. E. Sheer (Austin, TX: University of Texas Press), 387–396.
Miller, N. E. (1965). Chemical coding of behavior in the brain. Science 148, 328–338. doi: 10.1126/science.148.3668.328
Miller, N. E. (1992). “Behavior to the brain to health,” in The Neurosciences: Paths of Discovery, II, eds F. Samson and G. Adelman (Boston, MA: Birkhäuser), 283–305.
Miller, N. E., Richter, M. L., Bailey, C. J., and Southwick, J. B. (1955). “Thirst” Induced or Reduced, Respectively, by Minute Injections of Hypertonic NaCl or Water into the Ventricles of Cats. New York, NY: Paper read at meeting of Eastern Psychological Association.
Miller, N. E., Richter, M. L., Lacy, G. M., and Jensen, D. D. (1956). The Effect of Ventricular Injections of Hypertonic Saline and of Water on an Instrumental-Response Measure of Thirst. Atlantic City: Paper read at meeting of Eastern Psychological Association.
Millhouse, O. E. (1969). A Golgi study of the descending medial forebrain bundle. Brain Res. 15, 341–363. doi: 10.1016/0006-8993(69)90161-9
Millhouse, O. E. (1979). “A Golgi anatomy of the rodent hypothalamus,” in Handbook of the Hypothalamus, Volume 1: Anatomy of the Hypothalamus, eds P. J. Morgane and J. Panksepp (New York, NY: Marcel Dekker), 221–265.
Milyaev, N., Osumi-Sutherland, D., Reeve, S., Burton, N., Baldock, R. A., and Armstrong, J. D. (2012). The Virtual Fly Brain browser and query interface. Bioinformatics 28, 411–415. doi: 10.1093/bioinformatics/btr677
Mineur, Y. S., Abizaid, A., Rao, Y., Salas, R., DiLeone, R. J., Gündisch, D., et al. (2011). Nicotine decreases food intake through activation of POMC neurons. Science 332, 1330–1332. doi: 10.1126/science.1201889
Miyashita, T., Shao, Y. R., Chung, J., Pourzia, O., and Feldman, D. E. (2013). Long-term channelrhodopsin-2 (ChR2) expression can induce abnormal axonal morphology and targeting in cerebral cortex. Front. Neural Circuits 7:8. doi: 10.3389/fncir.2013.00008
Morgan, J. I., Cohen, D. R., Hempstead, J. L., and Curran, T. (1987). Mapping patterns of c-fos expression in the central nervous system after seizure. Science 237, 192–197. doi: 10.1126/science.3037702
Morgane, P. J. (1961). Medial forebrain bundle and “feeding centers” in the hypothalamus. J. Comp. Neurol. 117, 1–25. doi: 10.1002/cne.901170102
Montgomery, R. B., Singer, G., Routtenberg, A., and Bondareff, W. (1969). Histochemical fluorescence as an index of spread of centrally applied chemicals [correspondence]. Science 165, 1031–1032. doi: 10.1126/science.165.3897.1031
Morton, G. J., Blevins, J. E., Kim, F., Matsen, M., and Figlewicz, D. P. (2009). The action of leptin in the ventral tegmental area to decrease food intake is dependent on Jak-2 signaling. Am. J. Physiol. Endocrinol. Metab. 297, E202–E210. doi: 10.1152/ajpendo.90865.2008
Myers, R. D. (1966). Injection of solutions into cerebral tissue: relation between volume and diffusion. Physiol. Behav. 1, 171–174. doi: 10.1016/0031-9384(66)90064-3
Myers, R. D. (1974). Handbook of Drug and Chemical Stimulation of the Brain. New York, NY: Von Nostrand Reinhold Co.
Myers, R. D., and Hoch, D. B. (1978). 14C-dopamine microinjected into the brain-stem of the rat: dispersion kinetics, site content and functional dose. Brain Res. Bull. 3, 601–609. doi: 10.1016/0361-9230(78)90006-0
Myers, R. D., and Sharpe, L. G. (1968). Chemical activation of ingestive and other hypothalamic regulatory mechanisms. Physiol. Behav. 3, 987–995. doi: 10.1016/0031-9384(68)90189-3
Myers, R. D., Tytell, M., Kawa, A., and Rudy, T. (1971). Micro-injection of 3H-acetylcholine, 14C-serotonin and 3H-norepinephrine into the hypothalamus of the rat: diffusion into tissue and ventricles. Physiol. Behav. 7, 743–751. doi: 10.1016/0031-9384(71)90143-0
Nauta, W. J. H. (1993). Some early travails of tracing axonal pathways in the brain. J. Neurosci. 13, 1337–1345.
Nauta, W. J. H., and Haymaker, W. (1969). “Hypothalamic nuclei and fiber connections,” in The Hypothalamus, eds W. Haymaker, E. Anderson, and W. J. H. Nauta (Springfield, IL: Charles, C. Thomas Publisher), 136–209.
Nauta, W. J. H., Ryan, L. F., et al. (1952). Selective silver impregnation of degenerating axons in the central nervous system. Stain Technol. 27, 175–179.
Nguyen, A. D., Mitchell, N. F., Lin, S., Macia, L., Yulyaningsih, E., Baldock, P. A., et al. (2012). Y1 and Y5 receptors are both required for the regulation of food intake and energy homeostasis in mice. PLoS ONE 7:e40191. doi: 10.1371/journal.pone.0040191
Nieh, E. H., Kim, S.-Y., Namburi, P., and Tye, K. M. (2013). Optogenetic dissection of neural circuits underlying emotional valence and motivated behaviors. Brain Res. 1511, 73–92. doi: 10.1016/j.brainres.2012.11.001
Nieuwenhuys, R., Geeraedts, L. M. G., and Veening, J. G. (1982). The medial forebrain bundle of the rat. I. General introduction. J. Comp. Neurol. 206, 49–81. doi: 10.1002/cne.902060106
Nissl, F. (1913). Die Grosshirnanteile des Kaninchens. Arch. für Psychiat. 52, 867–953. doi: 10.1007/BF02160485
Noordmans, A. J., Song, D. K., Noordmans, C. J., Garrity-Moses, M., During, M. J., Fitzsimons, H. L., et al. (2004). Adeno-associated viral glutamate decarboxylase expression in the lateral nucleus of the rat hypothalamus reduces feeding behavior. Gene Ther. 11, 797–804. doi: 10.1038/sj.gt.3302223
O'Donohue, T. L., Miller, R. L., and Jacobowitz, D. M. (1979). Identification, characterization and stereotaxic mapping of interneuronal α-melanocyte stimulating hormone-like immunoreactive peptides in discrete regions of the rat brain. Brain Res. 176, 101–123. doi: 10.1016/0006-8993(79)90873-4
Oldfield, B. J., Giles, M. E., Watson, A., Anderson, C., Colvill, L. M., and McKinley, M. J. (2002). The neurochemical characterisation of hypothalamic pathways projecting polysynaptically to brown adipose tissue in the rat. Neuroscience 110, 515–526. doi: 10.1016/S0306-4522(01)00555-3
Olds, J. (1977). Drives and Reinforcements: Behavioral Studies of Hypothalamic Functions. New York, NY: Raven Press.
Olds, J., and Milner, P. (1954). Positive reinforcement produced by electrical stimulation of the septal area and other regions of the rat brain. J. Comp. Physiol. Psychol. 47, 419–427. doi: 10.1037/h0058775
Orban, P. C., Chui, D., and Marth, J. D. (1992). Tissue- and site-specific DNA recombination in transgenic mice. Proc. Natl. Acad. Sci. U.S.A. 89, 6861–6865. doi: 10.1073/pnas.89.15.6861
Palkovits, M., and Jacobowitz, D. M. (1974). Topographic atlas of catecholamine and acetylcholinesterase-containing neurons in the rat brain. J. Comp. Neurol. 157, 29–42. doi: 10.1002/cne.901570104
Palkovits, M., and Brownstein, M. J. (1988). Maps and Guide to Microdissection of the Rat Brain. New York, NY: McGraw-Hill.
Palmgren, A. (1948). A rapid method for selective silver staining of nerve fibers and nerve endings in mounted paraffin sections. Acta Zool. 29, 377–392. doi: 10.1111/j.1463-6395.1948.tb00032.x
Palmiter, R. D. (2008). Dopamine signaling in the dorsal striatum is essential for motivated behaviors: lessons from dopamine-deficient mice. Ann. N.Y. Acad. Sci. 1129, 35–46. doi: 10.1196/annals.1417.003
Panksepp, J., and Nance, D. M. (1972). Insulin, glucose and hypothalamic regulation of feeding. Physiol. Behav. 9, 447–451. doi: 10.1016/0031-9384(72)90173-4
Pannese, E. (1999). The Golgi stain: invention, diffusion and impact on neurosciences. J. Hist. Neurosci. 8, 132–140. doi: 10.1076/jhin.8.2.132.1847
Paxinos, G., and Watson, C. (1982). The Rat Brain in Stereotaxic Coordinates. San Diego, CA: Academic Press.
Paxinos, G., and Watson, C. (1986). The Rat Brain in Stereotaxic Coordinates, 2nd Edn. San Diego, CA: Academic Press.
Paxinos, G., and Watson, C. (1997). The Rat Brain in Stereotaxic Coordinates, 3rd Edn. San Diego, CA: Academic Press.
Paxinos, G., and Watson, C. (1998). The Rat Brain in Stereotaxic Coordinates, 4th Edn. San Diego, CA: Academic Press.
Paxinos, G., and Watson, C. (2005). The Rat Brain in Stereotaxic Coordinates, 5th Edn. Amsterdam: Elsevier.
Paxinos, G., and Watson, C. (2007). The Rat Brain in Stereotaxic Coordinates, 6th Edn. Amsterdam: Elsevier.
Paxinos, G., and Watson, C. (2014). The Rat Brain in Stereotaxic Coordinates, 7th Edn. San Diego, CA: Academic Press.
Paxinos, G., Watson, C., Carrive, P., Kirkcaldie, M., and Ashwell, K. W. S. (2009). Chemoarchitectonic Atlas of the Rat Brain, 2nd Edn. Amsterdam: Elsevier.
Paxinos, G., Watson, C., and Emson, P. C. (1980). AchE-stained horizontal sections of the rat brain in stereotaxic coordinates. J. Neurosci. Methods 3, 129–149. doi: 10.1016/0165-0270(80)90021-7
Paxinos, G., Watson, C. R., Pennisi, M., and Topple, A. (1985). Bregma, lambda and the interaural midpoint in stereotaxic surgery with rats of different sex, strain and weight. J. Neurosci. Methods 13, 139–143. doi: 10.1016/0165-0270(85)90026-3
Peciña, S., and Berridge, K. C. (2000). Opioid site in nucleus accumbens shell mediates eating and hedonic ‘liking’ for food: map based on microinjection Fos plumes. Brain Res. 863, 71–86. doi: 10.1016/S0006-8993(00)02102-8
Peciña, S., and Berridge, K. C. (2005). Hedonic hot spot in nucleus accumbens shell: where do mu-opioids cause increased hedonic impact of sweetness. J. Neurosci. 25, 11777–11786. doi: 10.1523/JNEUROSCI.2329-05.2005
Pellegrino, L. J., and Cushman, A. J. (1967). A Stereotaxic Atlas of the Rat Brain. New York, NY: Meredith Publishing Co.
Pellegrino, L. J., Pellegrino, A. S., and Cushman, A. J. (1979). A Stereotaxic Atlas of the Rat Brain. New York, NY: Plenum Press.
Petrovich, G. D. (2011). Forebrain circuits and control of feeding by learned cues. Neurobiol. Learn. Mem. 95, 152–158. doi: 10.1016/j.nlm.2010.10.003
Petrovich, G. D., Holland, P. C., and Gallagher, M. (2005). Amygdalar and prefrontal pathways to the lateral hypothalamus are activated by a learned cue that stimulates eating. J. Neurosci. 25, 8295–8302. doi: 10.1523/JNEUROSCI.2480-05.2005
Piñol, R. A., Bateman, R., and Mendelowitz, D. (2012). Optogenetic approaches to characterize the long-range synaptic pathways from the hypothalamus to brain stem autonomic nuclei. J. Neurosci. Methods 210, 238–246. doi: 10.1016/j.jneumeth.2012.07.022
Polak, J. M., and Van Noorden, S. (1997). Introduction to Immunocytochemistry, 2nd Edn. New York, NY: Springer.
Polak, M., and Azcoaga, J. E. (1969). “Morphology and distribution of the neuroglia in the hypothalamus and neurohypophysis,” in The Hypothalamus, eds W. Haymaker, E. Anderson, and W. J. H. Nauta (Springfield, IL: Charles, C. Thomas Publisher), 251–275.
Ponzio, T. A., Yue, C., and Gainer, H. (2007). An intron-based real-time PCR method for measuring vasopressin gene transcription. J. Neurosci. Methods 164, 149–154. doi: 10.1016/j.jneumeth.2007.04.012
Poplawski, M. M., Mastaitis, J. W., Yang, X.-j., and Mobbs, C. V. (2010). Hypothalamic responses to fasting indicate metabolic reprogramming away from glycolysis toward lipid oxidation. Endocrinology 151, 5206–5217. doi: 10.1210/en.2010-0702
Pulsifer, P. L., Caquard, S., and Taylor, D. R. F. (2007). “Toward a new generation of community atlases – the Cybercartographic Atlas of Antarctica,” in Multimedia Cartography, 2nd Edn, ed W. Cartwright, M. P. Peterson, and G. Gartner (Heidelberg: Springer), 195–216.
Pulsifer, P. L., Parush, A., Lindgaard, G., and Taylor, D. R. F. (2005). “The development of the cybercartographic atlas of Antarctica,” in Cybercartography: Theory and Practice, ed D. R. Fraser Taylor (Amsterdam: Elsevier), 461–490. doi: 10.1016/S1363-0814(05)80023-1
Pulsifer, P. L., and Taylor, D. R. F. (2005). “The cartographer as mediator: cartographic representation from shared geographic information,” in Cybercartography: Theory and Practice, ed D. R. Fraser Taylor (Amsterdam: Elsevier), 149–179. doi: 10.1016/S1363-0814(05)80010-3
Ranson, S. W., Kabat, H., and Magoun, H. W. (1935). Autonomic responses to electrical stimulation of hypothalamus, preoptic region and septum. AMA Arch. Neurol. Psychiatry 33, 467–477. doi: 10.1001/archneurpsyc.1935.02250150017002
Resch, J. M., Boisvert, J. P., Hourigan, A. E., Mueller, C. R., Yi, S. S., and Choi, S. (2011). Stimulation of the hypothalamic ventromedial nuclei by pituitary adenylate cyclase-activating polypeptide induces hypophagia and thermogenesis. Am. J. Physiol. Regul. Integr. Comp. Physiol. 301, R1625–R1634. doi: 10.1152/ajpregu.00334.2011
Richard, J. M., Castro, D. C., DiFeliceantonio, A. G., Robinson, M. J. F., and Berridge, K. C. (2013). Mapping brain circuits of reward and motivation: in the footsteps of Ann Kelley. Neurosci. Biobehav. Rev. 37, 1919–1931. doi: 10.1016/j.neubiorev.2012.12.008
Roitbak, A. I. (1980). The importance of I. M. Sechenov's electrophysiological research. Acta Neurobiol. Exp. (Wars) 40, 451–461.
Rossi, M., Kim, M. S., Morgan, D. G. A., Small, C. J., Edwards, C. M. B., Sunter, D., et al. (1998). A C-terminal fragment of Agouti-related protein increases feeding and antagonizes the effect of alpha-melanocyte stimulating hormone in vivo. Endocrinology 139, 4428–4431. doi: 10.1210/en.139.10.4428
Routtenberg, A. (1972). Intracranial chemical injection and behavior: a critical review. Behav. Biol. 7, 601–641. doi: 10.1016/S0091-6773(72)80073-7
Roux, E., and Borrel, A. (1898). Tétanos cérébral et immunité contre le tétanos. Ann. Inst. Pasteur 4, 225–239.
Rowan-Robinson, M. (1985). The Cosmological Distance Ladder: Distance and Time in the Universe. New York, NY: W. H. Freeman and Company.
Rybak, J., Kuß, A., Lamecker, H., Zachow, S., Hege, H.-C., Lienhard, M., et al. (2010). The digital bee brain: integrating and managing neurons in a common 3D reference system. Front. Syst. Neurosci. 4:30. doi: 10.3389/fnsys.2010.00030
Saeki, N., Sunami, K., Kubota, M., Murai, H., Takanashi, J., Iuchi, T., et al. (2001). Heavily T2-weighted MR imaging of white matter tracts in the hypothalamus: normal and pathologic demonstrations. AJNR Am. J. Neuroradiol. 22, 1468–1475.
Sagar, S. M., Sharp, F. R., and Curran, T. (1988). Expression of c-fos protein in brain: metabolic mapping at the cellular level. Science 240, 1328–1331. doi: 10.1126/science.3131879
Sahlgren, E. (1934). Experimentelle untersuchungen uber den angriffspunkt des luminals im gehirn bei kaninchen. Acta Psychiatrica Scandinavica 9, 129–147. doi: 10.1111/j.1600-0447.1934.tb03677.x
Sato, Y., Endo, H., Ajiki, T., Hakamata, Y., Okada, T., Murakami, T., et al. (2004). Establishment of Cre/LoxP recombination system in transgenic rats. Biochem. Biophys. Res. Commun. 319, 1197–1202. doi: 10.1016/j.bbrc.2004.04.204
Sauer, B. (1987). Functional expression of the cre-lox site-specific recombination system in the yeast Saccharomyces cerevisiae. Mol. Cell. Biol. 7, 2087–2096.
Sauer, B. (1998). Inducible gene targeting in mice using the Cre/lox system. Methods 14, 381–392. doi: 10.1006/meth.1998.0593
Sauer, B., and Henderson, N. (1988). The cyclization of linear DNA in Escherichia coli by site-specific recombination. Gene 70, 331–341. doi: 10.1016/0378-1119(88)90205-3
Sawchenko, P. E., and Gerfen, C. R. (1985). Plant lectins and bacterial toxins as tools for tracing neuronal connections. Trends Neurosci. 8, 378–384. doi: 10.1016/0166-2236(85)90137-7
Scammell, T. E., Elmquist, J. K., Griffin, J. D., and Saper, C. B. (1996). Ventromedial preoptic prostaglandin E2 activates fever-producing autonomic pathways. J. Neurosci. 16, 6246–6254.
Schaer, J.-P. (1987) “Introduction: comparative anatomy in geology,” in The Anatomy of Mountain Ranges, eds J.-P. Schaer and J. Rodgers (Princeton, NJ: Princeton University Press), 3–10.
Schick, R. R., Zimmermann, J. P., Walde, T. V., and Schusdziarra, V. (2003). Peptides that regulate food intake: glucagon-like peptide 1-(7-36) amide acts at lateral and medial hypothalamic sites to suppress feeding in rats. Am. J. Physiol. Regul. Integr. Comp. Physiol. 284, R1427–R1435.
Scremin, O. (1970). The vascular anatomy of the rat's hypothalamus in stereotaxic coordinates. J. Comp. Neurol. 139, 31–52. doi: 10.1002/cne.901390103
Sechenov, I. M. (1863). Physiologische Studien über die Hemmungsmechanismen für die Reflexthätigkeit des Rückenmarks im Gehirne Des Frosches. Berlin: August Hirschwald.
Seeley, T. D., and Visscher, P. K. (2004). Quorum sensing during nest-site selection by honeybee swarms. Behav. Ecol. Sociobiol. 56, 594–601. doi: 10.1007/s00265-004-0814-5
Seeley, T. D., Visscher, P. K., Schlegel, T., Hogan, P. M., Franks, N. R., and Marshall, J. A. R. (2012). Stop signals provide cross inhibition in collective decision-making by honeybee swarms. Science 335, 108–111. doi: 10.1126/science.1210361
Segal, J. P., Stallings, N. R., Lee, C. E., Zhao, L., Socci, N., Viale, A., et al. (2005). Use of laser-capture microdissection for the identification of marker genes for the ventromedial hypothalamic nucleus. J. Neurosci. 25, 4181–4188. doi: 10.1523/JNEUROSCI.0158-05.2005
Semjonous, N. M., Smith, K. L., Parkinson, J. R. C., Gunner, D. J. L., Liu, Y.-L., Murphy, K. G., et al. (2009). Coordinated changes in energy intake and expenditure following hypothalamic administration of neuropeptides involved in energy balance. Int. J. Obes. (Lond.) 33, 775–785. doi: 10.1038/ijo.2009.96
Semple, D. (1899). The treatment of tetanus by the intracerebral injection of antitoxin, with particulars of a case treated by this method followed by recovery. Br. Med. J. 1, 10–12. doi: 10.1136/bmj.1.1984.10
Seung, S. (2012). Connectome: How the Brain's Wiring Makes Us Who We Are. Boston, MA: Mariner Books.
Shackleton, E. (1919). South: The Story of Shackleton's Last Expedition 1914-1917. London: Heinemann.
Sherrington, C. S. (1919). Mammalian Physiology: A Course of Practical Exercises. Oxford: Hunphrey Milford.
Sherwood, N. M., and Timiras, P. S. (1970). A Stereotaxic Atlas of the Developing Rat Brain. Berkeley, CA: University of California Press.
Shinomiya, K., Matsuda, K., Oishi, T., Otsuna, H., and Ito, K. (2011). Flybrain neuron database: a comprehensive database system of the Drosophila brain neurons. J. Comp. Neurol. 519, 807–833. doi: 10.1002/cne.22540
Simmons, D. M., and Swanson, L. W. (2009). Comparing histological data from different brains: sources of error and strategies for minimizing them. Brain Res. Rev. 60, 349–367. doi: 10.1016/j.brainresrev.2009.02.002
Simson, E. L., Jones, A. P., and Gold, R. M. (1981). Horizontal stereotaxic atlas of the albino rat brain. Brain Res. Bull. 6, 297–326. doi: 10.1016/S0361-9230(81)80001-9
Singer, G., and Montgomery, R. B. (1973). Specificity of chemical stimulation of the rat brain and other related issues in the interpretation of chemical stimulation data. Pharmacol. Biochem. Behav. 1, 211–221. doi: 10.1016/0091-3057(73)90102-0
Slangen, J. L., and Miller, N. E. (1969). Pharmacological tests for the function of hypothalamic norepinephrine in eating behavior. Physiol. Behav. 4, 543–552. doi: 10.1016/0031-9384(69)90152-8
Slotnick, B. M., and Hersch, S. (1980). A stereotaxic atlas of the rat olfactory system. Brain Res. Bull. 5(Suppl. 5), 1–55. doi: 10.1016/0361-9230(80)90311-1
Smith, K. S., and Berridge, K. C. (2005). The ventral pallidum and hedonic reward: neurochemical maps of sucrose “liking” and food intake. J. Neurosci. 25, 8637–8649. doi: 10.1523/JNEUROSCI.1902-05.2005
Smith, K. S., and Berridge, K. C. (2007). Opioid limbic circuit for reward: interaction between hedonic hotspots of nucleus accumbens and ventral pallidum. J. Neurosci. 27, 1594–1605. doi: 10.1523/JNEUROSCI.4205-06.2007
Sokoloff, L., Reivich, M., Kennedy, C., Des Rosiers, M. H., Patlak, C. S., Pettigrew, K. D., et al. (1977). The [14C]deoxyglucose method for the measurement of local cerebral glucose utilization: theory, procedure, and normal values in the conscious and anesthetized albino rat. J. Neurochem. 28, 897–916. doi: 10.1111/j.1471-4159.1977.tb10649.x
Sousa-Ferreira, L., Garrido, M., Nascimento-Ferreira, I., Nobrega, C., Santos-Carvalho, A., Ãlvaro, A. R., et al. (2011). Moderate long-term modulation of neuropeptide Y in hypothalamic arcuate nucleus induces energy balance alterations in adult rats. PLoS ONE 6:e22333. doi: 10.1371/journal.pone.0022333
Sporns, O., Tononi, G., and Kötter, R. (2005). The human connectome: a structural description of the human brain. PLoS Comput. Biol. 1:e42. doi: 10.1371/journal.pcbi.0010042
Stanley, B. G., Ha, L. H., Spears, L. C., and Dee, M. G. (1993a). Lateral hypothalamic injections of glutamate, kainic acid, D, L-alpha-amino-3-hydroxy-5-methyl-isoxazole propionic acid or N-methyl-D-aspartic acid rapidly elicit intense transient eating in rats. Brain Res. 613, 88–95. doi: 10.1016/0006-8993(93)90458-Y
Stanley, B. G., Magdalin, W., Seirafi, A., Thomas, W. J., and Leibowitz, S. F. (1993b). The perifornical area: the major focus of (a) patchily distributed hypothalamic neuropeptide Y-sensitive feeding system(s). Brain Res. 604, 304–317. doi: 10.1016/0006-8993(93)90382-W
Stanley, B. G., Willett, V. L., Donias, H. W., Ha, L. H., and Spears, L. C. (1993c). The lateral hypothalamus: a primary site mediating excitatory amino acid-elicited eating. Brain Res. 630, 41–49. doi: 10.1016/0006-8993(93)90640-9
Stanley, B. G., Kyrkouli, S. E., Lampert, S., and Leibowitz, S. F. (1986). Neuropeptide Y chronically injected into the hypothalamus: a powerful neurochemical inducer of hyperphagia and obesity. Peptides 7, 1189–1192. doi: 10.1016/0196-9781(86)90149-X
Stanley, B. G., Lanthier, D., and Leibowitz, S. F. (1988). Multiple brain sites sensitive to feeding stimulation by opioid agonists: a cannula-mapping study. Pharmacol. Biochem. Behav. 31, 825–832. doi: 10.1016/0091-3057(88)90391-7
Stanley, B. G., and Leibowitz, S. F. (1984). Neuropeptide Y: stimulation of feeding and drinking by injection into the paraventricular nucleus. Life Sci. 35, 2635–2642. doi: 10.1016/0024-3205(84)90032-8
Stanley, B. G., Magdalin, W., Seirafi, A., Nguyen, M. M., and Leibowitz, S. F. (1992). Evidence for neuropeptide Y mediation of eating produced by food deprivation and for a variant of the Y1 receptor mediating this peptide's effect. Peptides 13, 581–587. doi: 10.1016/0196-9781(92)90093-I
Stanley, B. G., Urstadt, K. R., Charles, J. R., and Kee, T. (2011). Glutamate and GABA in lateral hypothalamic mechanisms controlling food intake. Physiol. Behav. 104, 40–46. doi: 10.1016/j.physbeh.2011.04.046
Stanley, B. G., Willett, V. L., Donias, H. W., Dee, M. G., and Duva, M. A. (1996). Lateral hypothalamic NMDA receptors and glutamate as physiological mediators of eating and weight control. Am. J. Physiol. 270, R443–R449.
Stark, J. A., Davies, K. E., Williams, S. R., and Luckman, S. M. (2006). Functional magnetic resonance imaging and c-Fos mapping in rats following an anorectic dose of m-chlorophenylpiperazine. Neuroimage 31, 1228–1237. doi: 10.1016/j.neuroimage.2006.01.046
Stark, J. A., McKie, S., Davies, K. E., Williams, S. R., and Luckman, S. M. (2008). 5-HT(2C) antagonism blocks blood oxygen level-dependent pharmacological-challenge magnetic resonance imaging signal in rat brain areas related to feeding. Eur. J. Neurosci. 27, 457–465. doi: 10.1111/j.1460-9568.2007.06002.x
Sternson, S. M. (2013). Hypothalamic survival circuits: blueprints for purposive behaviors. Neuron 77, 810–824. doi: 10.1016/j.neuron.2013.02.018
Sternson, S. M., Betley, J. N., and Cao, Z. F. H. (2013). Neural circuits and motivational processes for hunger. Curr. Opin. Neurobiol. 23, 353–360. doi: 10.1016/j.conb.2013.04.006
Stevenson, J. A. F. (1969). “Neural control of food and water intake,” in The Hypothalamus, eds W. Haymaker, E. Anderson, W. J. H. Nauta (Springfield, IL: Charles, C. Thomas Publisher), 524–621.
Steward, O. (1981). “Horseradish peroxidase and fluorescent substances and their combination with other techniques,” in Neuroanatomical Tract-Tracing Methods, eds L. Heimer, and M. J. RoBards (New York, NY: Plenum Press), 279–310.
Stratford, T. R., and Kelley, A. E. (1999). Evidence of a functional relationship between the nucleus accumbens shell and lateral hypothalamus subserving the control of feeding behavior. J. Neurosci. 19, 11040–11048.
Sullivan, W. (1957). Quest for a Continent: The Story of the Antarctic. New York, NY: McGraw-Hill Book Company.
Swanson, L. W. (1987). “The hypothalamus,” in Handbook of Chemical Neuroanatomy, Vol. 5: Integrated Systems of the CNS, Part, I, eds A. Björklund, T. Hökfelt, and L. W. Swanson (Amsterdam: Elsevier), 1–124.
Swanson, L. W. (2000a). “A history of neuroanatomical mapping,” in Brain Mapping: The Systems, eds A. W. Toga and J. C. Mazziotta (San Diego, CA: Academic Press), 77–109. doi: 10.1016/B978-012692545-6/50005-2
Swanson, L. W. (2000b). What is the brain. Trends Neurosci. 23, 519–527. doi: 10.1016/S0166-2236(00)01639-8
Swanson, L. W. (2000c). Cerebral hemisphere regulation of motivated behavior. Brain Res. 886, 113–164. doi: 10.1016/S0006-8993(00)02905-X
Swanson, L. W. (2001). “Interactive brain maps and atlases,” in Computing the Brain: A Guide to Neuroinformatics, eds M. A. Arbib and J. S. Grethe (San Diego, CA: Academic Press), 167–177.
Swanson, L. W. (2004). Brain Maps: The Structure of the Rat Brain, 3rd Edn. San Diego, CA: Elsevier.
Swanson, L. W., Perez, V. J., and Sharpe, L. G. (1972). Accurate and reliable intracerebral delivery of minute volumes of drug solutions. J. Appl. Physiol. 33, 247–251.
Swanson, L. W., Sanchez-Watts, G., and Watts, A. G. (2005). Comparison of melanin-concentrating hormone and hypocretin/orexin mRNA expression patterns in a new parceling scheme of the lateral hypothalamic zone. Neurosci. Lett. 387, 80–84. doi: 10.1016/j.neulet.2005.06.066
Sweet, D. C., Levine, A. S., Billington, C. J., and Kotz, C. M. (1999). Feeding response to central orexins. Brain Res. 821, 535–538. doi: 10.1016/S0006-8993(99)01136-1
Szczypka, M. S., Kwok, K., Brot, M. D., Marck, B. T., Matsumoto, A. M., Donahue, B. A., et al. (2001). Dopamine production in the caudate putamen restores feeding in dopamine-deficient mice. Neuron 30, 819–828. doi: 10.1016/S0896-6273(01)00319-1
Szentágothai, J., Flerkó, B., Mess, B., and Halász, B. (1962). “Cytoarchitectonic atlas of the rat brain in Horsley-Clarke coordinates, ” in Hypothalamic Control of the Anterior Pituitary, eds J. Szentágothai, B. Flerkó, B. Mess, and B. Halász (Budapest: Akadémiai Kiadó), 20–36.
Szentágothai, J., Flerkó, B., Mess, B., and Halász, B. (1968). “Cytoarchitectonic atlas of the rat brain in Horsley-Clarke coordinates,” in Hypothalamic Control of the Anterior Pituitary, 3rd revised Edn, eds J. Szentágothai, B. Flerkó, B. Mess, and B. Halász (Budapest: Akadémiai Kiadó), 22–39.
Taylor, A. C., and Weiss, P. (1965). Demonstration of axonal flow by the movement of tritium-labeled protein in mature optic nerve fibers. Proc. Natl. Acad. Sci. U.S.A. 54, 1521–1527. doi: 10.1073/pnas.54.6.1521
Thanos, P. K., Robison, L., Nestler, E. J., Kim, R., Michaelides, M., Lobo, M. K., et al. (2013). Mapping brain metabolic connectivity in awake rats with μPET and optogenetic stimulation. J. Neurosci. 33, 6343–6349. doi: 10.1523/JNEUROSCI.4997-12.2013
Theodosis, D. T., Poulain, D. A., and Oliet, S. H. R. (2008). Activity-dependent structural and functional plasticity of astrocyte-neuron interactions. Physiol. Rev. 88, 983–1008. doi: 10.1152/physrev.00036.2007
Thompson, R. H., Canteras, N. S., and Swanson, L. W. (1996). Organization of projections from the dorsomedial nucleus of the hypothalamus: a PHA-L study in the rat. J. Comp. Neurol. 376, 143–173. doi: 10.1002/(SICI)1096-9861(19961202)376:1<143::AID-CNE9>3.0.CO;2-3
Thompson, R. H., and Swanson, L. W. (2010). Hypothesis-driven structural connectivity analysis supports network over hierarchical model of brain architecture. Proc. Natl. Acad. Sci. U.S.A. 107, 15235–15239. doi: 10.1073/pnas.1009112107
Ting, J. T., and Feng, G. (2013). Development of transgenic animals for optogenetic manipulation of mammalian nervous system function: progress and prospects for behavioral neuroscience. Behav. Brain Res. 255, 3–18. doi: 10.1016/j.bbr.2013.02.037
Toga, A. W., Santori, E. M., Hazani, R., and Ambach, K. (1995). A 3D digital map of rat brain. Brain Res. Bull. 38, 77–85. doi: 10.1016/0361-9230(95)00074-O
Toga, A. W., and Thompson, P. M. (2001). The role of image registration in brain mapping. Image Vis. Comput. 19, 3–24. doi: 10.1016/S0262-8856(00)00055-X
Toga, A. W., and Thompson, P. M. (2007). What is where and why it is important. Neuroimage 37, 1045–1049; discussion 1066–1068. doi: 10.1016/j.neuroimage.2007.02.018
Tung, Y.-C. L., Ayuso, E., Shan, X., Bosch, F., O'Rahilly, S., Coll, A. P., et al. (2010). Hypothalamic-specific manipulation of Fto, the ortholog of the human obesity gene FTO, affects food intake in rats. PLoS ONE 5:e8771. doi: 10.1371/journal.pone.0008771
Ungerstedt, U. (1971). Stereotaxic mapping of monoamine pathways in the rat brain. Acta Physiol. Scand. Suppl. 367, 1–48.
van den Pol, A. N. (2003). Weighing the role of hypothalamic feeding neurotransmitters. Neuron 40, 1059–1061. doi: 10.1016/S0896-6273(03)00809-2
Valenstein, T., Case, B., and Valenstein, E. S. (1969). Stereotaxic atlas of the infant rat hypothalamus. Dev. Psychobiol. 2, 75–80. doi: 10.1002/dev.420020206
van den Pol, A. N. (2012). Neuropeptide transmission in brain circuits. Neuron 76, 98–115. doi: 10.1016/j.neuron.2012.09.014
van den Pol, A. N., and Cassidy, J. R. (1982). The hypothalamic arcuate nucleus—a quantitative Golgi analysis. J. Comp. Neurol. 204, 65–98. doi: 10.1002/cne.902040108
van den Pol, A. N., and Gallyas, F. (1990). Trauma-induced Golgi-like staining of neurons: a new approach to neuronal organization and response to injury. J. Comp. Neurol. 296, 654–673. doi: 10.1002/cne.902960410
van den Pol, A. N., Ozduman, K., Wollmann, G., Ho, W. S. C., Simon, I., Yao, Y., et al. (2009). Viral strategies for studying the brain, including a replication-restricted self-amplifying Delta-G Vesicular Stomatis Virus that rapidly expresses transgenes in brain and can generate a multicolor Golgi-like expression. J. Comp. Neurol. 516, 456–481. doi: 10.1002/cne.22131
van der Loos, H. (1967). “The history of the neuron,” in The Neuron, ed H. Hydén (Amsterdam: Elsevier), 1–48.
Van Essen, D. C., and Dierker, D. (2007). On navigating the human cerebral cortex: response to ‘in praise of tedious anatomy’. Neuroimage 37, 1050–1054; discussion 1066–1068. doi: 10.1016/j.neuroimage.2007.02.021
van Noorden, C. J. F., and Frederiks, W. M. (1992). Enzyme Histochemistry: A Laboratory Manual of Current Methods. Oxford: Oxford University Press.
Veening, J., Swanson, L. W., Cowan, W. M., Nieuwenhuys, R., and Geeraedts, L. M. G. (1982). The medial forebrain bundle of the rat. II. An autoradiographic study of the topography of the major descending and ascending components. J. Comp. Neurol. 206, 82–108. doi: 10.1002/cne.902060107
Visscher, P. K. (2007). Group decision making in nest-site selection among social insects. Annu. Rev. Entomol. 52, 255–275. doi: 10.1146/annurev.ento.51.110104.151025
von Euler, C., and Holmgren, B. (1956). The thyroxine ‘receptor’ of the thyroid-pituitary system. J. Physiol. (Lond.) 131, 125–136.
von Frisch, K. (1953). The Dancing Bees: An Account of the Life and Senses of the Honey Bee (transl Dora Ilse) New York, NY: Harcourt Brace Jovanovich.
Wagner, J. W., and de Groot, J. (1963). Changes in feeding behavior after intracerebral injections in the rat. Am. J. Physiol. 204, 483–487.
Waller, A. (1850). Experiments on the section of the glossopharyngeal and hypoglossal nerves of the frog, and observations of the alterations produced thereby in the structure of their primitive fibers. Phil. Trans. R. Soc. Lond. 140, 423–429. doi: 10.1098/rstl.1850.0021
Wassermann, A., and Takaki, T. (1898). Ueber tetanusantitoxische Eigenschaften des normalen Centralnervensystems. Berlin. Klin. Wochen. 35, 5–6.
Watts, A. G. (1991). Ether anesthesia differentially affects the content of prepro-corticotropin-releasing hormone, prepro-neurotensin/neuromedin N and prepro-enkephalin mRNAs in the hypothalamic paraventricular nucleus of the rat. Brain Res. 544, 353–357. doi: 10.1016/0006-8993(91)90080-F
Watts, A. G., and Khan, A. M. (2013). Identifying links in the chain: the dynamic coupling of catecholamines, peptide synthesis, and peptide release in hypothalamic neuroendocrine neurons. Adv. Pharmacol. 68, 421–444. doi: 10.1016/B978-0-12-411512-5.00020-8
Watts, A. G., Khan, A. M., Sanchez-Watts, G., Salter, D., and Neuner, C. M. (2006). Activation in neural networks controlling ingestive behaviors: what does it mean, and how do we map and measure it. Physiol. Behav. 89, 501–510. doi: 10.1016/j.physbeh.2006.05.025
Watts, A. G., and Sanchez-Watts, G. (2007). Rapid and preferential activation of Fos protein in hypocretin/orexin neurons following the reversal of dehydration-anorexia. J. Comp. Neurol. 502, 768–782. doi: 10.1002/cne.21316
Watts, A. G., and Swanson, L. W. (2002). “Anatomy of Motivation,” in Stevens' Handbook of Experimental Psychology, 3rd Edn, Vol. 3: Learning, Motivation, and Emotion, ed R. Gallistel (Springfield, IL: Charles, C. Thomas Publisher; New York, NY: John Wiley and Sons), 563–631.
Weigert, C. (1882). Ueber eine neue Untersuchungsmethode des Central- nervensystems. Centralblatt für die medicinischen Wissenschaften 42, 753–757.
Weil, A. (1928). A rapid method for staining myelin sheaths. AMA Arch. Neurol. Psychiatr. 20, 392–393. doi: 10.1001/archneurpsyc.1928.02210140160013
Wells, C. E., and Khan, A. M. (2013). “Data transformations between rat brain atlases: Mapping central microinjection sites on stereotaxically aligned and anisotropically scaled digital atlas plates in Paxinos and Watson and Swanson reference spaces. Program No. 198.06,” in 2013 Neuroscience Meeting Planner. (San Diego, CA: Society for Neuroscience).
White, J. G., Southgate, E., Thomson, J. N., and Brenner, S. (1986). The structure of the nervous system of the nematode Caenorhabditis elegans. Philos. Trans. R. Soc. Lond. B Biol. Sci. 314, 1–340. doi: 10.1098/rstb.1986.0056
Williamson, M., Bingham, B., Gray, M., Innala, L., and Viau, V. (2010). The medial preoptic nucleus integrates the central influences of testosterone on the paraventricular nucleus of the hypothalamus and its extended circuitries. J. Neurosci. 30, 11762–11770. doi: 10.1523/JNEUROSCI.2852-10.2010
Wilson, E. (1997). Neurosurgical treatment for tetanus. J. Hist. Neurosci. 6, 82–85. doi: 10.1080/09647049709525688
Wise, R. A. (2005). Forebrain substrates of reward and motivation. J. Comp. Neurol. 493, 115–121. doi: 10.1002/cne.20689
Wise, R. A., and Hoffman, D. C. (1992). Localization of drug reward mechanisms by intracranial injections. Synapse 10, 247–263. doi: 10.1002/syn.890100307
Witten, I. B., Steinberg, E. E., Lee, S. Y., Davidson, T. J., Zalocusky, K. A., Brodsky, M., et al. (2011). Recombinase-driver rat lines: tools, techniques, and optogenetic application to dopamine-mediated reinforcement. Neuron 72, 721–733. doi: 10.1016/j.neuron.2011.10.028
Wolf, G., and Yen, J. S. (1968). Improved staining of unembedded brain tissue. Physiol. Behav. 3, 209–210. doi: 10.1016/0031-9384(68)90058-9
Woods, J. S., and Leibowitz, S. F. (1985). Hypothalamic sites sensitive to morphine and naloxone: effects on feeding behavior. Pharmacol. Biochem. Behav. 23, 431–438. doi: 10.1016/0091-3057(85)90017-6
Wouterlood, F. G., and Groenewegen, H. J. (1991). The Phaseolus vulgaris-Leucoagglutinin tracing technique for the study of neuronal connections. Prog. Histochem. Cytochem. 22, 1–78. doi: 10.1016/S0079-6336(11)80038-0
Wu, Q., Clark, M. S., and Palmiter, R. D. (2012). Deciphering a neuronal circuit that mediates appetite. Nature 483, 594–598. doi: 10.1038/nature10899
Wünscher, W., Schober, W., and Werner, L. (1965). Architektonischer Atlas Vom Hirnstamm Der Ratte. Leipzig: S. Hirzel Verlag.
Yang, C., Gagnon, D., Vachon, P., Tremblay, A., Levy, E., Massie, B., et al. (2006). Adenoviral-mediated modulation of Sim1 expression in the paraventricular nucleus affects food intake. J. Neurosci. 26, 7116–7120. doi: 10.1523/JNEUROSCI.0672-06.2006
Yang, L., Scott, K. A., Hyun, J., Tamashiro, K. L., Tray, N., Moran, T. H., et al. (2009). Role of dorsomedial hypothalamic neuropeptide Y in modulating food intake and energy balance. J. Neurosci. 29, 179–190. doi: 10.1523/JNEUROSCI.4379-08.2009
Yizhar, O., Enno, L. E., Davidson, T. J., Mogri, M., and Deisseroth, K. (2011). Optogenetics in neural systems. Neuron 71, 9–34. doi: 10.1016/j.neuron.2011.06.004
Young, R. M. (1990). Mind, Brain, and Adaptation in the Nineteenth Century: Cerebral Localization and Its Biological Context from Gall to Ferrier. Oxford: Oxford University Press.
Yuan, X. R., Madamba, S., and Siggins, G. R. (1992). Opioid peptides reduce synaptic transmission in the nucleus accumbens. Neurosci. Lett. 134, 223–228. doi: 10.1016/0304-3940(92)90522-9
Yue, C., Mutsuga, N., Verbalis, J., and Gainer, H. (2006). Microarray analysis of gene expression in the supraoptic nucleus of normoosmotic and hypoosmotic rats. Cell Mol. Neurobiol. 26, 959–978. doi: 10.1007/s10571-006-9017-0
Záborszky, L., Wouterlood, F. J., and Lanciego, J. L. (eds.). (2006). Neuroanatomical Tract-Tracing 3: Molecules, Neurons, and Systems. New York, NY: Springer. doi: 10.1007/0-387-28942-9
Zaslavsky, I., Baldock, R., Bjålie, J., Burger, A., Ellisman, M., Hawrylycz, M., et al. (2010). Development of community standards for brain atlas interoperability. Front. Neurosci. Conference Abstract: Neuroinformatics 2010. doi: 10.3389/conf.fnins.2010.13.00116
Zhan, C., Zhou, J., Feng, Q., Zhang, J.-E., Lin, S., Bao, J., et al. (2013). Acute and long-term suppression of feeding behavior by POMC neurons in the brainstem and hypothalamus, respectively. J. Neurosci. 33, 3624–3632. doi: 10.1523/JNEUROSCI.2742-12.2013
Zhang, F., Gradinaru, V., Adamantidis, A. R., Durand, R., Airan, R. D., de Lecea, L., et al. (2010). Optogenetic interrogation of neural circuits: technology for probing mammalian brain structures. Nat. Protoc. 5, 439–456. doi: 10.1038/nprot.2009.226
Zheng, F., Kim, Y. J., Chao, P.-T., and Bi, S. (2013). Overexpression of neuropeptide Y in the dorsomedial hypothalamus causes hyperphagia and obesity in rats. Obesity 21, 1086–1092. doi: 10.1002/oby.20467
Zhu, G., Yan, J., Smith, W. W., Moran, T. H., and Bi, S. (2012). Roles of dorsomedial hypothalamic cholecystokinin signaling in the controls of meal patterns and glucose homeostasis. Physiol. Behav. 105, 234–241. doi: 10.1016/j.physbeh.2011.08.007
Zieglgänsberger, W., French, E. D., Siggins, G. R., and Bloom, F. E. (1979). Opioid peptides may excite hippocampal pyramidal neurons by inhibiting adjacent inhibitory interneurons. Science 205, 415–417. doi: 10.1126/science.451610
Zilles, K. (1985). The Cortex of the Rat: A Stereotaxic Atlas. New York, NY: Springer-Verlag. doi: 10.1007/978-3-642-70573-1
Keywords: injections, optogenetic, pharmacogenetic, pharmacosynthetic, mapping, stereotaxic, neuroinformatics, DREADD
Citation: Khan AM (2013) Controlling feeding behavior by chemical or gene-directed targeting in the brain: what's so spatial about our methods? Front. Neurosci. 7:182. doi: 10.3389/fnins.2013.00182
Received: 07 February 2013; Accepted: 20 September 2013;
Published online: 18 December 2013.
Edited by:
Kevin W. Williams, The University of Texas Southwestern Medical Center, USAReviewed by:
Laurent Gautron, The University of Texas Southwestern Medical Center, USAJiehuan Huang, Pennsylvania State University, USA
Brian A. Baldo, University of Wisconsin-Madison, USA
Copyright © 2013 Khan. This is an open-access article distributed under the terms of the Creative Commons Attribution License (CC BY). The use, distribution or reproduction in other forums is permitted, provided the original author(s) or licensor are credited and that the original publication in this journal is cited, in accordance with accepted academic practice. No use, distribution or reproduction is permitted which does not comply with these terms.
*Correspondence: Arshad M. Khan, UTEP Systems Neuroscience Laboratory, Department of Biological Sciences, University of Texas at El Paso, 500 West University Avenue, Biosciences Research Bldg., Room 2.171, El Paso, TX 79968, USA e-mail: amkhan2@utep.edu