Corrigendum: The quest for EEG power band correlation with ICA derived fMRI resting state networks
 Matthias C. Meyer1*
  Ronald J. Janssen1
  Erik S. B. Van Oort1,2
  Christian F. Beckmann1,2
  Markus Barth1,3
- 1Donders Institute for Brain, Cognition and Behaviour, Radboud University Nijmegen, Nijmegen, Netherlands
- 2MIRA Institute for Biomedical Technology and Technical Medicine, University of Twente, Twente, Netherlands
- 3Erwin L. Hahn Institute for Magnetic Resonance Imaging, University Duisburg-Essen, Essen, Germany
A corrigendum on
The quest for EEG power band correlation with ICA derived fMRI resting state networks
by Meyer, M. C., Janssen, R. J., Van Oort, E. S., Beckmann, C. F., and Barth, M. (2013). Front. Hum. Neurosci. 7:315. doi: 10.3389/fnhum.2013.00315
We have noticed that during the revision process of the original manuscript a modification in the analysis script to enable the parallel processing of more data sets led to incorrect indices for the selection of active dipoles. This mistake in the analysis pipeline affected the results of SFPC, i.e., Figure 5 and the part of Table 1 labeled “SFPC variance for 5 subjects.”
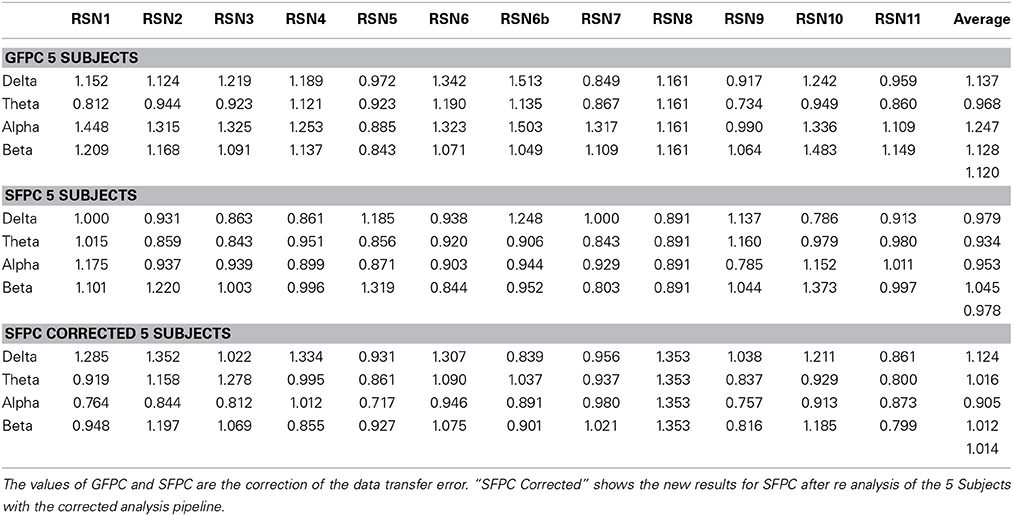
Table 1. Correction of Table 1 in the original manuscript for GFPC and SFPC.
We corrected this mistake in the analysis script and reanalyzed the 5 Subjects. While this affected the individual frequency power time courses, it did not result in a more stable correlation with the RSN timelines. The corrected Figure 5 of this erratum depicts the corrected rank graphs for SFPC, which show only minor differences to the erroneous graphs in the original Figure 5 of the published manuscript. This reflects a similar inter subject and temporal variance independent of the change in dipole location.
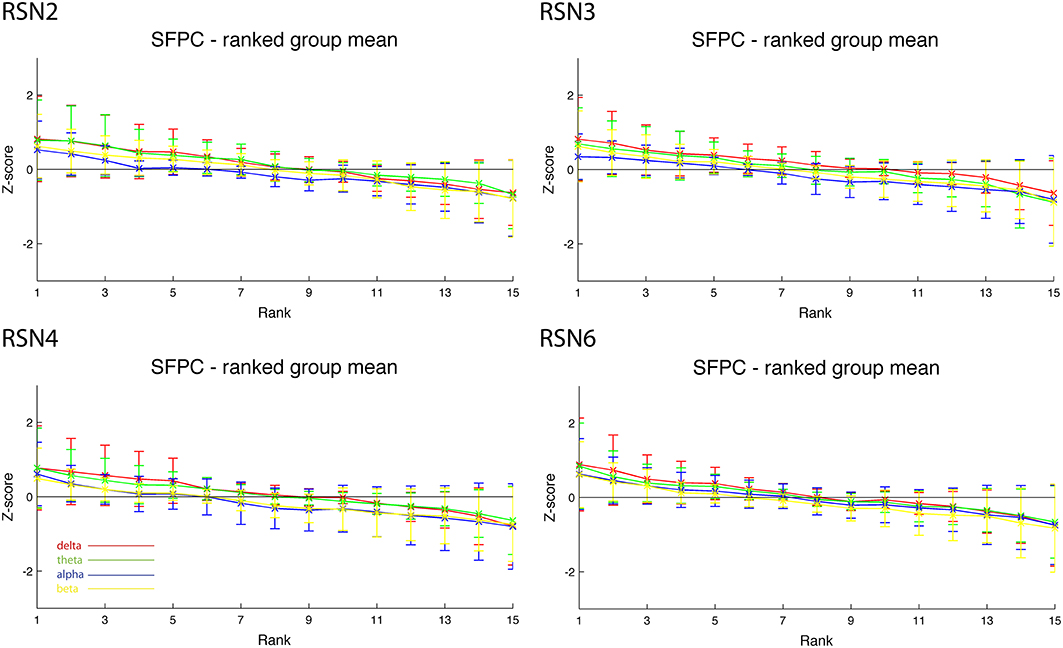
Figure 1. Correction of Figure 5 of the original manuscript, showing only minor differences to the erroneous graphs in the original Figure 5. This reflects a similar inter subject and temporal variance independent of the change in dipole location.
We also noted a lapse in the part of the original Table 1, which shows the variance values for SFPC and GFPC for 5 subjects. This was due to an error in the data transfer between Excel and Word in the final version of the manuscript after the revision process. The corrected Table 1 below shows the corrected values of both GFPC and SFPC analysis.
It is important to note that the corrected results did not impact on our original conclusions of the published manuscript.
Conflict of Interest Statement
The authors declare that the research was conducted in the absence of any commercial or financial relationships that could be construed as a potential conflict of interest.
Keywords: erratum, combined EEG-fMRI, resting state, source modeling, ICA, ECP
Citation: Meyer MC, Janssen RJ, Van Oort ESB, Beckmann CF and Barth M (2014) Corrigendum: The quest for EEG power band correlation with ICA derived fMRI resting state networks. Front. Hum. Neurosci. 8:539. doi: 10.3389/fnhum.2014.00539
Received: 24 June 2014; Accepted: 01 July 2014;
Published online: 02 September 2014.
Edited and reviewed by: Jean-Claude Baron, University of Cambridge, UK
Copyright © 2014 Meyer, Janssen, Van Oort, Beckmann and Barth. This is an open-access article distributed under the terms of the Creative Commons Attribution License (CC BY). The use, distribution or reproduction in other forums is permitted, provided the original author(s) or licensor are credited and that the original publication in this journal is cited, in accordance with accepted academic practice. No use, distribution or reproduction is permitted which does not comply with these terms.
*Correspondence: matthias.meyer@donders.ru.nl