The neural substrate of prior information in perceptual decision making: a model-based analysis
- 1 Spinoza Center for Neuroimaging, University of Amsterdam, Amsterdam, Netherlands
- 2 School of Psychology, University of Newcastle, Callaghan, NSW, Australia
- 3 Department of Psychological Methodology, University of Amsterdam, Amsterdam, Netherlands
- 4 Department of Cognitive Neurology, Max Planck Institute for Human Cognitive and Brain Sciences, Leipzig, Germany
Prior information biases the decision process: actions consistent with prior information are executed swiftly, whereas actions inconsistent with prior information are executed slowly. How is this bias implemented in the brain? To address this question we conducted an experiment in which people had to decide quickly whether a cloud of dots moved coherently to the left or to the right. Cues provided probabilistic information about the upcoming stimulus. Behavioral data were analyzed with the linear ballistic accumulator (LBA) model, confirming that people used the cue to bias their decisions. The functional magnetic resonance imaging (fMRI) data showed that presentation of the cue differentially activated orbitofrontal cortex, hippocampus, and the putamen. Directional cues selectively activated the contralateral putamen. The fMRI analysis yielded results only when the LBA bias parameter was included as a covariate, highlighting the practical benefits of formal modeling. Our results suggest that the human brain uses prior information by increasing cortico-striatal activation to selectively disinhibit preferred responses.
Introduction
Even in the simplest perceptual tasks, decision making can be a complex affair. Consider, for instance, the “moving dots” task (Britten et al., 1992 ), popular in research on single-cell activity in monkeys. In this task, participants have to decide quickly – either by making a saccade or by pressing a response button – whether a display of dots appears to move to the left or to the right. Despite its superficial simplicity, successful performance in this task requires the participant not only to process the currently available information effectively (Kim and Shadlen, 1999 ; Schall, 2001 ; Gold and Shadlen, 2007 ; Heekeren et al., 2008 ), but also to take into account information collected in the past.
This article addresses the question of how the brain incorporates prior knowledge in order to guide perceptual decision making (e.g., Bestmann et al., 2008 ; Summerfield and Koechlin, 2008 ; Scheibe et al., 2009 ). In the moving dots task, prior information may be obtained either from previous experience (e.g., 90% of past stimuli required a “left” response) or from a cue that precedes the presentation of the target stimulus. The cue imparts information by suggesting a particular response, hence reducing target uncertainty (e.g., a cue could signal that the upcoming stimulus is likely to require a “left” response). Single-cell recordings in monkeys have shown that a reduction in target uncertainty leads to increased activation in area LIP (Platt and Glimcher, 1999 ), increased activation of superior colliculus (SC) neurons (Basso and Wurtz, 1997 , 1998 ; Dorris and Munoz, 1998 ), and increased activation in substantia nigra pars reticularis (SNr) neurons of the basal ganglia (Basso and Wurtz, 2002 ).
In addition, studies on motor preparation have shown that the instruction to later execute a particular movement results in increased activation of brain areas such as dorsal pre-motor cortex (PMd) and primary motor cortex (M1) (Riehle and Requin, 1989 ; Toni et al., 1999 ; Crammond and Kalaska, 2000 ; Cisek et al., 2003 ; Zang et al., 2003 ; Churchland et al., 2006 ). Instruction-related changes in activation have also been found in the thalamus (Michelon et al., 2006 ), the supplementary motor area (SMA), the anterior cingulate cortex (ACC; Nagai et al., 2004 ), orbitofrontal cortex (OFC; Ikeda et al., 1996 ), and the putamen (Alexander and Crutcher, 1990 ; Jaeger et al., 1993 ). Interestingly, single-cell recordings showed that cortical activation precedes activation in the putamen, suggesting that the preparatory activity in the putamen might be caused by input from M1 and SMA (Alexander and Crutcher, 1990 ; Mink, 1996 ).
Here we present an functional magnetic resonance imaging (fMRI) study in people were given cues that provided probabilistic information about the direction of movement of an upcoming random dot display (i.e., 90%, 70%, or 50% valid). At a behavioral level, we anticipated that the effect of this manipulation would be to bias people’s decision criteria, a prediction that we verified by fitting a quantitative model to the behavioral data. At a neural level, we anticipated that the effect of the manipulation would be to activate subcortical, striatal areas involved in motor planning and action preparation (Mink, 1996 ; Draganski et al., 2008 ; Utter and Basso, 2008 ). In addition, we anticipated that this striatal activation would be accompanied by activation in cortical control areas such as DLPFC (van Veen et al., 2008 ), ACC (Botvinick et al., 2001 ; Ridderinkhof et al., 2004 ; Behrens et al., 2007 ), or OFC (Frank and Claus, 2006 ).
Materials and Methods
Participants
Twenty healthy volunteers participated for a small monetary reward. In order to obtain sufficient data for response time modeling, each participant completed a behavioral session in addition to an fMRI scanning session. All participants signed a consent form prior to the scanning session, had normal or corrected-to-normal vision, and none of them had a history of neurological, major medical, or psychiatric disorders. In the scanner, two participants produced excessive movement artifacts, and a third participant produced incorrect responses on more than 40% of the trials. The data from these participants were excluded from the analysis. The remaining 17 participants (9 women, M age = 25.2, SD age = 3.01) were all right-handed, as confirmed by the Edinburgh Inventory (Oldfield, 1971 ).
Behavioral Task
We used the moving dots task (Britten et al., 1992 ; Gold and Shadlen, 2007 ), which requires participants to decide whether a cloud of dots appears to move to the left or to the right (Figure 1 ). Out of 120 dots, 60 moved coherently and 60 moved randomly. From one 50-ms frame to the next, the “coherent set” of 60 dots were moved 1 pixel in the target direction, whereas the remaining “random set” of 60 dots were relocated randomly. On the subsequent frame, the coherent set and the random set switched roles, such that each dot was displaced coherently on one frame and displaced randomly on the next. This scheme ensures that the cloud remains centered, even though it gives the impression of moving systematically in one direction. Each dot consisted of three by three pixels, and the dots were uniformly distributed across a circle of diameter 250 pixels.
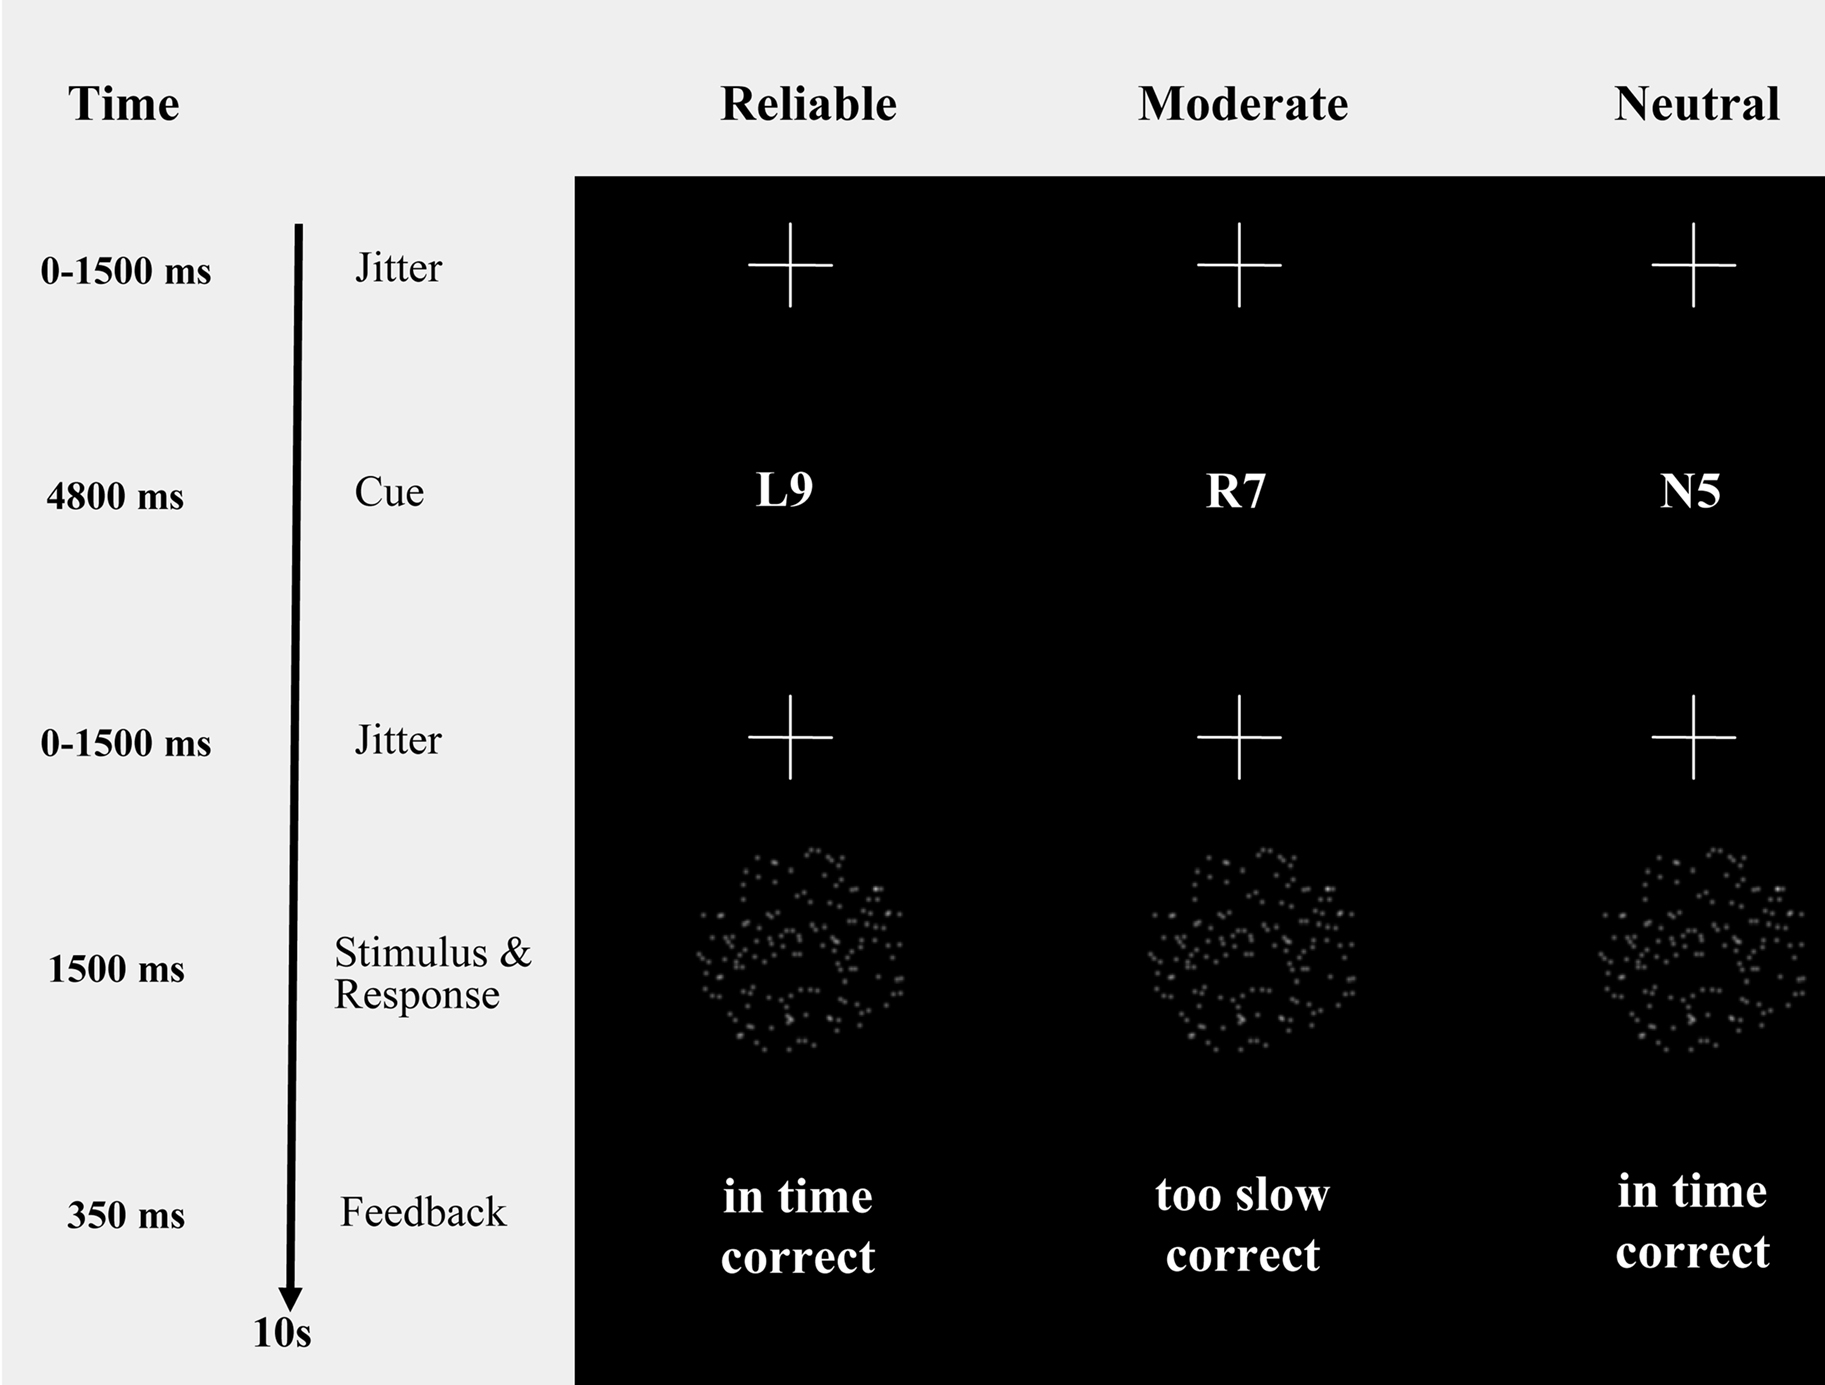
Figure 1. Probabilistic cues in a moving dots paradigm. Moving dots paradigm with cues that provide participants with probabilistic information about the upcoming stimulus (i.e., “R9” and “L9”, reliable cues, indicating a 90% chance of rightward or leftward movement, respectively; “R7” and “L7”, moderate cues, indicating a 70% chance of rightward or leftward movement, respectively; “N5”, neutral cue, indicating that leftward and rightward movement are equally probable). The timing information refers exclusively to the fMRI session.
Participants indicated their response by pressing one of two spatially compatible buttons with their left or right index finger. A cue (i.e., “R9” and “R7” for 90% and 70% probability of rightward movement, “L9” and “L7” for 90% and 70% probability of leftward movement, “N5” for 50% probability) provided participants with probabilistic information about the direction of movement of the upcoming stimulus. Reliable cues were valid on 90% of the trials, moderate cues were valid on 70% of the trials, and neutral cues were valid on 50% of the trials (for a similar paradigm see, e.g., Basso and Wurtz, 1998 , 2002 ). The cues were pseudo-randomly intermixed.
To keep participants motivated to respond quickly and accurately, each trial was followed by a feedback message on response speed and response accuracy (i.e., “in time” and “too slow” for responses faster and slower than 750 ms, respectively; “correct” and “incorrect” for correct and error responses).
Timing of fMRI Experiment
The timing of the sequence of trials was triggered from the MRI control every 10 s. The trials started with a variable oversampling interval of 0, 500, 1000 or 1500 ms to obtain an interpolated temporal resolution of 500 ms. During the variable oversampling interval a fixation cross was presented. Participants were asked to maintain fixation. Then one of the five cues was presented in the middle of the screen for 4800 ms (Figure 1 ). Cue presentation was followed by a jittered interval between 0 to 1500 ms in steps of 500 ms. The imperative stimulus (i.e., the moving dot pattern) was presented for 1500 ms and followed by 350 ms feedback.
The experiment consisted of 240 trials, plus 24 null events that were pseudo-randomly interspersed. These null events – during which only a fixation cross was presented – were included to compensate for the overlap of the blood-oxygenation level dependent (BOLD) response between adjacent trials. The cues “R9” and “L9” were valid (i.e., correctly indicated the direction of movement for the upcoming stimulus) in 36 out of 40 trials, and the cues “R7” and “L7” were valid in 28 out of 40 trials. The neutral cue “N5” was followed by a rightward moving stimulus in 40 out of 80 trials. The experiment lasted about 40 min. For each participant, the experiment started out with two dummy trials (i.e., 10 scans) that were excluded from further analysis – this was done to prevent saturation effects.
Behavioral Session for the Estimation of Cue-Induced Bias
Two days prior to the scanning session, each participant performed the task outside the MRI scanner for about 40 min. This was done in order to acquire sufficient data for the reliable estimation of cue-induced bias parameter using the Linear Ballistic Accumulator (LBA) model described below. The trial timing of the task for this behavioral session was modified to maximize the number of observations, i.e., the cue-stimulus interval was set to 500 ms and there was no variable jitter at the beginning of the trial. Moreover, cue and stimulus were each presented for 1000 ms and no null events were interspersed. The behavioral session featured a total of 840 trials; The cues “R9” and “L9” were valid (i.e., correctly indicated the direction of movement for the upcoming stimulus) in 126 out of 140 trials, and the cues “R7” and “L7” were valid in 98 out of 140 trials. The neutral cue “N5” was followed by a rightward moving stimulus in 140 out of 280 trials.
Linear Ballistic Accumulator Model
We analyzed the behavioral data using a mathematical model for cognitive decision making, the Linear Ballistic Accumulator (LBA; Brown and Heathcote, 2008 ; Ho et al., 2009 ). The LBA model is conceptually similar to LATER (Linear Approach to Threshold with Ergodic Rate; Carpenter, 1981 , 2004 ; Carpenter and Reddi, 2001 ; Ali et al., 2006 ; Nakahara et al., 2006 ), a model for saccadic latencies that has been successfully applied to the effects of urgency, probability, and stimulus difficulty in perceptual inference. The LBA shares the same basic assumptions about decision making with many leading models from the field, most notably with those models that are variants of the “leaky competing accumulator” framework (Usher and McClelland, 2001 ). Here, we use the LBA model for two purposes: to check that our experimental manipulation had the intended effect on cognitive processes; and as a measurement model, to index the effect size induced by experimental manipulations for each subject. We could have used any other of the many decision models from mathematical psychology for these purposes, but chose the LBA because of its analytic simplicity – this model provides a complete description of benchmark decision phenomena, yet is sufficiently simple to support easy computational application. We have some confidence that the conclusions we would have drawn using another decision model than the LBA would not have been very different. For example, Donkin et al., submitted showed that the conclusions drawn from data using the LBA in experiments like ours are very similar from conclusions drawn using the most prolific decision making theory, the diffusion model (Ratcliff, 1978 ).
The LBA model represents the decision process in our task – between two response options – as a race between two independent accumulators, illustrated in the top row of Figure 2 . Recall that each time participants were presented with a random dot stimulus, one of the two response options was cued. In the model, on each trial the two accumulators begin with random activation values drawn from independent uniform distributions on [0, A]. After the stimulus is presented, activation increases in each accumulator at a rate that depends on the stimulus. For example, activation will generally increase quickly in the accumulator that corresponds to the correct response (left, in the example from the figure), but slowly in the accumulator that corresponds to the incorrect response (right). From one trial to the next, the rate with which activation increases is governed by a normal distribution. A response is triggered whenever the first accumulator reaches the response threshold b. Thus, for any decision the observed response time is directly related to the time that the accumulators require to reach the threshold.
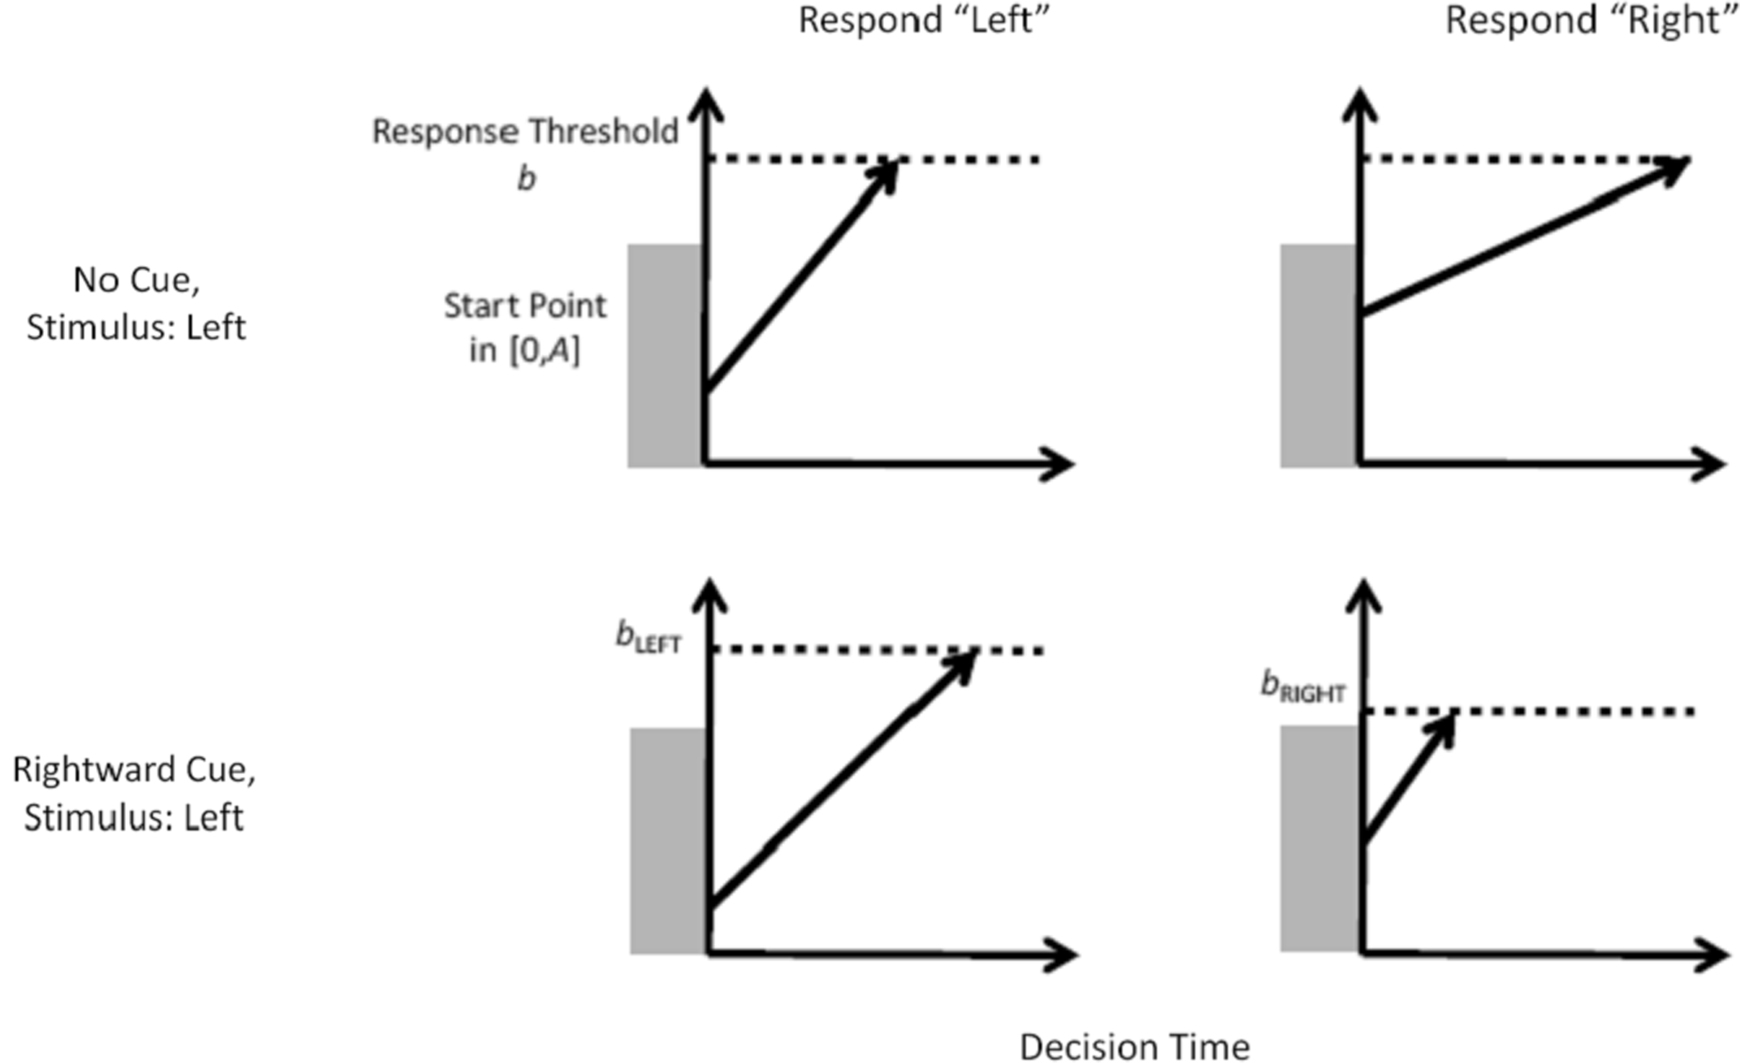
Figure 2. The linear ballistic accumulator model and how it accounts for the effect of prior information. In the LBA model, the decision to respond either “left” or “right” is modeled as a race between two accumulators. For an unbiased decision (top row) activation in each accumulator begins at a random point between zero and A and increases at a rate that depends on the match between the stimulus and response. For every single decision the rate is fixed (i.e., the accumulation process is deterministic), but from one decision to the next the rate fluctuates according to a normal distribution. A response is given by whichever accumulator first reaches the threshold b (i.e., the horizontal dotted line), and the predicted response time depends on the time taken to reach that threshold. For a biased decision (bottom row), the accumulator corresponding to the cued response uses a lower response threshold than the other accumulator (bright < bleft).
One way by which the LBA model can account for the biasing effect of prior information is by changing response thresholds, as shown in the bottom row of Figure 2 . Suppose the cue indicates that the correct response is likely to be “right”, then the corresponding accumulator is biased by setting the response threshold (b) lower, and hence closer to the top of the start point distribution (A). In the example, the response threshold for the cued response (“right”) is set at bright, while that for the uncued response (“left”) is set at bleft. By choosing bright < bleft, the accumulator for the cued response “right” will, on average, begin closer to the response threshold than the accumulator for the uncued response “left”. This leads the model to predict that responses are faster, and more frequent, when they are cued than when they are not.
Bayesian Information Criterion Model Selection for the LBA Model
The LBA model has five parameters that determine its predictions for a pair of correct and incorrect response time distributions. However, constraint can be gained by fixing many of these parameters across different experimental conditions. For example, in the current experiment, one might hope that accumulation rate is unaffected by cue manipulations, as these do not change the stimulus content. Similarly, one might suspect that the time taken for non-decision processes will be smaller for cued responses than for uncued responses, due to effects such as motor preparation and perceptual priming. To test such assumptions more formally, we implemented 192 different designs for constraining parameters across the two experimental manipulations of cue status and cue reliability. These 192 designs consisted of factorial combinations of almost all parameter constraints. We tested designs where three of the parameters (b, A, and non-decision time t0) varied with either cue direction, or cue reliability, or both, or neither. This created 64 different designs for parameter constraints. For each of those designs, we tested three further versions: one version with the mean and variability of accumulation rate (d and s) were held constant across all conditions; one version where they were allowed to vary with cue direction, and one where they were allowed to vary with cue reliability.
We estimated the individual LBA model parameters using the method of quantile maximum products (QMP, Heathcote and Brown, 2004 ). After obtaining parameter estimates, for each participant, Bayesian Information Criterion (BIC) values were calculated and summed (Schwarz, 1978 ). The summed BIC value allowed us to identify which set of parameter constraints provided the best description of the data (in total across subjects). This tests whether the experimental manipulation had the intended effect (i.e., to bias decisions) and also did not have other, unintended effects (e.g., influencing the rate at which information is extracted from the stimulus).
Magnetic Resonance Imaging Scanning Procedure
The experiment was carried out on a 3-T scanner (Medspec 30/100, Bruker, Ettlingen, Germany). We acquired 26 axial slices (19.2 cm field of view, 64 × 64 matrix, 4 mm thickness, 1 mm spacing) parallel to the AC-PC plane and covering the whole brain. Slice gaps were interpolated to generate output data with a spatial resolution of 3 × 3 × 3 mm. We used a single shot, gradient recalled echo planar imaging (EPI) sequence (repetition time 2000 ms, echo time 30 ms, 90° flip-angle). Prior to the functional runs, 20 anatomical MDEFT slices and 20 corresponding EPI-T1 slices were acquired. Stimuli were displayed using VisuaStim (Magnetic Resonance Technologies, Northridge, USA), consisting of two small TFT-monitors placed directly in front of the eyes, simulating a distance to a normal computer screen of about 100 cm with a resolution of 1024 × 768 and a refresh rate of 60 Hz.
Functional Magnetic Resonance Analyses
Analyses of fMRI data were performed using the in-house LIPSIA software (Lohmann et al., 2001 ). First, functional data were corrected for movement artifacts. The temporal offset between the slices acquired in one scan was then corrected using a sinc interpolation algorithm. Data were spatially smoothed using a spatial Gaussian filter with sigma = 0.8 (this refers to a FWHM = 5.65 mm). A temporal high-pass filter with a cutoff frequency of 1/160 Hz was used for baseline correction of the signal. All functional data sets were individually registered into three-dimensional (3D) space using the participants’ individual high-resolution anatomical images. This 3D reference data set was acquired for each participant during a previous scanning session. The two-dimensional anatomical MDEFT slices, geometrically aligned with the functional slices, were used to compute a transformation matrix containing rotational and translational parameters that register the anatomical slices with the 3D reference T1 data set. These transformation matrices were normalized to the standard Talairach brain size (Talairach and Tournoux, 1988 ) by linear scaling and finally applied to the functional data.
Observational data were modeled using the general linear model for serially autocorrelated observations (Friston et al., 1995 ). In order to ensure that our activations are cue-induced, and not partly attributable to systematic differences in stimulus or response, we used the following set of regressors: cue reliability (reliable, moderate, neutral), cue direction (left, right: only for reliable and moderate cues), null events, stimulus left and response left, stimulus right and response right. In addition, we included incorrect responses (i.e., stimulus left and response right and stimulus right and response left) as a single regressor – this was necessary because some participants had low error rates. The design matrix was generated using a synthetic hemodynamic response function comprised of a sum of Gamma functions (Friston et al., 1998 ; Glover, 1999 ) and its first derivative. The onsets for the event-related analysis were set to the presentation of the cues at the beginning of each trial. The model equation (including observational data, design matrix, and error term) was convolved with a Gaussian kernel with a dispersion of 4s FWHM in order to account for the serial autocorrelation of the data and determine the degrees of freedom for the subsequent statistical analysis.
Contrast maps were generated for each participant after the individual data sets were all aligned to the same stereotactic reference space. Importantly, to the individual contrast maps we added a covariate, namely the LBA estimate for the individual difference in cue-induced response bias (see the section below on “LBA Model Fit to the Behavioral Data” for details). This covariate was entered at the second level of the random-effects model.
A one-sample t-test of contrast maps across participants (random-effects model) was computed for statistical evaluation to ascertain whether observed differences between conditions were significantly different from zero. Subsequently, t values were transformed into z-scores. To correct for false-positive results, in a first step, an initial voxelwise z-threshold was set to Z = 2.3 (p = 0.001, uncorrected) for the reliable vs. neutral, moderate vs. neutral and reliable vs. moderate covariance contrasts. In a second step, the results were corrected for multiple comparisons using cluster-size and cluster-value thresholds obtained by Monte-Carlo simulations using a significance level of p = 0.05 (Table 1 ).
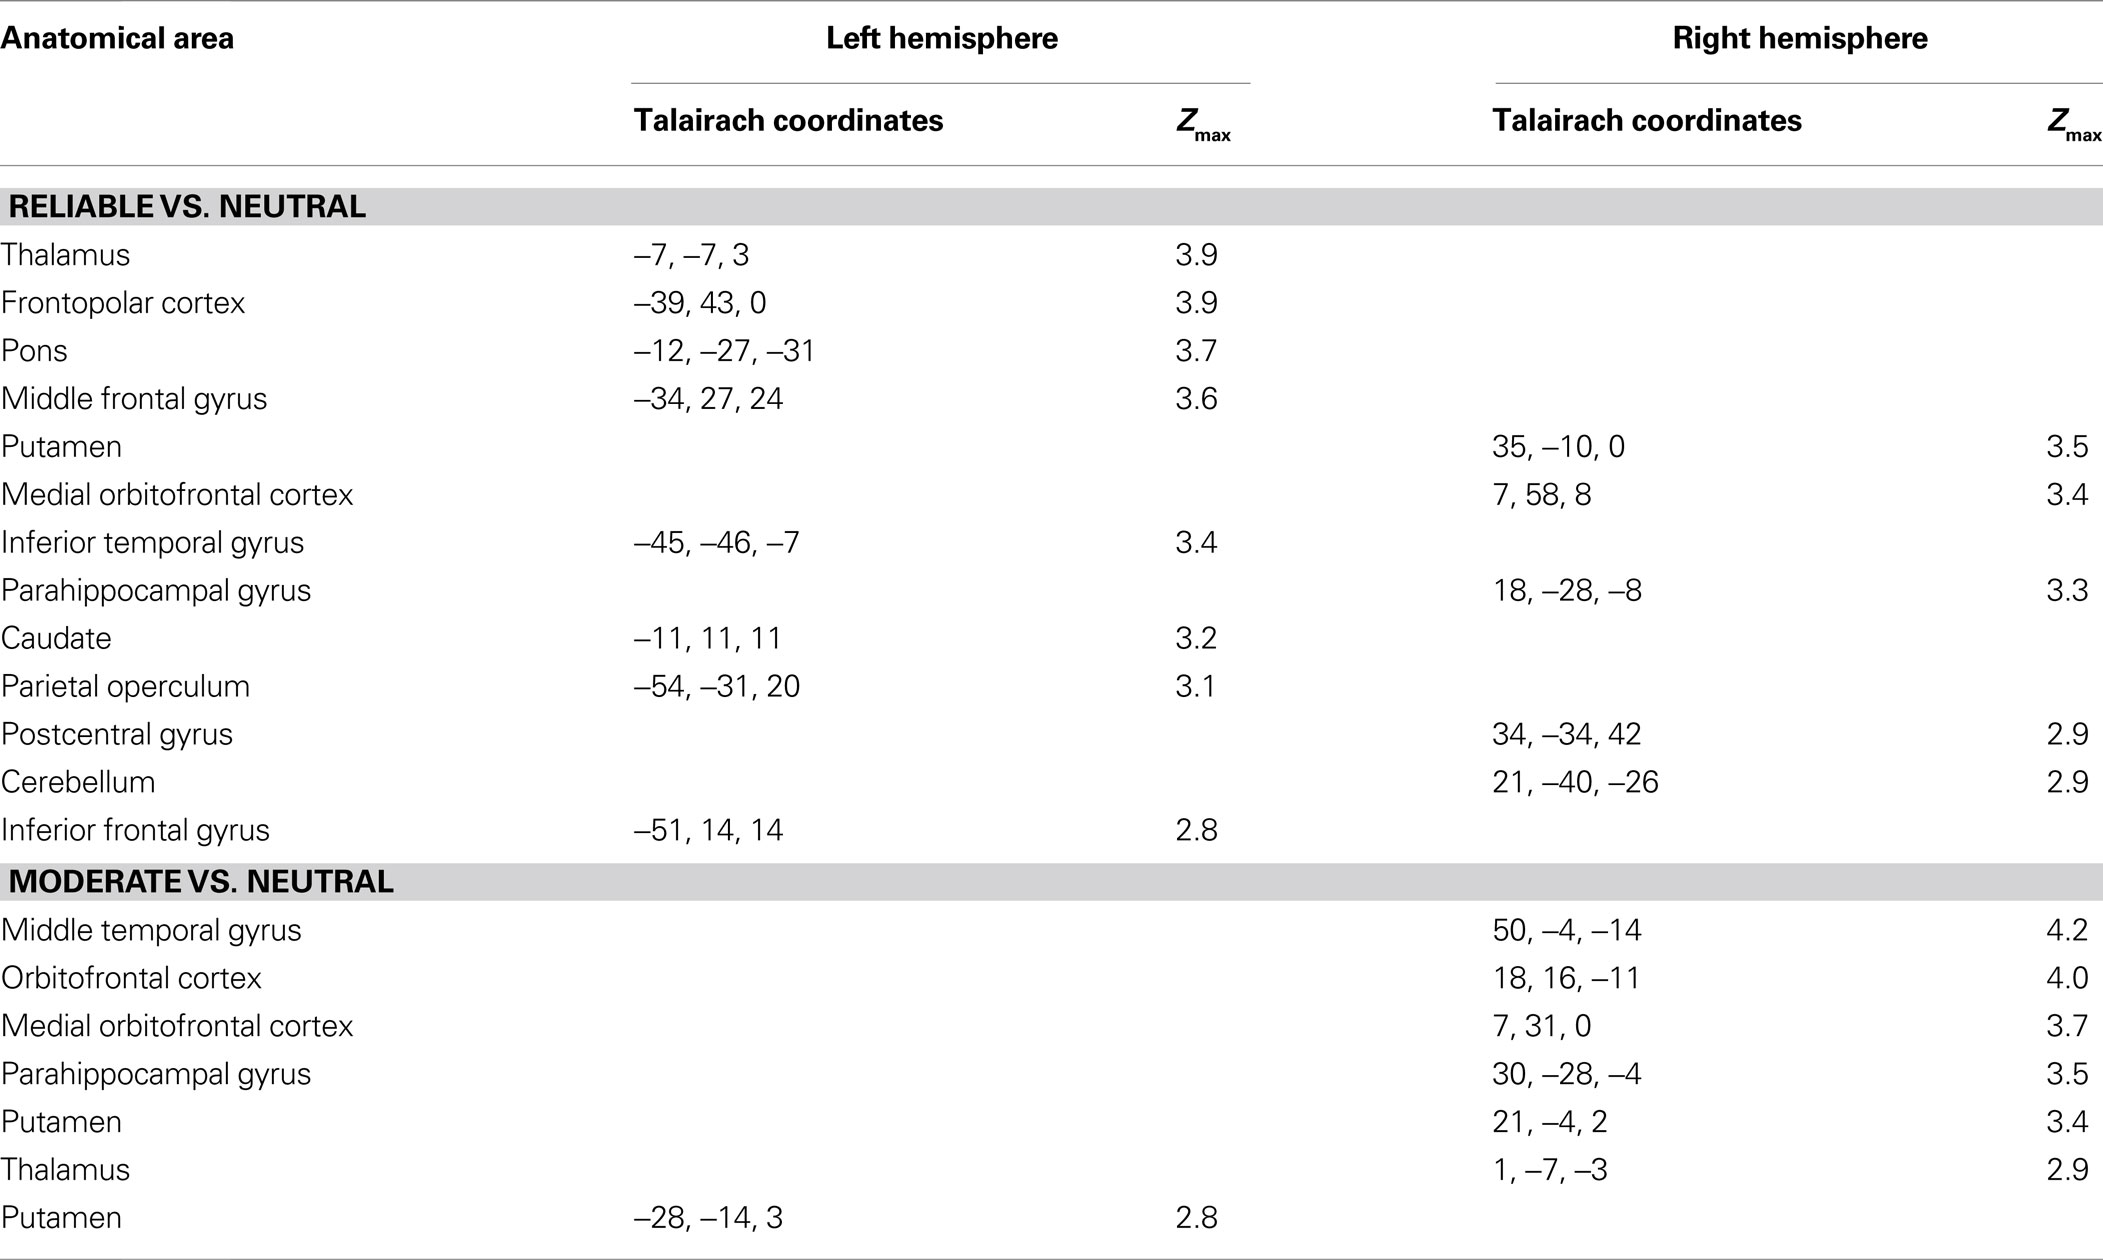
Table 1. Anatomical location and Talairach coordinates with Z > 2.3 (p < 0.05, corrected) for the whole-brain covariance analyses for the contrasts reliable vs. neutral and moderate vs. neutral. Activations with a minimum volume size of 180 mm3 are shown. No significant activations were found for the whole-brain contrast Reliable vs. Moderate or any of the reversed contrasts.
Finally, to investigate the neural substrates of setting cue-induced response bias common to both reliable vs. neutral and moderate vs. neutral, the corrected z-maps were included in a conjunction analysis, i.e., reliable vs. neutral and moderate vs. neutral (Nichols et al., 2005 ). This procedure allows us to conclude that the reported activations are significantly different at p < 0.05, corrected for multiple comparisons at the cluster level. To test for lateralization effects in the right and left putamen, beta values were extracted from a sphere with a 3 mm radius. The spheres were centered on the peak coordinate of the whole-brain conjunction analysis, i.e., reliable vs. neutral and moderate vs. neutral. Finally, the effect of lateralization was quantified by a two-way interaction between cue (i.e., rightward and leftward) and region (right hemisphere and left hemisphere) in a repeated measures ANOVAs conducted on individual beta values weighted by the LBA estimates for cue-induced response bias parameters.
Results
Behavioral Data
Figure 3 summarizes the behavioral data. We obtained the expected bias pattern of results (Edwards, 1965 ; Carpenter and Williams, 1995 ; Bogacz et al., 2006 ; Nakahara et al., 2006 ; Wagenmakers et al., 2008 ): compared to a neutral cue, reliable and moderate cues help performance (i.e., decrease mean response time – RT – and error rate) when they are valid (i.e., when they correctly predict the direction of movement), and hurt performance when they are invalid. Note that the biasing effect is about equally large for reliable cues and moderate cues. This is confirmed by the formal model analyses, and motivates the fMRI conjunction analysis presented later, as in Forstmann et al. (2008) .
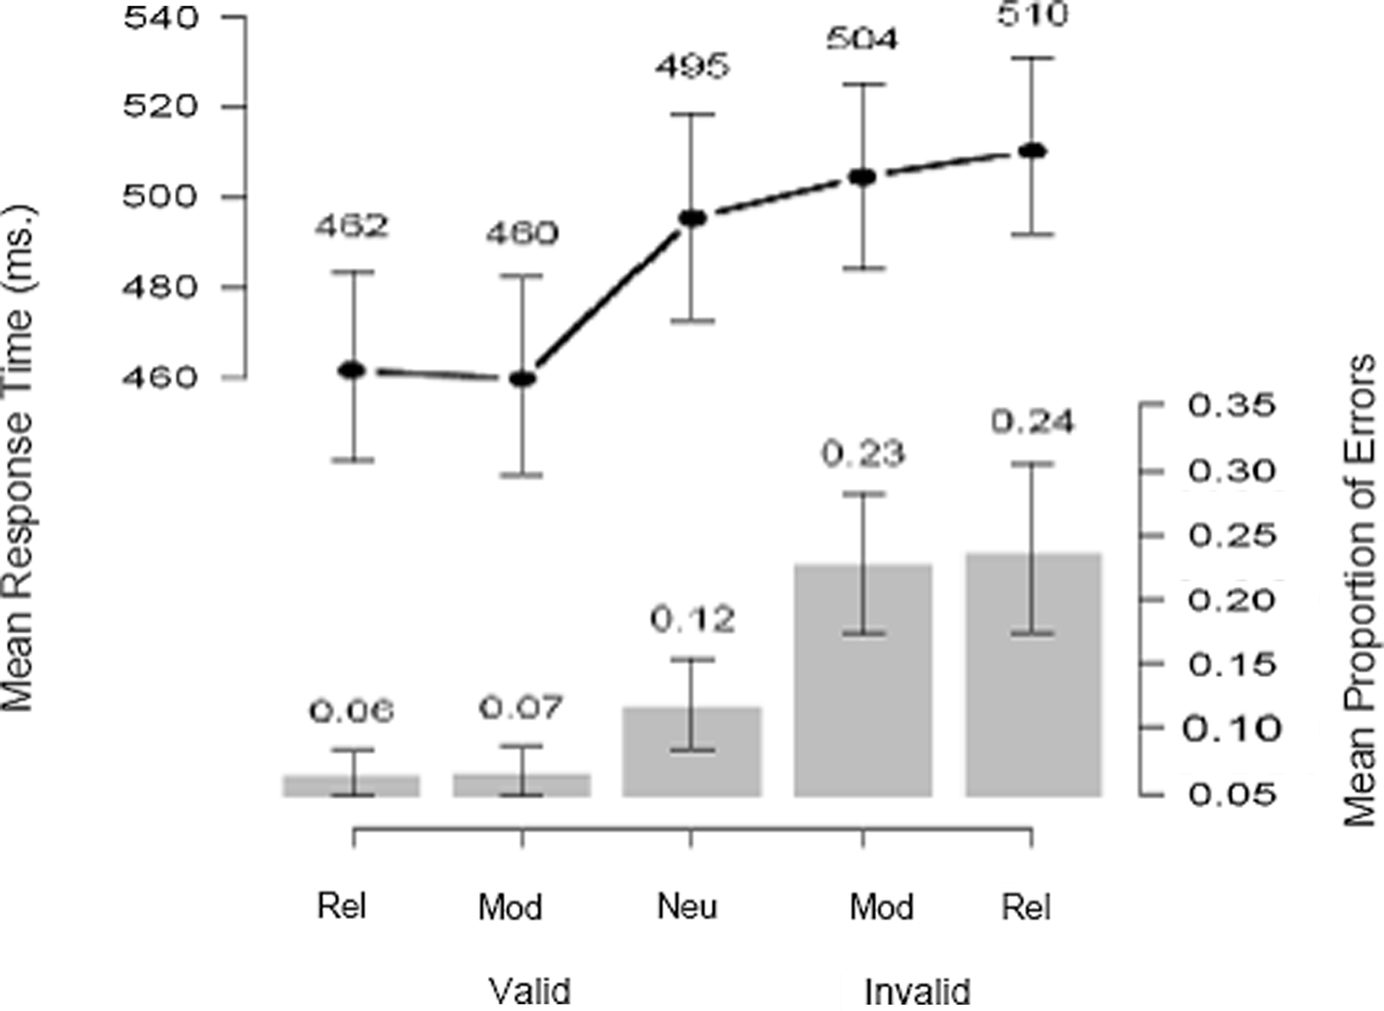
Figure 3. Probabilistic cues affect mean response time and accuracy. Compared to a neutral cue, reliable and moderate cues help performance (i.e., decrease mean RT and error rate) when they are valid (i.e., when they correctly predict the direction of movement), and hurt performance when they are invalid. Error bars denote 95% confidence intervals on the mean values, obtained by bootstrap resampling over participants.
LBA Model Fit to the Behavioral Data
In its most flexible form, the LBA model would have five parameters for each experiment condition; each of these parameters could plausibly be different between cued and uncued response accumulators, and for the three different levels of cue reliability. We tested 192 different ways of constraining these model parameters across conditions, estimating parameters separately for each constraint, and for each participant. From this, we chose the parameter constraints that provided the most suitable summary of the data, as judged by the summed BIC across participants (see Materials and Methods section for details). The best-BIC model was very simple – it was precisely the model illustrated in Figure 2 . This model assumed a constant value for all parameters across all conditions (for each participant), with just one exception: response bias was captured by allowing the response threshold to be lower in the cued than in the uncued direction. On average, the response threshold in the cued direction was bcued = 225 compared with buncued = 275 in the uncued direction (neutral trials had b = 256 for both responses). The average of the other model parameters were t0 = 315 ms, A = 220, d = 0.863 and s = 0.332. Note that some of the 192 designs we tested allowed parameters to vary with cue reliability (moderate vs. reliable) as well as with cue direction, but their extra complexity was deemed unnecessary by the BIC analyses – supporting the above observation that “moderate” and “reliable” cues were treated equally by our subjects.
To re-assure ourselves that the model parameter constraints with the best-BIC did not depend unduly on small perturbations due to noise, we checked the next four best-BIC designs as well. These next four models all differed from this best design in only minor ways (such as allowing cue effects on non-decision time), and also had BIC values similar to the best model but substantially better than the poorer models (from sixth best onwards). The ways in which the top four models differed from the best-BIC model included small effects of cue direction on the motor response time (t0), or by holding b constant and instead explaining response bias by changes in start point distribution A. The best-BIC model in the sum across participants was also the best-BIC model at an individual participant level for 11 of the 17 participants. For the other six participants, two had a null-effect best-BIC model (i.e., no effect of the cue), two had the second-best-BIC model from the average analyses, and the remaining two showed additional effects of the cue on non-decision time.
The best-BIC model identified above is very simple – just one parameter is changed to accommodate the experimental manipulation. To confirm that this restricted model still provided an adequate account of the data, Figure 4 plots the data (circles) against the predictions from this model (lines and crosses). In the figure, each distribution is summarized using five quantile estimates (the open circles) which estimate the associated cumulative distribution functions. For each distribution, the slowest (rightmost) symbol represents the 90% quantile – the response time below which 90% of the data fall. The next rightmost symbol represents the 70% quantile, the middle symbol represents the 50% quantile, which is just the median, and the leftmost symbols represent the 30% and 10% quantiles. Using these quantiles, and combining them with response accuracy information, creates “defective cumulative distribution” functions – just like a usual CDF, but one that rises not to an upper value of 1 but instead to the probability associated with that response in question. Defective cumulative distribution functions are commonly used in response time analysis (Ratcliff and Tuerlinckx, 2002 ). A didactic example can help to illustrate the plot, and its meaning.
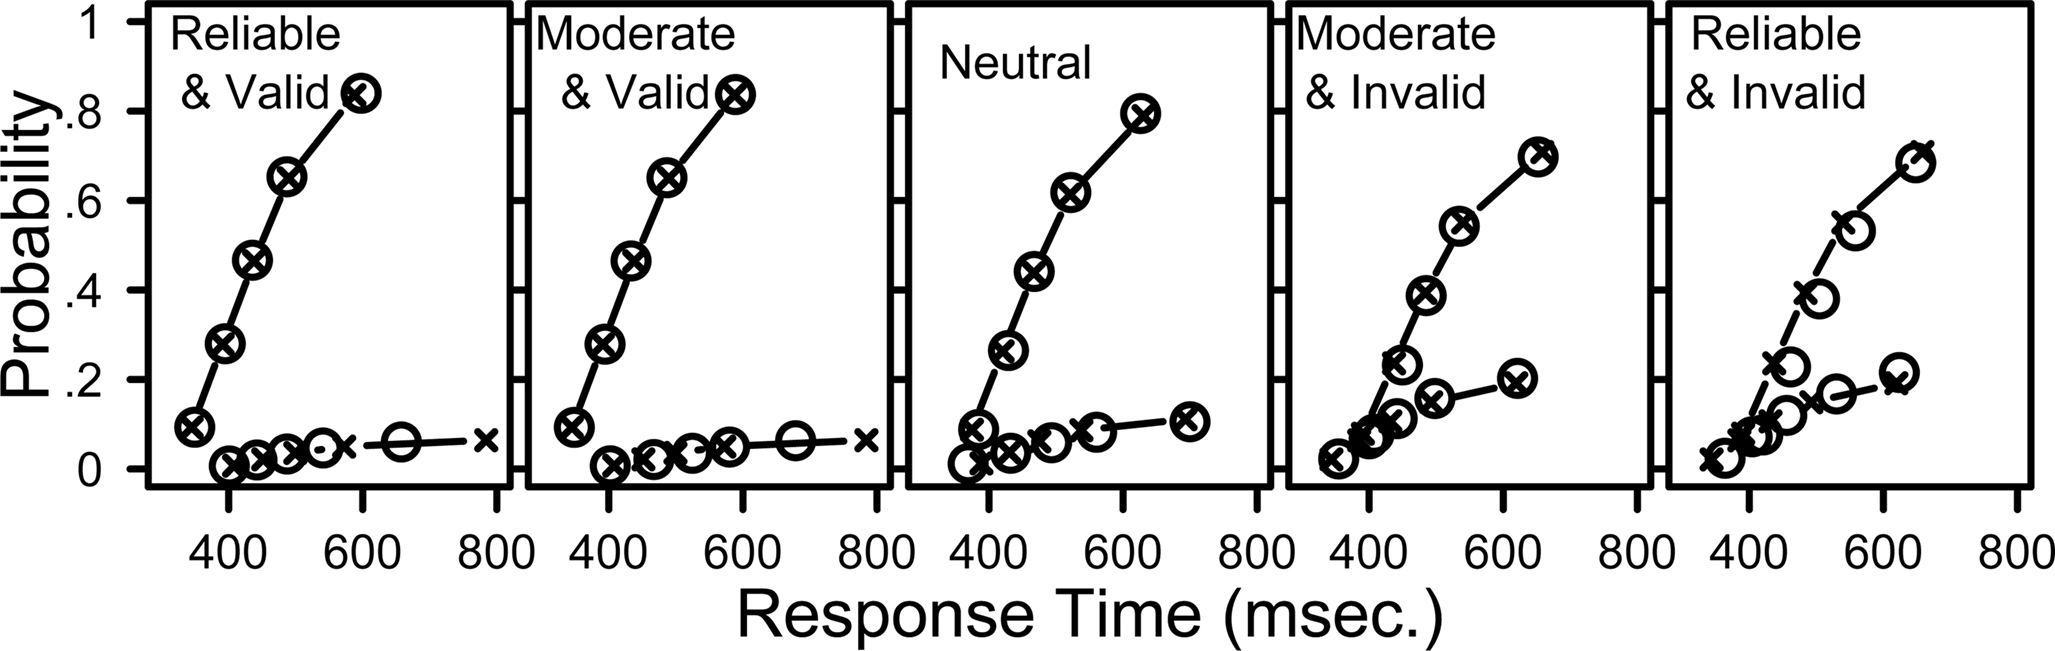
Figure 4. The LBA model provides a good fit to distributions of response times for correct and incorrect responses. Response time quantiles estimated from data (circles) and fit by the LBA model (crosses with lines). The five panels show data from different cue-target conditions. Labels Reliable, Moderate, and Neutral indicate the strength of the probabilistic prior information (i.e., 90% for “R9” and “L9”, 70% for “R7” and “L7”, and 50% for “N5”). Valid cues predicted the direction of movement correctly and invalid cues did not. Within each panel, the upper set of lines and symbols show quantiles for correct responses, and the lower set shows quantiles for incorrect responses. The data and model predictions were averaged across participants and across leftward and rightward stimulus directions.
Within each panel, the x-axis shows the response time for the quantile estimates, and the y-axis shows the associated proportion of data. For example, in the left panel (for data from trials with reliable and valid cues) the 50% quantile (median) for correct responses was 435 ms. Overall accuracy in that condition was 93.3%. Half of the correct response times fall below the 50% quantile, therefore 46.7% of all response times fall below this value, so the data point is plotted at (x = 435, y = 0.467).
Figure 4 provides much more detail about the behavioral data than other methods of graphing the data, such as using mean RT or even showing independent distributions for correct and incorrect responses. For example, the RT distributions for incorrect responses in the valid cue conditions are slower than their associated correct RT distributions, but this is reversed in the invalid cue conditions, where incorrect responses are faster than correct responses. The LBA model provides a good fit to all of these patterns, as well as capturing error rates, mean RT, and the distribution shapes in all cueing conditions. The predicted response probabilities are within 2.7% of the observed values for all conditions, and the predicted response quantiles for correct responses are always within 29 ms of the observed quantiles. The model performs especially well for conditions that contain many observations. For conditions with fewer observations the model fit decreases – the two leftmost panels show that the model overestimates the 0.9 quantile of the error distribution.
In sum, application of the LBA model confirmed that the behavioral effects of the probabilistic cues can be captured exclusively by selective changes or bias in the response threshold, as is visualized in Figure 2 . This is important, because, in the analysis of the fMRI data (presented next) we used the LBA as a measurement tool, to quantify the size of the biasing effect induced by the experimental manipulation for each individual subject; this measurement relied on individual estimates for the response threshold parameter.
fMRI Data: The Effect of Cue Reliability
In the analysis of the fMRI data, we first quantified the effect of cue reliability by computing two contrasts: reliable cues vs. neutral cues and moderate cues vs. neutral cues. Details of the two contrasts are provided in Table 1 . Importantly, each of these two contrasts was computed in the presence of a covariate, i.e., the difference in individual LBA estimates of response bias (e.g., [bi,uncued − bi,cued], where i indexes participants). The model parameters were estimated using data collected in the behavioral sessions, but fMRI data were collected in a different session. To re-assure ourselves that the participants did not react radically differently to the experimental manipulation during these two parts of the experiment, we compared parameter estimates from the behavioral session (described above) with parameters estimated using only those behavioral data collected during the fMRI scanning sessions. These fMRI parameter estimates were much more variable than those estimated from the behavioral sessions, because they were based on only one-quarter as many observations. Nevertheless, when we calculated the final index of experimental effect size ([bi,uncued − bi,cued]) separately for each subject using either behavioral-session data, or scanning-session data, these estimates correlated quite well (r = 0.58).
Figure 5 shows the conjunction of the two fMRI contrasts. Whereas in logic a conjunction is defined as an AND between truth statements, in neuroimaging a conjunction refers to activation caused by task X AND by task Y (Nichols et al., 2005 ; for a similar analysis see Forstmann et al., 2008 ). Thus, our conjunction analysis identifies those brain areas that are differentially active both in the reliable vs. neutral contrast and in the moderate vs. neutral contrast, with LBA bias incorporated as a covariate.
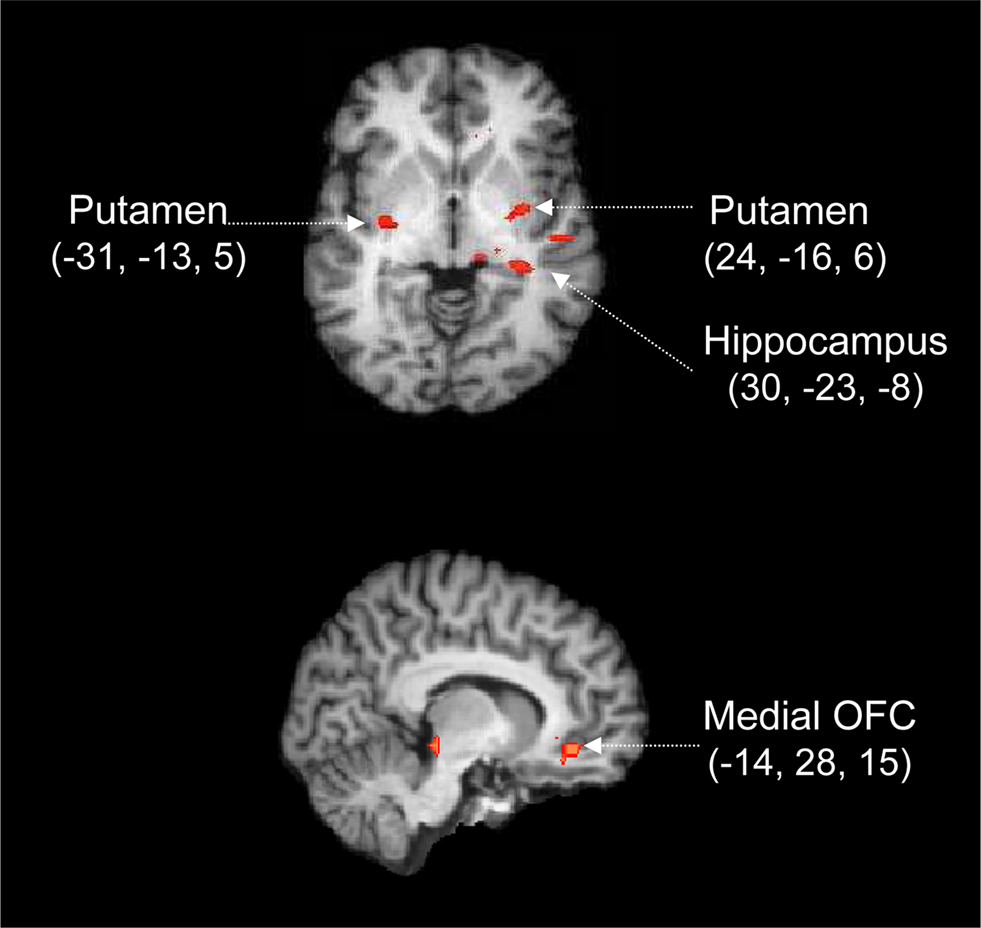
Figure 5. Cortico-subcortical circuit involved in the processing of prior information. Whole-brain activation map averaged over 17 participants and rendered onto an individual brain, using the change in LBA bias as a covariate. Red labels indicate positive Z values. The activations are calculated from a conjunction analysis, that is, they reflect the areas that are differentially active both in the contrast for reliable vs. neutral cues and in the contrast for moderate vs. neutral cues. Coordinates are given in Talairach space.
The conjunction analysis reveals focused activation in both cortical and subcortical areas (p < 0.05 for both individual contrasts, corrected for multiple comparisons at the cluster level). Specifically, Figure 5 shows that compared to a neutral cue, the presentation of moderate and reliable cues was accompanied by activation in OFC, hippocampus, and bilateral putamen. Note that these fMRI contrasts are based on the activation elicited by the cue, which means that the focus is entirely on preparatory processes initiated by the presentation of the probabilistic cue. The later processes initiated by the presentation of the stimulus are not of interest here.
The most parsimonious explanation of the conjunction analysis is that abstract information from the cue is first analyzed and interpreted (e.g., in terms of past and future consequences, and affective value) by the hippocampus-OFC system, a system that subsequently biases the putamen in order to facilitate the execution of the more probable response. We elaborate on this explanation in the section “Discussion”.
We should stress that the areas shown in Figure 5 can be identified only after adding the individual LBA estimates of bias as a covariate. Without the LBA bias estimate as a covariate, there is no cue-induced BOLD activation that survives statistical scrutiny, despite profound cue-induced differences in observed behavior. The covariate is helpful because it takes into account individual differences in the latent processes of interest. That is, some participants reacted much more effectively to the cue manipulation than others, but these differences would ordinarily be invisible to the fMRI analyses; instead this variability would be included in analysis’ error variance terms. Using the LBA parameters as covariates allows this variance to be partitioned out, providing a better estimate of the effects of the experimental manipulation on the fMRI data.
In sum, our results show that prior information about the direction of the upcoming stimulus leads to activation the OFC, the hippocampus, and the bilateral putamen. The latter effect is further analyzed in the next section.
fMRI Data: The Effect of Cue Direction
The bilateral pattern of activation in the putamen suggests the possibility that the activation in this structure is sensitive to the direction suggested by the cue. We again carried out a conjunction analysis (reliable vs. neutral and moderate vs. neutral) and separately assessed activation elicited from leftward and rightward cues.
The outcome of this analysis is presented in Figure 6 , which shows contralateral activation: presentation of a leftward cue induces activation preferentially in the right putamen, and presentation of a rightward cue induces activation preferentially in the left putamen, F(1,16) = 5.35, p = 0.03.
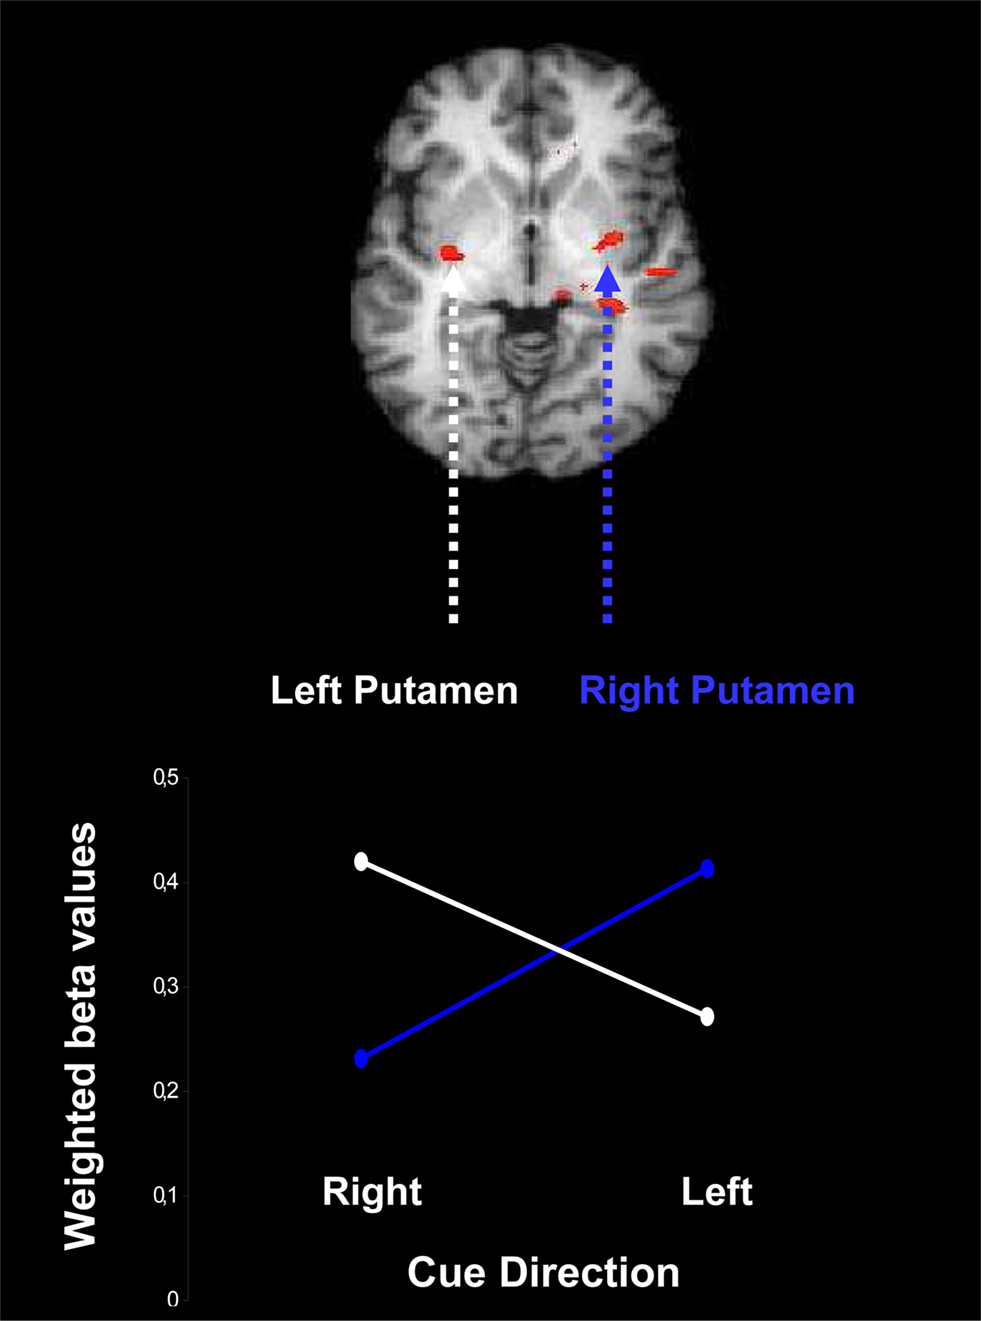
Figure 6. Contralateral activation of the putamen due to presentation of a probabilistic cue for rightward and leftward movement of an upcoming stimulus. Weighted beta values are based on the conjunction of areas active both in the contrast for reliable vs. neutral cues and in the contrast for moderate vs. neutral cues, separately for leftward cues and rightward cues. The beta values are weighted by the change in cue-induced individual bias parameters estimated from the LBA model.
As in the other fMRI analyses, the contralateral pattern of activation is only statistically reliable when the LBA bias parameter is included as a covariate.
Discussion
Our findings suggest that the impact of prior information on perceptual decision making is mediated by both cortical and striatal structures. This result is generally consistent with the idea that that the information from the cue is first processed by cortical areas (e.g., OFC, as in Ikeda et al., 1996 ); once these areas begin to favor a particular course of action, they send excitatory input to the striatum (e.g., putamen) which in turn suppresses the output nuclei of the basal ganglia, thereby releasing from inhibition several brain structures such as the thalamus and (pre)motor areas (Mink, 1996 ; Leh et al., 2007 ). Thus, the hippocampus, OFC, and putamen – activated here upon presentation of the probabilistic cue – can be seen as part of an action-selection circuit involved in motor preparation and cognitive control. We now turn to a more detailed discussion of the individual areas identified in the present work.
Putamen
Our results show that the prior presentation of probabilistic information leads to the contralateral activation of the dorsolateral putamen, a brain structure involved in motor planning (e.g., Alexander and Crutcher, 1990 ; Jaeger et al., 1993 ). Contralateral activation of the putamen has also been reported in other work. For instance, Ouchi et al. (2002) conducted a PET study and found that, in contrast to patients with Parkinson disease (PD), healthy participants showed substantial dopamine release in the dorsal striatum contralateral to the execution of movement. Also, Kaasinen et al. (2000) reported that early PD patients showed an increase in dopamine D2 receptors for the putamen contralateral to the predominant symptoms. Furthermore, Karnath et al. (2002) found that left hemispheric neglect is associated with lesions in the right putamen, and Delmaire et al. (2005) found that dystonic subjects had altered somatotopic organization in the left putamen, contralateral to their affected hand. Finally, Gerardin et al. (2003) showed that hand movements activated the contralateral putamen more than the ipsilateral putamen.
The cue-induced contralateral activation of the putamen suggests that a probabilistic cue initiates the partial preparation of the most likely motor response. This is of theoretical interest because almost all formal models of speeded decision making assume that the role of prior information is to bias the starting value of a purely cognitive response selection process (Ratcliff and McKoon, 2008 ; Wagenmakers et al., 2008 ); the motor execution process is assumed to follow the cognitive process only after a complete decision has been reached. Our results suggest that this serial-stage perspective is unlikely to be correct, and that response selection and motor preparation may proceed in a more cascaded fashion instead.
Hippocampus and OFC
In our study, the primary cortical control structures we identified are the hippocampus and the OFC. The hippocampus has strong reciprocal connections to the OFC (Ramus et al., 2007 ); in epileptic patients undergoing an intra-cranial EEG, for instance, electrical stimulations of the hippocampus evokes activation in the OFC (Catenoixa et al., 2005 ). The activation of hippocampus and OFC may therefore reflect the activation of a single system for anticipation, evaluation, and learning.
Specifically, Johnson et al. (2007) review the literature on rodent reinforcement learning and navigation and conclude that decision making involves a network of brain areas including hippocampus, OFC, and striatum. Johnson et al. (2007) further argue that the hippocampus is involved in prospection and projection, whereas the evaluation of this retrieved information occurs in OFC, and action selection occurs in ventral and dorsomedial striatum. This line of theorization is consistent with our account. Nevertheless, it should be mentioned that the OFC has no direct anatomical connections to the dorsolateral putamen, the part of the putamen that is known to be involved in preparatory motor activation; the OFC does have direct connections to the ventral part of the putamen (Draganski et al., 2008 , Figure 3 ), but this ventral part did not show differential activation in our study. One possibility is that the evaluative information encoded in OFC is relayed to the dorsolateral putamen in a sub-threshold fashion via other brain structures such as DLPFC, ACC, and pre-motor and motor areas. Another possibility is that the OFC activates the ventral putamen in a sub-threshold fashion, and the ventral putamen then activates the dorsolateral putamen.
The role of the hippocampus in learning and the development and adjustment of conceptual knowledge is well-known (Adcock et al., 2006 ; Shohamy et al., 2008 ; Kumaran et al., 2009 ); in our particular paradigm, however, there appears to be no immediate need for learning – the cue signals the probability of the upcoming event, and earlier associations between cues and events are irrelevant once the cue information is deemed veridical. Nevertheless, the presentation of the cue is likely to automatically activate the associations with earlier events to link the visual information provided by the cue (i.e., “L9”) to the consequences experienced in the past. It is also possible that the hippocampus is directly involved in encoding information about conditional uncertainty and the probabilistic consequences of encountered events (Strange et al., 2005 ; Harrison et al., 2006 ). In this view, the hippocampus may mediate expectations in a probabilistic environment.
The OFC is a structure involved in reinforcement learning and the representation of value and reward (Schultz, 2004 ; Frank and Claus, 2006 ; Wallis, 2007 ). The OFC signals the “desirability of expected outcomes” (Schoenbaum and Roesch, 2005 ) and has also been found to reflect changes in reward contingencies (O’Doherty et al., 2003b ). In our experiment, the information from the cue does not signal reward directly; nevertheless, prior information about the upcoming stimulus decreases uncertainty and increases the probability of giving a correct answer, and this may constitute a more abstract form of reward, at least for humans. In other words, an informative cue such as “L9” (i.e., there is a 90% chance that the upcoming stimulus requires the “left” response) signals that the upcoming trial going to be easier than expected, information thought to be encoded by the OFC (e.g., Summerfield and Koechlin, 2008 ). Moreover, O’Doherty (2007) argues that the OFC is involved in adaptive decision making and the flexible control of behavior and that it encodes “signals that inform an individual about what action to take next” (O’Doherty, 2007 , p. 254). Finally, Ikeda et al. (1996) report that OFC activity in the period of uncertainty and anticipation that precedes the imperative stimulus.
The current discussion highlights that the precise role of the OFC-hippocampal system in the processing of prior knowledge is not yet fully understood; the present work does suggest that this system may encodes the consequences and affective value of the prior information. This knowledge can then be used to bias the putamen in order to facilitate the execution of the more probable response. We acknowledge that the OFC is only one of several cortical control structures that may respond to advance probabilistic information about the upcoming target; these other – more prominent – control structures include the pre-SMA (Mars et al., 2009 ), DLPFC (van Veen et al., 2008 ), and ACC (Botvinick et al., 2001 ; Ridderinkhof et al., 2004 ; Behrens et al., 2007 ). In the present experiment the activation of these structures did not exceed the threshold for reporting.
Concluding Comments
Our results shed more light on the neural substrate of decision making with prior information. Single-cell recordings in monkeys have generally focused on how relatively low-level brain areas encode prior information, but here we have shown that subcortical and higher-level cortical brain areas may be involved as well. The fMRI technology we used is ideally suited to identify a widely distributed network of brain areas, and this is what allowed us to discover cue-induced activation in OFC and hippocampus. However, the limited temporal resolution of fMRI makes it difficult to study the dynamics of the network and the flow of information; for this, other methods such as single-cell recordings are more appropriate.
We believe our result may generalize to decision making in other contexts. In particular, we expect the same mechanisms to be active whether the cue is explicit (e.g., “L9”) or learned via experience (e.g., a green dot is followed by a left-moving stimulus in 90% of the cases). In fact, the need for experience-based learning may increase the activation in the hippocampal-OFC system. It is currently an open question whether the same areas would be active in higher-level, non-perceptual decision making situations. To conclusively address this question requires an experiment in which the perceptual and semantic characteristics of the task are systematically varied.
It is important to note that our results have been obtained with the help of the LBA model, a computational model that seeks to capture the processes that are involved in making decisions (e.g., the build-up of perceptual evidence to a fixed threshold). It is remarkable that the manipulation of prior probability has such profound behavioral consequences, yet would have remained invisible in a standard fMRI analysis (unless, perhaps, many more participants were scanned). Only when the relevant LBA parameter was added as a covariate to the regression equation did the error variance decrease sufficiently for the interpretable pattern of activations to arise. This underscores the increasingly popular position that the mathematical modeling of latent cognitive constructs provides advantages for neuroimaging research (O’Doherty et al., 2003a , 2007 ; Daw et al., 2006 ; Dayan and Daw, 2008 ; Forstmann et al., 2008 ; Ho et al., 2009 ), advantages that are both theoretical and practical.
Conflict of Interest Statement
The authors declare that the research was conducted in the absence of any commercial or financial relationships that could be construed as a potential conflict of interest.
Acknowledgments
This work was supported by NIH grant R01 MH74457, by Cognition Pilot, Veni, and Vidi grants from the Netherlands Organization for Scientific Research, and by a Queen Elizabeth II Fellowship to Scott Brown (DP0878858). We thank Ruud Wetzels for his help in programming the moving dots task, Mandy Naumann for her assistance with the fMRI measurements, Dora Matzke for discussions about anatomy, and Lourens Waldorp for his advice on the fMRI analyses.
References
Adcock, R. A., Thangavel, A., Whitfield-Gabrieli, S., Knutson, B., and Gabrieli, J. D. E. (2006). Reward-motivated learning: mesolimbic activation precedes memory formation. Neuron 50, 507–517.
Alexander, G. E., and Crutcher, M. D. (1990). Preparation for movement: neural representations of intended direction in three motor areas of the monkey. J. Neurophysiol. 64, 133–150.
Ali, F. R., Michell, A. W., Barker, R. A., and Carpenter, R. H. S. (2006). The use of quantitative oculometry in the assessment of Huntington’s disease. Exp. Brain Res. 169, 237–245.
Basso, M. A., and Wurtz, R. H. (1997). Modulation of neuronal activity by target uncertainty. Nature 389, 66–69.
Basso, M. A., and Wurtz, R. H. (1998). Modulation of neuronal activity in superior colliculus by changes in target probability. J. Neurosci. 18, 7519–7534.
Basso, M. A., and Wurtz, R. H. (2002). Neuronal activity in substantia nigra pars reticulata during target selection. J. Neurosci. 22, 1883–1894.
Behrens, T. E. J., Woolrich, M. W., Walton, M. E., and Rushworth, M. F. S. (2007). Learning the value of information in an uncertain world. Nat. Neurosci. 10, 1214–1221.
Bestmann, S., Harrison, L. M., Blankenburg, F., Mars, R. B., Haggard, P., Friston, K. J., and Rothwell, J. C. (2008). Influence of uncertainty and surprise on human corticospinal excitability during preparation for action. Curr. Biol. 18, 775–780.
Bogacz, R., Brown, E., Moehlis, J., Holmes, P., and Cohen, J. D. (2006). The physics of optimal decision making: a formal analysis of models of performance in two-alternative forced choice tasks. Psychol. Rev. 113, 700–765.
Botvinick, M. M., Braver, T. S., Barch, D. M., Carter, C. S., and Cohen, J. D. (2001). Conflict monitoring and cognitive control. Psychol. Rev. 108, 624–652.
Britten, K. H., Shadlen, M. N., Newsome, W. T., and Movshon, J. A. (1992). The analysis of visual motion: a comparison of neuronal and psychophysical performance. J. Neurosci. 12, 4745–4765.
Brown, S. D., and Heathcote, A. J. (2008). The simplest complete model of choice reaction time: linear ballistic accumulation. Cogn. Psychol. 57, 153–178.
Carpenter, R. H. S. (1981). “Oculomotor procrastination,” in Eye Movements: Cognition and Visual Perception, eds D. F. Fisher, R. A. Monty, and J. W. Senders (Hillsdale, NJ: Lawrence Erlbaum), 237–246.
Carpenter, R. H. S. (2004). Contrast, probability, and saccadic latency: evidence for independence of detection and decision. Curr. Biol. 14, 1576–1580.
Carpenter, R. H. S., and Reddi, B. A. J. (2001). Deciding between the deciders: two models of reaction time may happily coexist. Nat. Neurosci. 4, 337.
Carpenter, R. H. S., and Williams, M. L. L. (1995). Neural computation of log likelihood in control of saccadic eye movements. Nature 377, 59–62.
Catenoixa, H., Magnin, M., Guénot, M., Isnarda, J., Mauguièrea, F., and Ryvlin, P. (2005). Hippocampal–orbitofrontal connectivity in human: an electrical stimulation study. Clin. Neurophysiol. 116, 1779–1784.
Churchland, M. M., Santhanam, G., and Shenoy, K. V. (2006). Preparatory activity in premotor and motor cortex reflects the speed of the upcoming reach. J. Neurophysiol. 96, 3130–3146.
Cisek, P., Crammond, D. J., and Kalaska, J. F. (2003). Neural activity in primary motor and dorsal premotor cortex in reaching tasks with the contralateral versus ipsilateral arm. J. Neurophysiol. 89, 922–942.
Crammond, D. J., and Kalaska, J. F. (2000). Prior information in motor and premotor cortex: activity during the delay period and effect on pre-movement activity. J. Neurophysiol. 84, 986–1005.
Daw, N. D., O’Doherty, J. P., Dayan, P., Seymour, B., and Dolan, R. J. (2006). Cortical substrates for exploratory decisions in humans. Nature 441, 876–879.
Dayan, P., and Daw, N. D. (2008). Decision theory, reinforcement learning, and the brain. Cogn. Affect. Behav. Neurosci. 8, 429–453.
Delmaire, C., Krainik, A., Tézenas du Montcel, S., Gerardin, E., Meunier, S., Mangin, J.-F., Sangla, S., Garnero, L., Vidailhet, M., and Lehéricy, S. (2005). Disorganized somatotopy in the putamen of patients with focal hand dystonia. Neurology 64, 1391–1396.
Dorris, M. C., and Munoz, D. P. (1998). Saccadic probability influences motor preparation signals and time to saccadic initiation. J. Neurosci. 18, 7015–7026.
Draganski, B., Kherif, F., Klöppel, S., Cook, P. A., Alexander, D. C., Parker, G. J. M., Deichmann, R., Ashburner, J., and Frackowiak, R. S. J. (2008). Evidence for segregated and integrative connectivity patterns in the human basal ganglia. J. Neurosci. 28, 7143–7152.
Edwards, W. (1965). Optimal strategies for seeking information: models for statistics, choice reaction times, and human information processing. J. Math. Psychol. 2, 312–329.
Forstmann, B. U., Dutilh, G., Brown, S., Neumann, J., von Cramon, D. Y., Ridderinkhof, K. R., and Wagenmakers, E.-J. (2008). Striatum and pre-SMA facilitate decision-making under time pressure. Proc. Natl. Acad. Sci. U.S.A. 105, 17538–17542.
Frank, M. J., and Claus, E. D. (2006). Anatomy of a decision: striato-orbitofrontal interactions in reinforcement learning, decision making, and reversal. Psychol. Rev. 113, 300–326.
Friston, K. J., Fletcher, P., Josephs, O., Holmes, A., Rugg, M. D., and Turner, R. (1998). Event-related fMRI: characterizing differential responses. Neuroimage 7, 30–40.
Friston, K. J., Holmes, A. P., Poline, J. B., Grasby, P. J., Williams, S. C., Frackowiak, R. S., and Turner, R. (1995). Analysis of fMRI time-series revisited. Neuroimage 2, 45–53.
Gerardin, E., Lehéricy, S., Pochon, J.-B., Tézenas du Montcel, S., Mangin, J.-F., Poupon, F., Agid, Y., Le Bihan, D., and Marsault, C. (2003). Foot, hand, face and eye representation in the human striatum. Cereb. Cortex 13, 162–169.
Glover, G. H. (1999). Deconvolution of impulse response in event-related BOLD fMRI. Neuroimage 9, 416–429.
Gold, J. I., and Shadlen, M. N. (2007). The neural basis of decision making. Annu. Rev. Neurosci. 30, 535–574.
Harrison, L. M., Duggins, A., and Friston, K. J. (2006). Encoding uncertainty in the hippocampus. Neural Netw. 19, 535–546.
Heathcote, A., and Brown, S. D. (2004). Reply to Speckman and Rouder: a theoretical basis for QML. Psychon. Bull. Rev. 11, 577–578.
Heekeren, H. R., Marrett, S., and Ungerleider, L. G. (2008). The neural systems that mediate human perceptual decision making. Nat. Rev. Neurosci. 9, 467–479.
Ho, T. C., Brown, S., and Serences, J. T. (2009). Domain general mechanisms of perceptual decision making in human cortex. J. Neurosci. 29, 8675–8687.
Ikeda, A., Lüders, H., Collura, T. F., Burgess, R. C., Morris, H. H., Hamano, T., and Shibasaki, H. (1996). Subdural potentials at orbitofrontal and mesial prefrontal areas accompanying anticipation and decision making in humans: a comparison with Bereitschaftspotential. Electroencephalogr. Clin. Neurophysiol. 98, 206–212.
Jaeger, D., Gilman, S., and Aldridge, J. W. (1993). Primate basal ganglia activity in a precued reaching task: preparation for movement. Exp. Brain Res. 95, 51–64.
Johnson, A., van der Meer, M. A. A., and Redish, A. D. (2007). Integrating hippocampus and striatum in decision-making. Curr. Opin. Neurobiol. 17, 692–697.
Kaasinen, V., Ruottinen, H. M., Någren, K., Lehikoinen, P., Oikonen, V., and Rinne, J. O. (2000). Upregulation of putaminal dopamine receptors in early Parkinson’s disease: a comparative PET study with [11C] Raclopride and [11C]N–Methylspiperone. J. Nucl. Med. 41, 65–70.
Karnath, H.-O., Himmelbach, M., and Rorden, C. (2002). The subcortical anatomy of human spatial neglect: putamen, caudate nucleus and pulvinar. Brain 125, 350–360.
Kim, J. N., and Shadlen, M. N. (1999). Neural correlates of a decision in the dorsolateral prefrontal cortex of the Macaque. Nat. Neurosci. 2, 176–185.
Kumaran, D., Summerfield, J. J., Hassabis, D., and Maguire, E. A. (2009). Tracking the emergence of conceptual knowledge during human decision making. Neuron 63, 889–901.
Leh, S. E., Ptito, A., Chakravarty, M. M., and Strafella, A. P. (2007). Fronto-striatal connections in the human brain: a probabilistic diffusion tractography study. Neurosci. Lett. 419, 113–118.
Lohmann, G., Mueller, K., Bosch, V., Mentzel, H., Hessler, S., Chen, L., Zysset, S., and von Cramon, D. Y. (2001). Lipsia – a new software system for the evaluation of functional magnetic images of the human brain. Comput. Med. Imaging Graph. 25, 449–457.
Mars, R. B., Klein, M. C., Neubert, F.-X., Olivier, E., Buch, E. R., Boorman, E. D., and Rushworth, M. F. S. (2009). Short-latency influence of medial frontal cortex on primary motor cortex during action selection under conflict. J. Neurosci. 29, 6926–6931.
Michelon, P., Vettel, J. M., and Zacks, J. M. (2006). Lateral somatotopic organization during imagined and prepared movements. J. Neurophysiol. 95, 811–822.
Mink, J. W. (1996). The basal ganglia: focused selection and inhibition of competing motor programs. Prog. Neurobiol. 50, 381–425.
Nagai, Y., Critchley, H. D., Featherstone, E., Fenwick, P. B. C., Trimble, M. R., and Dolan, R. J. (2004). Brain activity relating to the Contingent Negative Variation: an fMRI investigation. Neuroimage 21, 1232–1241.
Nakahara, H., Nakamura, K., and Hikosaka, O. (2006). Extended LATER model can account for trial-by-trial variability of both pre- and post-processes. Neural Netw. 19, 1027–1046.
Nichols, T., Brett, M., Andersson, J., Wager, T., and Poline, J.-B. (2005). Valid conjunction inference with the minium statistic. Neuroimage 25, 653–660.
O’Doherty, J. P. (2007). Lights, camembert, action! The role of human orbitofrontal cortex in encoding stimuli, rewards, and choices. Ann. N. Y. Acad. Sci. 1121, 254–272.
O’Doherty, J. P., Dayan, P., Friston, K., Critchley, H., and Dolan, R. J. (2003a). Temporal difference models and reward-related learning in the human brain. Neuron 28, 329–337.
O’Doherty, J., Critchley, H., Deichmann, R., and Dolan, R. J. (2003b). Dissociating valence of outcome from behavioral control in human orbital and ventral prefrontal cortices. J. Neurosci. 23, 7931–7939.
O’Doherty, J. P., Hampton, A., and Kim, H. (2007). Model-based fMRI and its application to reward learning and decision making. Ann. N. Y. Acad. Sci. 1104, 35–53.
Oldfield, R. C. (1971). The assessment and analysis of handedness: the Edinburgh Inventory. Neuropsychologia 9, 97–113.
Ouchi, Y., Yoshikawa, E., Futatsubashi, M., Okada, H., Torizuka, T., and Sakamoto, M. (2002). Effect of simple motor performance on regional dopamine release in the striatum in Parkinson disease patients and healthy subjects: a positron emission tomography study. Cereb. Blood Flow Metab. 22, 746–752.
Platt, M. L., and Glimcher, P. W. (1999). Neural correlates of decision variables in parietal cortex. Nature 400, 233–238.
Ramus, S. J., Davis, J. B., Donahue, R. J., Discenza, C. B., and Waite, A. A. (2007). Interactions between the orbitofrontal cortex and the hippocampal memory system during the storage of long-term memory. Ann. N. Y. Acad. Sci. 1121, 216–231.
Ratcliff, R., and McKoon, G. (2008). The diffusion decision model: theory and data for two-choice decision tasks. Neural. Comput. 20, 873–922.
Ratcliff, R., and Tuerlinckx, F. (2002). Estimating parameters of the diffusion model: approaches to dealing with contaminant reaction times and parameter variability. Psychon. Bull. Rev. 9, 438–481.
Ridderinkhof, K. R., Ullsperger, M., Crone, E. A., and Nieuwenhuis, S. (2004). The role of medial frontal cortex in cognitive control. Science 306, 443–447.
Riehle, A., and Requin, J. (1989). Monkey primary motor and premotor cortex: single-cell activity related to prior information about direction and extent of an intended movement. J. Neurophysiol. 61, 534–549.
Scheibe, C., Schubert, R., Sommer, W., and Heekeren, H. R. (2009). Electrophysiological evidence for the effect of prior probability on response preparation. Psychophysiology 46, 758–770.
Schoenbaum, G., and Roesch, M. (2005). Orbitofrontal cortex, associative learning, and expectancies. Neuron 47, 633–636.
Schultz, W. (2004). Neural coding of basic reward terms of animal learning theory, game theory, microeconomics and behavioural ecology. Curr. Opin. Neurobiol. 14, 139–147.
Shohamy, D., Myers, C. E., Kalanithi, J., and Gluck, M. A. (2008). Basal ganglia and dopamine contributions to probabilistic category learning. Neurosci. Biobehav. Rev. 32, 219–236.
Strange, B. A., Duggins, A., Penny, W., Dolan, R. J., and Friston, K. J. (2005). Information theory, novelty and hippocampal responses: unpredicted or unpredictable? Neural Netw. 18, 225–230.
Summerfield, C., and Koechlin, E. (2008). A neural representation of prior information during perceptual inference. Neuron 59, 336–347.
Talairach, J., and Tournoux, P. (1988). Co-Planar Stereotaxic Atlas of the Human Brain. Stuttgart: Georg Thieme Verlag.
Toni, I., Schluter, N. D., Josephs, O., Friston, K., and Passingham, R. E. (1999). Signal-, set- and movement-related activity in the human brain: an event-related fMRI study. Cereb. Cortex 9, 35–49.
Usher, M., and McClelland, J. L. (2001). On the time course of perceptual choice: the leaky competing accumulator model. Psychol. Rev. 108, 550–592.
Utter, A. A., and Basso, M. A. (2008). The basal ganglia: an overview of circuits and function. Neurosci. Biobehav. Rev. 32, 333–342.
van Veen, V., Krug, M. K., and Carter, C. S. (2008). The neural and computational basis of controlled speed-accuracy tradeoff during task performance. J. Cogn. Neurosci. 20, 1952–1965.
Wagenmakers, E.-J., Ratcliff, R., Gomez, P., and McKoon, G. (2008). A diffusion model account of criterion shifts in the lexical decision task. J. Mem. Lang. 58, 140–159.
Wallis, J. D. (2007). Orbitofrontal cortex and its contribution to decision-making. Annu. Rev. Neurosci. 30, 31–56.
Keywords: response bias, model-based fMRI, response time modeling, cortico-striatal circuit, putamen, orbitofrontal cortex
Citation: Forstmann BU, Brown S, Dutilh G, Neumann J and Wagenmakers E-J (2010) The neural substrate of prior information in perceptual decision making: a model-based analysis. Front. Hum. Neurosci. 4:40. doi: 10.3389/fnhum.2010.00040
Received: 17 December 2009;
Paper pending published: 24 February 2010;
Accepted: 21 April 2010;
Published online: 21 May 2010
Edited by:
Francisco Barceló, University of Illes Balears, SpainReviewed by:
Sven Bestmann, University College London, UKDaphna Shohamy, Columbia University, USA
Copyright: © 2010 Forstmann, Brown, Dutilh, Neumann and Wagenmakers. This is an open-access article subject to an exclusive license agreement between the authors and the Frontiers Research Foundation, which permits unrestricted use, distribution, and reproduction in any medium, provided the original authors and source are credited.
*Correspondence: Birte U. Forstmann, Spinoza Center for Neuroimaging, University of Amsterdam, Roetersstraat 15, 1018 WB Amsterdam, Netherlands. e-mail: b.u.forstmann@uva.nl