1
Department of Neuroscience, Baylor College of Medicine, One Baylor Plaza, Houston, TX, USA
2
Computational Psychiatry Unit, Baylor College of Medicine, One Baylor Plaza, Houston, TX, USA
3
Menninger Department of Psychiatry and Behavioral Sciences, Baylor College of Medicine, One Baylor Plaza, Houston, TX, USA
Although positive reward prediction error, a key element in learning that is signaled by dopamine cells, has been extensively studied, little is known about negative reward prediction errors in humans. Detailed animal electrophysiology shows that the habenula, an integrative region involved in many processes including learning, reproduction, and stress responses, also encodes negative reward-related events such as negative reward prediction error signals. In humans, however, the habenula’s extremely small size has prevented direct assessments of its function. We developed a method to functionally locate and study the habenula in humans using fMRI, based on the expected reward-dependent response phenomenology of habenula and striatum and, we provide conclusive evidence for activation in human habenula to negative reward prediction errors.
Learning from mistakes is a critical survival skill for all mobile creatures and requires the nervous system to generate predictions about plausible future outcomes within a given behavioral context. Detailed electrophysiological work has identified networks of neurons in the midbrain and diencephalon responsible for predicting the timing and valence (aversive or rewarding) of near-term outcomes during reward-dependent learning tasks (Montague et al., 2004
; Daw and Doya, 2006
). This prediction circuitry is complex and poorly understood, but it is now known to include midbrain dopamine neurons that encode reward prediction error signals (Montague et al., 1996
; Schultz et al., 1997
; Hollerman and Schultz, 1998
; Bayer and Glimcher, 2005
; Tobler et al., 2005
) and neurons in the lateral habenula that activate to negative prediction errors (Matsumoto and Hikosaka, 2007
, 2009
). The lateral habenular responses include activations when expected reward is not delivered or when unexpected punishment is received. Such signals may be one important source of negative reward prediction error inputs to the ventral tegmental area (VTA) since activity increases in lateral habenular neurons inactivate dopamine neurons in the VTA (Matsumoto and Hikosaka, 2007
, 2009
). In addition to signaling negative prediction errors, lateral habenular neurons also inactivate upon positive prediction error signals (Matsumoto and Hikosaka, 2007
), possibly providing a permissive signal for dopamine cells to increase firing during positive prediction error events. These exciting new findings in animal models have not been extended to human subjects primarily because of the difficulty of identifying the habenula in human subjects using existing imaging techniques.
Besides modulating reward, the habenula can influence sexual and feeding behavior, drug withdrawal, pain, and sleep (Klemm, 2004
; Hikosaka et al., 2008
; Salas et al., 2009
). Functional studies of the habenula in healthy humans can be performed only with non-invasive methods. Functional MRI (fMRI) and positron emission tomography (PET) imaging are available techniques but they are typically not suitable for the imaging of such small brain regions. Only two fMRI studies have explicitly reported habenular activation: Ullsperger and von Cramon (2003)
showed that a region that includes the habenula is activated by negative feedback in a goal prediction task and Shepard et al. (2006)
demonstrated a similar concept. Despite these successes, there are sizable variations in the exact location of the habenula; consequently, region-of-interest (ROI) analyses with ROIs defined using ordinary techniques cannot conclusively identify habenular responses. There are two main reasons why this claim is valid: (i) as a region of approximately 3 × 3 × 6 mm (e.g. see Brainmaps, www.brainmaps.org
), the habenula occupies only a handful of voxels in typical fMRI scans using 3 Tesla scanners, which use voxels that yield either 3 × 3 mm or 4 × 4 mm in-plane resolution. Therefore, the signal accessible from the habenula via fMRI is small and contaminated by nearby areas. (ii) A second complicating feature is that group analyses across multiple brains necessitate normalizing images to a brain template; a maneuver that leads to additional blurring of the signal from distinct areas.
In this paper, we arrive at a proper ROI study of the habenula by (i) imaging a smaller region of the brain at higher resolution, (ii) avoiding the signal-blurring steps of normalization and smoothing, and (iii) exploiting our knowledge of the response phenomenology expected of other easier-to-resolve brain areas. We show the first demonstration of habenular activity in humans during negative prediction error events, using a novel technique that can be adapted to study not only the habenula, but other small areas of the brain.
Conditioning Experiment
Our classical conditioning experiment is outlined in Figure 1
. Normal events used a 1-s duration yellow light followed 6 s later by 0.8 ml juice delivery (Figure 1
A). Catch events delayed juice delivery by 4 s. Functional imaging was restricted to a 4.4-cm slab as indicated in Figure 1
B using 2 mm by 2 mm in plane resolution. The experiment was divided into four separate sessions as indicated in Figure 1
C. This stimulus arrangement allowed us to identify habenula voxels in one session (run 1) and probe them in separate sessions (runs 3 and 4). Three important response features should occur during run 1 (Schultz et al., 1997
; Hollerman and Schultz, 1998
; Montague et al., 2004
; Bayer and Glimcher, 2005
). First, habenula neurons should give a negative-going response to the unexpected juice delivery. Second, dopamine neurons should give an activation response to the initially unexpected juice delivery. Third, there should be a learning effect where these two responses to the juice should begin to return to baseline and similar response profiles should develop at the time of the predictive cue (here the yellow light).
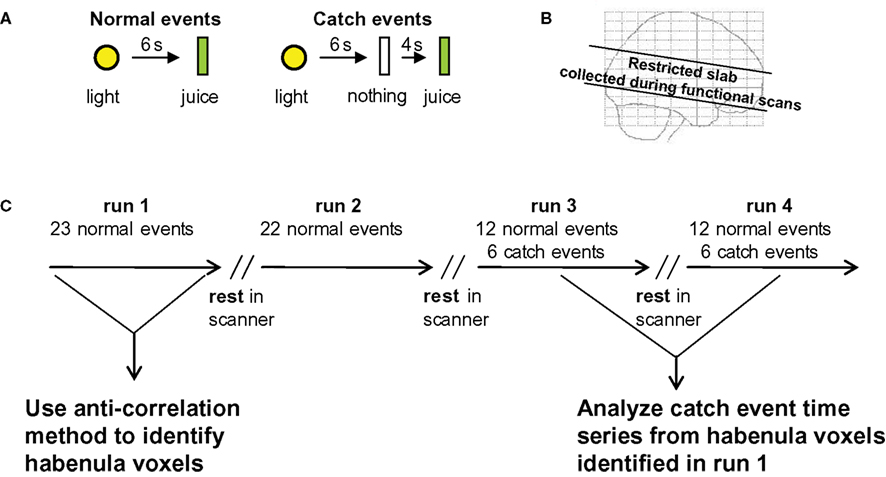
Figure 1. Experimental design. (A) Two basic behavioral probes were used – (1) normal events where a 1-s duration yellow light predicted the oral delivery of fruit juice (0.8 ml) 6 s later (normal event), and (2) the same stimuli but with the juice delivery delayed by an additional 4 s (catch event). (B) Functional scans were restricted to a 4.4-cm slab aligned along the anterior commissure-posterior commissure line using isotropic voxels (2 × 2 × 2 mm; TE = 40 ms, TR = 2 s, flip angle = 90°). (C) Four separate runs were carried out. 23 normal events in run 1, 22 normal events in run 2, 12 normal events and 6 catch events in run 3, and 12 normal events and 6 catch events in run 4 (the total number of catch events was kept low to avoid learning). During the periods labeled “rest”, functional imaging was halted and subjects (n = 50) were asked about comfort and their capacity to continue the task before imaging continued. No change in subject position occurred during rest periods. Run 1 was used to identify the habenula voxels using functional and anatomical criteria (see Figure 2
).
Scanning Procedure
The Baylor College of Medicine Institutional Review Board approved this experiment for human participants, which were recruited from the community. Written consent was obtained from all participants. Subjects were told that we were studying the way the brain process reward, and that they would see icons on a computer screen and receive juice in their mouth, but had no information about the cue-juice relationship. Fifty control subjects (all right handed, 18 males) were scanned in 3T Siemens Trio MR scanners. Subjects were first scanned with a 1 × 1 × 1 mm voxel structural sequence TE = 3.93 ms, TR = 2500 ms, flip angle = 12°, 256 × 256 matrix, 160 1 mm axial slices, followed by four functional sessions. Functional scans were restricted to a 4.4-cm slab aligned along the anterior commissure-posterior commissure line using isotropic voxels (2 × 2 × 2 mm; TE = 40 ms, TR = 2 s, flip angle = 90°). During runs 3 and 4, that contained 12 normal and 6 catch events, the order of events was randomized for all subjects. Between sessions, the subject was queried through headphones about whether they were comfortable to continue. During these rest periods, functional imaging was halted, but the subjects did not move.
Events were either “normal” (juice delivered 6 s after cue disappeared) or “catch” (juice delivered 10 s after cue disappeared). For a detailed explanation of event schedule see Figure 1
. Subjects were given a choice of juice flavor. Juice was delivered using a Harvard Apparatus pump connected to a computer, which pushed 0.8 ml boluses of juice into the subject’s mouth (juice delivery lasted 1 s each time). The tubes were attached to a pacifier for comfort.
Manual Co-Registration of Structural and Functional Images
To define right and left habenular coordinates in functional images, we first looked at the structural image of each subject (1 × 1 × 1 mm voxels, T1 images in Figure 2
A) and recorded the position of the habenula (black arrows in inset panel A). In this example, two landmarks are shown: the bottom of the corpus callosum (white line) and the right ventricle (white arrow). These and other landmarks (which were different for each subject based on best visibility) were identified in functional images (2 × 2 × 2 mm voxel size, T2⋆ images in Figure 2
B), which helped to manually co-register the structural and functional images. To identify the exact placement of the habenula in functional images that had been manually co-registered, we used the triangular white matter tract by the habenula (black arrows in inset, panel B). Two cubic (3 × 3 × 3 voxels) ROIs were placed centered on the habenula coordinates of each subject and voxels in those cubes were used in the anti-correlation approach (as discussed in results below). To verify that the manual placement of habenular ROIs was necessary, we studied the distance from the habenular coordinates to a fixed landmark (bottom of corpus callosum at the midline). We found that the standard deviation in habenular coordinates was about 3 mm, similar to the size of the habenula. Therefore, we believe that automatic co-registration (which uses cortical landmarks far from the midbrain) would blur the signal from habenular tissue if subjects were pooled (Napadow et al., 2006
).
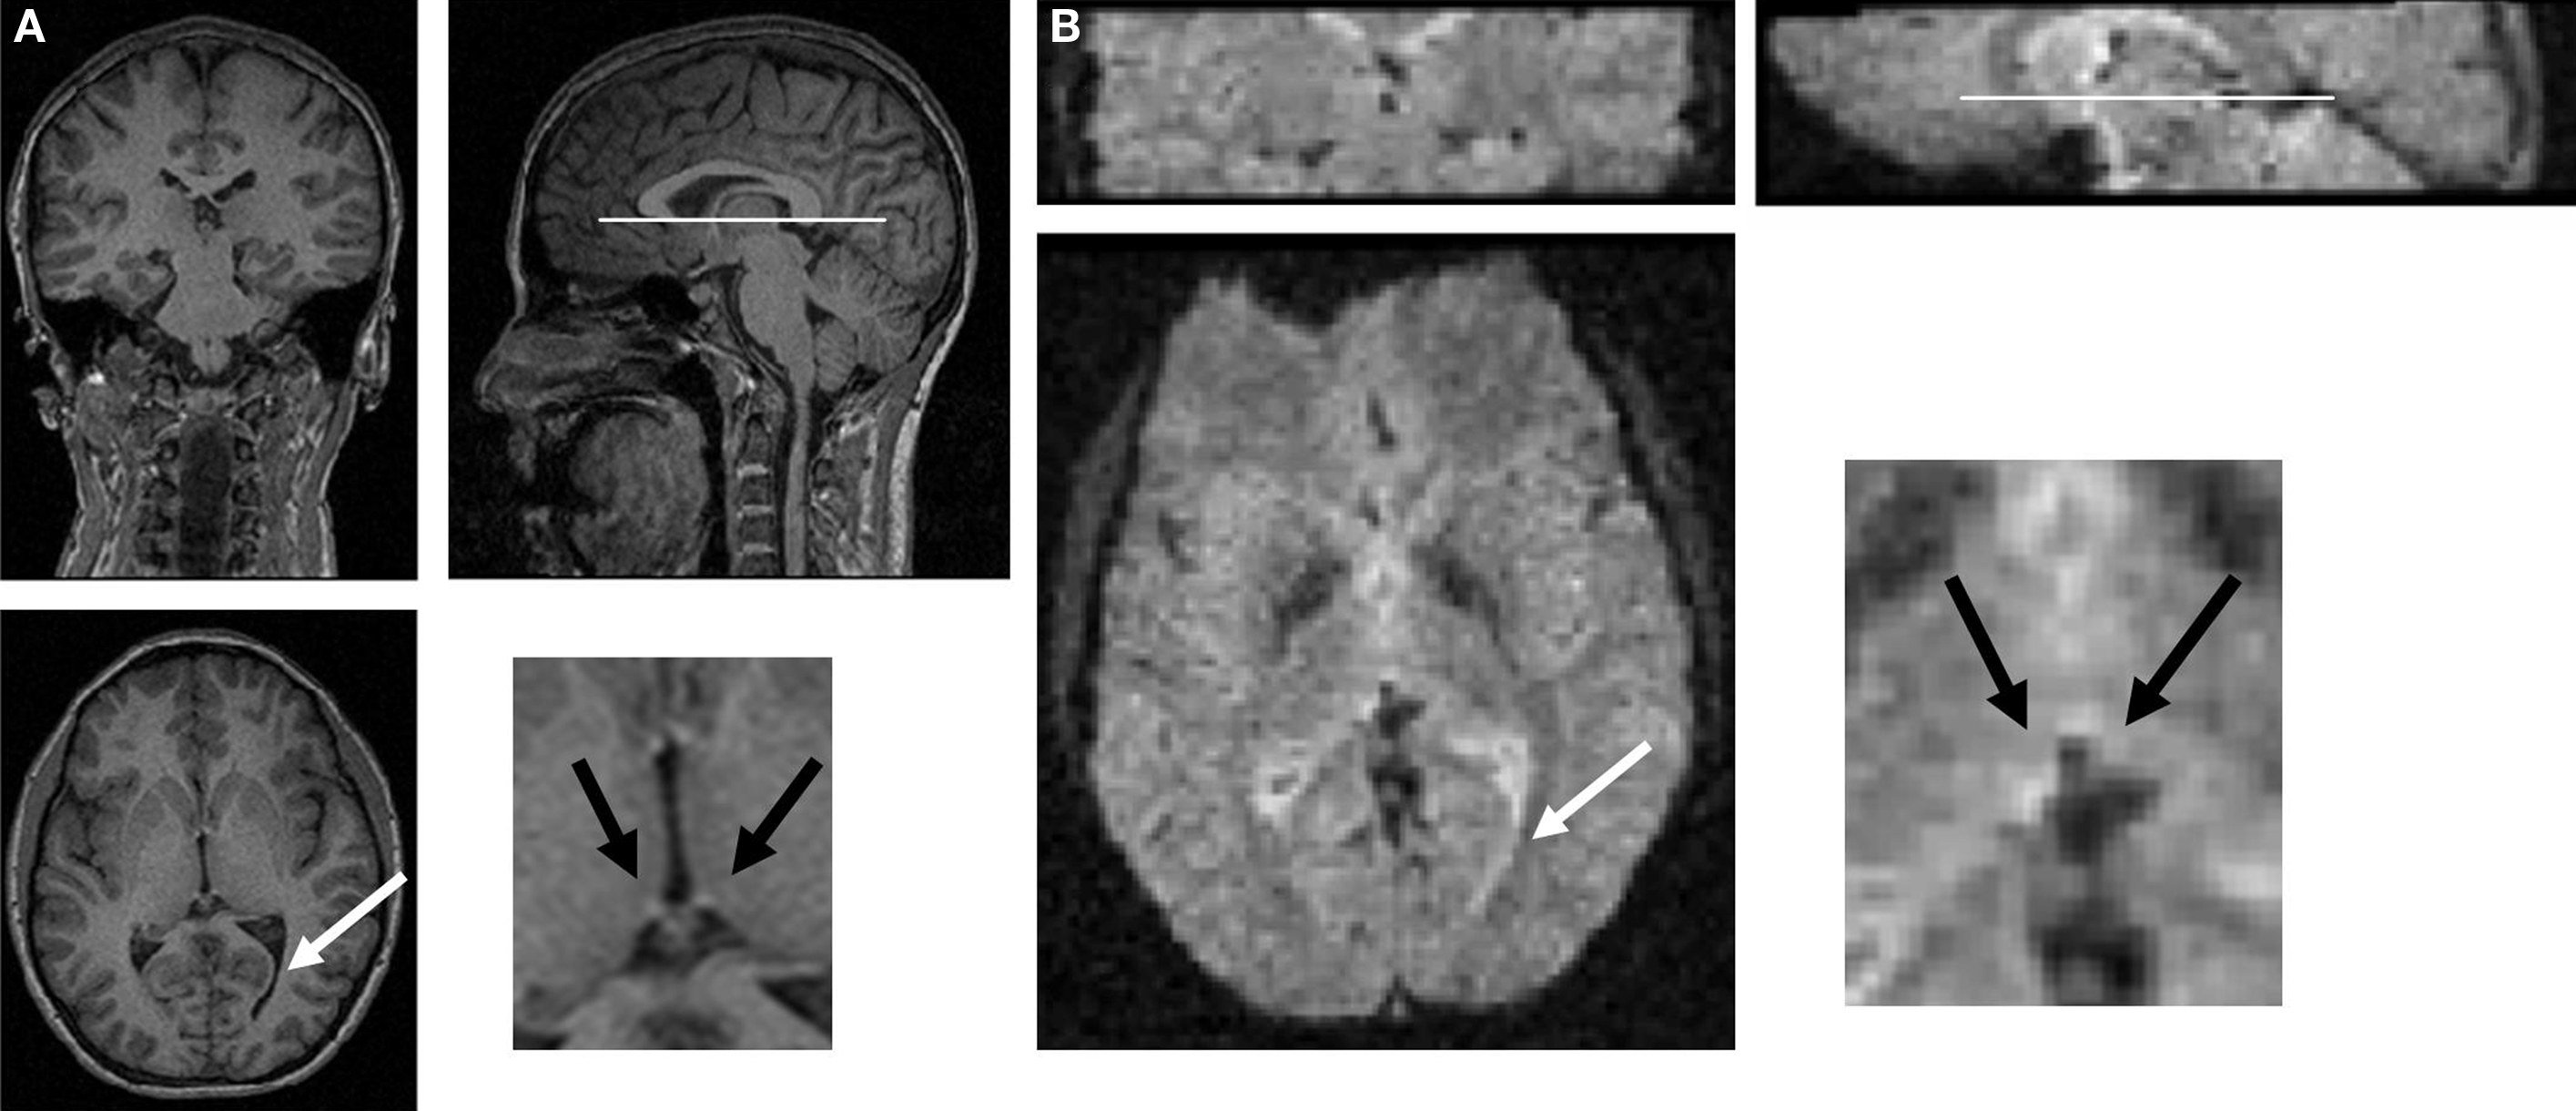
Figure 2. Manual co-registration procedure. (A) For each subject, the habenula was manually located in structural images (black arrows, inset) using a series of landmarks (in this case, bottom of corpus callosum – white line, and a turn in the right ventricle – white arrow). Landmarks were chosen in each subject to maximize manual co-registration of structural and functional images (see landmarks in both panels). (B) Coordinates for the habenula in functional images of each subject were then recorded by identifying the same landmarks as in (A).
We used an ROI to see striatal activity upon unexpected juice delivery during run 1. To obtain this ROI we used the SPM2 software and analyzed the time course of activity in the whole slab around the time of juice delivery. By changing the threshold for the p value we obtained a 34 voxel ROI. We chose this size because it is very similar to the 27 voxel cubic ROI used for the habenula.
Functional images were preprocessed only by slice timing and motion correction (verification of motion correction was done on each subject to ensure that the habenula was in the same coordinate in the first and the last functional image). In summary, we avoided automatic co-registration, normalization and smoothing of our functional images for habenular ROI.
Habenular Voxel Identification
We identified habenula-containing voxels by a combination of anatomical and functional criteria (Figure 3
). In step 1, we manually placed 3 by 3 by 3 voxel (6 mm by 6 mm by 6 mm) bounding boxes around regions known to include the habenula. This step produces 54 voxels from each subject that may overlap the habenula. In step 2, we identified habenula-containing voxels in each subject by computing correlations between each of the 54 time series from the bounding boxes and the striatal time series that occurs near unexpected juice delivery during run 1 (Figures 3
B,C). The contrast in Figure 3
C is unexpected juice delivered versus baseline (see legend). In step 3, we placed all 2700 correlations (54 per subject × 50 subjects) in a distribution (right panel of Figure 3
A) and selected the voxels that possessed negative correlations (values ranged from −0.89 to 0.92). This choice exploits the expected phenomenology cartooned in Figure 3
B, and, since the entire time series was included, this procedure would also capture any other correlations that exist or develop during run 1 from the time of the light cue up until the time of juice delivery. It must be noted that what we termed “negative correlation” does not necessarily mean voxels with negative correlation coefficients. In order to include the entire time series for each event, we used 22 s around the event to classify the voxels. In fact, only during some of those seconds we expect the habenula and the putamen activities to anti-correlate, while they may positively correlate during the time before or after the event. Therefore, the voxels that “negative correlate” are actually the voxels that correlate less, within the voxels contained in the bounding box. Using shorter times would increase the value of the anti-correlations, but the data would be noisier. We divided the voxels into “habenula” and “not habenula” (see Figure 2
A, right panel) approximately at the median of the correlations histogram (corr coeff 0.1). There are two main reasons why we chose this threshold. First, according to the anatomy, we expect about half of our binding box to be habenular tissue. Second, we did not want to choose only those voxels with very negative correlations because that would increase the percentage of spurious anti-correlations, or false positive habenular voxels. Other similar thresholds render comparable results. We then plotted the time course of the voxels identified as habenula during normal events in run 1. As expected, those voxels anti-correlate to the putamen signal at those events, especially during putamen activation after juice delivery (Figure 3
C, red trace habenula, black trace putamen).
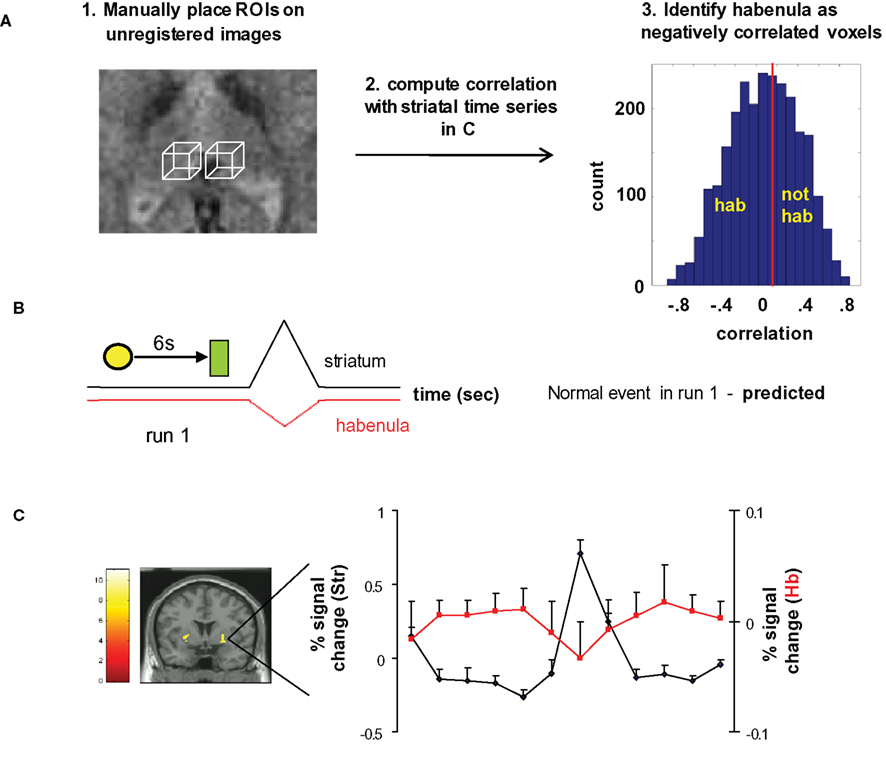
Figure 3. Anti-correlation approach to identify habenula-containing voxels. (A) Identifying habenula voxels. Step 1. Place two 27-voxel bounding boxes by hand over a region containing each habenula using unregistered images. Step 2. Compute the correlation between the average striatal time series and the time series from each of those 54 voxels. Step 3. From the 2700 correlations generated (blue histogram), define habenula voxels as those to the left of the median (red line) of the distribution (∼0.1 correlation). Other analogous decision criteria also suffice. Voxels accepted as habenula are identified by anti-correlation with the striatal time series whose identification is described below. (B) Predicted habenula and striatal responses to an early passive conditioning trial (normal event in run 1) based on electrophysiological data from non-human primates (Montague et al., 1996
; Schultz et al., 1997
; Bayer and Glimcher, 2005
; Matsumoto and Hikosaka, 2007
, 2009
). Based on Matsumoto and Hikosaka (2007)
, we qualitatively drew the positive-going striatal response as bigger than the negative-going habenular response. (C) Putamen activation at the (unexpected) juice delivery time during run 1 (coronal; 50 subjects, p < 0.000001, FDR corrected, minimum cluster size 10 voxels). Responses represent a contrast of unexpected juice delivery 6 s after cue to baseline 5 s prior to cue (23 events) – the time series in the inset derives from the 32 voxels activated at this threshold. Habenula voxels are identified as those whose activity anti-correlates with this average striatal time series (the time course of those voxels during run 1 is shown in red).
Habenular Signal upon Negative Prediction Errors
Figure 4
A shows the predicted response profiles (habenula = red; striatum = black) for habenula and striatum during a catch event. Figure 4
B displays the measured response of the functionally identified habenula voxels to the unexpected omission of juice delivery and unexpected delivery of juice at 10 s after the cue light. As anticipated from electrophysiological response phenomenology (Matsumoto and Hikosaka, 2007
), the functionally-defined habenula voxels show a positive-going response to unexpected juice omission (red asterisk). As a consistency check for our procedures, the striatal voxels show the anticipated response profiles – a negative-going response to unexpected juice omission (single black asterisk) and a positive-going response to unexpected juice delivery (double black asterisk) (Montague et al., 2004
). In our experiment, habenular voxels do not show the expected negative-going response to unexpected juice delivery. To answer this discrepancy, we studied the average time course of the whole habenular bounding box (Figure 5
A black trace). We found that there are two major peaks during this time course: one peak at t = 12, resembling the peak we identified as true habenula, and a later, long lasting increase in activity that loosely correlates with the activity in the putamen. The nature of the second peak eluded our analysis. It could be either an artifact of the experiment (the habenula lies by the third ventricle) or perhaps a feedback signal from striatal areas to some specific part of the habenula or nearby tissue. Whatever the nature of the second peak, it is likely that because of the inherent smoothness of the fMRI signal, our habenular voxels are contaminated by activity from these other voxels. Since the lowering of the habenular activity upon positive prediction error events is expected to be very small, it is not surprising that it was masked by contamination from a bigger, nearby positive-going signal (even after the anti-correlation approach was used). To verify that the second peak is not a true habenular response to a negative prediction error, we performed a regression analysis in which we subtracted the activity of the habenular bounding boxes during catch events minus the activity of those same voxels at normal events, shifted 4 s to align juice delivery (Figure 5
A red trace, regression coefficient 1.3). We found that this approach effectively diminished the size of the second peak. Therefore, although we still don’t know the exact nature of the second peak, we believe the first peak is a due to the non-delivery of expected reward. Finally, to verify that our approach was actually needed to measure activity in the habenula, we performed a traditional GLM analysis of our data, using complete pre-processing (slice timing, realignment, automatic co-registration, segmentation, normalization to a template and smoothing using a 4-mm kernel). Using this approach, we found activity at the contrast “juice expected but not delivered minus juice neither expected nor delivered” (during catch events) in an area near the habenula (Figures 5
B,C). Although this is encouraging and agrees with our more sophisticated ROI data, we believe that it would not be possible to confidently call this signal “habenular activity” had we not done the anti-correlational approach using our subject-by-subject analysis.
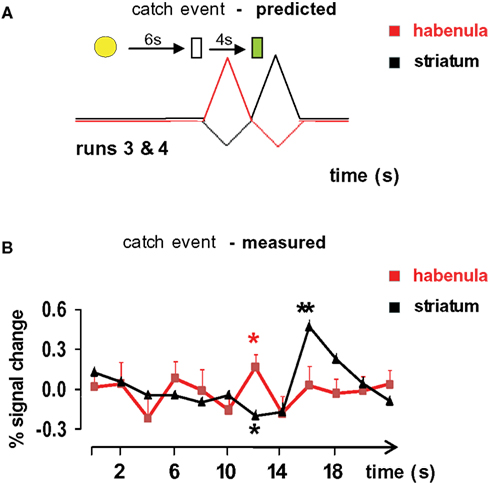
Figure 4. Habenula activation to negative prediction errors. Striatal (black) and habenula (red) time series derived from 12 catch trials in runs 3 and 4 (see Figure 1
). (A) Predicted (Based on Matsumoto and Hikosaka, 2007
, we qualitatively drew the negative-going striatal and habenular responses as smaller than the positive responses.) and (B). Measured habenular and striatal responses are shown. The red trace is the average time series from habenula voxels identified by the anti-correlational method presented in Figure 3
. The habenula voxels give a positive-going response to the non-delivery of expected juice (p = 0.021). The striatal voxels were identified in Figure 3
with a standard GLM contrast and show a negative-going response to unexpected juice non-delivery (black asterisk, t-test p = 0.0014) and a positive-going response to unexpected juice delivery (black double asterisk, t-test p = 10−15). Ignoring the lack of response to the light cue, the only predicted response that is missing from the measured data is the lack of negative-going response in habenula voxels to unexpected juice delivery.
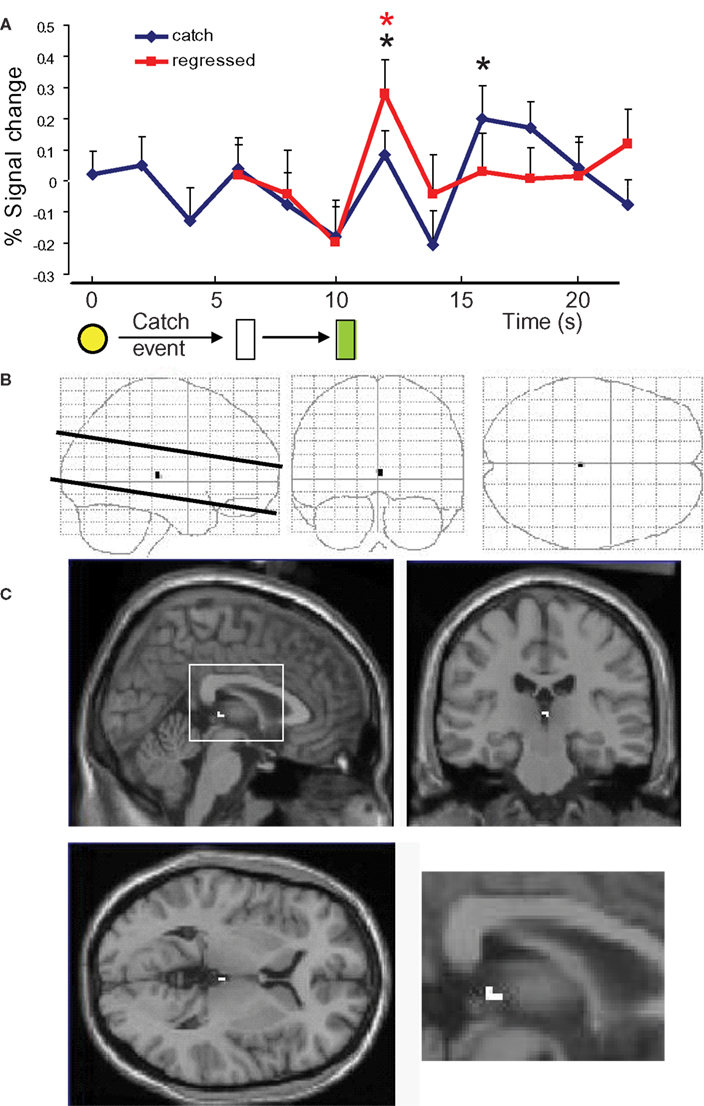
Figure 5. Habenular region activity at catch events. (A) Time course of the activity of all voxels contained within habenular bounding boxes during catch events (black trace) and the activity of those voxels after regressing out the time course from the same voxels during normal events in runs 3 and 4, shifted 4 s to align juice delivery (red trace). (B,C) General linear model analysis of catch events (B) “Glass brain” activation maps showing activation close to the habenular region only. (C) Brain activation (sagittal, coronal and axial) was maximal near the habenula (inset: a closer view at the sagittal section). *p < 0.05 vs previous point in curve (color coded).
It is currently believed that dopaminergic neuron firing encodes reward prediction errors. In fact, the reward prediction error theory of dopamine function proposes that dopamine release modulates reinforcement learning. Electrophysiological recordings in non-human primates provided support for this theory (Montague et al., 1996
; Schultz et al., 1997
). For several years, it was unclear which brain regions may be involved in the generation of the signals that dopamine cells must receive upon negative prediction error events. Recently, it was shown that the primate lateral habenula is a major source of negative reward-related signals in dopamine neurons (Matsumoto and Hikosaka, 2007
). Whether the human habenula behaves the same way remained to be shown and was the focus of our studies.
Broadly, the logic of our approach had two basic components. (1) Identify habenular voxels by seeking anti-correlations with striatal responses to unexpected reward delivery during early conditioning (run 1). This identifies the habenula using a negative-going BOLD response in regions large enough to contain the habenula. (2) In a separate session, probe the habenular voxels using the unexpected non-delivery of juice. Based on single unit electrophysiology (Matsumoto and Hikosaka, 2007
, 2009
), the habenular neurons should give an activation response to the unexpected juice omission. This fact gives a nice internal control: we identify the habenula voxels based on a negative-going signal (Figures 1 and 2
) and we probe these voxels with a stimulus that should yield a positive-going response (Figure 3
).
The habenula is a major player in the reward signal pathway (Matsumoto and Hikosaka, 2007
), may be a critical structure mediating the effects of drugs of abuse (Matsumoto and Hikosaka, 2007
), and is implicated in a series of important behaviors such as stress management and decision making (Klemm, 2004
). We have shown that by using a large number of subjects, small voxel size and a manual co-registration technique coupled to a correlational approach to identify the habenula, we can assess the activity of the habenula in humans undergoing a passive learning task. Our ROI analysis relied on both the positioning of the habenula in each subject and on the correlations of voxel activity between habenula and putamen voxels in run 1. In that sense, we carefully avoided a circular type of analysis discussed by Kriegeskorte et al. (2009)
by using data from run 1 to identify voxels and probing these voxels’ response in later, separate sessions (runs 3 and 4). These results expose the feasibility of human studies of habenular function under conditions modulated by the habenula, such as tobacco withdrawal (Salas et al., 2009
), alcohol abuse (Taraschenko et al., 2007
; Wang et al., 2009
), depression (Morris et al., 1999
; Shumake and Gonzalez-Lima, 2003
) or schizophrenia (Lecourtier et al., 2004
; Shepard et al., 2006
). In fact, a recent study has shown that deep brain stimulation of the habenula may be an effective therapy for treatment-resistant depression (Sartorius et al., 2010
). In addition, our approach may provide a way to image activity in analogously small brain structures. Of course, only areas whose activity correlates in a systematic fashion with large easier-to-image brain regions will be amenable to this type of analysis. Whether this approach can be used only to confirm prior knowledge, or also to gather novel insights in the function of the structure of interest is an open question.
The authors declare that the research was conducted in the absence of any commercial or financial relationships that could be construed as a potential conflict of interest.
This work was supported by Baylor College of Medicine and grants R01 DA11723, R01 NS045790 (PRM), RO1 DA 017173 (MDB), and The Kane Family Foundation (PRM). We thank Dr. Jorge Albin and Ms. Krystle Bartley, Ms. Carrie Howard, Ms. Christine Cortelyou, Ms. Elyse Aurbach, Mr. Mark Ross, Dr Henning Voss and Dr. Stephen LaConte.
Wang, J. C., Grucza, R., Cruchaga, C., Hinrichs, A. L., Bertelsen, S., Budde, J. P., Fox, L., Goldstein, E., Reyes, O., Saccone, N., Saccone, S., Xuei, X., Bucholz, K., Kuperman, S., Nurnberger, J., Jr., Rice, J. P., Schuckit, M., Tischfield, J., Hesselbrock, V., Porjesz, B., Edenberg, H. J., Bierut, L. J., and Goate, A. M. (2009). Genetic variation in the CHRNA5 gene affects mRNA levels and is associated with risk for alcohol dependence. Mol. Psychiatry 14, 501–510.