 José A. Graterol Pérez
 Stephanie Guder
 Chi-un Choe
 Christian Gerloff
 Robert Schulz
- Department of Neurology, University Medical Center Hamburg-Eppendorf, Hamburg, Germany
Ischemic stroke leads to excitability changes of the motor network as probed by means of transcranial magnetic stimulation (TMS). There is still limited data that shows to what extent structural alterations of the motor network might be linked to excitability changes. Previous results argue that the microstructural state of specific corticofugal motor tracts such as the corticospinal tract associate with cortical excitability in chronic stroke patients. The relationship between changes of cortical anatomy after stroke, as operationalized by means of decreases or increases in local cortical thickness (CT), has scarcely been addressed. In the present study, we re-analyzed TMS data and recruitment curve properties of motor evoked potentials and CT data in a group of 14 well-recovered chronic stroke patients with isolated supratentorial subcortical lesions. CT data of the stroke patients were compared to CT data of 17 healthy controls. Whole-brain and region-of-interest based analyses were conducted to relate CT data to measures of motor cortical excitability and clinical data. We found that stroke patients exhibited significantly reduced CT not only in the ipsilesional primary motor cortex but also in numerous secondary motor and non-motor brain regions, particularly in the ipsilesional hemisphere including areas along the central sulcus, the inferior frontal sulcus, the intraparietal sulcus, and cingulate cortices. We could not detect any significant relationship between the extent of CT reduction and stroke-related excitability changes of the motor network or clinical scores.
Introduction
Ischemic stroke leads to time- and recovery-dependent changes of motor cortical excitability which can be probed by means of transcranial magnetic stimulation (TMS). Motor evoked potentials (MEP) and recruitment curve properties have been considered as surrogates for the functional state of the motor network, including important corticofugal motor pathways such as the corticospinal tract (CST). Studies have related excitability measures to motor deficits and recovery processes after stroke (1–7). Over time, the field has moved from unimodal approaches to multimodal analyses of brain structure and function to better understand intersubject variability in stroke recovery (8). For instance, one study combined TMS and MRI to assess cortical excitability, interregional connectivity and damage to the CST and found that these factors accounted for more than 80% of the variance in functional impairment in chronic stroke patients (9). Other studies have recently evidenced significant relationships between CST microstructure and cortical excitability (10, 11).
Apart from important motor pathways, such as the CST, stroke-related alterations of brain structure also affect local cortical anatomy: For instance, cortical thinning has been observed in primary and secondary motor and non-motor brain regions of the ipsi- and contralesional hemispheres (5, 12–18), predominantly in cortices directly connected to the stroke lesion (14, 19) or in the deepest layers of the motor cortices (13). By showing gradual cortical thickening in frontal and temporal cortices (20) or increases of cortical gray matter volume (21, 22), other studies have argued for the existence of neuroplastic brain alterations after stroke to promote recovery processes. However, the precise relationship between cortical thickness (CT) alterations—either loss or gain in CT—and motor recovery remains under debate. There are studies which have found significant associations between cortical anatomy and clinical scores (13, 16, 21, 22) and others which have not (5, 14, 15, 19, 20).
Given these data, the question arises whether CT alterations, particularly located in key motor areas, might explain intersubject variability in excitability of the motor network. Specifically, these areas might comprise the primary motor cortex and also frontal and parietal cortices of the ipsilesional hemisphere since studies have repeatedly shown that the parietofrontal motor network might be critically involved in motor functioning and recovery processes after stroke (23–25). The regional analysis of CT could add information at the cortex level to answer this question, thus supporting available data from previous functional imaging studies or structural imaging studies which focused on corticofugal or interregional corticocortical motor tracts (8). In fact, only a few studies have explored potential associations between CT and TMS-based measures of cortical excitability in stroke patients. For hand dexterity, Borich et al. found that the CT of the precentral gyrus together with cortical excitability were informative predictors. However, the authors did not address any potential interrelationship between both variables (26). Another study compared CT data of the ipsilesional primary motor cortex with its excitability but did not detect any association. As potential limitations, this analysis was constrained to the primary motor cortex and included patients with subcortical strokes but also patients with direct cortex involvement. CT was thinner in patients with cortical strokes (5). Notably, inter-study variability in the composition of the patient groups with lesion locations with (5, 16, 27, 28) or without direct damage to the cortex (12–15, 17–19, 29, 30) might be a relevant influential factor for variability in structure-function relationships. A comparison of different methods to estimate CT has indicated that directly damaged cortical areas exhibit an increased risk for invalid CT values due to local effects of the stroke lesion (31).
The present study was designed to shed new light on the potential relationship between regional CT alterations, changes of cortical excitability, and residual motor function after stroke. For that, we reanalyzed available TMS, MRI, and clinical data of a group of supratentorial subcortical chronic stroke patients. Specifically, high-resolution structural MRI data was used to quantify CT of the ipsilesional and contralesional hemispheres. Data of healthy participants of similar age and gender were used to determine brain regions with significant loss or gain in CT in the stroke cohort. Whole-brain and region-of-interest (ROI) based analyses were conducted to relate CT data to measures of cortical excitability and clinical data.
Methods
Participants and Clinical Testing
This study is based on the cohort of chronic stroke patients of our previous report on the influence of cortico-cerebellar structural connectivity on excitability of the motor network (10). The original inclusion criteria were: first-ever supratentorial ischemic stroke with persistent hand motor impairment in the chronic stage of recovery (≥ 6 months), 18 years of age or older, and no contraindication for TMS or MRI. In total, 18 patients were included in that study. In the present work, four patients were excluded due to cortical lesions that could have affected the interpretation of the results. Seventeen healthy participants of similar age and gender served as the control group. Distribution of stroke hemispheres regarding the dominant and non-dominant hemispheres were taken into account. Fourteen control participants were treated as having their dominant hemisphere being pseudo-affected by the stroke. All participants gave written informed consent according to the Declaration of Helsinki to participate in the study which was approved by the local ethics committee (PV5357). Patients underwent clinical testing including grip and pinch forces, Fugl-Meyer assessment of the upper extremity (UEFM), and the nine-hole peg test (NHP). Grip and pinch forces and NHP performances were obtained from both the affected and unaffected hands. These data have been already introduced by our previous report and are taken 1:1 (10).
TMS Data Acquisition and Analysis
Details of the TMS methodology can be found in our original publication (10). In brief, a Magstim 200 magnetic stimulator with a 70-mm figure-eight coil and electromyographic electrodes placed over the first dorsal interosseous muscle on both hands in a belly-tendon montage was used to collect MEP. The resting motor threshold (RMT) at the hotspot was determined to the nearest 1% of the maximum stimulator output (32). To calculate the properties of the MEP's recruitment curve (RC), blocks of 11 stimuli, in a pseudorandomized order to avoid hysteresis effects and with intensities ranging from 90 to 160% of RMT, were administered. RC data were acquired in the affected (AH) and unaffected hemispheres (UH). Signal software 4.05 (Cambridge, Electronic Design, Cambridge, UK) was used to analyze the data. The first trial of each block was discarded due to the possibility that the initial MEP showed higher amplitudes than subsequent responses. At least 5 trials of every intensity level (90–160% RMT) were used to fit the RC, except for one patient and one control in which a reduced range (90–150%) was used due to a high stimulation intensity at 160%. The RC data were plotted as intensity vs. MEP size (peak-to-peak amplitude). Each individual intensity was then fitted into a sigmoid Boltzmann function which allowed to estimate MEPmax (plateau of RC) and Slopemax (maximum slope of RC), separately for AH and UH as stroke-related alterations has been evidenced for these two measures. Importantly, these data are taken 1:1 from our previous report which should be consulted by the interest reader for further details (10).
Brain Imaging and Cortical Thickness Analyses
A 3T Siemens Skyra MRI scanner (Siemens, Erlangen, Germany) and a 32-channel head coil were used to acquire high-resolution T1-weighted anatomical images by means of a three-dimensional magnetization-prepared, rapid acquisition gradient-echo sequence with the following parameters: TR = 2,500 ms, TE = 2.12 ms, FOV = 240 mm, 256 coronal slices with a voxel size of 0.8 x 0.8 x 0.9 mm. Datasets were processed with Freesurfer version 6.0.0 (http://surfer.nmr.mgh.harvard.edu/) using the default options to measure CT (33, 34). The reconstructions were visually inspected and, if required, manually corrected following established recommendations from the Freesurfer's documentation. To compare affected (AH) and unaffected hemispheres (UH), all images were registered to the Freesurfer's common space symmetrical template, fsaverage_sym, that allowed to flip all lesions to the left hemisphere (35). Therefore, in this study we treated the left hemisphere as the AH and the right hemisphere as the UH. Surface data were smoothed with a full-width-half-maximum Gaussian kernel of 10 mm.
Statistics
For group comparisons and correlative analyses with clinical and TMS data, we first followed a whole-brain approach. Using the Freesurfer's mri_glmfit utility, general linear models are specified for the whole brain's surface, which comprises CT estimates for every vertex of every subject. To evaluate CT differences between patients and controls, a first model with CT as the dependent variable was fit treating group as the factor of interest. Color-coded statistical parametric maps were displayed using freeview. To assess the relationship between CT and cortical excitability or motor function, similar separate models were fit with TMS measures of AH or clinical data of the affected hand treated as the independent variables. All models were adjusted for the effect of age. P-values in every model were corrected for multiple comparisons using a Z Monte Carlo simulation over 10,000 iterations with a cluster-forming threshold of P < 0.0001 (36). Statistical significance was assumed at cluster-wise corrected P-values < 0.05. Size of clusters and number of significant vertices are given in the results section.
In addition to these surface-based whole-brain analyses, a ROI analysis of primary and secondary motor areas was also conducted using R statistical package (version 4.0.3, https://www.r-project.org/). Mean CT values were extracted from clusters of the parietofrontal motor network and cingulate cortices exhibiting a significant loss in CT in the stroke patients compared to healthy controls. These data (now as independent explanatory variable of interest) were fit into separate multiple linear regression models to explain variability in cortical excitability (Slopemax, MEPmax) and clinical scores (maximum grip and pinch force, NHP of the affected hands, UEFM). The respective data of the unaffected hemisphere or hand and age were treated as covariates in line with our previous report (10). Slopemax and MEPmax values were log-transformed to improve data distribution. Models were checked for normal distribution of residuals and relevant multi-collinearity was excluded by estimating the variation inflation factor. Cook's distance was used to check for outliers. Statistical significance was determined as P < 0.05. P-values are presented as uncorrected values.
Results
Demographic and Clinical Data
Analyses were conducted in 14 patients (12 males, mean age 66.86 years, mean 41 months after stroke, one left-handed, 12 patients with lesions on their dominant hemisphere, 6 lacunar strokes). Demographic and clinical data of the patients and controls are given in Table 1. The distribution of the stroke lesions is shown in Figure 1.
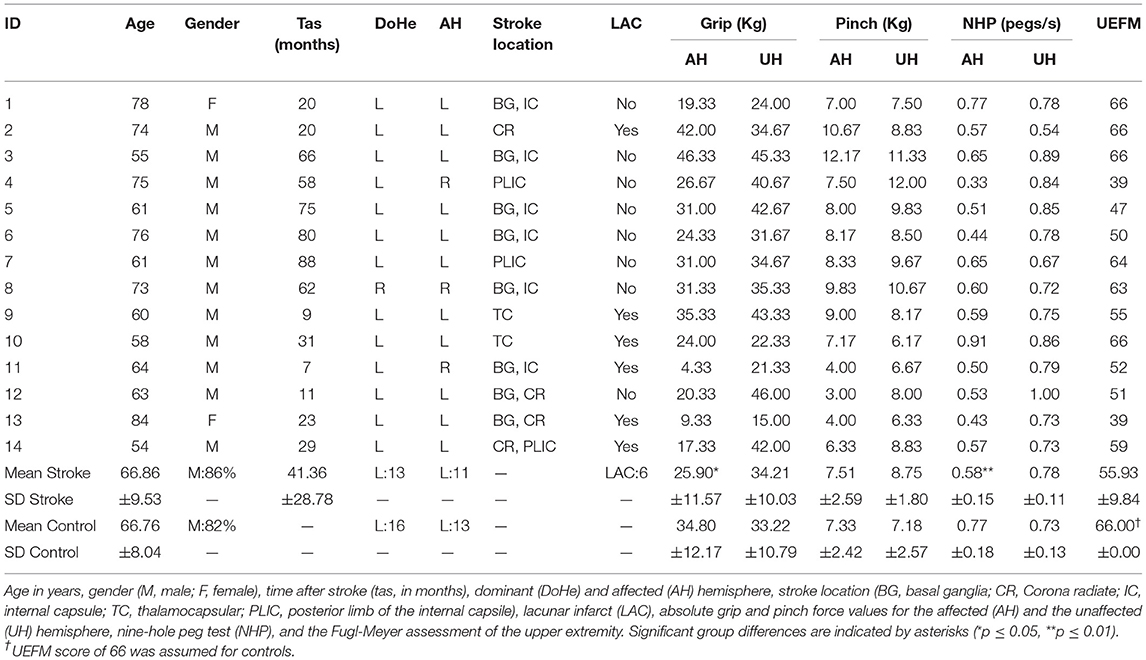
Table 1. Demographic and clinical data.
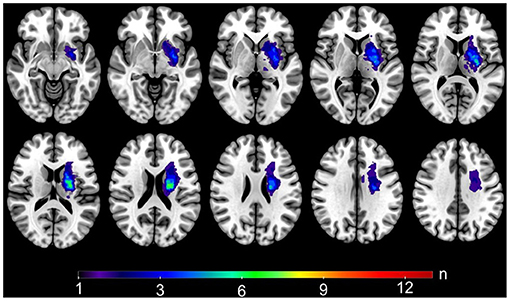
Figure 1. Stroke lesions. Lesion mask overlap showing the distribution of the stroke lesions on a standard MNI template. For visualization purposes, all the masks were registered to the MNI space and flipped to the left hemisphere. Warm colors show areas of bigger overlap.
Cortical Thickness in Stroke Patients
Whole-brain analysis revealed a significantly reduced CT in patients when compared to controls, after accounting for age, in multiple cortical areas with predominance of the ipsilesional hemisphere (Figure 2). The largest clusters of significant CT reductions were found in the ipsilesional pre-, post-, and paracentral gyri, in the central and paracentral sulci, the cuneal gyrus and the calcarine and parieto-occipital sulci as well as in the superior parietal gyrus and postcentral sulcus. In the contralesional hemisphere, the extent of CT reduction was rather moderate and did only reach statistical significance in the central sulcus, the cuneal gyrus, and in the calcarine sulcus. Tables 2, 3 summarize cluster locations and sizes, cluster-related averaged CT values for patients and controls, and absolute mean group differences. There were no significant CT increases in patients compared to controls in the present cohort.
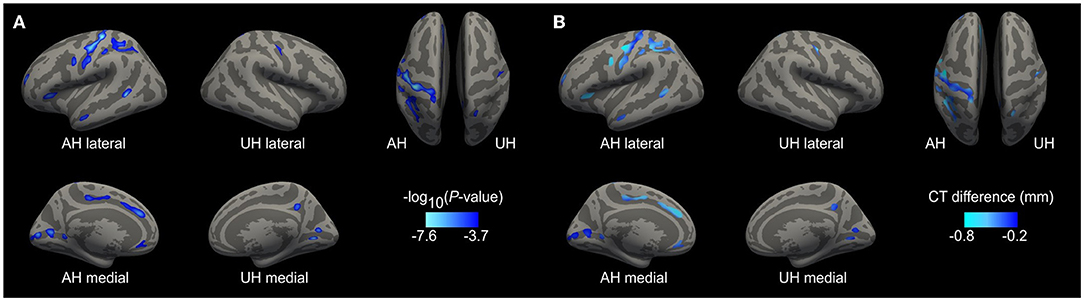
Figure 2. Cortical thickness reductions after stroke. Whole-brain analysis results from comparison of patients with controls. For visualization purposes, the left hemisphere is modeled as the affected hemisphere (AH) and the right hemisphere as the unaffected hemisphere (UH). (A) Show clusters of significant CT thinning in the patients. The scale displays values of -log10 (P-value). Lighter blue tones mean higher significance. (B) Display the vertex-wise difference of CT values in mm (patients-controls) using the significant clusters as masks. Lighter blue shows areas of increased cortical thinning.
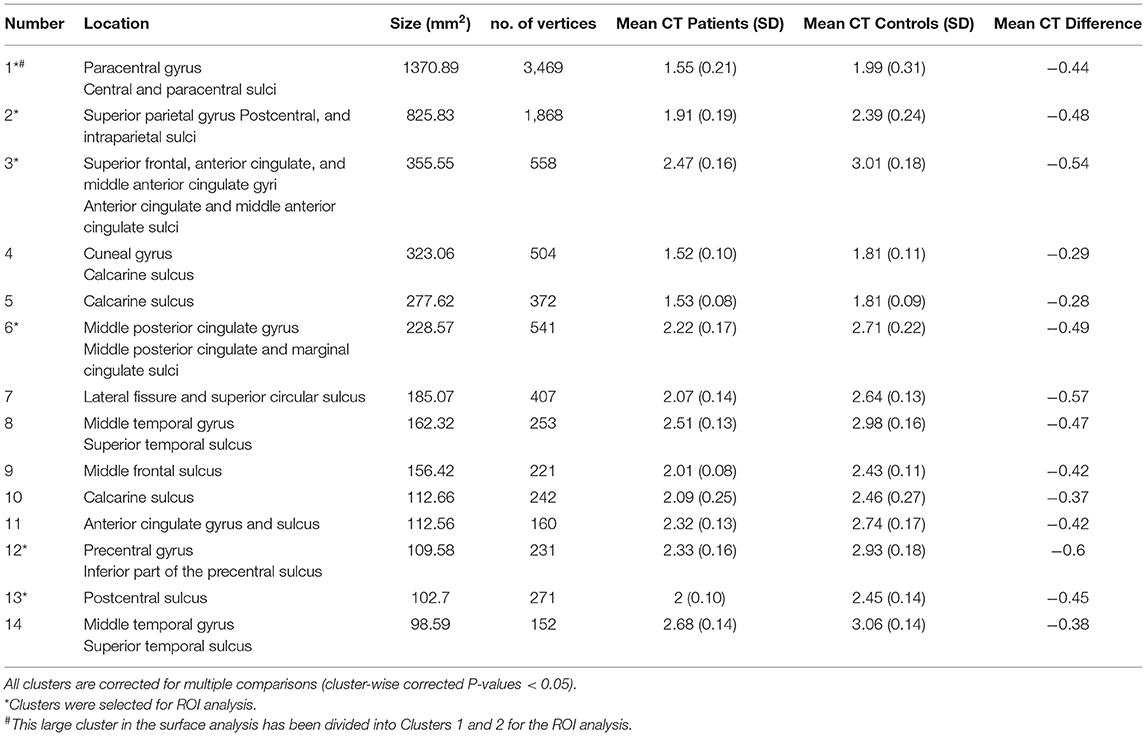
Table 2. Location of the significant CT clusters in the AH of patients when compared to controls.
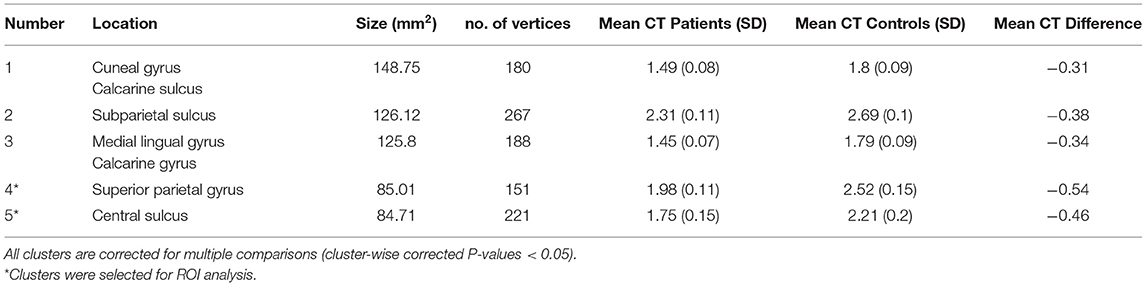
Table 3. Location of the significant CT clusters in the UH of patients when compared to controls.
Based on a priori hypotheses for functional and structural domains within the motor network with primary and secondary motor areas in frontal, parietal (8, 24) and also cingulate cortices (37–39), significant clusters were extracted for an additional ROI analysis. Figure 3 displays the 9 clusters with significant loss in CT that were chosen: Frontal 1, Central 1–3, Superiorparietal 1–3, Cingulate 1–2. The clusters Central 3 and Superiorparietal 3 were located on the unaffected hemisphere, all others on the ipsilesional hemisphere. For ROI analysis, the large ipsilesional cluster 1 has been divided into clusters Central 1 and Central 2.
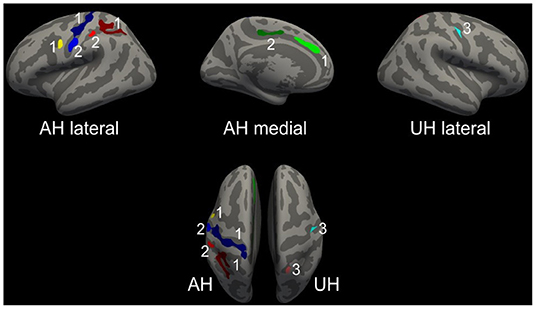
Figure 3. Regions-of-interest for cluster-wise analysis. Selected clusters for ROI analyses. For visualization purposes, the left hemisphere is modeled as the affected hemisphere (AH) and the right hemisphere as the unaffected hemisphere (UH). Central ROIs are displayed in blue tones, the frontal one in yellow, parietal ROIs in red tones and the cingulate ROIs in green. Upper row with lateral and medial views on AH and UH. Lower row with superior view of AH and UH.
Relationship Between CT, Cortical Excitability, and Clinical Scores
Whole-brain analyses did not detect any significant associations, neither between CT estimates and the TMS data (Slopemax and MEPmax) of AH nor between CT and the clinical scores in the stroke patients. In line, the ROI analysis of the frontal, central, superiorparietal and cingulate motor areas did not uncover any significant relationships with these parameters (Tables 4, 5).
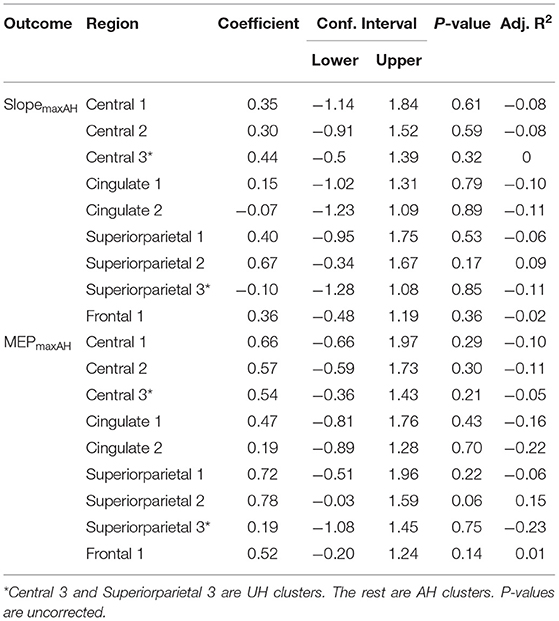
Table 4. Patients' linear regression models with the CST's integrity measurements as the response variable.
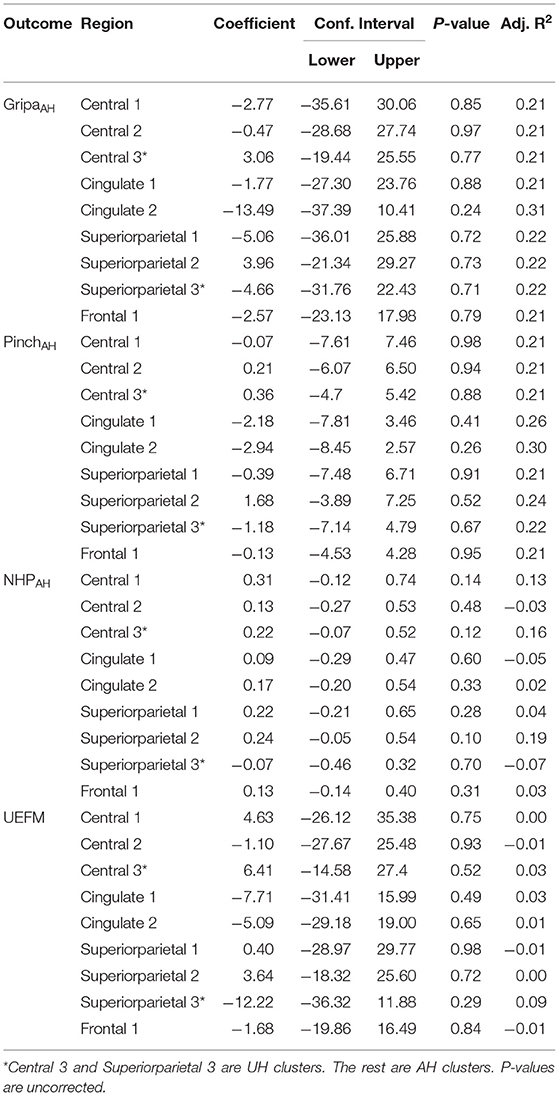
Table 5. Patients' linear regression models with the motor output measurements as the response variable.
Discussion
The present work shows that chronic stroke patients with isolated subcortical supratentorial stroke lesions exhibit significantly reduced CT in numerous primary and secondary motor and non-motor brain areas, particularly in the ipsilesional hemisphere including areas along the central sulcus, the inferior frontal sulcus, the intraparietal sulcus, and cingulate cortices. However, we could not detect any significant relationship between the extent of these CT reductions and stroke-related changes in motor cortical excitability or clinical scores.
Cortical thinning, especially in brain regions connected to the stroke lesion, has been previously reported by imaging studies. For instance, a longitudinal study comparing stroke patients in the acute phase within three months after stroke found a significant loss in CT in a small area at the superior frontal gyrus at the lateral border of the supplementary motor area (14). However, these CT changes did not correlate with changes in clinical scores. Another work investigated chronic stroke patients and found significant loss in CT in the ipsilesional primary motor cortex. However, this study did not conduct a whole-brain analysis to look for CT alterations in other brain regions (12). Similarly, other studies have limited their CT analyses to pre-specified regions such as the primary motor cortex (5, 17).
In the present cross-sectional whole-brain analysis we show that CT alterations are not limited to the primary motor cortex but are also evident in multiple cortical areas of non-primary motor-related brain regions of the ipsilesional hemisphere. Specifically, we found significant loss in CT in the ventral premotor cortex and in cortices along the intraparietal sulcus. These data are well in line with multiple reports, which have evidenced that the parietofrontal motor network shows relevant functional (23, 40, 41) and structural changes (22, 24) which also relate to recovery after stroke. Moreover, cortices of the cingulate motor areas also showed a significant loss in CT. As cingulate motor areas are structurally and functionally connected with motor, premotor and also somatosensory areas (37, 38, 42), we speculate that network disconnection effects by the stroke lesion are likely to drive these CT reductions as well. In the literature, one study in acute ischemic brainstem strokes also found thinning of the cingulate cortices (18). Previous functional imaging studies have already shown that cingulate motor areas exhibit recovery-dependent increases in brain activation (43, 44), potentially reflecting enhanced processing of somatosensory feedback after stroke (45). Since we have not detected any increases in CT in these areas, but only significant decreases, one might hypothesize that such adaptive processes might be time-specific phenomena and more likely to be relevant in acute or subacute stages than in chronic stages of recovery.
Loss of CT was predominant in, but not limited to, the ipsilesional hemisphere. On the contralesional hemisphere we only detected CT reductions in a few regions in the central sulcus, the cuneal gyrus and calcarine sulcus. This predominance of CT alterations in the ipsilesional hemisphere is in line with a number of previous studies (19, 46). For instance, Cheng et al. estimated an average loss in CT of 0.15 mm after one year in the ipsilesional and 0.13 mm in the contralesional hemisphere in cortices that are structurally connected to the stroke lesions (19).
Some studies have shown that not only loss, but also gain in CT or cortical gray matter volume can be detected after stroke (16, 20, 22). For instance, Liu et al. observed gradual CT increases after basal ganglia stroke in the temporal and frontal lobes (20). The present cohort did not exhibit such increases in CT when compared to the healthy controls. In our study, absolute CT values, and not the relative change of CT over time, were used for group comparison (20). Thus, sensitivity of our cross-sectional approach might be inferior compared to longitudinal statistics to detect subtle gain in CT. Another study found increases of gray matter volume in bilateral supplementary motor areas after right-hemispheric stroke only. These changes also correlated with preserved motor functions (21). A systematic analysis of the influence of the side of the stroke lesion for loss or gain in CT of the affected or unaffected hemispheres would remain a topic for upcoming studies. In line with this idea, precise information regarding subcortical stroke locations, such as striatal vs. non-striatal lesions, might be further influential factors for stroke-related CT alterations in both hemispheres (20). To what extent such information might also influence cross-sectional group comparisons for CT analyses should be addressed by future research.
Earlier reports have been increasingly using multimodal approaches to better understand stroke recovery. For instance, one study investigated the relationship between CT of the primary motor cortex, motor cortical excitability, and clinical measures. While TMS measures could be related to motor functions, CT values could not (5). In the present study, we aimed at addressing this relationship with respect to other cortical brain regions in an exploratory manner. Against our hypothesis, and in accordance with the previously mentioned study, we did not find any significant association, neither between CT and TMS measures of cortical excitability, nor between CT and motor functions after stroke. Concerning the association between CT and clinical scores, there are other studies which could not detect significant correlations (5, 14, 15, 19, 20, 47).
One potential explanation for these negative results is that, although we only included supratentorial subcortical strokes, our patients still exhibited variable lesion locations. Among the affected regions were the corona radiata, internal capsule, basal ganglia, and thalamus. This heterogeneity might still translate into a relevant variability also in the extent of cortical degeneration and atrophy via degeneration of connecting fiber tracts (14, 46). This might complicate the detection of significant relationships spatially converging to a distinct brain region. On the other hand though, even in cohorts with very homogenous stroke locations such as isolated basal ganglia strokes, CT-outcome associations have not been detected (20). This might indicate that CT alone is unlikely to explain a relevant amount of intersubject variability in clinical scores. Hence, other established surrogate markers of the integrity of the motor network, such as fractional anisotropy of the CST, seem to be more informative for residual motor functioning and recovery after stroke (8). Given more recent results for layer-specific CT changes after stroke (13), these negative results could suggest that a higher resolution and the precise CT estimation related to layer V of the primary motor cortex or secondary motor cortices contributing to the CST (48, 49) might be capable to capture such associations between cortical anatomy, electrophysiology, and motor function. For clinical scores, such layer-specific CT estimates have been found to show significant correlations (13).
There are critical limitations to note. First, stroke patients from the initial cohort that had a cortical stroke had to be excluded from the sample. Therefore, only 14 patients could be finally included in the present analyses. On the one hand, this allowed us to interpret CT alterations as secondary degeneration remote from the lesion, because direct lesion effects of the cortical anatomy could be excluded. On the other hand, the reduced sample size influences the power of the statistical analyses. Our results should be verified or falsified in independent datasets. Second, the study was cross-sectional in nature. Longitudinal analyses with repeated sessions of MRI and TMS—throughout the recovery phase—might help to uncover time-dependent associations between cortical thickness and excitability, which undergo changes after stroke. Third, the present cohort included patients with rather mild deficits with a mean NIHSS score of 2 and a mean UEFM score of 56. Thus, whether our findings might be different in stroke patients with more severe deficits, remains a topic for upcoming prospective studies.
Data Availability Statement
Although there are data sharing restrictions imposed by the ethical review board, data will be made available upon reasonable request, which includes submitting an analysis plan for a secondary project.
Ethics Statement
The studies involving human participants were reviewed and approved by Ethics Committee of the Chamber of Physicians, Hamburg (No. PV5357). The patients/participants provided their written informed consent to participate in this study.
Author Contributions
JGP conducted the CT analyses and prepared the manuscript. SG conducted the TMS and imaging experiments and supervised the CT analyses. CC contributed to the statistical analyses. CG contributed to the design of the study. RS contributed to the design of the study, the statistical analyses, and prepared the manuscript. All authors revised the manuscript for important intellectual content.
Funding
This study was supported by the Werner Otto Stiftung (4/90, RS) and the Deutsche Forschungsgemeinschaft (DFG, German Research Foundation) - 178316478 – C1 (CG). RS and CC were supported by an Else Kröner Exzellenzstipendium from the Else Kröner-Fresenius-Stiftung (Grant Nos. 2020_EKES.16 to RS, 2018_EKES.04 to CC).
Conflict of Interest
The authors declare that the research was conducted in the absence of any commercial or financial relationships that could be construed as a potential conflict of interest.
Publisher's Note
All claims expressed in this article are solely those of the authors and do not necessarily represent those of their affiliated organizations, or those of the publisher, the editors and the reviewers. Any product that may be evaluated in this article, or claim that may be made by its manufacturer, is not guaranteed or endorsed by the publisher.
References
1. Ward NS, Cohen LG. Mechanisms underlying recovery of motor function after stroke. Arch Neurol. (2004) 61:1844–8. doi: 10.1001/archneur.61.12.1844
2. Ward NS. The neural substrates of motor recovery after focal damage to the central nervous system. Arch Phys Med Rehabil. (2006) 87:S30–5. doi: 10.1016/j.apmr.2006.08.334
3. Liepert J, Restemeyer C, Münchau A, Weiller C. Motor cortex excitability after thalamic infarction. Clin Neurophysiol. (2005) 116:1621–7. doi: 10.1016/j.clinph.2005.03.002
4. Potter-Baker KA, Varnerin NM, Cunningham DA, Roelle SM, Sankarasubramanian V, Bonnett CE, et al. Influence of corticospinal tracts from higher order motor cortices on recruitment curve properties in stroke. Front Neurosci. (2016) 10:79. doi: 10.3389/fnins.2016.00079
5. Buetefisch CM, Revill KP, Haut MW, Kowalski GM, Wischnewski M, Pifer M, et al. Abnormally reduced primary motor cortex output is related to impaired hand function in chronic stroke. J Neurophysiol. (2018) 120:1680–94. doi: 10.1152/jn.00715.2017
6. Stinear CM, Barber PA, Smale PR, Coxon JP, Fleming MK, Byblow WD. Functional potential in chronic stroke patients depends on corticospinal tract integrity. Brain. (2007) 130:170–80. doi: 10.1093/brain/awl333
7. Boroojerdi B, Diefenbach K, Ferbert A. Transcallosal inhibition in cortical and subcortical cerebral vascular lesions. J Neurol Sci. (1996) 144:160–70. doi: 10.1016/S0022-510X(96)00222-5
8. Koch P, Schulz R, Hummel FC. Structural connectivity analyses in motor recovery research after stroke. Ann Clin Transl Neurol. (2016) 3:233–44. doi: 10.1002/acn3.278
9. Volz LJ, Sarfeld A-S, Diekhoff S, Rehme AK, Pool E-M, Eickhoff SB, et al. Motor cortex excitability and connectivity in chronic stroke: a multimodal model of functional reorganization. Brain Struct Funct. (2015) 220:1093–107. doi: 10.1007/s00429-013-0702-8
10. Guder S, Frey BM, Backhaus W, Braass H, Timmermann JE, Gerloff C, et al. The influence of cortico-cerebellar structural connectivity on cortical excitability in chronic stroke. Cereb Cortex. (2020) 30:1330–44. doi: 10.1093/cercor/bhz169
11. Guder S, Pasternak O, Gerloff C, Schulz R. Strengthened structure-function relationships of the corticospinal tract by free water correction after stroke. Brain Commun. (2021) 3:fcab034. doi: 10.1093/braincomms/fcab034
12. Zhang J, Meng L, Qin W, Liu N, Shi FD Yu C. Structural damage and functional reorganization in Ipsilesional M1 in well-recovered patients with subcortical stroke. Stroke. (2014) 45:788–93. doi: 10.1161/STROKEAHA.113.003425
13. Lotan E, Tavor I, Barazany D, Ben-Amitay S, Hoffmann C, Tsarfaty G, et al. Selective atrophy of the connected deepest cortical layers following small subcortical infarct. Neurology. (2019) 92:e567–75. doi: 10.1212/WNL.0000000000006884
14. Cheng B, Schulz R, Bönstrup M, Hummel FC, Sedlacik J, Fiehler J, et al. Structural plasticity of remote cortical brain regions is determined by connectivity to the primary lesion in subcortical stroke. J Cereb Blood Flow Metab. (2015) 35:1507–14. doi: 10.1038/jcbfm.2015.74
15. Jones PW, Borich MR, Vavsour I, Mackay A, Boyd LA. Cortical thickness and metabolite concentration in chronic stroke and the relationship with motor function. Restor Neurol Neurosci. (2016) 34:733–46. doi: 10.3233/RNN-150623
16. Brodtmann A, Pardoe H, Li Q, Lichter R, Ostergaard L, Cumming T. Changes in regional brain volume three months after stroke. J Neurol Sci. (2012) 322:122–8. doi: 10.1016/j.jns.2012.07.019
17. Hong H, Yu X, Zhang R, Jiaerken Y, Wang S, Luo X, et al. Cortical degeneration detected by neurite orientation dispersion and density imaging in chronic lacunar infarcts. Quant Imaging Med Surg. (2021) 11:2114–24. doi: 10.21037/qims-20-880
18. Chen H, Shi M, Geng W, Jiang L, Yin X, Chen YC, et al. Preliminary study of cortical morphology changes in acute brainstem ischemic stroke patients. Medicine (Baltimore). (2021) 100:e24262. doi: 10.1097/MD.0000000000024262
19. Cheng B, Dietzmann P, Schulz R, Boenstrup M, Krawinkel L, Fiehler J, et al. Cortical atrophy and transcallosal diaschisis following isolated subcortical stroke. J Cereb Blood Flow Metab. (2020) 40:611–21. doi: 10.1177/0271678X19831583
20. Liu H, Peng X, Dahmani L, Wang H, Zhang M, Shan Y, et al. Patterns of motor recovery and structural neuroplasticity after basal ganglia infarcts. Neurology. (2020) 95:e1174–87. doi: 10.1212/WNL.0000000000010149
21. Diao Q, Liu J, Wang C, Cao C, Guo J, Han T, et al. Gray matter volume changes in chronic subcortical stroke: a cross-sectional study. NeuroImage Clin. (2017) 14:679–84. doi: 10.1016/j.nicl.2017.01.031
22. Abela E, Seiler A, Missimer JH, Federspiel A, Hess CW, Sturzenegger M, et al. Grey matter volumetric changes related to recovery from hand paresis after cortical sensorimotor stroke. Brain Struct Funct. (2015) 220:2533–50. doi: 10.1007/s00429-014-0804-y
23. Hordacre B, Lotze M, Jenkinson M, Lazari A, Barras CD, Boyd L, et al. Fronto-parietal involvement in chronic stroke motor performance when corticospinal tract integrity is compromised. NeuroImage Clin. (2021) 29:102558. doi: 10.1016/j.nicl.2021.102558
24. Schulz R, Koch P, Zimerman M, Wessel M, Bönstrup M, Thomalla G, et al. Parietofrontal motor pathways and their association with motor function after stroke. Brain. (2015) 138:1949–60. doi: 10.1093/brain/awv100
25. Backhaus W, Braaß H, Higgen FL, Gerloff C, Schulz R. Early parietofrontal network upregulation relates to future persistent deficits after severe stroke—a prospective cohort study. Brain Commun. (2021) 3:fcab097. doi: 10.1093/braincomms/fcab097
26. Borich MR, Neva JL, Boyd LA. Evaluation of differences in brain neurophysiology and morphometry associated with hand function in individuals with chronic stroke. Restor Neurol Neurosci. (2015) 33:31–42. doi: 10.3233/RNN-140425
27. Li Q, Pardoe H, Lichter R, Werden E, Raffelt A, Cumming T, et al. Cortical thickness estimation in longitudinal stroke studies: a comparison of 3 measurement methods. NeuroImage Clin. (2015) 8:526–35. doi: 10.1016/j.nicl.2014.08.017
28. Gauthier L V, Taub E, Mark VW, Barghi A, Uswatte G. Atrophy of spared gray matter tissue predicts poorer motor recovery and rehabilitation response in chronic stroke. Stroke. (2012) 43:453–7. doi: 10.1161/STROKEAHA.111.633255
29. Sterr A, Dean PJA, Vieira G, Conforto AB, Shen S, Sato JR. Cortical thickness changes in the non-lesioned hemisphere associated with non-paretic arm immobilization in modified CI therapy. NeuroImage Clin. (2013) 2:797–803. doi: 10.1016/j.nicl.2013.05.005
30. Cai J, Ji Q, Xin R, Zhang D, Na X, Peng R, et al. Contralesional cortical structural reorganization contributes to motor recovery after sub-cortical stroke: a longitudinal voxel-based morphometry study. Front Hum Neurosci. (2016) 10:393. doi: 10.3389/fnhum.2016.00393
31. Liu G, Dang C, Peng K, Xie C, Chen H, Xing S, et al. Increased spontaneous neuronal activity in structurally damaged cortex is correlated with early motor recovery in patients with subcortical infarction. Eur J Neurol. (2015) 22:1540–7. doi: 10.1111/ene.12780
32. Rossini PM, Barker AT, Berardelli A, Caramia MD, Caruso G, Cracco RQ, et al. Non-invasive electrical and magnetic stimulation of the brain, spinal cord, roots and peripheral nerves: basic principles and procedures for routine clinical and research application: an updated report from an IFCN Committee. Clin Neurophysiol. (1994) 91:79–92. doi: 10.1016/0013-4694(94)90029-9
33. Han X, Jovicich J, Salat D, van der Kouwe A, Quinn B, Czanner S, et al. Reliability of MRI-derived measurements of human cerebral cortical thickness: The effects of field strength, scanner upgrade and manufacturer. Neuroimage. (2006) 32:180–94. doi: 10.1016/j.neuroimage.2006.02.051
34. Reuter M, Schmansky NJ, Rosas HD, Fischl B. Within-subject template estimation for unbiased longitudinal image analysis. Neuroimage. (2012) 61:1402–18. doi: 10.1016/j.neuroimage.2012.02.084
35. Greve DN, Van der Haegen L, Cai Q, Stufflebeam S, Sabuncu MR, Fischl B, et al. Surface-based analysis of language lateralization and cortical asymmetry. J Cogn Neurosci. (2013) 25:1477–92. doi: 10.1162/jocn_a_00405
36. Greve DN, Fischl B. False positive rates in surface-based anatomical analysis. Neuroimage. (2018) 171:6–14. doi: 10.1016/j.neuroimage.2017.12.072
37. Habas C. Functional connectivity of the human rostral and caudal cingulate motor areas in the brain resting state at 3T. Neuroradiology. (2010) 52:47–59. doi: 10.1007/s00234-009-0572-1
38. Beckmann M, Johansen-Berg H, Rushworth MFS. Connectivity-based parcellation of human cingulate cortex and its relation to functional specialization. J Neurosci. (2009) 29:1175–90. doi: 10.1523/JNEUROSCI.3328-08.2009
39. Chassagnon S, Minotti L, Kremer S, Hoffmann D, Kahane P. Somatosensory, motor, and reaching/grasping responses to direct electrical stimulation of the human cingulate motor areas: clinical article. J Neurosurg. (2008) 109:593–604. doi: 10.3171/JNS/2008/109/10/0593
40. Inman CS, James GA, Hamann S, Rajendra JK, Pagnoni G, Butler AJ. Altered resting-state effective connectivity of fronto-parietal motor control systems on the primary motor network following stroke. Neuroimage. (2012) 59:227–37. doi: 10.1016/j.neuroimage.2011.07.083
41. Schulz R, Buchholz A, Frey BM, Bönstrup M, Cheng B, Thomalla G, et al. Enhanced effective connectivity between primary motor cortex and intraparietal sulcus in well-recovered stroke patients. Stroke. (2016) 47:482–9. doi: 10.1161/STROKEAHA.115.011641
42. Picard N, Strick PL. Imaging the premotor areas. Curr Opin Neurobiol. (2001) 11:663–72. doi: 10.1016/S0959-4388(01)00266-5
43. Ward NS, Brown MM., Thompson a J, Frackowiak RSJ. Neural correlates of motor recovery after stroke: a longitudinal fMRI study. Brain. (2003) 126:2476–96. doi: 10.1093/brain/awg245
44. Li Y, Chen Z, Su X, Zhang X, Wang P, Zhu Y, et al. Functional lateralization in cingulate cortex predicts motor recovery after basal ganglia stroke. Neurosci Lett. (2016) 613:6–12. doi: 10.1016/j.neulet.2015.12.051
45. Rehme AK, Eickhoff SB, Rottschy C, Fink GR, Grefkes C. Activation likelihood estimation meta-analysis of motor-related neural activity after stroke. Neuroimage. (2012) 59:2771–82. doi: 10.1016/j.neuroimage.2011.10.023
46. Kraemer M, Schormann T, Hagemann G, Qi B, Witte OW, Seitz RJ. Delayed shrinkage of the brain after ischemic stroke: preliminary observations with voxel-guided morphometry. J Neuroimaging. (2004) 14:265–72. doi: 10.1111/j.1552-6569.2004.tb00249.x
47. Duering M, Righart R, Wollenweber FA, Zietemann V, Gesierich B, Dichgans M. Acute infarcts cause focal thinning in remote cortex via degeneration of connecting fiber tracts. Neurology. (2015) 84:1685–92. doi: 10.1212/WNL.0000000000001502
48. Welniarz Q, Dusart I, Roze E. The corticospinal tract: Evolution, development, and human disorders. Dev Neurobiol. (2017) 77:810–29. doi: 10.1002/dneu.22455
Keywords: gray matter, cortex, recovery, motor, MRI, cortical excitability
Citation: Graterol Pérez JA, Guder S, Choe C-u, Gerloff C and Schulz R (2022) Relationship Between Cortical Excitability Changes and Cortical Thickness in Subcortical Chronic Stroke. Front. Neurol. 13:802113. doi: 10.3389/fneur.2022.802113
Received: 26 October 2021; Accepted: 31 January 2022;
Published: 08 March 2022.
Edited by:
Rick M. Dijkhuizen, University Medical Center Utrecht, NetherlandsReviewed by:
Bruno J. Weder, University of Bern, SwitzerlandPhilipp Johannes Koch, University Medical Center Schleswig-Holstein, Germany
Copyright © 2022 Graterol Pérez, Guder, Choe, Gerloff and Schulz. This is an open-access article distributed under the terms of the Creative Commons Attribution License (CC BY). The use, distribution or reproduction in other forums is permitted, provided the original author(s) and the copyright owner(s) are credited and that the original publication in this journal is cited, in accordance with accepted academic practice. No use, distribution or reproduction is permitted which does not comply with these terms.
*Correspondence: Robert Schulz, rschulz@uke.de
†These authors have contributed equally to this work