 Zheng Jiang
 Xinran Xu
 Xiaojing Gu
 Ruwei Ou
 Xiaoyue Luo
 Huifang Shang
- Department of Neurology, West China Hospital, Sichuan University, Chengdu, China
Background: The causal relationship between serum lipid levels and the risk of Parkinson's disease (PD) remains largely uncertain. We summarized the existing controversial evidence on this topic.
Methods: We searched the electronic databases for observational studies from January 1988 to March 2020. We applied random-effects models to calculate pooled relative risk (RR) with their 95% confidence intervals (CI). Random-effects dose-response meta-analyses were further conducted to explore the dose-risk relationship.
Results: Twelve cohort studies and three case-control studies were included in this meta-analysis. Higher levels of serum low-density lipoprotein cholesterol (LDL-C) were inversely associated with the subsequent risk of PD (RR 0.73, 95% CI 0.57–0.93), whereas, there were no associations between serum levels of total cholesterol (TC) (RR 0.91, 95% CI 0.73–1.13), high-density lipoprotein cholesterol (HDL-C) (RR 0.97, 95% CI 0.73–1.27), or triglycerides (TG) (RR 0.85, 95% CI 0.55–1.29) and the risk of PD. Further dose-response meta-analysis revealed that every 38.6 mg/dL (1mmol/L) increase in serum LDL-C correlates with a 7% decreased risk of PD.
Conclusions: Our paper supports the protective effect of higher serum LDL-C on the subsequent risk of PD. More prospective cohort studies are warranted to confirm the conclusion, and further fundamental researches are needed to elucidate the underlying biological mechanisms.
Introduction
Parkinson's disease (PD) is a severe neurodegenerative disease, affecting 1% of the population above the age of 60 (1). While familial forms of PD represent 5–10% of total cases (2), the majority of PD patients are sporadic with unknown causes. Previous studies have found that lipids are involved in most classical PD-related processes, such as oxidative stress. Thus altered lipid metabolism may play an essential role in the pathogenesis of PD (3–5).
Clinically, disrupted lipid metabolism can lead to abnormal serum lipid levels of TC, LDL-C, HDL-C, and TG. However, the causal relationship between serum lipid levels and the risk of PD has not yet been determined. Since the first attempt in 1994 (6), many epidemiological studies have reported on this association, but results are inconsistent. For example, several studies have found a lower risk of PD with higher serum TC (7–9). Conversely, another two studies suggested a positive causal association (10, 11), while more studies failed to find a significant linkage (12–17). Similarly, studies on other serum lipid parameters, including LDL-C, HDL-C, and TG, have yielded controversial conclusions.
Although a meta-analysis in 2013 observed no association between serum cholesterol and the risk of PD (18), more rigorous studies are emerging to support an inverse causal association of them, by adopting a more robust study design and adjusting more crucial confounders (8, 13, 19). Furthermore, as a vital parameter of serum lipids, the relationship of serum TG and PD risk has never been debated in any quantitative review. In this paper, we performed random-effects meta-analyses to synthesize the published evidence linking serum lipids to the risk of PD, and dose-response meta-analyses were also conducted to explore the dose-risk relationship with available data for serum TC and LDL-C.
Methods
Literature Search
Our meta-analysis followed the Preferred Reporting Items for Systematic Reviews and Meta-analyses (PRISMA) statement (see Supplementary PRISMA 2009 Checklist) (20). The authors (ZJ and XRX) independently searched MEDLINE, EMBASE, ACP Journal Club, COCHRANE, and so on via OvidSP. Titles and abstracts in duplicate were subsequently browsed to screen studies satisfying retrieval strategies from January 1988 to March 2020 without language limitations (see Supplementary Table 1). We then retrieved all relevant articles based on consensus among authors. Bibliographies of included articles were checked.
Study Eligibility
Studies were included if they fulfilled the following criteria: (1) cohort or case-control study focusing on the association between serum lipid parameters (TC, LDL-C, HDL-C, and TG) and PD risk, (2) follow-up time>one year, and (3) providing information (blood samples or medical records or history of lipid-lowering agents) on serum lipid levels before PD onset. Exclusion criteria were as follows: (1) participants diagnosed as secondary parkinsonism or parkinsonism plus syndrome, or (2) studies lacking in risk estimates or without sufficient data to calculate them.
Data Extraction and Quality Assessment
Two authors (ZJ and XRX) independently extracted the following data from included studies: first author and publication year; study location; study design; cohort name; serum lipid parameters; data type; follow-up time; number of participants/person-years, number of cases(overall and for each category); age; outcome definition (relative risk[RR]/odds ratio[OR]/hazard ratio[HR]); covariates adjusted; levels of exposure, along with corresponding risk estimates and 95% CI for each category. Disagreements were settled by mutual discussion. If articles selected in this paper report concentrations of serum lipids by the International System of Units (SI), we converted those to conventional units with a conversion ratio of 38.6 (1 mg/dL = 0.0259 mmol/L) for TC, LDL-C, and HDL-C or 88.5 (1 mg/dL = 0.0113 mmol/L) for TG.
The Newcastle-Ottawa Scale (NOS) was used to evaluate the quality of the included observational studies (21). A rating of ≥seven stars was deemed of high quality, and < seven stars were of poor quality. Any discrepancy was resolved by involving an arbiter (RWO).
Statistical Analysis
Because PD is a relatively uncommon disease, HR or OR is considered to mathematically approximate RR (22). For high vs. low category meta-analysis, the DerSimonian and Laird random-effects models were executed to calculate pooled RRs and their 95% CIs (23). When some articles only provided divided RRs by gender for males and females, gender-specific RRs were combined by carrying out fixed-effects models for further analysis. Heterogeneity was assessed by Cochrane's Q test and I2 statistics, and a value of I2 above 50% or P < 0.1 indicated substantial heterogeneity (24). We performed subgroup analyses to search for the potential sources of heterogeneity. Publication bias was also explored by the funnel plot for at least ten available studies, together with Egger's test and Begg's test (P < 0.05). Sensitivity analysis was performed by removing one study at a time or switching analysis model to check the robustness of the results (25).
A dose-response meta-analysis was also performed to explore the dose-risk relationship between exposure and risk. The category serum lipid levels were determined as the mean or median value in each category if available for each study. For studies only gave the range in a category, the midpoint value was assigned for closed categories. In the case of open-ended highest or lowest category, the category serum lipid levels were equal to the lower or upper boundary plus or minus 1.5 folds the range of the closest category. When studies set the highest categories as the reference groups, we uniformly converted them to the lowest categories as needed (26). When the included studies just reported the number of total cases and overall person-years/participants, the distribution of cases and person-years/participants for each category was calculated using the methods proposed by Aune et al. (27)and Bekkering et al. (28). If researches only provided the number of cases and participants for each category, we could prudently estimate RRs and their 95% CIs using the methods raised by Bekkering et al. (28) and Orsini et al. (29) when necessary. We performed the random-effects dose-response meta-analysis by two steps (30–32). Step one: a restricted cubic spline model with three knots at the 25, 50, and 75% percentiles of the interval of exposure was estimated, and the two regression coefficients (three knots minus one) were calculated. Step two: we utilized a multivariate random-effects model to pool the variance/covariance matrix for each research. Non-linearity test was done by testing the null hypothesis, where the regression coefficient of the second spline equals zero.
All statistical analyses were performed using the software of Stata 12.0 (StataCorp, Texas, USA).
Results
Study Selection and Characteristics
Detailed information on the literature search could be seen from Figure 1. We obtained 1,728 articles from the electronic databases. Another two records were acquired by viewing the references of related reviews or meta-analyses. After the exclusion of 18 repeats, we began screening the titles and abstracts of the rest 1,712 papers and therefore excluded 1,640 items. The full text of the remaining 72 articles was read, leading to the inclusion of 15 articles for the high vs. low analysis (6–10, 12–15, 19, 33–37) and nine articles for the dose-response analysis (8–10, 12, 14, 19, 33–35).
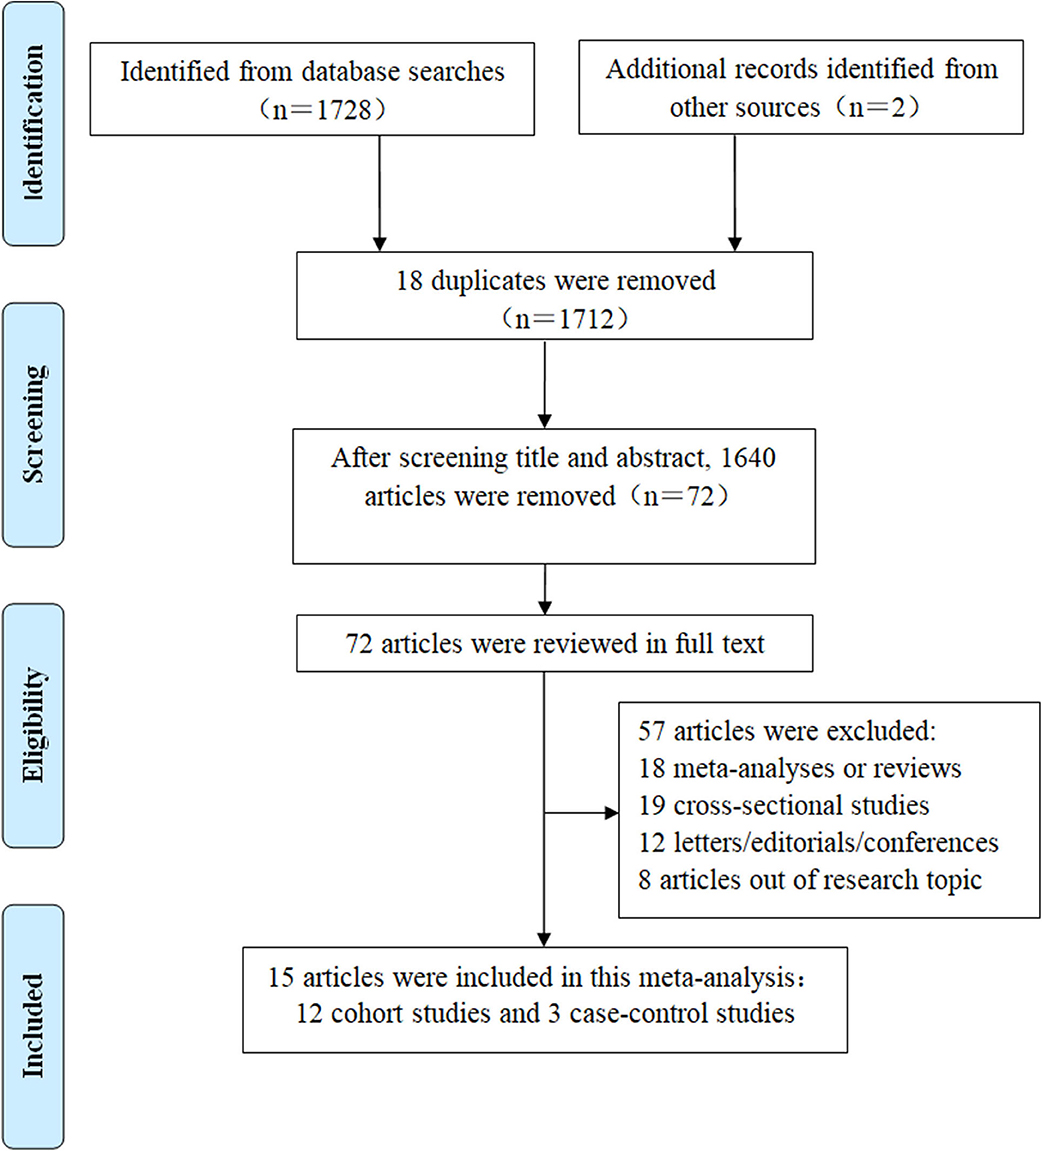
Figure 1. The flow chart for detailed steps of the literature search.
These 15 studies were published between 1994 and 2019. Three of the studies were performed primarily in Americas (9, 12, 15), five in Asia (6, 7, 19, 33, 36), and seven in Europe (8, 10, 13–15, 34, 35). A total of 49,956 cases were included. Thirteen studies included a mixed-gender population of males and females (7–10, 12–15, 19, 34–37); two studies only included males (6, 33). NOS scores ranged from five to nine (Table 1). We summarized the characteristics of the included studies in Supplementary Table 2A (for cohort studies) and Supplementary Table 2B (for case-control studies).
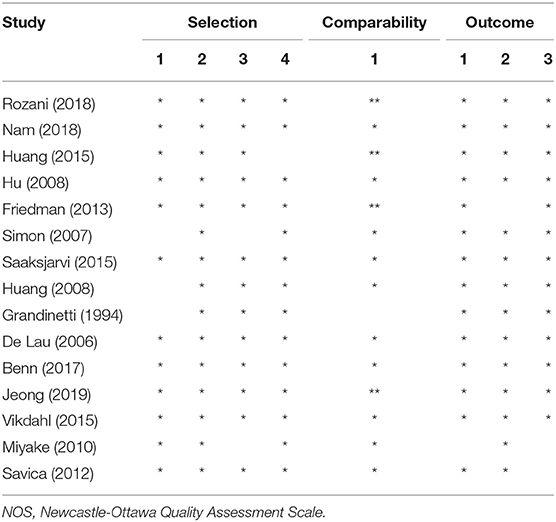
Table 1. Quality assessment of each eligible study according to the NOS.
Data Synthesis
Serum TC and Risk of PD
High vs. low category meta-analysis
For the TC group, eight cohort studies (6, 8–10, 12–14, 19) and three case-control studies (7, 15, 37) were included for the high vs. low analysis involving 4,215 cases. We failed to discover a significant association between serum TC and the risk of PD (RR 0.91, 95% CI 0.73–1.13; I2= 70.1%, P = 0.000) (Figure 2).
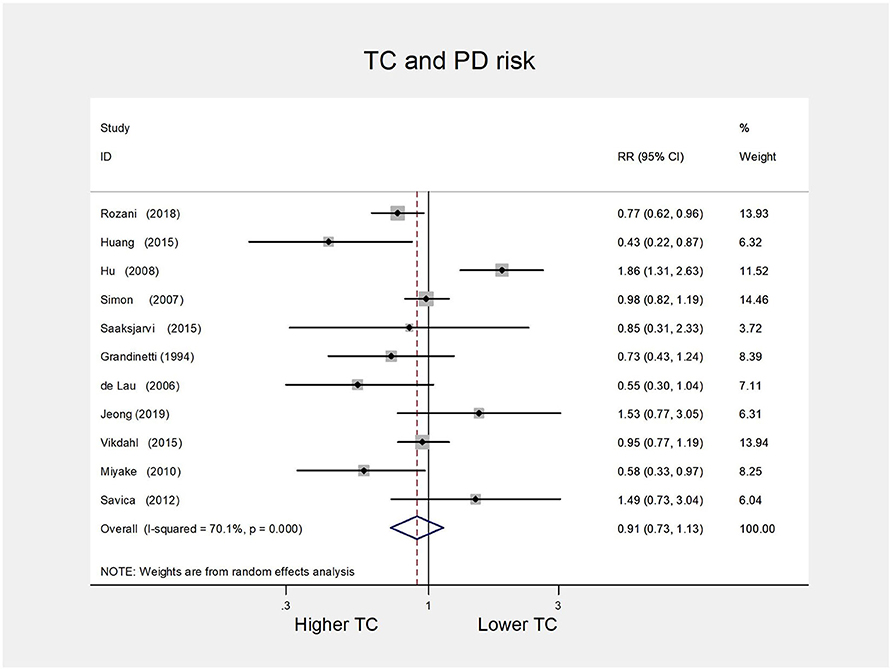
Figure 2. Forest plot presenting the pooled estimate effects (RR) on the relationship between serum TC levels and risk of PD. RR, relative risk; CI, confidence interval; TC, total cholesterol; PD, Parkinson's disease.
Subgroup analysis
In subgroup analyses by study location, study design, statin use, quality of study, and gender, overall pooled risk estimate remained non-significant, and no evidence of between-study heterogeneity was found (P interaction > 0.05) (Table 2).
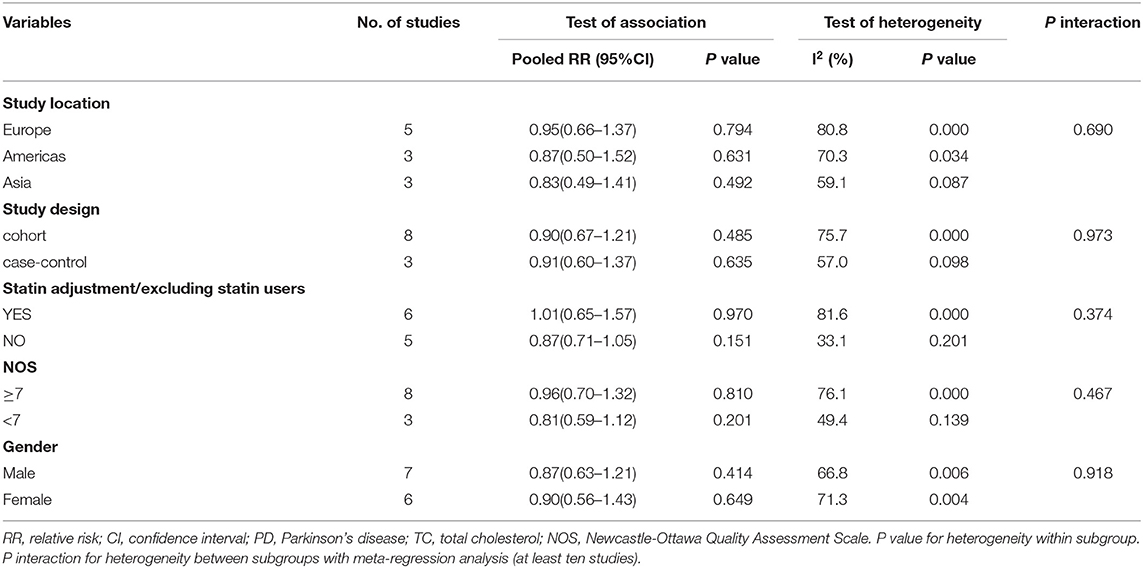
Table 2. Subgroup analyses (serum TC levels and PD risk).
Publication bias and sensitivity analysis
The funnel plot was visually asymmetry (Figure 3). However, neither Egger's test (P = 0.749) nor Begg's test (P = 0.876) detected publication bias. Sensitivity analysis results are in the range from 0.84(95% CI 0.70–1.00) to 0.96(95% CI 0.77–1.19) by deleting one related study each time, suggesting the stability of our meta-analysis.
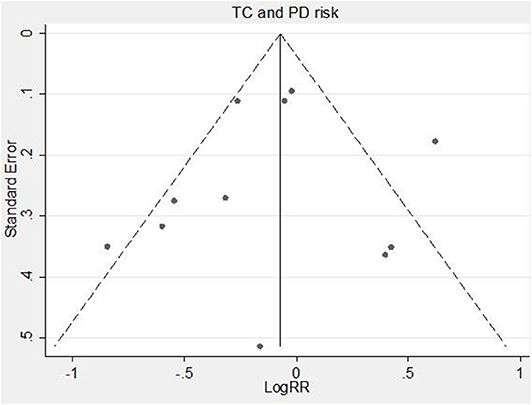
Figure 3. Funnel plot of serum TC levels and risk of PD. RR, relative risk; TC, total cholesterol; PD, Parkinson's disease.
Dose-response meta-analysis
Five cohort studies (8, 10, 12, 14, 19) were chosen for the dose-response analysis between serum TC and the risk of PD, involving 3,433 cases (Supplementary Table 3). Results revealed that the test for nonlinearity was not significant (P = 0.732), and there was no linear dose-risk relationship between them (P = 0.413) with substantial heterogeneity (P = 0.000) (Figure 4).
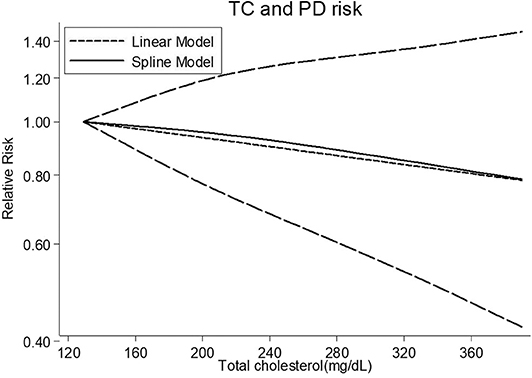
Figure 4. Dose-response relationship between serum TC levels and risk of PD. TC, total cholesterol; PD, Parkinson's disease.
Serum LDL-C and Risk of PD
High vs. low category meta-analysis
For the LDL-C group, five cohort studies (8, 9, 33–35) were included for the high vs. low analysis involving 2,406 cases. All five studies were of high quality (NOS scores ≥ 7). Our results implied that higher serum LDL-C could reduce the subsequent risk of PD (RR 0.73, 95% CI 0.57–0.93; I2= 52.2%, P = 0.079) (Figure 5).
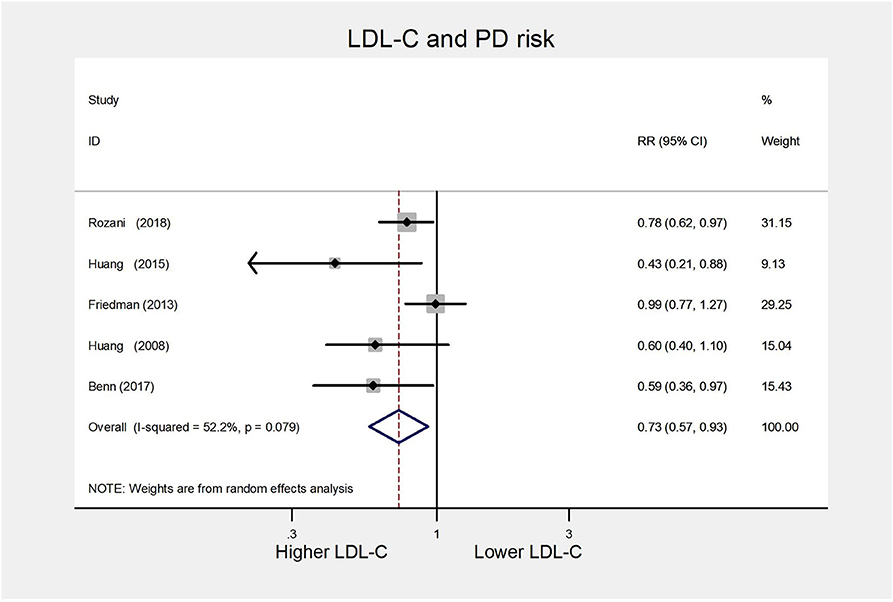
Figure 5. Forest plot presenting the pooled estimate effects(RR) on the relationship between serum LDL-C levels and risk of PD. RR, relative risk; CI, confidence interval; LDL-C, low-density lipoprotein cholesterol; PD, Parkinson's disease.
Subgroup analysis
In subgroup analyses according to study location, statin use, and gender, similar significant inverse relationships between serum LDL-C and PD risk were observed for studies confined to a location in Americas (RR 0.43, 95% CI 0.21–0.88), statin adjustment (RR 0.66, 95% CI 0.49–0.90), or male (RR 0.69, 95% CI 0.54–0.88). Besides, the substantial heterogeneity disappeared in the male group. We summarized the detailed results in Table 3.
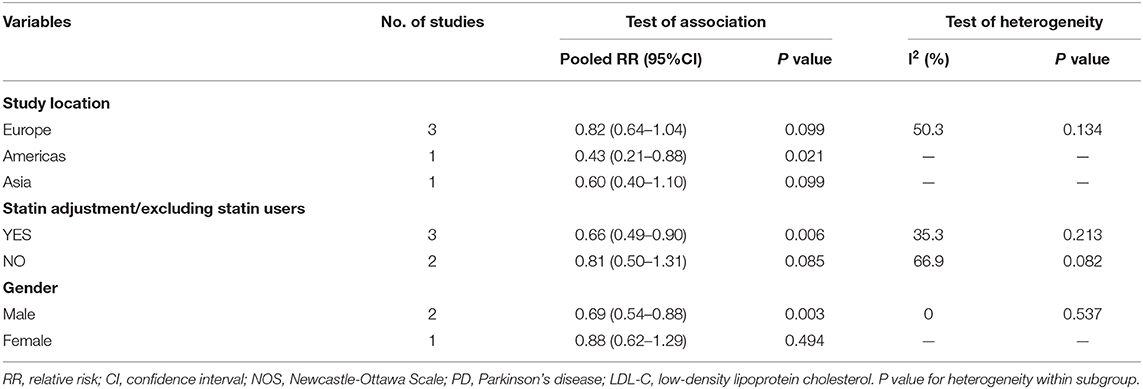
Table 3. Subgroup analyses (serum LDL-C levels and PD risk).
Publication bias and sensitivity analysis
Both Egger's test (P = 0.081) and Begg's test (P = 0.221) did not detect publication bias. Sensitivity analysis results were in the range from 0.67(95% CI 0.46–0.99) to 0.78(95% CI 0.62–0.98), suggesting that exclusion of any study did not substantially affect the pooled results. We also found a similar pooled result (RR 0.79 95% CI 0.68–0.91; I2= 52.2%, P = 0.079) using a fixed-effects model.
Dose-response meta-analysis
Four cohort studies (8, 33–35) were included for the dose-response analysis, involving 2,300 cases (Supplementary Table 4). There was no sign of departure from linearity (P = 0.666). The RR of PD per 38.6 mg/dL (1mmol/L) increase in serum LDL-C concentration was 0.93 (95% CI 0.88–0.99), with little heterogeneity in the dose-response analysis (P = 0.084) (Figure 6).
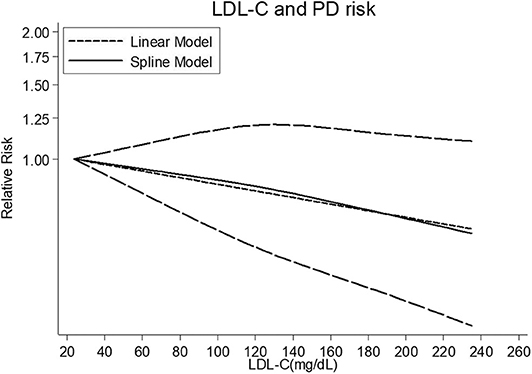
Figure 6. Dose-response relationship between serum LDL-C levels and risk of PD. LDL-C, low-density lipoprotein cholesterol; PD, Parkinson's disease.
Serum HDL-C and Risk of PD
High vs. low category meta-analysis
For the HDL-C group, we included five cohort studies (8, 9, 13, 14, 36) for the high vs. low analysis involving 45,251 cases. The summary RR was 0.97(95% CI 0.73–1.27; I2= 74.5%, P = 0.003) (Figure 7), suggesting the lack of association between serum HDL-L and PD risk.
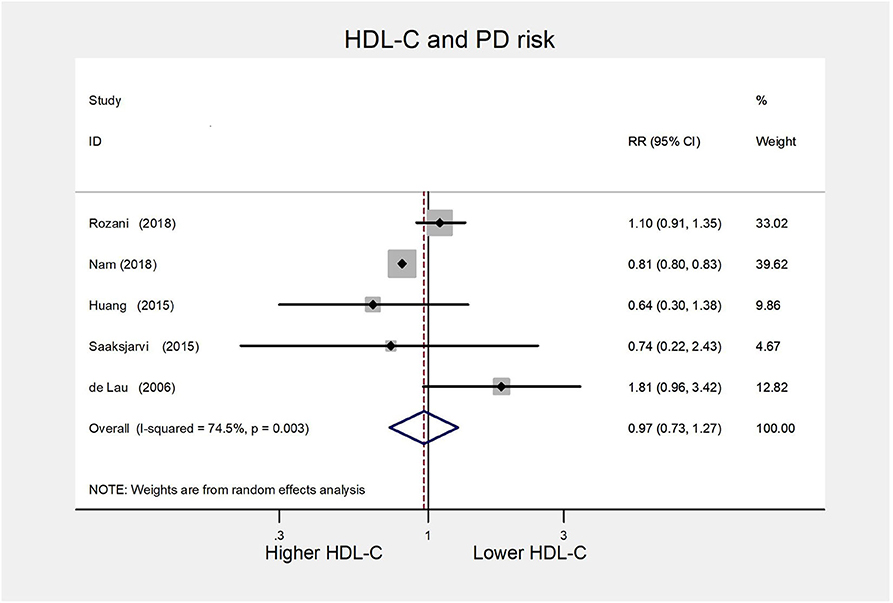
Figure 7. Forest plot presenting the pooled estimate effects(RR) on the relationship between serum HDL-C levels and risk of PD. RR, relative risk; CI, confidence interval; HDL-C, high-density lipoprotein cholesterol; PD, Parkinson's disease.
Subgroup analysis
As all included studies were of high quality, we conducted subgroup analyses following study location, statin use, and gender. The pooled risk estimate remained non-significant, and between-study heterogeneity decreased in either Europe or the male group (Supplementary Table 5).
Publication bias and sensitivity analysis
There was no indication of publication bias assessed with Egger's test (P = 0.308) and Begg's test (P = 1.000). Sensitivity analysis results range from 0.89 (95% CI 0.70–1.13) to 1.08 (95% CI 0.76–1.55) by omitting one study in order, confirming that the original results were reliable.
Serum TG and Risk of PD
High vs. low category meta-analysis
For the TG group, we obtained three cohort studies (9, 13, 36) and one case-control study (15) for the high vs. low analysis involving 44,484 cases. As presented in Figure 8, the combined RR was 0.85 (95% CI 0.55–1.29) with evidence of substantial heterogeneity (I2= 77.6%, P = 0.004). Due to limited included studies, we could not perform subgroup analysis and evaluate publication bias.
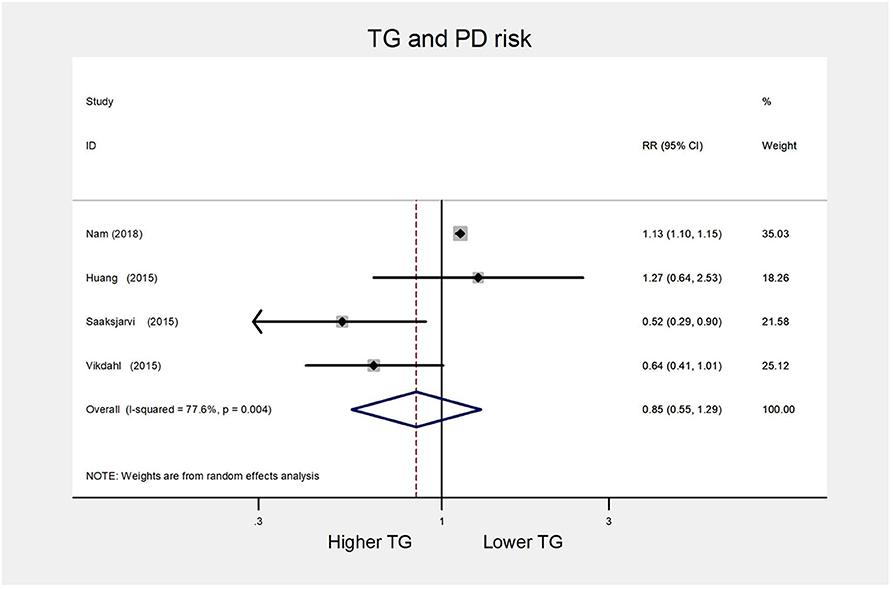
Figure 8. Forest plot presenting the pooled estimate effects(RR) on the relationship between serum TG levels and risk of PD. RR, relative risk; CI, confidence interval; TG, triglycerides; PD, Parkinson's disease.
Sensitivity analysis
Sensitivity analyses indicated little change in the pooled RR when any study was removed (data not shown).
Discussion
In this meta-analysis, we summarized the current evidence on the association between serum lipid parameters and the risk of PD, and thus provides a unique perspective to evaluate the effects of different serum lipid parameters on PD risk. There are some notable strengths deserving mention. Firstly, four serum lipid parameters, including TC, LDL-C, HDL-C, and TG, were included in a quantitative review to investigate their effects on PD risk for the first time. Secondly, the strict inclusion criterion of providing information on serum lipid levels before PD onset avoided the possibility of reverse causality from abnormal lipid profile induced by PD. Thirdly, both the high vs. low analysis and dose-response analysis were conducted, which ensures the reliability of the outcome.
In the high vs. low analysis, we found that the exposure of higher serum LDL-C levels may decrease the future risk of PD, which is consistent with the previous data on the association between serum LDL-C and PD risk (8, 9, 11, 17, 35). There was also a significant inverse linear dose-risk relationship that each 38.6 mg/dL(1 mmol/L) increase in serum LDL-C was associated with a 7% relative reduction in PD risk. Meanwhile, our result is different from that of the earlier meta-analysis conducted by Sheng et al. (38). They systematically reviewed three cohort studies and found that the high baseline levels of serum LDL-C was not significantly associated with the risk of PD (RR 0.58, 95% CI 0.31–1.07; P = 0.080). However,the small number of included studies, as well as significant heterogeneity (I2= 71%) in their meta-analysis, indicated their result was unreliable and unstable. In addition, no significant association between serum TC and PD risk in the high vs. low analysis or dose-response analysis was observed, which was in line with the prior finding by Gudala et al. (18). For other serum lipid parameters of HDL-C and TG, we were unable to note a significant relationship between them and PD risk.
Multiple lines of biological evidence responsible for the inverse linkage between serum cholesterol and PD risk have been found. Some rodent experiments supported the protective role of cholesterol precursors in the pathogenesis of PD. For example, squalene might save the striatal neurons from toxic effects caused by 6-hydroxydopamine (39), and lanosterol could protect dopaminergic neurons in the substantia nigra from dying induced by 1-methyl-4-phenyl-1,2,3,6-tetrahydropyridine (40). Furthermore, high plasma cholesterol could be a marker of coenzyme Q10, a molecule serving as a crucial endogenous anti-oxidant as well as an essential electron acceptor of mitochondrial respiratory chain complexes I and II (41, 42). Its potential neuroprotective effects had been demonstrated in vitro studies and animal models of PD (43). Besides, lower serum cholesterol levels have been identified as potential markers of several prodromal symptoms of PD before diagnosis, such as constipation (44), olfactory dysfunction (45), depression, and reduced activity, which might affect serum cholesterol levels (46, 47).
In contrast, some hypotheses support a positive relationship between serum cholesterol levels and PD risk. As is generally recognized, abnormal intracellular aggregation of α-synuclein has an etiological role in the occurrence and development of PD (48). Elevated serum cholesterol could accelerate the pathological process of α-synuclein. Cholesterol seems to involve in α-synuclein accumulation (49, 50) and aggregation (51) and induces α-synuclein to form pores (52, 53). Moreover, some studies have provided evidence that overweight is associated with an increased PD risk (54–56). Another study suggested that body mass index positively correlated with serum cholesterol levels (10). So we suspect that high serum cholesterol might contribute to the occurrence of PD partly through excessive body weight.
While exploring serum lipids in relation to the risk of PD, we should draw more attention to the confounding effect of lipid-lowering drugs on this association. Statins are cholesterol-lowering drugs widely prescribed to prevent and treat cardiovascular and cerebrovascular diseases. Some studies indicated that statins might have anti-inflammation activity (57) and slow down the intraneuronal aggregation of α-synuclein in vitro and in vivo experiments (51, 58). Furthermore, two recent meta-analyses (38, 59) suggested that statin use was associated with reduced PD risk. Nonetheless, most of the studies examining the relationship between serum lipids and PD risk overlooked the potential confounding effect of statins. The above, coupled with the tendency to use statins for those with hypercholesterolemia, make it difficult to ascertain whether higher serum cholesterol is the protective factor of PD. Therefore, in the high vs. low analysis assessing serum LDL-C in relation to PD risk, subgroup analyses stratified by statin use were performed to exclude the potential confounding effect. The inverse association between serum LDL-C and PD risk remained significant with adjustment for statin use. However, the association became non-significant without adjustment for statin use, indicating that the confounding factor of statin use could possibly underestimate the protective effect of higher serum LDL-C on PD risk.
For this paper, we should consider several limitations. Firstly, as mentioned before, altered serum lipid levels might represent a prodromal symptom of PD. Without taking into consideration the duration of the prodromal period, while still challenging to ascertain, we include the studies using data of serum lipid levels measured just before the onset of PD, which might make the results somewhat biased. Secondly, a limited number of the included studies for the relationship between serum TG and PD risk urges us to interpret its negative results with caution. Thirdly, there are some missing data in the dose-response analysis, and the approximate values inferred by existing methods may not be accurate, so the results of the dose-risk relationship might demand more sufficient data.
Conclusion
Our meta-analysis showed that higher serum LDL-C might be a protective factor for PD and somehow reduce the future risk of PD. From an overall perspective, the protective effect of high serum LDL-C on PD risk attends to trifles and neglects essentials. After all, the increasing threat of cardiovascular and cerebrovascular events induced by hypercholesterolemia is a major public health concern. However, this study still has some implications for exploring the role of cholesterol in the pathogenesis of PD.
Data Availability Statement
All datasets generated for this study are included in the article/Supplementary Material.
Author Contributions
ZJ, XX, and RO designed the study and did the literature review. ZJ did the statistical analysis, edited tables and pictures, and wrote the primary manuscript. XG contributed to revising the grammar. XL helped to promote the methodology. HS and WS reviewed the final manuscript. All authors contributed to the article and approved the submitted version.
Funding
This study was supported by the Basic Research Key Project of National Clinical Research Center for Geriatrics, West China Hospital, Sichuan University (No. Z2018B08).
Conflict of Interest
The authors declare that the research was conducted in the absence of any commercial or financial relationships that could be construed as a potential conflict of interest.
Supplementary Material
The Supplementary Material for this article can be found online at: https://www.frontiersin.org/articles/10.3389/fneur.2020.00597/full#supplementary-material
References
1. Tysnes O-B, Storstein A. Epidemiology of Parkinson's disease. J Neural Trans. (2017) 124:901–5. doi: 10.1007/s00702-017-1686-y
2. Deng H, Wang P, Jankovic J. The genetics of Parkinson disease. Ageing Res Rev. (2018) 42:72–85. doi: 10.1016/j.arr.2017.12.007
3. Houlden H, Singleton AB. The genetics and neuropathology of Parkinson's disease. Acta Neuropathol. (2012) 124:325–38. doi: 10.1007/s00401-012-1013-5
4. Nichols WC, Pankratz N, Marek DK, Pauciulo MW, Elsaesser VE, Halter CA, et al. Mutations in GBA are associated with familial Parkinson disease susceptibility and age at onset. Neurology. (2009) 72:310–6. doi: 10.1212/01.wnl.0000327823.81237.d1
5. Mallett V, Ross JP, Alcalay RN, Ambalavanan A, Sidransky E, Dion PA, et al. GBA p.T369M substitution in Parkinson disease: Polymorphism or association? A meta-analysis. Neurol Genet. (2016) 2:e104. doi: 10.1212/NXG.0000000000000104
6. Grandinetti A, Morens DM, Reed D, MacEachern D. Prospective study of cigarette smoking and the risk of developing idiopathic Parkinson's disease. Am J Epidemiol. (1994) 139:1129–38. doi: 10.1093/oxfordjournals.aje.a116960
7. Miyake Y, Tanaka K, Fukushima W, Sasaki S, Kiyohara C, Tsuboi Y, et al. Case-control study of risk of Parkinson's disease in relation to hypertension, hypercholesterolemia, and diabetes in Japan. J Neurol Sci. (2010) 293:82-6. doi: 10.1016/j.jns.2010.03.002
8. Rozani V, Gurevich T, Giladi N, El-Ad B, Tsamir J, Hemo B, et al. Higher serum cholesterol and decreased Parkinson's disease risk: A statin-free cohort study. Mov Disord. (2018) 33:1298–305. doi: 10.1002/mds.27413
9. Huang X, Alonso A, Guo X, Umbach DM, Lichtenstein ML, Ballantyne CM, et al. Statins, plasma cholesterol, and risk of Parkinson's disease: a prospective study. Movement Disorders. (2015) 30:552–9. doi: 10.1002/mds.26152
10. Hu G, Antikainen R, Jousilahti P, Kivipelto M, Tuomilehto J. Total cholesterol and the risk of Parkinson disease. Neurology. (2008) 70:1972–9. doi: 10.1212/01.wnl.0000312511.62699.a8
11. Singh NK, Banerjee BD, Bala K, Mitrabasu, Dung Dung AA, Chhillar N. APOE and LRPAP1 gene polymorphism and risk of Parkinson's disease. Neurol Sci. (2014) 35:1075-81. doi: 10.1007/s10072-014-1651-6
12. Simon KC, Chen H, Schwarzschild M, Ascherio A. Hypertension, hypercholesterolemia, diabetes, and risk of Parkinson disease. Neurology. (2007) 69:1688–95. doi: 10.1212/01.wnl.0000271883.45010.8a
13. Saaksjarvi K, Knekt P, Mannisto S, Lyytinen J, Heliovaara M. Prospective study on the components of metabolic syndrome and the incidence of Parkinson's disease. Parkinson Related Disord. (2015) 21:1148–55. doi: 10.1016/j.parkreldis.2015.07.017
14. de Lau LM, Koudstaal PJ, Hofman A, Breteler MM. Serum cholesterol levels and the risk of Parkinson's disease. Am J Epidemiol. (2006) 164:998–1002. doi: 10.1093/aje/kwj283
15. Vikdahl M, Backman L, Johansson I, Forsgren L, Haglin L. Cardiovascular risk factors and the risk of Parkinson's disease. Eur J Clin Nutr. (2015) 69:729–33. doi: 10.1038/ejcn.2014.259
16. Scigliano G, Musicco M, Soliveri P, Piccolo I, Ronchetti G, Girotti F. Reduced risk factors for vascular disorders in Parkinson disease patients: a case-control study. Stroke. (2006) 37:1184-8. doi: 10.1161/01.STR.0000217384.03237.9c
17. Huang X, Chen H, Miller WC, Mailman RB, Woodard JL, Chen PC, et al. Lower low-density lipoprotein cholesterol levels are associated with Parkinson's disease. Mov Disord. (2007) 22:377-81. doi: 10.1002/mds.21290
18. Gudala K, Bansal D, Muthyala H. Role of serum cholesterol in Parkinson's disease: a meta-analysis of evidence. J Parkinsons Dis Print. (2013) 3:363–70. doi: 10.3233/JPD-130196
19. Jeong SM, Jang W, Shin DW. Association of statin use with Parkinson's disease: Dose-response relationship. Mov Disord. (2019) 34:1014–21. doi: 10.1002/mds.27681
20. Moher D, Liberati A, Tetzlaff J, Altman DG, Group P. Preferred reporting items for systematic reviews and meta-analyses: the PRISMA statement. BMJ. (2009) 339:b2535. doi: 10.1136/bmj.b2535
21. Stang A. Critical evaluation of the Newcastle-Ottawa scale for the assessment of the quality of nonrandomized studies in meta-analyses. Eur J Epidemiol. (2010) 25:603–5. doi: 10.1007/s10654-010-9491-z
22. Greenland S. Quantitative methods in the review of epidemiologic literature. Epidemiol Rev. (1987) 9:1–30. doi: 10.1093/oxfordjournals.epirev.a036298
23. DerSimonian R, Laird N. Meta-analysis in clinical trials. Control Clin Trials. (1986) 7:177–88. doi: 10.1016/0197-2456(86)90046-2
24. Higgins JP, Thompson SG, Deeks JJ, Altman DG. Measuring inconsistency in meta-analyses. BMJ. (2003) 327:557–60. doi: 10.1136/bmj.327.7414.557
25. Tobias A. Assessing the influence of a single study in the meta-analysis estimate. Stata Techn Bull. (1999) 8:15–7.
26. Hamling J, Lee P, Weitkunat R, Ambuhl M. Facilitating meta-analyses by deriving relative effect and precision estimates for alternative comparisons from a set of estimates presented by exposure level or disease category. Stat Med. (2008) 27:954–70. doi: 10.1002/sim.3013
27. Aune D, Chan DS, Lau R, Vieira R, Greenwood DC, Kampman E, et al. Dietary fibre, whole grains, and risk of colorectal cancer: systematic review and dose-response meta-analysis of prospective studies. BMJ. (2011) 343:d6617. doi: 10.1136/bmj.d6617
28. Bekkering GE, Harris RJ, Thomas S, Mayer AM, Beynon R, Ness AR, et al. How much of the data published in observational studies of the association between diet and prostate or bladder cancer is usable for meta-analysis? Am J Epidemiol. (2008) 167:1017–26. doi: 10.1093/aje/kwn005
29. Orsini N. From floated to conventional confidence intervals for the relative risks based on published dose-response data. Comput Methods Programs Biomed. (2010) 98:90–3. doi: 10.1016/j.cmpb.2009.11.005
30. Greenland S, Longnecker MP. Methods for trend estimation from summarized dose-response data, with applications to meta-analysis. Am J Epidemiol. (1992) 135:1301–9. doi: 10.1093/oxfordjournals.aje.a116237
31. Orsini N, Bellocco R, Greenland S. Generalized least squares for trend estimation of summarized dose-response data. Stata J. (2006) 6:40–57. doi: 10.1177/1536867X0600600103
32. Orsini N, Li R, Wolk A, Khudyakov P, Spiegelman D. Meta-analysis for linear and nonlinear dose-response relations: examples, an evaluation of approximations, and software. Am J Epidemiol. (2012) 175:66–73. doi: 10.1093/aje/kwr265
33. Huang X, Abbott RD, Petrovitch H, Mailman RB, Ross GW. Low LDL cholesterol and increased risk of Parkinson's disease: prospective results from Honolulu-Asia Aging Study. Mov Disord. (2008) 23:1013–8. doi: 10.1002/mds.22013
34. Friedman B, Lahad A, Dresner Y, Vinker S. Long-term statin use and the risk of Parkinson's disease. Am J Manag Care. (2013) 19:626-32.
35. Benn M, Nordestgaard BG, Frikke-Schmidt R, Tybjaerg-Hansen A. Low LDL cholesterol, PCSK9 and HMGCR genetic variation, and risk of Alzheimer's disease and Parkinson's disease: Mendelian randomisation study. BMJ. (2017) 357:j1648. doi: 10.1136/bmj.j1648
36. Nam GE, Kim SM, Han K, Kim NH, Chung HS, Kim JW, et al. Metabolic syndrome and risk of Parkinson disease: A nationwide cohort study. PLoS Med. (2018) 15:e1002640. doi: 10.1371/journal.pmed.1002640
37. Savica R, Grossardt BR, Ahlskog JE, Rocca WA. Metabolic markers or conditions preceding Parkinson's disease: a case-control study. Mov Disord. (2012) 27:974–9. doi: 10.1002/mds.25016
38. Sheng Z, Jia X, Kang M. Statin use and risk of Parkinson's disease: A meta-analysis. Behav Brain Res. (2016) 309:29-34. doi: 10.1016/j.bbr.2016.04.046
39. Kabuto H, Yamanushi TT, Janjua N, Takayama F, Mankura M. Effects of squalene/squalane on dopamine levels, antioxidant enzyme activity, and fatty acid composition in the striatum of Parkinson's disease mouse model. J Oleo Sci. (2013) 62:21–8. doi: 10.5650/jos.62.21
40. Roy A, Ghosh A, Jana A, Liu X, Brahmachari S, Gendelman HE, et al. Sodium phenylbutyrate controls neuroinflammatory and antioxidant activities and protects dopaminergic neurons in mouse models of Parkinson's disease. PLoS ONE. (2012) 7:e38113. doi: 10.1371/journal.pone.0038113
41. Kaikkonen J, Nyyssonen K, Tuomainen TP, Ristonmaa U, Salonen JT. Determinants of plasma coenzyme Q10 in humans. FEBS Lett. (1999) 443:163–6. doi: 10.1016/S0014-5793(98)01712-8
42. Beal MF. Mitochondrial dysfunction and oxidative damage in Alzheimer's and Parkinson's diseases and coenzyme Q10 as a potential treatment. J Bioenerg Biomembr. (2004) 36:381–6. doi: 10.1023/B:JOBB.0000041772.74810.92
43. Sikorska M, Lanthier P, Miller H, Beyers M, Sodja C, Zurakowski B, et al. Nanomicellar formulation of coenzyme Q10 (Ubisol-Q10) effectively blocks ongoing neurodegeneration in the mouse 1-methyl-4-phenyl-1,2,3,6-tetrahydropyridine model: potential use as an adjuvant treatment in Parkinson's disease. Neurobiol Aging. (2014) 35:2329–46. doi: 10.1016/j.neurobiolaging.2014.03.032
44. Savica R, Carlin JM, Grossardt BR, Bower JH, Ahlskog JE, Maraganore DM, et al. Medical records documentation of constipation preceding Parkinson disease: A case-control study. Neurology. (2009) 73:1752–8. doi: 10.1212/WNL.0b013e3181c34af5
45. Doty RL. Olfactory dysfunction in Parkinson disease. Nat Rev Neurol. (2012) 8:329–39. doi: 10.1038/nrneurol.2012.80
46. Barichella M, Cereda E, Cassani E, Pinelli G, Iorio L, Ferri V, et al. Dietary habits and neurological features of Parkinson's disease patients: Implications for practice. Clin Nutr. (2017) 36:1054–61. doi: 10.1016/j.clnu.2016.06.020
47. Aden E, Carlsson M, Poortvliet E, Stenlund H, Linder J, Edstrom M, et al. Dietary intake and olfactory function in patients with newly diagnosed Parkinson's disease: a case-control study. Nutr Neurosci. (2011) 14:25–31. doi: 10.1179/174313211X12966635733312
48. Wegrzynowicz M, Bar-On D, Calo L, Anichtchik O, Iovino M, Xia J, et al. Depopulation of dense alpha-synuclein aggregates is associated with rescue of dopamine neuron dysfunction and death in a new Parkinson's disease model. Acta Neuropathol. (2019) 138:575–95. doi: 10.1007/s00401-019-02023-x
49. Eriksson I, Nath S, Bornefall P, Giraldo AMV, Ollinger K. Impact of high cholesterol in a Parkinson's disease model: Prevention of lysosomal leakage vs. stimulation of alpha-synuclein aggregation. Eur J Cell Biol. (2017) 96:99–109. doi: 10.1016/j.ejcb.2017.01.002
50. Murphy KE, Gysbers AM, Abbott SK, Spiro AS, Furuta A, Cooper A, et al. Lysosomal-associated membrane protein 2 isoforms are differentially affected in early Parkinson's disease. Mov Disord. (2015) 30:1639–47. doi: 10.1002/mds.26141
51. Bar-On P, Crews L, Koob AO, Mizuno H, Adame A, Spencer B, et al. Statins reduce neuronal alpha-synuclein aggregation in in vitro models of Parkinson's disease. J Neurochem. (2008) 105:1656–67. doi: 10.1111/j.1471-4159.2008.05254.x
52. Di Scala C, Yahi N, Boutemeur S, Flores A, Rodriguez L, Chahinian H, et al. Common molecular mechanism of amyloid pore formation by Alzheimer's beta-amyloid peptide and alpha-synuclein. Sci Rep. (2016) 6:28781. doi: 10.1038/srep28781
53. Fantini J, Yahi N. The driving force of alpha-synuclein insertion and amyloid channel formation in the plasma membrane of neural cells: key role of ganglioside- and cholesterol-binding domains. Adv Exp Med Biol. (2013) 991:15–26. doi: 10.1007/978-94-007-6331-9_2
54. Saaksjarvi K, Knekt P, Mannisto S, Lyytinen J, Jaaskelainen T, Kanerva N, et al. Reduced risk of Parkinson's disease associated with lower body mass index and heavy leisure-time physical activity. Eur J Epidemiol. (2014) 29:285–92. doi: 10.1007/s10654-014-9887-2
55. Hu G, Jousilahti P, Nissinen A, Antikainen R, Kivipelto M, Tuomilehto J. Body mass index and the risk of Parkinson disease. Neurology. (2006) 67:1955–9. doi: 10.1212/01.wnl.0000247052.18422.e5
56. Abbott RD, Ross GW, White LR, Nelson JS, Masaki KH, Tanner CM, et al. Midlife adiposity and the future risk of Parkinson's disease. Neurology. (2002) 59:1051–7. doi: 10.1212/WNL.59.7.1051
57. Yan J, Xu Y, Zhu C, Zhang L, Wu A, Yang Y, et al. Simvastatin prevents dopaminergic neurodegeneration in experimental parkinsonian models: the association with anti-inflammatory responses. PLoS ONE. (2011) 6:e20945. doi: 10.1371/journal.pone.0020945
58. Koob AO, Ubhi K, Paulsson JF, Kelly J, Rockenstein E, Mante M, et al. Lovastatin ameliorates alpha-synuclein accumulation and oxidation in transgenic mouse models of alpha-synucleinopathies. Exp Neurol. (2010) 221:267-74. doi: 10.1016/j.expneurol.2009.11.015
Keywords: Parkinson's disease, cholesterol, triglyceride, systematic review, meta-analysis
Citation: Jiang Z, Xu X, Gu X, Ou R, Luo X, Shang H and Song W (2020) Effects of Higher Serum Lipid Levels on the Risk of Parkinson's Disease: A Systematic Review and Meta-Analysis. Front. Neurol. 11:597. doi: 10.3389/fneur.2020.00597
Received: 16 November 2019; Accepted: 22 May 2020;
Published: 26 June 2020.
Edited by:
Alain Kaelin-Lang, Neurocenter of Southern Switzerland, SwitzerlandReviewed by:
Chien Tai Hong, Taipei Medical University, TaiwanZhong Pei, Sun Yat-sen University, China
Copyright © 2020 Jiang, Xu, Gu, Ou, Luo, Shang and Song. This is an open-access article distributed under the terms of the Creative Commons Attribution License (CC BY). The use, distribution or reproduction in other forums is permitted, provided the original author(s) and the copyright owner(s) are credited and that the original publication in this journal is cited, in accordance with accepted academic practice. No use, distribution or reproduction is permitted which does not comply with these terms.
*Correspondence: Huifang Shang, hfshang2002@126.com; Wei Song, wchneuro_songwei@163.com