Brain specificity of diffuse optical imaging: improvements from superficial signal regression and tomography
- 1 Department of Radiology, Washington University in St. Louis, MO, USA
- 2 Department of Physics, Washington University in St. Louis, MO, USA
- 3 The Institute of Optics, University of Rochester, Rochester, NY, USA
- 4 Department of Biomedical Engineering, Washington University in St. Louis, MO, USA
Functional near infrared spectroscopy (fNIRS) is a portable monitor of cerebral hemodynamics with wide clinical potential. However, in fNIRS, the vascular signal from the brain is often obscured by vascular signals present in the scalp and skull. In this paper, we evaluate two methods for improving in vivo data from adult human subjects through the use of high-density diffuse optical tomography (DOT). First, we test whether we can extend superficial regression methods (which utilize the multiple source–detector pair separations) from sparse optode arrays to application with DOT imaging arrays. In order to accomplish this goal, we modify the method to remove physiological artifacts from deeper sampling channels using an average of shallow measurements. Second, DOT provides three-dimensional image reconstructions and should explicitly separate different tissue layers. We test whether DOT’s depth-sectioning can completely remove superficial physiological artifacts. Herein, we assess improvements in signal quality and reproducibility due to these methods using a well-characterized visual paradigm and our high-density DOT system. Both approaches remove noise from the data, resulting in cleaner imaging and more consistent hemodynamic responses. Additionally, the two methods act synergistically, with greater improvements when the approaches are used together.
Introduction
Recent successes using functional near infrared spectroscopy (fNIRS) (Hebden, 2003; Yodh and Boas, 2003; Steinbrink et al., 2006) to study neonatal auditory and language development (Gervain et al., 2008; Saito et al., 2009) and pain responses (Bartocci et al., 2006) highlight the promise of extending fNIRS neuroimaging into populations that are difficult to scan with functional magnetic resonance imaging (fMRI). fNIRS uses near infrared sources and detectors to measure changes in absorption due neurovascular dynamics in response to brain activation, which allows a combination of portable instrumentation, wearable imaging caps, and more comprehensive hemodynamic imaging contrasts. These advantages make fNIRS ideally suited for a range of neuroscience applications in comparison with fMRI (Hebden, 2003; Yodh and Boas, 2003; Steinbrink et al., 2006). Nonetheless, limitations in brain specificity have prevented the technique from performing sophisticated cognitive neuroimaging studies that have become common in fMRI. As instrumentation has improved, the primary source of noise in fNIRS is physiological, arising from hemodynamics unrelated to the desired neural paradigm. While such spurious signals also exist in fMRI, their effect is exacerbated in fNIRS, since every measurement consists of light that has traveled from an extra-cranial source, through the scalp and skull, into the brain, and back out through the scalp and skull to reach a detector. Measurements therefore not only contain confounding signals from systemic sources, but also from hemodynamics localized to the superficial tissue layers. Even when combined into sparse (∼3 cm) grids for topographic imaging, NIRS continuous-wave measurement systems have poor spatial sampling and are ill-equipped to discriminate these noise sources (Klaessens et al., 2005; Davis et al., 2006).
Though not yet widely used, progress with diffuse optical tomography (DOT) techniques has begun to provide higher functional neuroimaging performance than fNIRS while maintaining simple instrumentation (Benaron et al., 2000; Bluestone et al., 2001; Hebden et al., 2002; Hebden, 2003; Gibson et al., 2006; Joseph et al., 2006; Zeff et al., 2007; Wylie et al., 2009; White and Culver, 2010a,b). High-density DOT systems sample many source–detector pairs (SD-pairs) at multiple separations. The depth sensitivity of the measurements varies with the source–detector distance: closely spaced SD-pairs sample shallowly, while more widely spaced pairs penetrate deeply. This feature supports two methods for increasing the ability to discriminate signals arising from the brain. First, source–detector distances can be chosen such that some measurements are preferentially sensitive to scalp, skull, and systemic hemodynamic fluctuations, while others sample into the brain. Shallow measurements are then assumed to be a measure of the superficial and systemic noise and can be regressed from deeper pairs. The regressed data should produce a more accurate measure of hemodynamic trends unique to the brain (Saager and Berger, 2005, 2008). Second, overlapping measurements allow tomographic image reconstruction techniques (Barbour et al., 1990; Arridge, 1999; Yodh and Boas, 2003), resulting in an image of hemodynamic changes throughout a three-dimensional volume of the head, spatially separating contributions from deep and shallow sources.
Despite the conceptual illustrations of DOT’s feasibility for neuroimaging and the knowledge that superficial contamination can lead to controversies of the interpretation of results (Jasdzewski et al., 2003; Boden et al., 2007) the majority of fNIRS studies are still conducted with sparse, single-distance imaging arrays. Initially the hesitation to switch to DOT was due in part to the complicated instrumentation requirements of early DOT systems. Now, as multiple simple neuroimaging DOT scanners are available, it is necessary to clearly demonstrate the possible improvements from these new techniques using in vivo imaging data. Thus, we here evaluate the ability of two methods, superficial signal regression (SSR) and tomography itself, to improve signal quality using in vivo measurements of the adult human visual cortex. Our goal is to answer three questions. (1) Can SSR techniques developed for sparse fNIRS arrays be adapted to high-density imaging arrays? This extension is non-trivial for two reasons. DOT inter-optode spacing is determined by the dense grid rather than by considerations of tissue sensitivity, and thus we might not be able to construct an ideal regressor. Also, since every deep measurement is not uniquely paired with a single shallow measurement, some other strategy to define a regression signal is required. Here, we evaluate a simple approach using a single spatially averaged regression signal for the entire measurement set. We will thus test whether this regression method is adequate. (2) How much signal-to-noise is gained by moving from sparse, isolated fNIRS measurements to DOT imaging? And, (3) is the depth-sectioning of DOT itself sufficient to separate multiple tissue layers, or does SSR in combination with DOT provide an added advantage?
Materials and methods
Protocol
Data were acquired using a high-density DOT scanner, developed in-house (Zeff et al., 2007). The optode array consisted of 24 source positions (with light emitting diodes, LEDs, at both 750 and 850 nm) and 28 detector positions (coupled to avalanche photodiodes, APDs) designed to image the visual cortex (Figure 1A). Healthy adults were scanned after informed consent, as specified by the Washington University School of Medicine Human Research Protection Office. Subjects sat 70 cm away from a 19-inch LCD screen, and the DOT pad was secured over the visual cortex using hook-and-loop strapping. In this study, we used visual stimulation data acquired in adult humans since visual stimuli activate a well-localized region of cortex and have minimal systemic correlates [as opposed to motor stimuli that can be correlated with increases in blood pressure (Boden et al., 2007)]. Subjects were instructed to look at a crosshair, and a visual stimulus in the lower right visual field spanning a polar angle of 70° and a radial angle of 0.5–1.7° was presented, consisting of 10 s of counter-phase flashing at 10 Hz followed by 30 s of 50% gray screen (Figure 1B). A session had between four and eight stimulus repetitions. Data was acquired from a population of nine subjects. Two subjects were had a majority of channels with high signal variance and were excluded due to poor cap fit. Of the remaining seven subjects, one was scanned three times and another was scanned twice, for a total of 10 data sets included in this study.
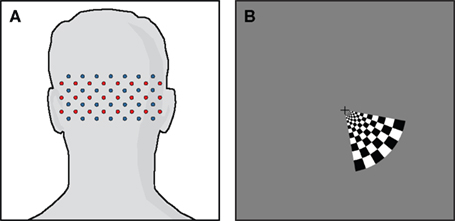
Figure 1. High-density DOT study design. (A) Schematic of the high-density scanning grid placed over the occipital cortex. Sources are in red, detectors in blue. (B) The visual stimulus. Black and white regions alternate contrast at 10 Hz. This visual stimulus was presented in a block pattern, consisting of 10 s of visual activation followed by 30 s of 50% gray screen.
Superficial Signal Regression
Due to the high dynamic range of the DOT system, light is detected from several different source–detector distances. In this paper, we will focus on using the first- and second-nearest neighbors, referring to SD-pairs separated by 1.3 and 3.0 cm, respectively (Figure 2A). First-nearest neighbors sample predominantly superficially, sensitive to scalp and skull properties, while second-nearest neighbors sample into the brain as well as the scalp/skull (Figure 2B) (Dehghani et al., 2009). We thus assume that the second-nearest neighbors contain the desired brain signal obscured by noise: SNN2 = Sbrain + Snoise. Regressing the noise from the second-nearest neighbor data will then, in principle, produce a more accurate measure of brain properties: SNN2 − Snoise = Sbrain (Saager and Berger, 2005).
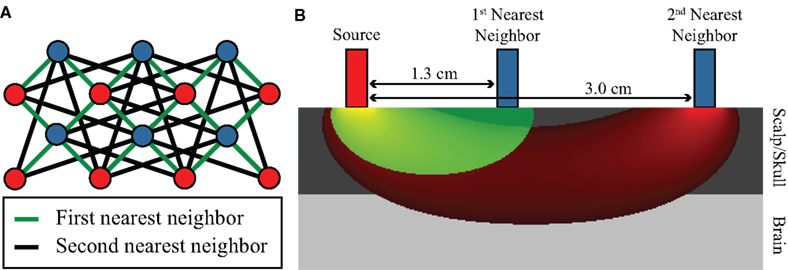
Figure 2. High-density diffuse optical imaging. (A) Schematic of a subsection of a high-density grid. Red dots indicate source positions, and blue dots detector positions. Interconnecting lines define first- and second-nearest neighbor source–detector pairs. (B) Illustration of depth sensitivity of SD-pairs with respect to lateral separation using a photon migration simulation in a semi-infinite, homogeneous geometry using 3-mm diameter, exponentially decaying optodes. Sensitivity functions have been truncated at 5% intensity. The most closely spaced SD-pairs (sensitivity in green) sample superficial scalp/skull properties, while more widely spaced SD-pairs (sensitivity in red) are sensitive to both brain and scalp/skull signals.
Our hypothesis is that the first-nearest neighbors can be used to construct a measure of this noise, which consists of both global variations and any changes localized to the superficial tissue layers: SNN1 ≈ Snoise = Ssuperficial + Sglobal. Specifically, our noise signal is produced by spatially averaging the first-nearest neighbor signals:  . Here, yj is the jth first-nearest neighbor pair measurement, Nnn is the number of first-nearest neighbors in the array, and yn is the superficial noise signal. This formulation contains two deviations from sparse fNIRS techniques. First, while one might desire a shorter first-nearest neighbor separation (∼0.5 cm) (Saager and Berger, 2008), our separation is constrained by the optode geometry needed for an imaging array. Second, rather than having an individual short-separation regressor for each deep measurement, we have averaged all first-nearest neighbors. These two changes should have the effect of partially mitigating each other, since even if some first-nearest neighbors have small sensitivity to the brain activation, using a large spatial average for the regressor means that local brain activations will not appear in the regressor (see the discussion for more on these effects).
The contribution of this noise signal to all measurements is removed by regression:  , where αi is a temporal correlation factor
  , yi is the ith unmodified SD-pair time course, and yi,brain is the same SD-pair after SSR. Here the brackets, <a,b> indicate calculation of the inner product between two time courses a and b. Note that this regression against yn is also performed on each of the individual first-nearest neighbor channels, which will still contain individual variation. When data were processed as SD-pair measures of absorption change (i.e., fNIRS: section “Modified Beer-Lambert law (fNIRS)”) this remaining variance in the first-nearest neighbors is not relevant, as we examine only individual second-nearest neighbor channels. However, when performing three-dimensional tomographic reconstructions of volumes of absorbance change (i.e., DOT: section “Diffuse optical tomography reconstructions”), the first-nearest neighbors (with their remaining variance) are used in the reconstruction and contribute to the image.
Modified Beer-Lambert Law (fNIRS)
Measurements of absorbance change were produced from the log-ratio of raw SD-pair data. A band-pass filter (0.02–0.5 Hz) removed pulse and long-term drift. Using the modified Beer-Lambert law (MBL),  , changes in absorption were determined from absorbance. Here ΔA is the change in absorbance, L is the separation between this measurement’s source and detector, and dpf is the differential path-length factor (a term that corrects for light being multiply scattered within the head, and thereby traveling a longer distance than the physical source detector separation). We used values for dpf derived from the work of Duncan et al. (1996) of 5.11 cm−1 for 750 nm and 4.67 cm−1 for 850 nm.
Diffuse Optical Tomography Reconstructions
Diffuse optical tomography reconstructions were generated using a hemispherical head model (Zeff et al., 2007). A finite-element, forward light model (Dehghani et al., 2003) was used to generate a sensitivity matrix for the source/detector array. Using a direct inversion of the sensitivity matrix, SD-pair absorbance measurements were converted into tomographic maps of absorption change (Zeff et al., 2007). A hemispherical shell through the superficial cerebral cortex (1-cm thick centered at a 1-cm depth) was isolated from the full 3D reconstruction for display (shown as a posterior coronal projection, as if looking at the brain from behind with the scalp and skull removed). We can thus spatially remove superficially reconstructed hemodynamics.
Hemoglobin Spectroscopy
For both SD-pair measures and tomographic maps of absorption change, we used the extinction coefficients of oxy- (HbO2) and deoxyhemoglobin (HbR) to convert from changes in the absorption to concentration changes: ΔHbO2, ΔHbR, and ΔHbT (total hemoglobin). The extinction coefficients used for HbO2 are 1.36 and 3.40 mM−1 cm−1 and for HbR are 2.39 and 1.85 mM−1 cm−1 (for 750 and 850 nm, respectively). These coefficients were generated by applying a weighted average over the spectra of our LEDs (Gaussian FWHM ∼60 and 45 nm, respectively) to the table of extinction coefficients found in Wray et al. (1988).
Evaluation of Contrast-to-Noise
To quantify the performance of the different neuroimaging methods, we evaluated the contrast-to-noise ratio (CNR) of the retrieved hemodynamic response. Contrast is defined as the peak-height of response (averaged over multiple stimulus presentations). We characterized measurement noise through the standard deviation in the pre-stimulus baseline. We use baseline noise rather than variation in the activation height, since peak height could change from block to block due to factors such as subject attentiveness and direction of gaze that are independent from system or physiological noise. We then judge a method’s effectiveness by its improvement in CNR versus fNIRS/MBL processing without SSR. Additionally, both DOT methods create images, which we judge spatially by looking at contrast and noise.
Results
Our goal was to compare the ability to distinguish brain activations using four analysis methods: (1) SD-pair data processed with the MBL without any additional processing, (2) SD-pair data processed using the MBL with SSR, (3) DOT reconstructions, and (4) DOT reconstructions with SSR. First, we examined time traces of the hemodynamic response to the visual stimulus from a single, representative second-nearest neighbor SD-pair generated with and without SSR (methods 1 and 2). If no SSR processing is applied to MBL data, then it is difficult to distinguish individual hemodynamic activations (Figure 3A). One reason that this data fails to show canonical responses is that it also contains superficial and systemic variation; using high-density optode arrays we can measure the superficial noise signal (Figure 3B). Using SSR to remove this signal from the second-nearest neighbor SD-pair produced a consistent canonical hemodynamic response (Figure 3C). While the expected response shape is visible after block-averaging without SSR (Figure 3D), with SSR, activations due to single stimulus presentations are apparent even before block-averaging. Block-averaged SSR data (Figure 3E) had reduced noise (error bars denote standard error), improved statistical significance (asterisks mark significant deviation from baseline p < 0.05 based on a comparison to the pre-stimulus baseline of time = −2 s with a two-tailed t-test), and qualitatively improved response shape. In this individual, the responses for both HbO2 and HbT were non-significant in the data prior to SSR. This improvement in signal quality is quantified through an approximately two-fold improvement in CNR (Table 1).
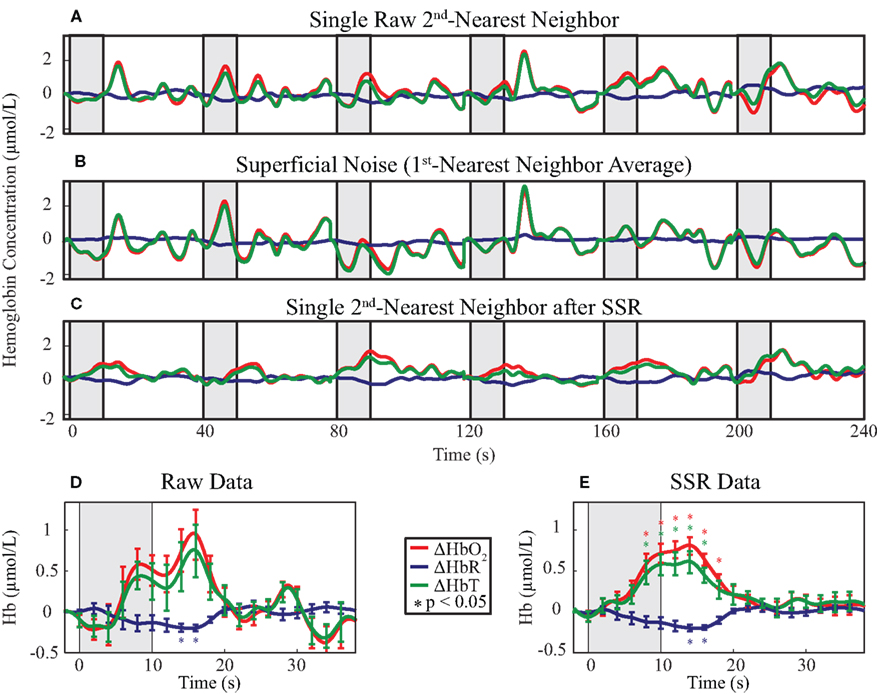
Figure 3. Evaluation of the effect of SSR on SD-pair data during visual stimulation. The gray shaded regions indicate visual stimulus. (A–C) Time traces of the hemodynamic response from six consecutive blocks with ΔHbO2 in red, ΔHbR in blue, and ΔHbT in green. The superficial noise signal (B) is regressed from a raw second-nearest neighbor SD-pair (A), producing SSR data (C). Note the consistent clean shape of activation after SSR. (D,E) Block-averaged time traces of (A) and (C), respectively. Error bars mark standard deviation and asterisks indicate statistically significant deviation from baseline. Note the reduced noise and improved CNR of the activation after SSR.
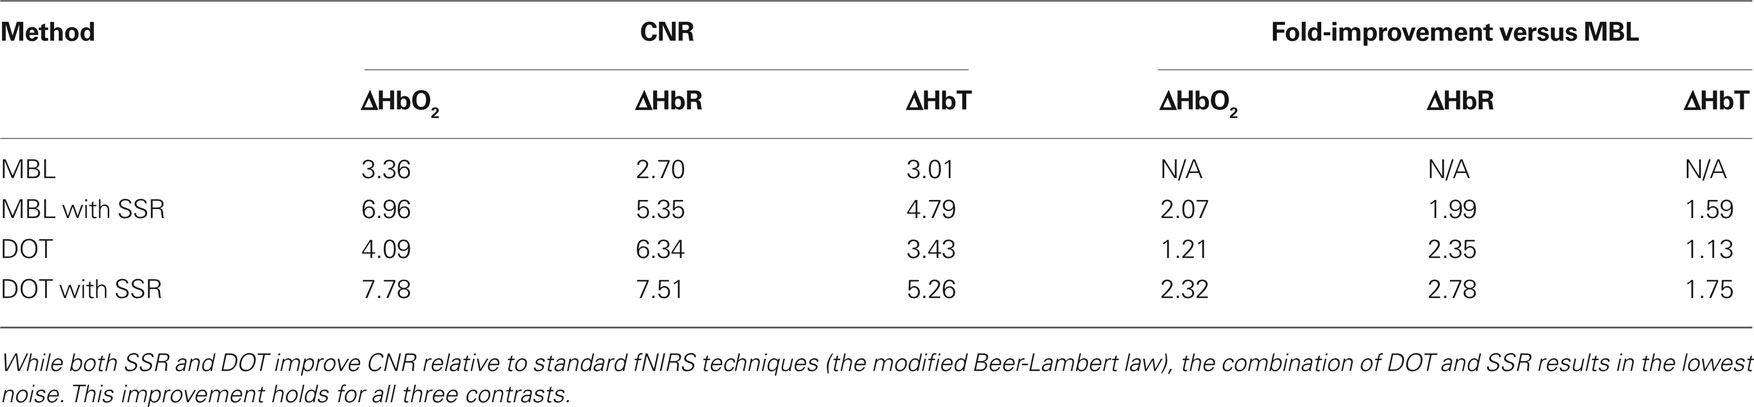
Table 1. Improvement in the contrast-to-noise ratio (CNR) following the use of SSR and DOT.
Tomographic images of ΔHbO2, ΔHbR, and ΔHbT were generated with and without SSR. Reconstructed images of raw ΔHbO2 data during the peak functional response (13 s after stimulus onset averaged over one second) show inconsistent responses from trial to trial (Figure 4A, top row). In contrast, the images of data that have SSR processing show similar activations after each stimulus presentation (Figure 4A, bottom row). While both activation maps appear similar after block-averaging (Figure 4B), the greater noise in the raw data is reflected in an image of variance over the multiple trials (Figure 4C). Noise reduction due to SSR can also be quantified in voxel time traces chosen from the area of peak activation (Figure 4D). These traces (Figures 4E,F) show the ability of SSR (as with SD-pair data) to reduce noise, improve statistical significance, and qualitatively improve the shape of the hemodynamic response. Comparing CNR of the various methods shows that there are gains through the use of DOT alone, but there is a synergistic effect between SSR and DOT with the signal quality being highest after the utilization of both methods (Table 1).
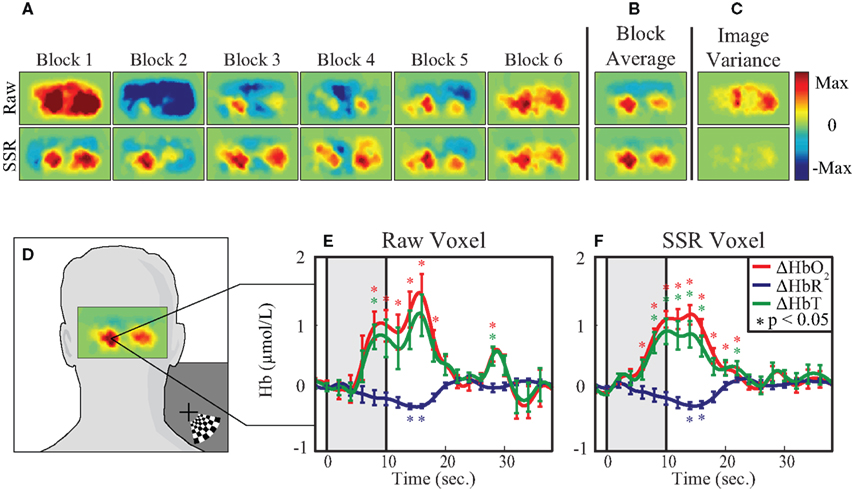
Figure 4. Evaluation of the effect of SSR on imaged data. (A) Reconstructed images from a 1-cm thick shell of cortex. Each plot shows 1 s of data at peak activation from six consecutive blocks, without SSR (top row) and with SSR (bottom row) superficial signal regression. (B) The block average of the six blocks in (A). (C) Image variance is displayed as the standard deviation of each pixel at peak activation across all blocks. Note that while the block-averages appear similar, the image variance plot captures the inconsistency in the raw (non-SSR) data. (D) Reconstructed image of cortical response to visual stimulus, overlaid on adult head to show direction of view and the voxel chosen for time trace analysis. (E,F) Block-averaged time traces generated from a single voxel of reconstructed data, with and without SSR. Error bars mark standard deviation and asterisks indicate statistically significant deviation from baseline.
The above exemplary results can be generalized to the group data demonstrating consistent CNR improvement through the use of the SSR method and DOT (Figure 5). On average, tomographic image reconstruction and SSR improve CNR in all contrasts. However, some subjects or individual contrasts within a subject fail to show improvement when only one of these methods is used (in no case however, does SSR drastically decrease the data’s CNR). In combination, the two depth-discrimination methods improve the CNR of all subjects and all contrasts (with the exception of HbR in one individual). On average, sequential use of SSR and tomography provide a 2.24-, 2.18-, and 3.01-fold improvement in CNR for HbO2, HbR, and HbT, respectively.
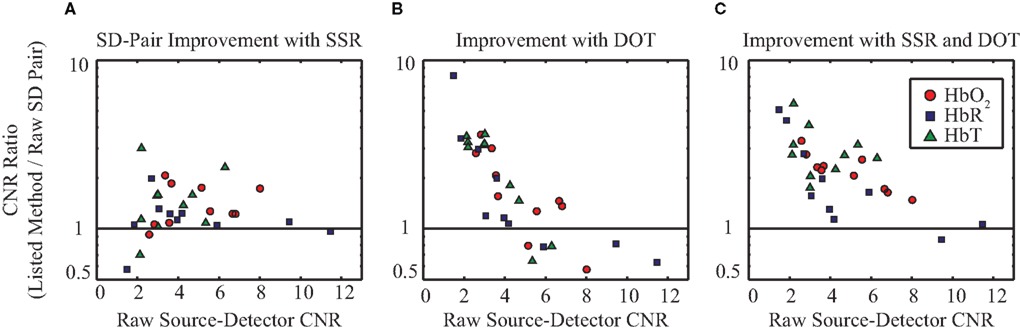
Figure 5. Evaluation of the signal quality of SSR and DOT versus MBL across ten data sets (seven subjects, with some scanned multiple times). All graphs plot the fold-improvement in CNR versus the MBL CNR. ΔHbO2, ΔHbR, and ΔHbT are denoted in red circles, blue squares, and green triangles, respectively. (A) Improvement in CNR due to the use of SSR on SD-pairs. (B) Improvement in CNR through the use of tomographic image reconstruction (chosen at the voxel with maximal response). (C) Improvement in CNR due to the combined use of SSR and image reconstruction. Note that it is the subjects with the worst initial CNR (farthest to the left) that benefit the most from the evaluated methods.
Discussion
Limitations in the signal quality of optical signals have hampered the acceptance of fNIRS in clinical practice and cognitive neuroscience research. To date, a number of groups have pursued varying techniques to regress or discriminate physiological noise from optically acquired functional brain signals. One potential method is to use direct peripheral measurements of the hypothesized noise sources (e.g., via a pulse-oximeter or respiration belt), which can then be regressed from the acquired data [as is commonly performed in fMRI (Glover et al., 2000)]. This approach, however, is limited in the number of noise sources it can measure, and additionally it assumes a similarity between blood flow in the periphery and in the head that may not hold in practice. Our lab, as well as others, have used statistical techniques that assume orthogonality or independence between functional brain signals and physiological noise to identify these components (Morren et al., 2004; Zhang et al., 2005; Markham et al., 2009). An additional method for regression is the use of adaptive filtering techniques (Zhang et al., 2007, 2009), which have been used in single-source, multi-detector geometries.
In this paper, we have implemented and evaluated a theoretically and computationally simple regression procedure within the context of a high-density DOT imaging array. This method is amenable to real-time imaging and has been shown to be capable of CNR improvement in each hemoglobin species for ≥ 80% of subjects, both in SD-pair data and in image reconstructions. The use of tomography individually is still helpful, but less impressive. This result might be due to the fact that we are only using first- and second-nearest neighbors in the present analysis. As there is substantial overlap in the sensitivities of these two measurement distances, we might predict that their ability to completely distinguish two depths to be limited. We expect that future DOT systems with sufficiently higher signal-to-noise to include further source–detector distances would have better depth profiling (Dehghani et al., 2009). The combined effect of SSR and image reconstruction improves the CNR in all 10 datasets for HbO2 and HbT, and nine of 10 datasets for HbR. SSR and DOT have a synergistic effect to improve the depth-sectioning capabilities of optical imaging.
Additionally, we see that it is the subjects with the worst initial SNR that have the largest improvement after the use of SSR and DOT. This result is possibly because there are two contributions to noise: physiological noise and instrument noise. Since we expect instrument noise to be relatively constant between studies, the variance between subjects results predominantly from the amount of physiological noise present. Subjects with initially poor CNR (and thus high physiological noise) will benefit most from the noise removal techniques described here. Subjects with initially low physiological noise have CNRs limited by instrument noise. We would then expect the present techniques (which are designed to solely remove physiological noise) to have little effect on the CNR of these subjects.
It is important to note that what one refers to as “physiological noise” varies with the context of the experiment. When performing a functional activation study (as here), many normal physiological processes (including pulse, respiration, blood pressure oscillations, and spontaneous neural activity) all qualify as noise as they are undesired variance not related to your experimental paradigm. However, in other circumstances it could be the “noise” that you wish to measure. Resting-state functional connectivity (Biswal et al., 1995; Fox et al., 2005; Fox and Raichle, 2007; White et al., 2009) was originally dismissed as noise in fMRI signals. Additionally, one can extract important information through the examination of optical measurement of pulse and respiratory fluctuations (Wolf et al., 1997; Franceschini et al., 2002, 2006). The SSR method in this paper was designed for examination of task-evoked neural activity; care should be taken in choosing the appropriate noise removal method for each experiment.
While a linear regression should be less powerful than an adaptive filter, our results are more consistent and comprehensive than those previously presented for adaptive filters. Zhang et al. (2009) found that with their filter “71% of the [HbO2] measurements revealed CNR improvements after adaptive filtering, with a mean improvement of 60%. No CNR improvement was observed for [HbR].” In contrast, our improvement of about 200% in CNR is seen across all hemoglobin species. These results show that effective filtering can be obtained with simple, easily implemented algorithms. However, it also demonstrates that more research needs to be done on the nature of physiological interference in optical signals. We expect that greater knowledge of the sensitivities of different contrasts to physiological processes will yield even higher performing filter algorithms.
While one of the advantages of the proposed method is its ease of use, this simplicity does come at the cost of making assumptions that may not hold in all cases. One limitation is that there are likely several sources that contribute to the measured noise and that the linear combination present in the first-nearest neighbor pairs may not be the same as the linear combination in the second-nearest neighbors. In such a case, simple regression cannot remove all noise, but still has been shown to provide noise-reduction benefits (Saager and Berger, 2008). An extension of the current technique would be a multiple linear regression method combined with direct measurements of other systemic signals (e.g., heart rate, breathing rate, and arterial blood pressure), which would, in principle, provide still better performance. A second limitation is that the averaged first-nearest neighbor signal might include some component sensitive to the brain. In the present adult study this effect is minimal since the brain sensitivity of first-nearest neighbors is low (<5%) and the activations were localized. However, in other applications, such as imaging infants, where the scalp and skull are much thinner and activations cannot be as easily localized, one would have to take care that the regression did not remove too much of the desired brain response. A third concern is that the superficial noise signal might vary over the surface of head. In this case, one could determine a local measure of the noise using nearby first-nearest neighbors. However, although future work will develop better algorithms, the present paper shows that current data can still be dramatically improved with simply implemented methods.
The average CNR improvement (with the use of both SSR and DOT) of approximately 2.5-fold in hemoglobin absorption data corresponds to a greater than six-fold reduction in the necessary acquisition time required for an equivalent signal quality (assuming that CNR scales as the square root of the total scan time). Decreased acquisition time will have two complementary effects that aid the use of fNIRS in novel environments, such as with young children and hospitalized patients. With increased signal quality, one needs to rely less on the long-term cooperation of the subject and can obtain useful data even if only short scanning windows are available. Conversely, for a fixed session length, decreased time per stimulus allows the use of multiple stimulus paradigms and attempts to decode more complex brain functionality.
We have shown that high-density DOT’s overlapping, depth-dependent measurements of the head and brain can be leveraged to perform SSR in addition to three-dimensional image reconstructions. Both of these methods reduce the effect of physiological noise in the acquired neuroimaging data. The extension of SSR to DOT data provides an additional benefit beyond DOT’s inherent depth-sectioning capabilities. Improvements in repeatability and signal quality advance DOT towards real-time imaging and greater utility in basic neuroscience and clinical care.
Conflict of Interest Statement
Joseph P. Culver and Washington University have financial interests in Cephalogics LLC based on a license of related technology by the University to Cephalogics LLC.
Acknowledgments
This research was supported in part by NIH grants, R01-EB009233 (Joseph P. Culver), R21-HD057512 (Joseph P. Culver), R21-EB007924 (Joseph P. Culver), T90-DA022871 (Brian R. White), and Cephalogics LLC.
References
Barbour, R. L., Graber, H., Aronson, R., and Lubowsky, J. (1990). Model for 3-D optical imaging of tissue. IGARSS 2, 1395–1399.
Bartocci, M., Bergqvist, L. L., Lagercrantz, H., and Anand, K. J. S. (2006). Pain activates cortical areas in the preterm newborn brain. Pain 122, 109–117.
Benaron, D. A., Hintz, S. R., Villringer, A., Boas, D., Kleinschmidt, A., Frahm, J., Hirth, C., Obrig, H., van Houten, J. C., Kermit, E. L., Cheong, W. F., and Stevenson, D. K. (2000). Noninvasive functional imaging of human brain using light. J. Cereb. Blood Flow Metab. 20, 469–477.
Biswal, B., Yetkin, F. Z., Haughton, V. M., and Hyde, J. S. (1995). Functional connectivity in the motor cortex of resting human brain using echo-planar MRI. Magn. Reson. Med. 34, 537–541.
Bluestone, A. Y., Abdoulaev, G., Schmitz, C. H., Barbour, R. L., and Hielscher, A. H. (2001). Three-dimensional optical tomography of hemodynamics in the human head. Opt. Express 9, 272–286.
Boden, S., Obrig, H., Kohncke, C., Benav, H., Koch, S. P., and Steinbrink, J. (2007). The oxygenation response to functional stimulation: is there a physiological meaning to the lag between parameters? Neuroimage 36, 100–107.
Davis, S. L., Fadel, P. J., Cui, J., Thomas, G. D., and Crandall, C. G. (2006). Skin blood flow influences near-infrared spectroscopy-derived measurements of tissue oxygenation during heat stress. J. Appl. Physiol. 100, 221–224.
Dehghani, H., Pogue, B. W., Poplack, S. P., and Paulsen, K. D. (2003). Multiwavelength three-dimensional near-infrared tomography of the breast: initial simulation, phantom, and clinical results. Appl. Opt. 42, 135–145.
Dehghani, H., White, B. R., Zeff, B. W., Tizzard, A., and Culver, J. P. (2009). Depth sensitivity and image reconstruction analysis of dense imaging arrays for mapping brain function with diffuse optical tomography. Appl. Opt. 48, D137–D143.
Duncan, A., Meek, J. H., Clemence, M., Elwell, C. E., Fallon, P., Tyszczuk, L., Cope, M., and Delpy, D. T. (1996). Measurement of cranial optical path length as a function of age using phase resolved near infrared spectroscopy. Pediatr. Res. 39, 889–894.
Fox, M. D., and Raichle, M. E. (2007). Spontaneous fluctuations in brain activity observed with functional magnetic resonance imaging. Nat. Rev. Neurosci. 8, 700–711.
Fox, M. D., Snyder, A. Z., Vincent, J. L., Corbetta, M., Van Essen, D. C., and Raichle, M. E. (2005). The human brain is intrinsically organized into dynamic, anticorrelated functional networks. Proc. Natl. Acad. Sci. U.S.A. 102, 9673–9678.
Franceschini, M. A., Boas, D. A., Zourabian, A., Diamond, S. G., Nadgir, S., Lin, D. W., Moore, J. B., and Fantini, S. (2002). Near-infrared spiroximetry: noninvasive measurements of venous saturation in piglets and human subjects. J. Appl. Physiol. 92, 372–384.
Franceschini, M. A., Joseph, D. K., Huppert, T. J., Diamond, S. G., and Boas, D. A. (2006). Diffuse optical imaging of the whole head. J. Biomed. Opt. 11, 054007.
Gervain, J., Macagno, F., Cogoi, S., Pena, M., and Mehler, J. (2008). The neonate brain detects speech structure. Proc. Natl. Acad. Sci. U.S.A. 105, 14222–14227.
Gibson, A. P., Austin, T., Everdell, N. L., Schweiger, M., Arridge, S. R., Meek, J. H., Wyatt, J. S., Delpy, D. T., and Hebden, J. C. (2006). Three-dimensional whole-head optical tomography of passive motor evoked responses in the neonate. Neuroimage 30, 521–528.
Glover, G. H., Li, T.-Q., and Ress, D. (2000). Image-based method for retrospective correction of physiological motion effects in fMRI: retroicor. Mag. Reson. Med. 44, 162–167.
Hebden, J. C. (2003). Advances in optical imaging of the newborn infant brain. Pathophysiology 40, 501–510.
Hebden, J. C., Gibson, A., Yusof, R. M., Everdell, N., Hillman, E. M. C., Delpy, D. T., Arridge, S. R., Austin, T., Meek, J. H., and Wyatt, J. S. (2002). Three-dimensional optical tomography of the premature infant brain. Phys. Med. Biol. 47, 4155–4166.
Jasdzewski, G., Strangman, G., Wagner, J., Kwong, K. K., Poldrack, R. A., and Boas, D. A. (2003). Differences in the hemodynamic response to event-related motor and visual paradigms as measured by near-infrared spectroscopy. Neuroimage 20, 479–488.
Joseph, D. K., Huppert, T. J., Franceschini, M. A., and Boas, D. A. (2006). Diffuse optical tomography system to image brain activation with improved spatial resolution and validation with functional magnetic resonance imaging. Appl. Opt. 45, 8142–8151.
Klaessens, J. H. G. M., Hopman, J. C. W., Liem, K. D., van Os, S. H. G., and Thijssen, J. M. (2005). Effects of skin on bias and reproducibility of near-infrared spectroscopy measurement of cerebral oxygenation changes in porcine brain. J. Biomed. Opt. 10, 044003.
Markham, J., White, B. R., Zeff, B. W., and Culver, J. P. (2009). Blind identification of evoked human brain activity with independent component analysis of optical data. Hum. Brain Mapp. 30, 2382–2392.
Morren, G., Wolf, M., Lemmerling, P., Wolf, U., Choi, J. H., Gratton, E., De Lathauwer, L., and Van Huffel, S. (2004). Detection of fast neuronal signals in the motor cortex from functional near infrared spectroscopy measurements using independent component analysis. Med. Biol. Eng. Comput. 42, 92–99.
Saager, R., and Berger, A. (2008). Measurement of layer-like hemodynamic trends in scalp and cortex: implications for physiological baseline suppression in functional near-infrared spectroscopy. J. Biomed. Opt. 13, 034017.
Saager, R. B., and Berger, A. J. (2005). Direct characterization and removal of interfering absorption trends in two-layer turbid media. J. Opt. Soc. Am. A 22, 1874–1882.
Saito, Y., Fukuhara, R., Aoyama, S., and Toshima, T. (2009). Frontal brain activation in premature infants’ response to auditory stimuli in neonatal intensive care unit. Early Hum. Dev. 85, 471–474.
Steinbrink, J., Villringer, A., Kempf, F. C. D., Haux, D., Boden, S., and Obrig, H. (2006). Illuminating the BOLD signal: combined fMRI-fNIRS studies. Magn. Reson. Imaging 24, 495–505.
White, B. R., and Culver, J. P. (2010a). Phase-encoded retinotopy as an evaluation of diffuse optical neuroimaging. Neuroimage 49, 568–577.
White, B. R., and Culver, J. P. (2010b). A quantitative evaluation of high-density diffuse optical tomography: in vivo resolution and mapping performance. J. Biomed. Opt. 15, 026006.
White, B. R., Snyder, A. Z., Cohen, A. L., Petersen, S. E., Raichle, M. E., Schlaggar, B. L., and Culver, J. P. (2009). Resting-state functional connectivity in the human brain revealed with diffuse optical tomography. Neuroimage 47, 148–156.
Wolf, M., Duc, G., Keel, M., and Niederer, P. (1997). Continuous noninvasive measurements of cerebral arterial and venous oxygen saturation at the bedside in mechanically ventilated neonates. Crit. Care Med. 9, 1579–1582.
Wray, S., Cope, M., Delpy, D. T., Wyatt, J. S., and Reynolds, E. O. R. (1988). Characteristics of the near infrared absorption spectra of cytochrome aa3 and haemoglobin for the non-invasive monitoring of cerebral oxygenation. Biochim. Biophys. Acta 933, 184–192.
Wylie, G. R., Graber, H., Voelbel, G. T., Kohl, A. D., DeLuca, J., Pei, Y., Xu, Y., and Barbour, R. L. (2009). Using co-variation in the Hb signal to detect visual activation: a near infrared spectroscopy study. Neuroimage 47, 473–481.
Yodh, A. G., and Boas, D. A. (2003). “Functional imaging with diffusing light,” in Biomedical Photonics, ed. T. Vo-Dinh (Boca Raton, FL: CRC Press), 21–1–21–45.
Zeff, B. W., White, B. R., Dehghani, H., Schlaggar, B. L., and Culver, J. P. (2007). Retinotopic mapping of adult human visual cortex with high-density diffuse optical tomography. Proc. Natl. Acad. Sci. U.S.A. 104, 12169–12174.
Zhang, Q., Brown, E. N., and Strangman, G. E. (2007). Adaptive filtering to reduce global interference in evoked brain activity detection: a human subject case study. J. Biomed. Opt. 12, 064009.
Zhang, Q., Strangman, G. E., and Ganis, G. (2009). Adaptive filtering to reduce global interference in non-invasive NIRS measures of brain activation: how well and when does it work? Neuroimage 45, 788–794.
Keywords: neuroimaging, biomedical optics, near-infrared spectroscopy, diffuse optical tomography, artifact removal, image quality
Citation: Gregg NM, White BR, Zeff BW, Berger AJ and Culver JP (2010) Brain specificity of diffuse optical imaging: improvements from superficial signal regression and tomography. Front. Neuroenerg. 2:14. doi: 10.3389/fnene.2010.00014
Received: 26 February 2010;
Paper pending published: 30 March 2010;
Accepted: 11 June 2010;
Published online: 14 July 2010
Edited by:
David Boas, Massachusetts General Hospital, USA; Massachusetts Institute of Technology, USA; Harvard Medical School, USAReviewed by:
Jens Steinbrink, Charité - Universitätsmedizin Berlin, GermanyYueli Chen, University of Connecticut, USA
Copyright: © 2010 Gregg, White, Zeff, Berger and Culver. This is an open-access article subject to an exclusive license agreement between the authors and the Frontiers Research Foundation, which permits unrestricted use, distribution, and reproduction in any medium, provided the original authors and source are credited.
*Correspondence: Joseph P. Culver, Department of Radiology, Optical Radiology Laboratory, Washington University in St. Louis, 4525 Scott Avenue, Box 8225, St. Louis, MO 63110, USA. e-mail: culverj@wustl.edu