1
Department of Neurology, Johns Hopkins School of Medicine, Baltimore, MD, USA
2
Department of Otolaryngology, Johns Hopkins School of Medicine, Baltimore, MD, USA
3
Department of Biostatistics, Johns Hopkins Bloomberg School of Public Health, Baltimore, MD, USA
Multichannel intracranial recordings are used increasingly to study the functional organization of human cortex. Intracranial recordings of event-related activity, or electrocorticography (ECoG), are based on high density electrode arrays implanted directly over cortex, combining good temporal and spatial resolution. Developing appropriate statistical methods for analyzing event-related responses in these high dimensional ECoG datasets remains a major challenge for clinical and systems neuroscience. We present a novel methodological framework that combines complementary, existing methods adapted for statistical analysis of auditory event-related responses in multichannel ECoG recordings. This analytic framework integrates single-channel (time-domain, time–frequency) and multichannel analyses of event-related ECoG activity to determine statistically significant evoked responses, induced spectral responses, and effective (causal) connectivity. Implementation of this quantitative approach is illustrated using multichannel ECoG data from recent studies of auditory processing in patients with epilepsy. Methods described include a time–frequency matching pursuit algorithm adapted for modeling brief, transient cortical spectral responses to sound, and a recently developed method for estimating effective connectivity using multivariate autoregressive modeling to measure brief event-related changes in multichannel functional interactions. A semi-automated spatial normalization method for comparing intracranial electrode locations across patients is also described. The individual methods presented are published and readily accessible. We discuss the benefits of integrating multiple complementary methods in a unified and comprehensive quantitative approach. Methodological considerations in the analysis of multichannel ECoG data, including corrections for multiple comparisons are discussed, as well as remaining challenges in the development of new statistical approaches.
Multichannel intracranial recordings are used increasingly to investigate the functional organization of human cortex. Intracranial EEG recordings, known as electrocorticography (ECoG), use electrodes implanted for clinical purposes, including seizure localization and surgical planning for treatment of intractable epilepsy. This clinical circumstance provides a rare opportunity to record focal neuronal population activity directly from cortex. ECoG recordings offer excellent temporal resolution (1 ms) and the proximity of recording electrodes to underlying cortical sources enhances spatial resolution, signal-to-noise ratio, and sensitivity to a broad range of EEG frequencies. Recent ECoG studies have investigated cortical sensory (auditory, visual), motor, language, and cognitive systems (Crone et al., 2006
, 2009
; Miller et al., 2007
; Brugge et al., 2009
; Jacobs and Kahana, 2009
; Sinai et al., 2009
). ECoG recordings are usually obtained from large numbers of electrodes, yielding high dimensional data sets.
In this methods paper, we propose a novel quantitative framework that integrates multiple existing methods for analyzing high dimensional ECoG data sets. This quantitative approach is used to determine the statistical significance of event-related responses in intracranial recordings. We adapted this quantitative approach for auditory ECoG studies conducted at our epilepsy center. ECoG is useful for investigating the functional organization of auditory cortex and is used clinically for pre-surgical functional mapping and, more recently, for brain–computer interfaces (Howard et al., 2000
; Lachaux et al., 2007
; Brugge et al., 2009
; Hong et al., 2009
; Sinai et al., 2009
). We will examine how complementary methods can be combined to evaluate statistically significant changes in multiple aspects of auditory event-related ECoG activity: evoked responses, spectral responses, event-related (causal) connectivity, and spatial distribution (normalization). Each method is illustrated with examples from recent auditory ECoG studies. We begin with a brief overview of intracranial recording methods and cortical auditory event-related responses. We discuss the advantages of using multiple complementary methods (e.g., single-channel and multichannel) to analyze the same ECoG data sets. Methodological issues, including multiple comparisons, as well as future directions for development of new statistical approaches are also discussed.
Recording Electrodes
Intracranial recordings are obtained with subdural or stereotactic depth electrodes. Subdural electrodes are positioned on the lateral surface of cortex; depth electrodes are inserted through cortex to record from deeper structures, such as hippocampus. Recordings can be obtained intraoperatively by moving electrodes to different locations on the exposed cortex, or extraoperatively by leaving implanted electrodes indwelling for up to 10 days of monitoring. Although microelectrodes have been used for single-neuron recording studies (Howard et al., 1996
; Schwartz et al., 2000
; Ojemann et al., 2002
; Gelbard-Sagiv et al., 2008
), most clinical centers use macroelectrodes to record from neuronal populations. At our center, intracranial auditory recordings are usually obtained extraoperatively with subdural and depth macroelectrodes (Crone et al., 2001a
; Boatman and Miglioretti, 2005
; Sinai et al., 2009
).
Electrode Placement
For extraoperative recordings, subdural and depth electrodes are implanted by craniotomy under general anesthesia. Typically, electrodes are implanted over one hemisphere where the seizure focus is suspected based on clinical data. Subdural electrodes consist largely of platinum-iridium disks, 2–3 mm in diameter, spaced 5–10 mm apart center-to-center and embedded in 1.5-mm-thick arrays of medical grade silastic. Common subdural electrode array configurations are 4 × 5, 6 × 8 or 8 × 8 grids and 1 × 8 or 2 × 8 strips (Figure 1
). Most patients have multiple grids and/or strips implanted to ensure adequate spatial sampling for seizure localization, with the total number of recording electrodes per patient at our center typically between 48 and 184 (maximum to date). Depth electrodes are one-dimensional arrays typically of 1 × 4 or 1 × 8 contacts, 2-mm in diameter, inserted through gyri or sulci. While subdural electrodes record primarily from gyral structures because they are located over the cortical surface, depth electrodes can record from both gyral and sulcal structures. Intracranial recordings can also be made from electrodes implanted in the epidural space. Although signal amplitude is reduced by the dura mater and epidural electrodes cannot cover as many brain areas as can subdural electrodes, they potentially can be implanted less invasively and can offer an important alternative to subdural electrodes in patients with severe subdural adhesions from prior surgery. These electrodes have been used for presurgical evaluations for intractable epilepsy, and their use has also been considered for brain–machine interface applications (Barnett et al., 1990
; Blount et al., 2008
; Slutzky et al., 2008
). In this paper, we focus on intracranial recordings using subdural electrodes.
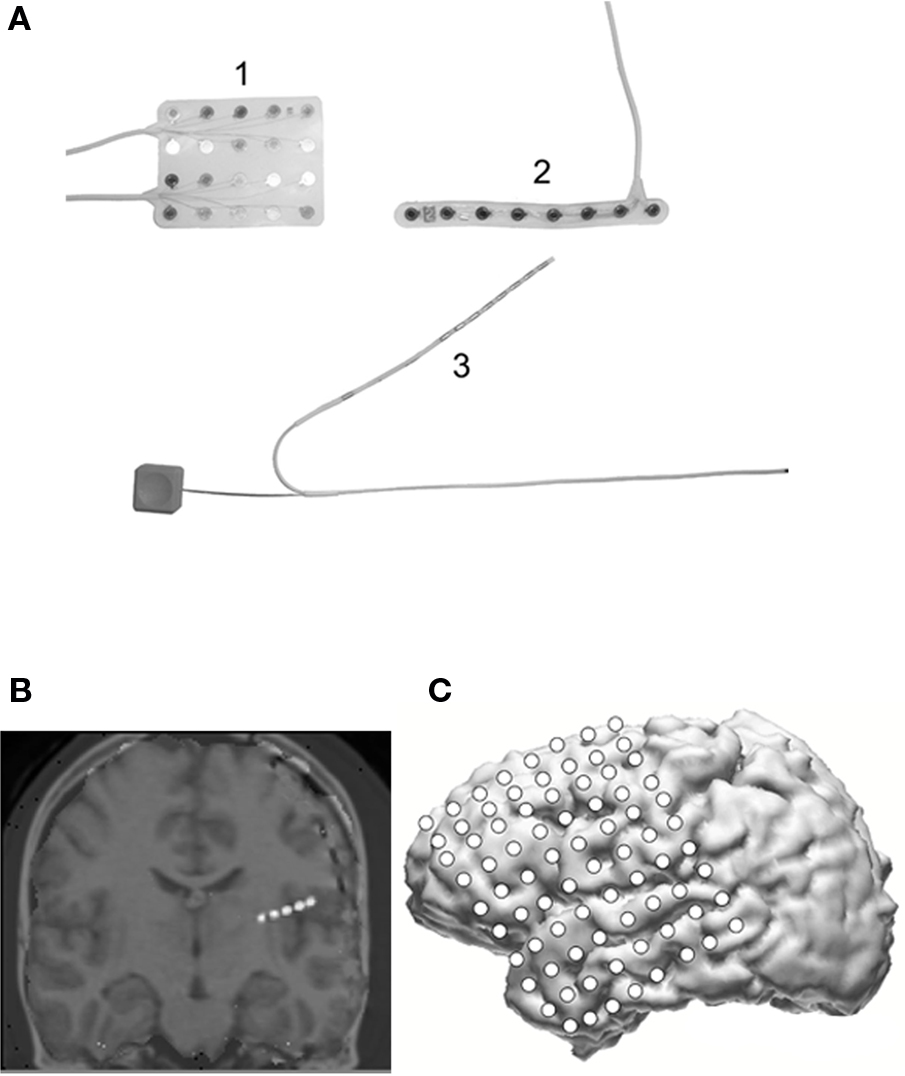
Figure 1. (A) Shows three different electrode configurations used for intracranial recordings: (1) a 4 × 5 subdural electrode array (Ad-Tech, Racine, WI, USA); (2) a 1 × 8 electrode strip; and (3) an 8-contact depth electrode. (B) A coronal 3D MRI reconstruction showing depth electrodes (white) in right temporal lobe; (C) a 3D MRI reconstruction with 8 × 8 subdural electrode array and additional 2 × 8 strip implanted over the lateral left hemisphere.
Intracranial electrode configuration and placement are determined individually, based on each patient’s clinical circumstances. Many of our patients have subdural electrode coverage of the superior temporal gyrus corresponding to auditory cortex (Boatman et al., 2000
; Miglioretti and Boatman, 2003
; Boatman, 2004
, 2006
; Boatman and Miglioretti, 2005
). During implantation, electrode grids and strips are sutured to the overlying dura to prevent movement during closure of the craniotomy. Post-implantation CT scans are obtained the following day to confirm electrode locations. After implantation, patients are monitored in the neurological critical care unit and then admitted to the epilepsy monitoring unit for ECoG recordings and monitoring. Auditory ECoG studies are usually initiated 3–5 days after electrode implantation, when surgery-related edema and discomfort are reduced. All patient research participants provide informed written consent in compliance with our Institutional Review Board. Patients are tested individually at bedside in private rooms with measured ambient noise levels ≤45 dB SPL. Recordings are made from the same subdural electrodes used clinically for seizure localization; they introduce no additional risk to the patient and do not interfere with the ongoing clinical video recordings of patients’ seizures for localization of the epileptic zone. Once sufficient clinical information has been obtained, patients return to surgery for removal of the electrodes and possible resection for treatment of seizures.
Recording Parameters
ECoG recodings are obtained using standard clinical parameters. The ECoG signal is amplified (Schwarzer amplifier) at a channel gain of 1408 and recorded digitally from all channels (Stellate Systems Inc.) at a minimum sampling rate of 1000 Hz with a bandwidth of 0.1–350 Hz (6 dB/octave). We routinely use a referential montage in which all subdural electrodes are referenced to a single intracranial electrode. A benefit of referential recordings is that they can be remontaged readily for analysis, in contrast to bipolar recordings (see Signal Pre-processing). Ideally, the electrode selected for the reference has minimal electrical artifact and electrographic abnormalities and is distal to the recording region of interest (e.g., superior temporal gyrus). Although it is not possible to have an entirely inactive reference, choosing a reference distal to recording sites of interest can reduce its potential contributions and the need for spatial reformatting. Extracranial reference electrodes are not used to avoid contamination by muscle activity that has prominent spectral energy in high frequencies (e.g., gamma band). Markers for stimulus onset times are recorded simultaneously to ECoG marker channels.
Signal Pre-Processing
The continuous ECoG signal is pre-processed for event-related analysis. Pre-processing is performed to identify and exclude from analysis channels and trials with artifact and to remontage the recording data. The continuous ECoG recording is first inspected visually to identify and reject channels with excessive artifact or epileptiform activity. The continuous ECoG signal is then segmented into individual trials containing pre-stimulus baseline and post-stimulus intervals; these are then visually inspected to reject trials with artifact or epileptiform activity. Review by an epileptologist or clinical neurophysiologist is helpful to ensure correct identification of channels and trials with artifact. At our center, an epileptologist also routinely inspects the intracranial EEG prior to recording to rule out the presence of excessive spiking or epileptiform activity that can reduce the quality of the recordings. Once channels and trials with artifact have been excluded, the remaining channels can be remontaged for event-related analysis.
For our ECoG studies, we remontage to a common average reference (Sinai et al., 2005
, 2009
). For each sample of the ECoG signal in a given trial, an average of the voltages in all channels, excluding those with artifact or frequent epileptic discharges, is subtracted from the voltage in each individual channel. This spatial reformatting reduces variations in signal amplitude across the recording array that result from differences in distance between active electrodes and the reference electrode. Although this procedure is sometimes used in scalp EEG studies to approximate a neutral reference, this cannot be assumed, particularly in the case of intracranial recordings. The choice of reference electrode should be considered carefully so that noise and other prominent electrical activity are not inadvertently introduced into the signal. More complex reformatting, such as a Laplacian or local average reference, are not usually performed in ECoG studies. This is because they are difficult to implement with intracranial arrays, requiring exclusion of edge electrodes or use of a spline to approximate sites off the array. Moreover, these procedures were originally developed for scalp EEGs to approximate local sources, effectively functioning as high-pass spatial filters and, therefore, may not be necessary or appropriate for ECoG recordings. Although volume conduction from distant sources (i.e., far field potentials) can occur, signals recorded with intracranial electrodes are dominated by local sources within a few millimeters of the contacts such that signal features in adjacent electrodes are often very different (Crone et al., 2001a
; Sinai et al., 2005
, 2009
). Nevertheless, these procedures, as well as simpler alternatives (bipolar derivations), are important alternatives to consider, particularly when volume conduction from distant sources is suspected. Additional signal pre-processing for multichannel connectivity analyses is described separately below (see Signal Pre-processing for ERC Analysis).
Cortical auditory event-related responses are electrophysiology-based measures of neural activity generated, in response to sound, by neural sources in primary and non-primary auditory cortex located in the superior temporal gyrus of both cerebral hemispheres. We will focus on three types of cortical auditory event-related activity in ECoG signals: evoked responses; spectral (induced) responses; and multichannel event-related connectivity.
Evoked Auditory Responses
Evoked responses, also known as evoked potentials or ERPs, are synchronized, low-voltage, typically low-frequency (<50 Hz) electrical signals with latencies and amplitudes phase-locked to a stimulus. Because of their low amplitude, trial averaging in the time domain is used to extract evoked responses and identify individual component peaks (positive, negative). One of the earliest and largest cortical evoked responses is the vertex-negative N1 that peaks in adults around 75–120 ms after stimulus onset and is an automatic, transient response to sound onset or change, with generators in primary and non-primary auditory cortex (Scherg and von Cramon, 1986
; Naatanen and Picton, 1987
; Godey et al., 2001
). The N1 is embedded between two positive peaks – the P1 and the P2– forming a three-component evoked complex known as the P1-N1-P2. Later cortical auditory evoked responses include the N2, occurring approximately 200 ms post-stimulus onset (Halgren et al., 1998
; Hong et al., 2009
); the mismatch negativity that reflects pre-attentive detection of stimulus differences (Tiitinen et al., 1994
; Naatanen, 2001
; Naatanen et al., 2007
); and the P3 (or P300) response that has been investigated extensively in studies of auditory attention and other higher level cognitive and language functions (Knight et al., 1989
; Polich and Kok, 1995
). A variety of auditory stimuli can be used to elicit cortical event-related responses, ranging from simple sinusoidal tones to complex speech (Sinai et al., 2009
). Similarly, a number of different paradigms can be used to elicit cortical auditory event-related responses including passive listening tasks and active discrimination tasks (Crone et al., 2001b
; Sinai et al., 2009
). The choice of stimulus and paradigm is determined largely by the research hypothesis to be tested. Dependent variables in auditory ERP studies include peak latency (ms) and amplitude (dB).
Spectral Responses
It is well established that auditory stimuli also induce event-related changes in ECoG spectral power that are not phase-locked to the stimulus (Crone et al., 2001a
; Edwards et al., 2005
; Lachaux et al., 2007
; Sinai et al., 2009
). A variety of induced spectral responses, once considered ‘noise’ in the analysis of evoked responses, are now associated with perceptual and cognitive processing. Because spectral responses are not phase-locked to a stimulus, they are not evident in the averaged evoked waveform. To identify event-related spectral power changes, time–frequency analyses are used for averaging in the frequency domain rather than in the time domain. A number of different time–frequency methods are used to measure event-related changes in the ECoG spectrum, including short-time Fourier transform, wavelet transform, and matching pursuit (MP) (Mallat and Zhang, 1993
). Scalp recording studies have associated changes in a variety of EEG frequency bands with task-related cortical processing, including increases and decreases in theta (4–7 Hz), alpha (8–13 Hz), and beta (14–20 Hz) oscillations under different functional task conditions (Klimesch et al., 1993
; Neuper and Pfurtscheller, 2001
; Jensen and Tesche, 2002
; Struber and Herrmann, 2002
). Previous studies have also identified higher frequencies, including gamma (≥30 Hz), as potential indices of task-related cortical processing (Crone et al., 1998
; Tallon-Baudry and Bertrand, 1999
; Edwards et al., 2005
; Sinai et al., 2005
; Lachaux et al., 2007
). Event-related gamma activity has been associated with auditory, visual, and motor functions (Pantev et al., 1995
; Tallon-Baudry and Bertrand, 1999
; Pfurtscheller et al., 2003
; Sinai et al., 2009
). The same stimuli and experimental paradigms used to elicit cortical auditory evoked responses are used to induce changes in spectral power. Modulation of spectral intensity is measured in units of natural log power change.
Event-Related Connectivity
Recent advances in signal processing have engendered investigations of event-related functional interactions in the cortical networks associated with sensory, motor, cognitive, and language functions. Two main types of functional network interactions are recognized: functional connectivity and effective connectivity. Functional connectivity is defined as the temporal relations (coherences) between distant cortical regions, without reference to their directionality (causality). Effective connectivity refers to the causal interactions of cortical networks (Friston et al., 1994
; Astolfi et al., 2004
; Sporns et al., 2007
). A number of multichannel analysis methods have been developed to probe the dynamic interactions of auditory and other cortical functional networks, including Granger causality (Oya et al., 2007
; Gow et al., 2009
), dynamic causal modeling (Friston et al., 2005
; David et al., 2006
; Garrido et al., 2007
), independent component analysis (Onton et al., 2006
), direct Directed Transfer Function (dDTF) (Korzeniewska et al., 2003
), Short-time Directed Transfer Function (SDTF) (Ginter et al., 2001
, 2005
), and more recently Short-time direct Directed Transfer Function (SdDTF) (Korzeniewska et al., 2008
). We will focus on the SdDTF method which was developed at our center for evaluating multichannel causal interactions over brief periods (milliseconds) and is well suited for studying cortical sound processing. SdDTF originates from directed transfer function (DTF) (Kaminski and Blinowska, 1991
; Franaszczuk et al., 1994
), which is based on the concept of Granger causality. SdDTF uses multiple trials/repetitions (multiple realizations of the same stochastic process) to measure the dynamics of event-related functional interactions between cortical sites, using short time windows (Ding et al., 2000
).
Time-Domain Averaging
Auditory evoked responses are derived by averaging in the time domain because their latencies and amplitudes are time- and phase-locked to the stimulus. In contrast, background electrophysiological activity is not phase-locked and, therefore, is reduced by phase cancellation. The main goal of most clinical studies is to identify the largest evoked response for measurement (amplitude, latency). The largest response is often identified visually, without statistical testing. Existing analysis methods, such as independent component analysis, were developed to address the poor spatial resolution of scalp recordings through advanced source localization and signal de-noising (Makeig et al., 1997
; Delorme and Makeig, 2004
). Because the spatial resolution of intracranial recordings is considerably better than that of scalp recordings, these methods may not be necessary or applicable.
Recent ECoG studies have begun using statistical testing to compare event-related responses to the baseline signal (Edwards et al., 2005
; Towle et al., 2008
; Sinai et al., 2009
). This is useful for verifying waveform detection and for reducing potential biases associated with reliance on visual identification. This approach is also helpful for determining the spatial distribution of cortical evoked responses associated with different experimental conditions (Lachaux et al., 2007
; Towle et al., 2008
; Sinai et al., 2009
). Although there is no standard method for measuring baseline ECoG, the two most common approaches are computing the mean amplitude, based on a random sample of a fixed number of time points, and re-sampling of the time-series (Edwards et al., 2005
; Sinai et al., 2009
). Differences in response latency and amplitude can also be measured as a function of experimental conditions (stimulus, task) using linear regression with generalized estimating equations to account for correlation within subjects, as previously described (Liang and Zeger, 1986
; Boatman and Miglioretti, 2005
). Comparing the timing and size of evoked responses across multiple channels provides useful information on the spatial–temporal profiles of auditory cortical responses. However, performing multiple comparisons also increases the likelihood for false rejections. To address this issue, correction methods such as the Bonferroni method and false discovery rate (FDR) are increasingly used in ECoG studies. We discuss the problem of multiple comparisons and correction methods in more detail below (see Multiple Comparisons).
To quantify event-related changes in spectral composition, the ECoG signal is segmented into temporal epochs and transformed to the frequency domain for averaging across experimental trials. There are a number of different algorithms for converting the signal into the frequency domain, including discrete Fourier transforms, wavelets, and complex demodulation. Each method offers trade-offs between time and frequency resolution on the one hand and computational transparency and efficiency on the other. We use a time–frequency MP algorithm (Mallat and Zhang, 1993
; Franaszczuk et al., 1998
; Durka et al., 2001
; Ray et al., 2003
). MP is an iterative algorithm for adaptive time–frequency estimates of signal power. The MP method is well suited for analysis of non-stationary changes in the ECoG signal, and combines advantages of other time–frequency decomposition approaches – including short-time Fourier transform and wavelet transform – with enhanced time–frequency resolution, as demonstrated previously (Ray et al., 2003
; Sinai et al., 2005
, 2009
). The MP method is implemented in C, based on the original software (Mallat and Zhang, 1993
), and runs under Linux on a cluster of computer nodes (software program available upon request).
Spectral analyses of event-related electrophysiological responses often distinguish between phase-locked and non-phase-locked signal components. Phase-locked components are obtained by averaging across trials in the time domain, yielding traditional evoked potentials. When signals are averaged in the frequency domain, the resulting time–frequency averages include both phase-locked and non-phase-locked components. A variety of approaches can be used to isolate the phase-locked components in order to emphasize the non-phase-locked components of electrophysiological responses. The efficacy of these approaches depends largely on the validity of the phase-locked components, which are themselves somewhat of a methodological construct. A simple, but arguably simplistic, way to try to isolate non-phased-locked components is to subtract the time-domain-averaged signal (i.e., evoked potential) from each trial prior to averaging in the frequency domain (Crone et al., 2001b
). A similar approach is that of computing the inter-trial variance (Kalcher and Pfurtscheller, 1995
). Because the amplitudes of phase-locked components are typically much smaller than the ongoing raw signal, their contributions to the spectral analysis results are likely to be small. However, large inter-trial variation in the amplitude and latency of the evoked potential can introduce spurious energies when subtracted from the raw signal (Truccolo et al., 2002
). More advanced methods, including single-trial time–frequency analyses, may reduce the need for this procedure in the future. For now, the best approach may be to perform spectral analyses of signals with and without isolated phase-locked components, and in combination with time–frequency decomposition of the time-averaged evoked response itself (Trautner et al., 2006
). While this approach can help to elucidate the contributions of phase-locked and non-phase-locked components, it is important to recognize that inherent methodological limitations remain.
Matching Pursuit
The MP method decomposes the ECoG signal into a linear combination of time–frequency functions termed ‘atoms’, drawn from a large dictionary of functions well localized in the time–frequency plane. We implement the MP method using a dictionary of sine functions that have well-defined frequencies; Dirac delta functions that are localized in time; and sine-modulated Gaussians – Gabor functions. Gabor functions are characterized by the highest combined time–frequency resolution based on the uncertainty principle in time–frequency analysis that states that σfσt ≥ 1/2 where σf and σt represent spread of the function in frequency and time, respectively. It can be shown that equality is achieved only for Gabor functions (i.e., modulated Gaussian functions) (Mallat and Zhang, 1993
). The atom representing the maximum energy of the signal (i.e., the largest inner product with the signal) is selected first; atoms in the dictionary representing the maximum energy of the residual are then determined iteratively. After M-th iteration the signal f(n) is expressed as:

where Rmf is the residual after the m-th iteration, gm is the atom selected in m-th iteration, n is the digitized signal sample number, and 〈Rmf,gm〉 denotes the inner product of residual Rmf and atom gm. The time–frequency energy distribution is then computed by summing the Wigner–Ville distribution of the Gabor atoms expressed as:

where EMf(n,k) represents energy of signal f in discrete time n and discrete frequency k after M steps of iteration, and EVgm(n,k) represents the Wigner–Ville distribution of atom gm. Evgm(n,k) is represented as an ellipsoid in two-dimensional time–frequency plane for Gabor atoms, as a horizontal line for sines, and as a vertical line for Dirac deltas. The presence of electrical artifact (line noise) in the recordings is represented in the decomposition by sine or Gabor atoms, with a central frequency around 60 Hz in the United States (50 Hz in Europe) and its harmonics, and is typically excluded from summation in energy computation.
Time–frequency decomposition is performed for each trial separately. The lengths of the pre-stimulus and post-stimulus epochs are determined largely by the parameters (e.g., inter-stimulus intervals) of the experimental recording paradigm. For each frequency, the baseline (pre-stimulus) power is computed by averaging over all baseline time points within a trial and over all trials. To test the null hypothesis that event-related spectral power changes do not differ from baseline, estimates of pre-stimulus (baseline) and post-stimulus spectral power in each post-stimulus time point are compared. We use a logarithmic transformation and the Student’s t-test to assess statistical significance of the differences (Zygierewicz et al., 2005
). The t statistic is computed as:

where  is the average of log[EM(n,k)] for post-stimulus time-points n and frequency k over N trials,
  is the average of log[EM(j,k)] over baseline points j and N trials, and sE is a weighted estimator of the standard deviation. The statistics tn,k follow Student’s t distribution with N(1 + K) − 2 degrees of freedom, where N is the number of trials and K is the number of baseline time points.
is the average of log[EM(n,k)] for post-stimulus time-points n and frequency k over N trials, is the average of log[EM(j,k)] over baseline points j and N trials, and sE is a weighted estimator of the standard deviation. The statistics tn,k follow Student’s t distribution with N(1 + K) − 2 degrees of freedom, where N is the number of trials and K is the number of baseline time points.Figure 2
shows results of single-channel MP analysis of spectral responses to two different stimuli (speech, tones) recorded from the same lateral temporal lobe site in one patient. Of interest is the observation that both simple tones and complex speech stimuli induced high frequency (gamma) spectral responses at sites in non-primary auditory association cortex. This finding challenges the traditional view that non-primary auditory areas are involved only in processing complex sounds.
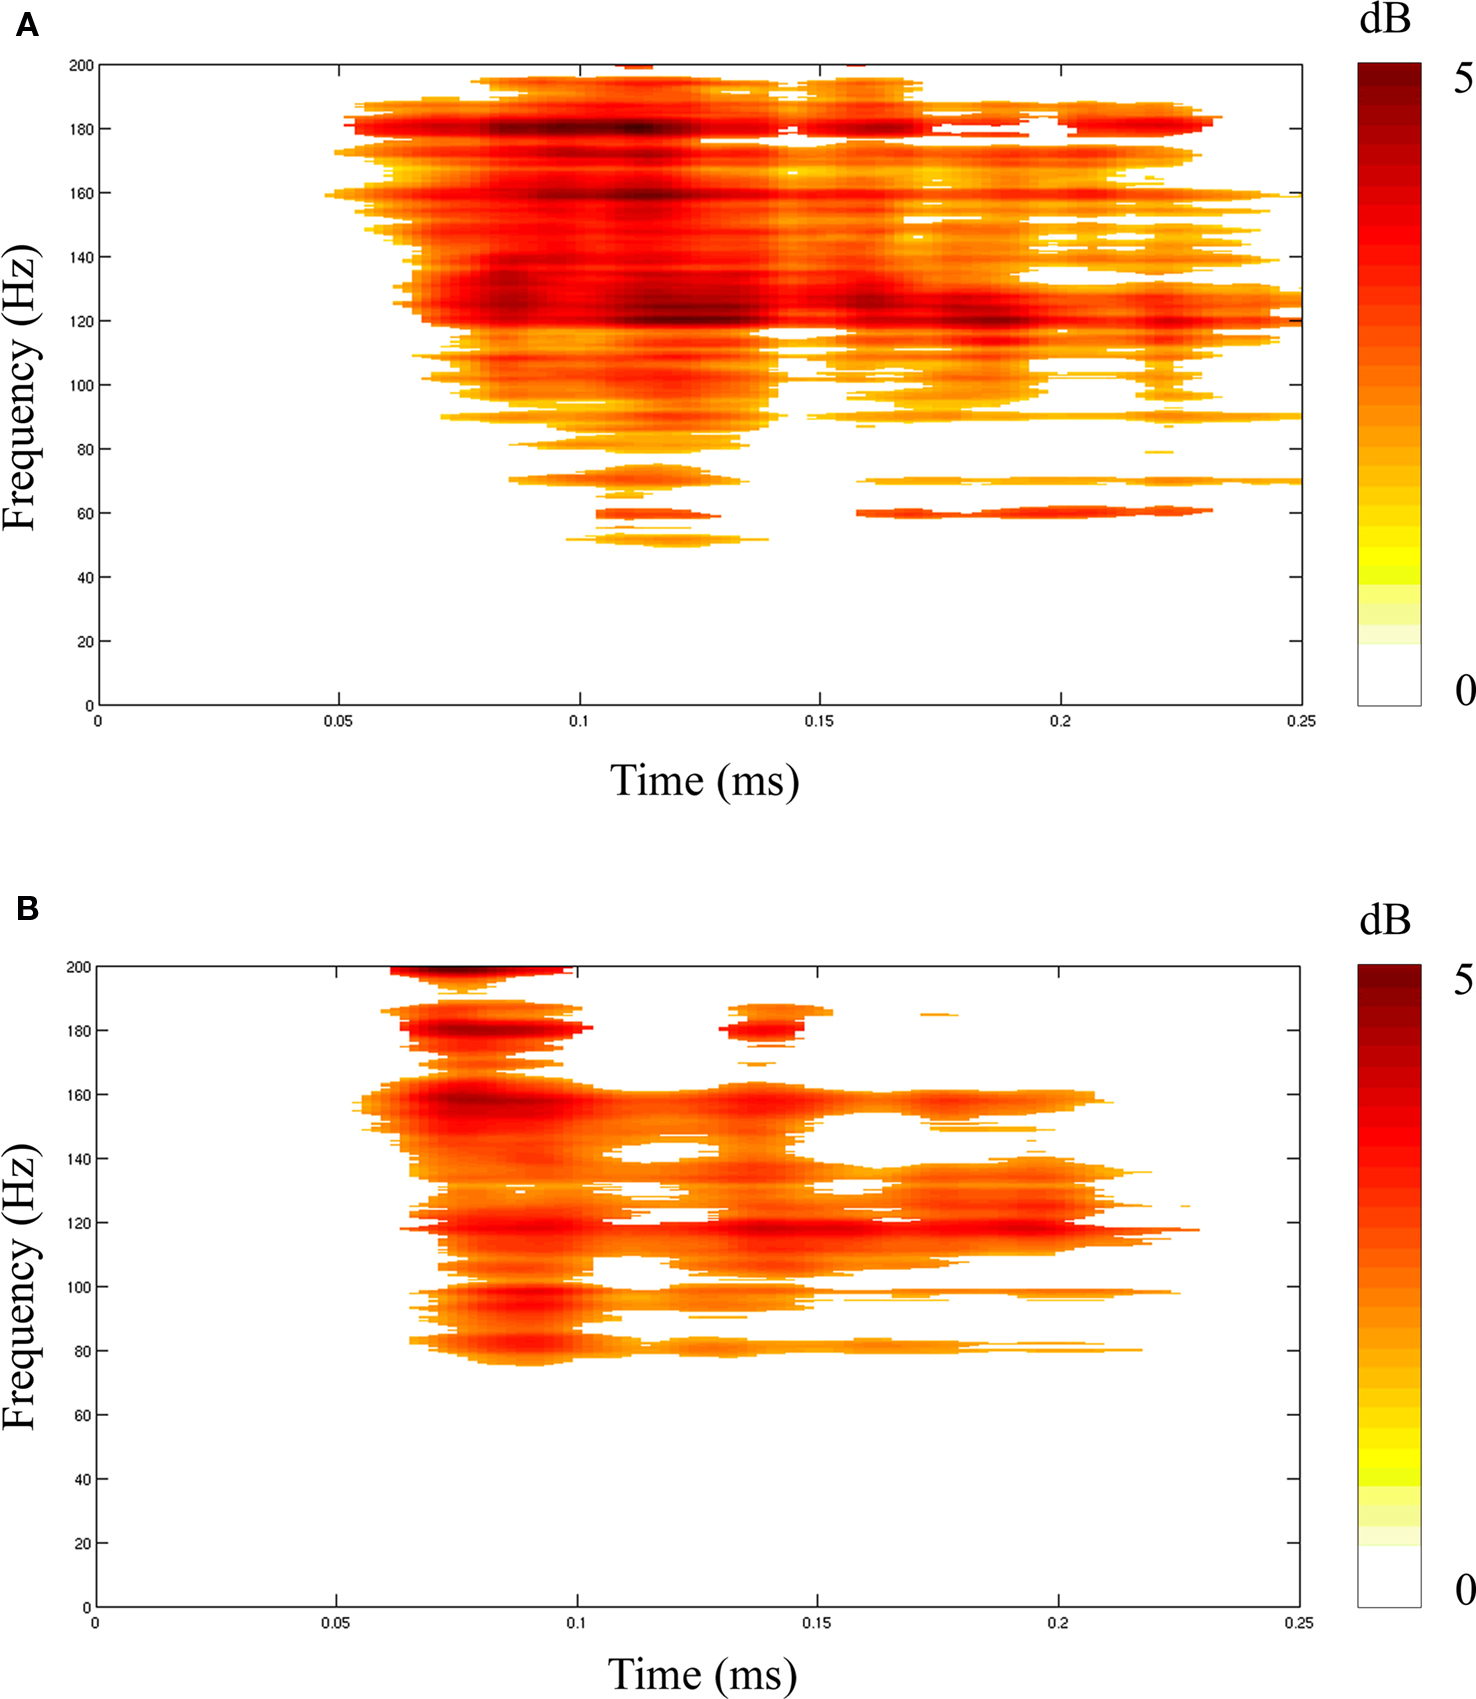
Figure 2. Results of matching pursuit analysis showing statistically significant spectral power changes (0–200 Hz) occurring 0–250 ms following onset of speech (A) and tone (B) stimuli and recorded from the same electrode site located on the convexity of the posterior superior temporal gyrus in one patient. Scale bar to right of each panel shows color scale of spectral power changes (dB). Largest spectral power changes are shown in red.
To correct for multiple within-subject comparisons, the Bonferroni correction or FDR is applied, as discussed below (see Multiple Comparisons) and as previously described (Zygierewicz et al., 2005
; Sinai et al., 2009
). The resulting time–frequency energy distribution reflects the magnitude and statistical significance of energy changes over time. Time–frequency points (pixels) representing statistically significant changes from baseline can also be plotted across the frequency range by experimental conditions (stimulus, task), as shown in Figure 2
.
Quantifying differences in spectral responses across experimental conditions (stimulus, task) poses additional challenges. Simple comparisons of spectral responses in the same time–frequency pixel in different experimental conditions can be readily performed by t-test (Figure 3
). However, these parametric tests do not capture visible differences in the relative size, morphology (shape) and timing of two (or more) spectral responses, as seen in Figure 3
. Quantifying these differences in spectral responses will require new statistical approaches.
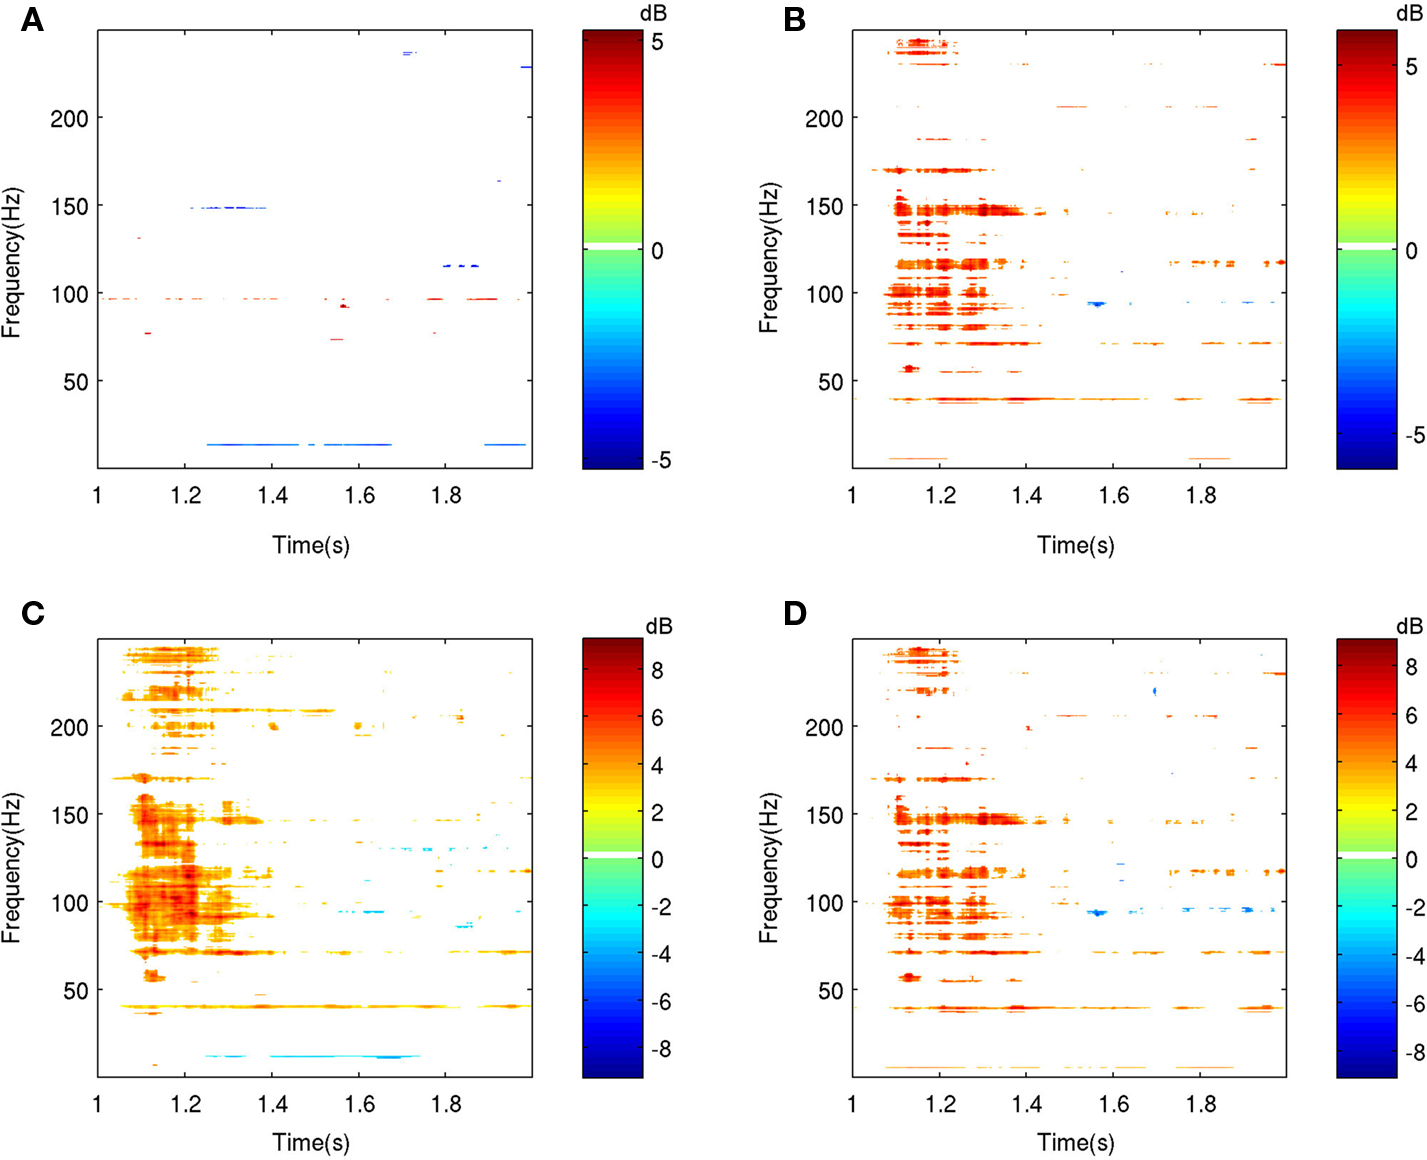
Figure 3. Statistical comparisons of event-related spectral power responses (dB) elicited with two different auditory stimuli (tones, speech) from the same ECoG channel (electrode) on the lateral superior temporal gyrus. Spectral responses that differed significantly from their respective baselines are shown for (A) tones and (B) speech. Comparisons of two spectral responses (A versus B) showed significant differences when the response to tones was subtracted from the response to speech, as shown in (C,D). Results of two statistical comparisons are shown for: a t-test assuming unequal variances (C) and a paired t-test for Z-scores (D). False discovery rate correction for multiple comparisons was applied for both tests. The similarity of test results indicates similar variances, likely reflecting the common data sources (channel,subject).
Methodological Considerations
The length of pre-stimulus (baseline) and post-stimulus epochs is determined in part by the experimental protocol and, in particular, by the inter-stimulus interval. For our auditory ECoG studies, we use relatively short inter-stimulus intervals (∼1–2 s) which allow us to record larger numbers of trials. However, using shorter time windows can make it more difficult to detect power changes in lower frequencies (alpha, beta).
The MP method is useful for studying non-phase-locked, event-related changes in ECoG signals. This approach is well suited for capturing the brief (milliseconds), rapidly changing neural responses characteristic of cortical sound processing. We have used this approach in our recent studies to characterize spectral responses to different auditory stimuli (tones, speech) in auditory association cortex (Ray et al., 2003
; Sinai et al., 2009
). Studies from our center and others have shown that spectral and time-domain analyses are complementary, each providing important clinical information and new insights into the functional organization of the human cortical auditory system (Crone et al., 2001a
; Edwards et al., 2005
; Lachaux et al., 2007
; Towle et al., 2008
; Sinai et al., 2009
).
Previous intracranial auditory recording studies have identified statistically significant event-related changes in ECoG spectral power using single-channel time–frequency analyses (Crone et al., 2001a
; Lachaux et al., 2007
; Sinai et al., 2009
). Non-phased-locked changes in spectral power, once considered ‘noise’, are now thought to be neural indices of regional and distributed cortical processing, providing a useful tool for probing the functional organization of cortical networks (Engel and Singer, 2001
; Singer, 1993
). As a result, there is now considerable interest in investigating effective neural connectivity based on the dynamic patterns of event-related propagation of the non-phase locked activity. Event-related causality (ERC) is a new method for measuring event-related changes in causal interactions between multi-electrode recording sites, to estimate the effective connectivity of cortical networks engaged by functional tasks (Korzeniewska et al., 2008
). The ERC method measures statistically significant event-related changes in the direction, strength, and spectral content of direct electrophysiological interactions between brain sites and their timing. In the following sections, we describe the multichannel ERC method and its application to ECoG data, including auditory event-related recordings.
Event-Related Causality
ERC is based on the concept of Granger causality, which was originally developed for economic modeling and predictions (Granger, 1969
). Granger causality postulates that an observed time series xk(t) causes another time series xl(t) if knowledge of xk(t)’s past significantly improves prediction of xl(t). This approach was implemented in multiple time series by fitting a multivariate autoregressive (MVAR) model, and has been used recently to study the dynamics of causal interactions between neural populations for signals assumed to be either stationary (Brovelli et al., 2005
; Krichmar et al., 2005
; Seth, 2005
; Cadotte et al., 2008
, 2009
; Anderson et al., 2009
; Keil et al., 2009
), or non-stationary (Freiwald et al., 1999
; Hesse et al., 2003
). By using frequency decomposition of Granger’s time domain (Geweke, 1982
) it is possible to examine spectral properties of Granger causality (sometimes referred as Granger–Geweke causality), which is useful for neurophysiological signals, where frequency domain is often of interest. The Granger causality technique is a ‘model-free’ measure of causal interactions in that it is not based on a priori assumptions about anatomical or functional connections. However, it is based on a statistical linear model and cannot describe non-linear causal interactions. The concept of Granger causality led to development of multiple related methods, including structural analysis (Bernasconi and Konig, 1999
); partial directed coherence (Sameshima and Baccala, 1999
; Baccala and Sameshima, 2001a
,b
; Schelter et al., 2006
); and DTF (Kaminski and Blinowska, 1991
; Franaszczuk et al., 1994
; Kaminski et al., 2001
; Astolfi et al., 2005
; Kaminski and Liang, 2005
). A number of these methods have been compared previously (Kus et al., 2004
; Eichler, 2005
; Winterhalder et al., 2005
; Schlogl and Supp, 2006
; Astolfi et al., 2007b
). In particular, a study by Kaminski et al. (2001)
showed equivalence of DTF and bivariate Granger causality. Other methods that are not based on the Granger causality concept have also been used to determine functional connectivity, including calculations of evoked potential covariances (Gevins et al., 1995
); adaptive phase estimation (Schack et al., 1999
); effective information (Tononi and Sporns, 2003
); the imaginary part of coherency (Nolte et al., 2004
); and directed information transfer (Hinrichs et al., 2008
). In this paper we will discuss only the SdDTF method, which is a modification of the DTF method and therefore also a linear Granger-like causality measure.
The MVAR model assumes that the values of multiple time series from K recording sites/channels – vector  – at time t, depend on p previous values of the time series, and the random components vector
  . When the MVAR model is fitted to ECoG signals from K channels, they are treated as one multivariate stochastic process, expressed as:
– at time t, depend on p previous values of the time series, and the random components vector . When the MVAR model is fitted to ECoG signals from K channels, they are treated as one multivariate stochastic process, expressed as:
where Aj is a K × K MVAR coefficients matrix and p is the model order. To determine the value of model order p, the Akaike Information Criterion is applied (Akaike, 1974
). The MVAR model coefficients were computed using a Yule–Walker algorithm implemented in C (Franaszczuk et al., 1985
). Because ECoG activity may be understood in terms of rhythms and oscillations, it is useful to describe the spectral properties of their signals. For this purpose the MVAR equation may be transformed to the frequency domain (Marple, 1987
) as:

where
H(f) is the transfer function of the multichannel system, f is frequency, and Δt is the sampling interval. The element hkl of the matrix H(f) describes the transfer function between the k-th output and the l-th input of the system. If the element hkl of H is equal to 0, the hypothesis that xk(t) causes xl(t) can be rejected. The matrix is not symmetric if any of the channel pairs (k,l) have unequal flows in both directions. As such, the directional properties of a multichannel system may be interpreted as Granger causal relationships, signal flows, or activity transfers. If H is symmetric, directionality cannot be determined. The direct transfer function was developed as a normalized version of H matrix (Kaminski and Blinowska, 1991
; Franaszczuk et al., 1994
; Kaminski et al., 2001
; Astolfi et al., 2005
; Kaminski and Liang, 2005
). The DTF method has also been used to study activity flow in amnesic and Alzheimer’s patients (Babiloni et al., 2009
); Parkinson’s patients (Androulidakis et al., 2008
; Lalo et al., 2008
); and spinal cord injury patients (Astolfi et al., 2006
), and in studies of seizure onset and neural circuitry (Franaszczuk et al., 1994
; Franaszczuk and Bergey, 1998
; Ge et al., 2007
); wake-sleep transitions (De Gennaro et al., 2004
, 2005
); working memory (Edin et al., 2007
); memory encoding and retrieval (Babiloni et al., 2006
); and animal behavior (Korzeniewska et al., 1997
). Recently, DTF and related methods have also been used to investigate causal influences in functional MRI (fMRI) data (Deshpande et al., 2006
, 2008
; Hinrichs et al., 2006
; Sato et al., 2008
; Wilke et al., 2009
), and to develop brain computer interfaces (Shoker et al., 2005
).
To capture the dynamics of ERC, various modifications of MVAR model fitting can be applied (Astolfi et al., 2007a
, b
; Wilke et al., 2007
). The SDTF (Ding et al., 2000
), a modification of the DTF method, uses short, overlapping time windows that are shifted along the signals when there are multiple task repetitions (considered as a realization of the same stochastic process), or trials, to track brief changes in the flow of activity between brain regions (Ginter et al., 2001
, 2005
; Kaminski et al., 2005
; Kus et al., 2006
, 2008
; Philiastides and Sajda, 2006
; Korzeniewska et al., 2008
).
Granger causality and DTF methods identify both direct and indirect relationships between signals. For example, for three signals related as follows: x1 → x2 → x3, these methods will show not only flows x1 → x2 and x2 → x3 but also x1 → x3 (indirect flow). To detect only direct relationships, a partial coherence function can be utilized. By multiplying this function with DTF, the dDTF is obtained which describes only direct flows (Korzeniewska et al., 2003
). However, the partial coherence function can also yield spurious relationships, as when two non correlated signals are added to form a third signal. This will result in spurious partial coherence between to non correlated signals: the so called ‘marrying parents of a joint child effect’ (Schelter et al., 2006
). However, in this case DTF will show no flow and dDTF will avoid the spurious effect. The recently developed SdDTF method involves a synthesis of both the SDTF and the dDTF collectively (Korzeniewska et al., 2008
), in the form:
where χkl are elements of partial coherence matrix. The SdDTF function determines whether a signal component at a given frequency in channel k is shifted in time with respect to a signal component of the same frequency in channel l, and whether the shifted components are coherent and are not explained by components of other channels. SdDTF takes values from 0 to 1. Zero indicates a lack of direct causal relationships. The non-zero values of SdDTF are interpreted as a flow of activity from one channel to another, that is, ζkl(f) > 0 indicates flow of activity from channel l to channel k(l → k). The temporal evolution of causality estimates can then be obtained by calculating them in a short window that is shifted along the signal of interest, as previously described (Korzeniewska et al., 2008
).
The interpretation of event-related causal interactions is constrained by the available measurements. As in all scientific inference, missing information can lead to false interpretation. In multichannel analyses, it is important to include measurements from all brain regions that are responsible for the analyzed task. When neural networks associated with functional processing are only partially represented, spurious causalities may result (Eichler, 2005
; Krichmar et al., 2005
). Removing, adding or replacing crucial recording sites from the analysis is most likely to produce artificial causalities (Eichler, 2005
). Conversely, inclusion, deletion, or replacement of recording sites that are not crucial for the analyzed system may not substantially change the patterns of causal interactions (Korzeniewska et al., 2008
). This issue can be addressed by using approaches like partial directed coherence, dDTF, and SdDTF – all of which emphasize direct flows or interactions – and by increasing the number of channels. Nevertheless, it is important to have relatively comprehensive coverage of regions known to be functionally important, such as the superior temporal gyrus, for studying auditory processing. This is also illustrated in the application of SdDTF to auditory ECoG data described below (see Estimating ERC in auditory event-related ECoG): the patient had multiple electrodes covering the superior temporal gyrus and recording sites selected for inclusion were identified based on previous analyses of auditory event-related power spectra.
In drawing conclusions from these analyses, several limitations warrant consideration. As in any scientific investigation, we are limited to the set of recorded signals and these could be influenced by other processes not detected in the analysis. For example in the network x1 → x2 → x3, a fourth undetected process could be involved such that x1 → x4 → x3. This limitation underscores the importance of carefully choosing recording sites for analysis and ensuring adequate representation of all regions associated with the function under investigation. The second limitation of methods based on Granger causality, including dDTF, is the inability to correctly identify cyclical interactions (for an excellent discussion of these issues, see Eichler, 2006
).
Causal interactions can be both linear and non-linear in brain systems. Previous studies have suggested that non-linear mechanisms may play an important role in the functional connectivity of large-scale neural networks (Friston, 1997
; Schanze and Eckhorn, 1997
; Bekisz and Wrobel, 1999
; Breakspear and Terry, 2002a
,b
; Senkowski et al., 2007
). ERC is a linear method and does not provide information about the nature of the causality (linear or non-linear). Nevertheless, linear methods may be sensitive to both linear and non-linear causal interactions (Freiwald et al., 1999
; Chavez et al., 2003
; Gourevitch et al., 2006
). Indeed, MVAR models can be used to describe non-linear systems (Franaszczuk and Bergey, 1999
). The detection of dependencies by linear methods does not require that those dependencies are linear (Freiwald et al., 1999
). Thus, the ERC method cannot determine if the observed activity flow changes are due to linear or non-linear dynamics. However, it has been shown that higher-degree non-linearity models do not provide a clear advantage over linear ones (Barbero et al., 2009
). A recent study using a non-linear Granger causality approach (Gourevitch et al., 2006
) showed that functions similar to SdDTF (directed coherence, partial directed coherence) appear to correctly identify linear linkages even if the autoregressive components are non-linear. On the other hand, non-linear Granger causality can yield interesting results for complex systems, but remains dependent on the parameters of the method (order and scale chosen). Linear methods can correctly identify frequency-specific causal interactions if the analysis includes the relevant frequencies. In the functioning brain, it is likely that there are always causal interactions between neural populations in multiple brain regions. Therefore, to identify task-specific patterns of interaction, it is necessary to examine changes in those baseline interactions that correlate with a task.To evaluate the statistical significance of event-related changes in SdDTF (i.e., ERC), we implement a statistical test to compare pre-stimulus (baseline) with post-stimulus SdDTF values. Specifically, a semi-parametric regression model is applied to SdDTF values calculated from pre- and post-stimulus periods. The windowing strategy described earlier can be viewed as a first step in smoothing the time-dependent SdDTF function, especially when the analysis windows are overlapping. However some of the noise inherent in the original signal will be resistant to this smoothing method. Hence, we employ a formal bivariate smoothing model that takes into account both the frequency f, and the temporal window t, which is defined as:

where g(f,t) is an unspecified function representing the actual SdDTF function and εft are independent N(0,σε2) random variables capturing the white noise around the signal. There are many nonparametric approaches to bivariate smoothing, but here we use a penalized thin-plate spline model for g(.,.). The model was implemented in R using the SemiPar software package
1
. The method and its implementation in R has been described previously in detail (Ruppert et al., 2003
).
The SdDTF is a non-stationary function, both in baseline and post-stimulus periods, accounting for the non-stationarity of the baseline signal and represents a recent improvement over previous approaches (Korzeniewska et al., 2008
). The mean SdDTF value of each pre-stimulus baseline window is compared with the mean SdDTF value of each post-stimulus window using a t-test designed for the null hypothesis of zero differences between the SdDTF means. We conclude that there is significant event-related change in causal interactions within a given post-stimulus time window if the SdDTF value for this window is significantly different from all SdDTF values in the baseline period. If the SdDTF value for the post-stimulus time T is significantly higher than all values of SdDTF for every time t of the baseline period, we say that there is a significant increase in causal interaction. Our goal was to test for every frequency f, and for every baseline/stimulus pair of time windows (t,T), whether g(f,t) = g(f,T). More precisely, the implicit null hypothesis was expressed as:
with the corresponding alternative:
These hypotheses were tested by constructing a joint 95% confidence interval for the differences g(f, t) − g(f,T) for t = t1,…,tn. Let  ,
, , be the penalized spline estimator of g(f,t) and its associated estimated standard error in each baseline time window. Similarly, let
  ,
, , be the penalized spline estimator of g(f,T) and its associated estimated standard error in each post-stimulus time window. Since the penalized spline functions are fitted locally, the residuals are assumed to be independent at points well separated in time and randomly distributed. We can also assume that for every baseline/stimulus pair of time windows (t,T):
,, be the penalized spline estimator of g(f,t) and its associated estimated standard error in each baseline time window. Similarly, let ,, be the penalized spline estimator of g(f,T) and its associated estimated standard error in each post-stimulus time window. Since the penalized spline functions are fitted locally, the residuals are assumed to be independent at points well separated in time and randomly distributed. We can also assume that for every baseline/stimulus pair of time windows (t,T):
approximates a standard normal distribution. We confirmed these assumptions with the Kolmogorov–Smirnov normality test. A joint confidence interval with at least 95% coverage probability for g(f,t) − g(f,T) is defined as:

where m.95 is the 97.5% quantile of the distribution:

where Nt,T,f are independent N(0,1) random variables. This test rejected H0,f,T if 0 was not contained in any of the corresponding confidence intervals. To account for multiple comparisons, either a Bonferroni correction or the less conservative FDR can be implemented. The choice of correction method will depend on whether there is greater concern about incorrectly assigning statistical significance to a particular pattern, as in an initial exploratory analysis, or about failing to detect statistically relevant patterns (for detailed discussion see Korzeniewska et al., 2008
). By definition, the ERC method provides an estimate of the directions and magnitudes of statistically significant event-related changes in direct activity propagation between brain sites, as a function of frequency. In other words, ERC corresponds to SdDTF, but is masked according to the statistical significance of event-related changes in SdDTF.
ERC Methodological Considerations
The number of data samples and length of the time window are two important considerations in applying the ERC method. A sufficient number of data samples are needed for the MVAR model to fit appropriately the recording data. Similarly, the length of the data analysis window should be sufficiently short to allow the data to be treated as stationary, but not so small that it precludes measuring jitter in the recorded signal across trials. It is recommended that the number of parameters be <10% of the total number of data samples. The number of data samples should also be several times greater than the number of channels (K). As in previous studies, we estimate the sufficient number of data samples by the inequality:
where Ns is the length of the moving window (e.g., the number of samples per recording epoch) and nt is the total number of trials. Selection of recording channels can be guided by results of the single-channel MP analyses (described in Spectral Analysis). The rationale for this is that event-related causal interaction between ECoG signals is more likely to occur at sites where an event-related increase in signal energy is evident.
Signal Pre-Processing for ERC Analysis
The raw ECoG time series is first pre-processed as for single-channel spectral analyses (see Signal Pre-processing). Remontaging to a common average reference (see Signal Pre-processing) is useful for removing unrelated global activity prior to ERC analysis (Yao et al., 2005
, 2007
; Ludwig et al., 2009
). For ERC analysis, pre-processing is important to remove artifact, including high-frequency noise, to select specific frequency bands for analysis, and to remove phase-locked activity from the signal. To accomplish the first two objectives, the ECoG signal is digitally band pass-filtered and down-sampled. Signals can be filtered to include a single frequency range or multiple frequency ranges. However, it is important to ensure that the filter does not change the signals’ phase properties and that the filter’s impulse response is short.
For ERC analysis, the third purpose of signal pre-processing is to remove the phase-locked activity. As discussed earlier (see Spectral Analysis), the resulting non-phase-locked activity, previously considered ‘noise’ in ERP studies, contains task-relevant information (Kalcher and Pfurtscheller, 1995
; Ding et al., 2000
) that cannot be inferred solely from the ERP (Crone et al., 2001a
; Senkowski and Herrmann, 2002
; Senkowski et al., 2007
). Moreover, causality analyses with and without subtraction of the ensemble average have revealed spurious causality responses when subtraction was not performed (Oya et al., 2007
). To remove phase-locked components that may obscure non-phase-locked activity and to meet MVAR model requirements, the mean signal values in each window are computed and subtracted from the signal. This results in a zero mean signal in each window, which is required for fitting the MVAR model (Eq. 4) To normalize signal amplitudes across channels, the signal in each window is then divided by its standard deviation. This normalization allows comparison of flow changes between different stages of task processing and different channel pairs independent of the relative amplitudes of the signals (Ding et al., 2000
).
Estimating ERC in Auditory Event-Related ECoG
Figure 4
illustrates results of a recent ERC analysis of auditory event-related responses from an adult patient who had a focal right parietal dysplasia, with complex partial seizures, and who had a right subdural electrode grid implanted for pre-surgical monitoring. The top panel depicts a transmission matrix of statistically significant event-related changes in the flow of activity between electrode sites during the first 200 ms after presentation of a speech syllable (/da/; 300 ms). A number of relevant transmissions can be seen. The location of the most prominent flows occurs in the first 150 ms at recording sites on the lateral posterior superior temporal gyrus, corresponding to auditory areas known to be critical for processing complex sounds, including speech (Miglioretti and Boatman, 2003
; Boatman et al., 2000
; Boatman, 2006
; Sinai et al., 2009
). The relationships between sites of sound processing are illustrated in the bottom panel of Figure 4
. The arrows represent integrals of changes in causal interactions during the time course of sound processing. The color and width of the arrows represent the magnitude of integrals, over the analyzed period, of statistically significant ERC values. The cluster of arrows focused on the posterior superior temporal gyrus and inferior parietal cortex are consistent with the proposed local processing networks for complex sounds in auditory association cortex (Crone et al., 2001a
; Boatman, 2004
, 2006
; Boatman and Miglioretti, 2005
; Edwards et al., 2005
; Lachaux et al., 2007
). The directionality and magnitude of the changes in causal interactions within this local processing network can be represented schematically, as shown in Figure 5
. These results illustrate the utility of multichannel ERC analyses, which provide information about effective connectivity between cortical sites that cannot be obtained from single-channel analyses. We view these two methodological approaches as largely complementary; each provides important information about the functional organization of the cortical auditory system.
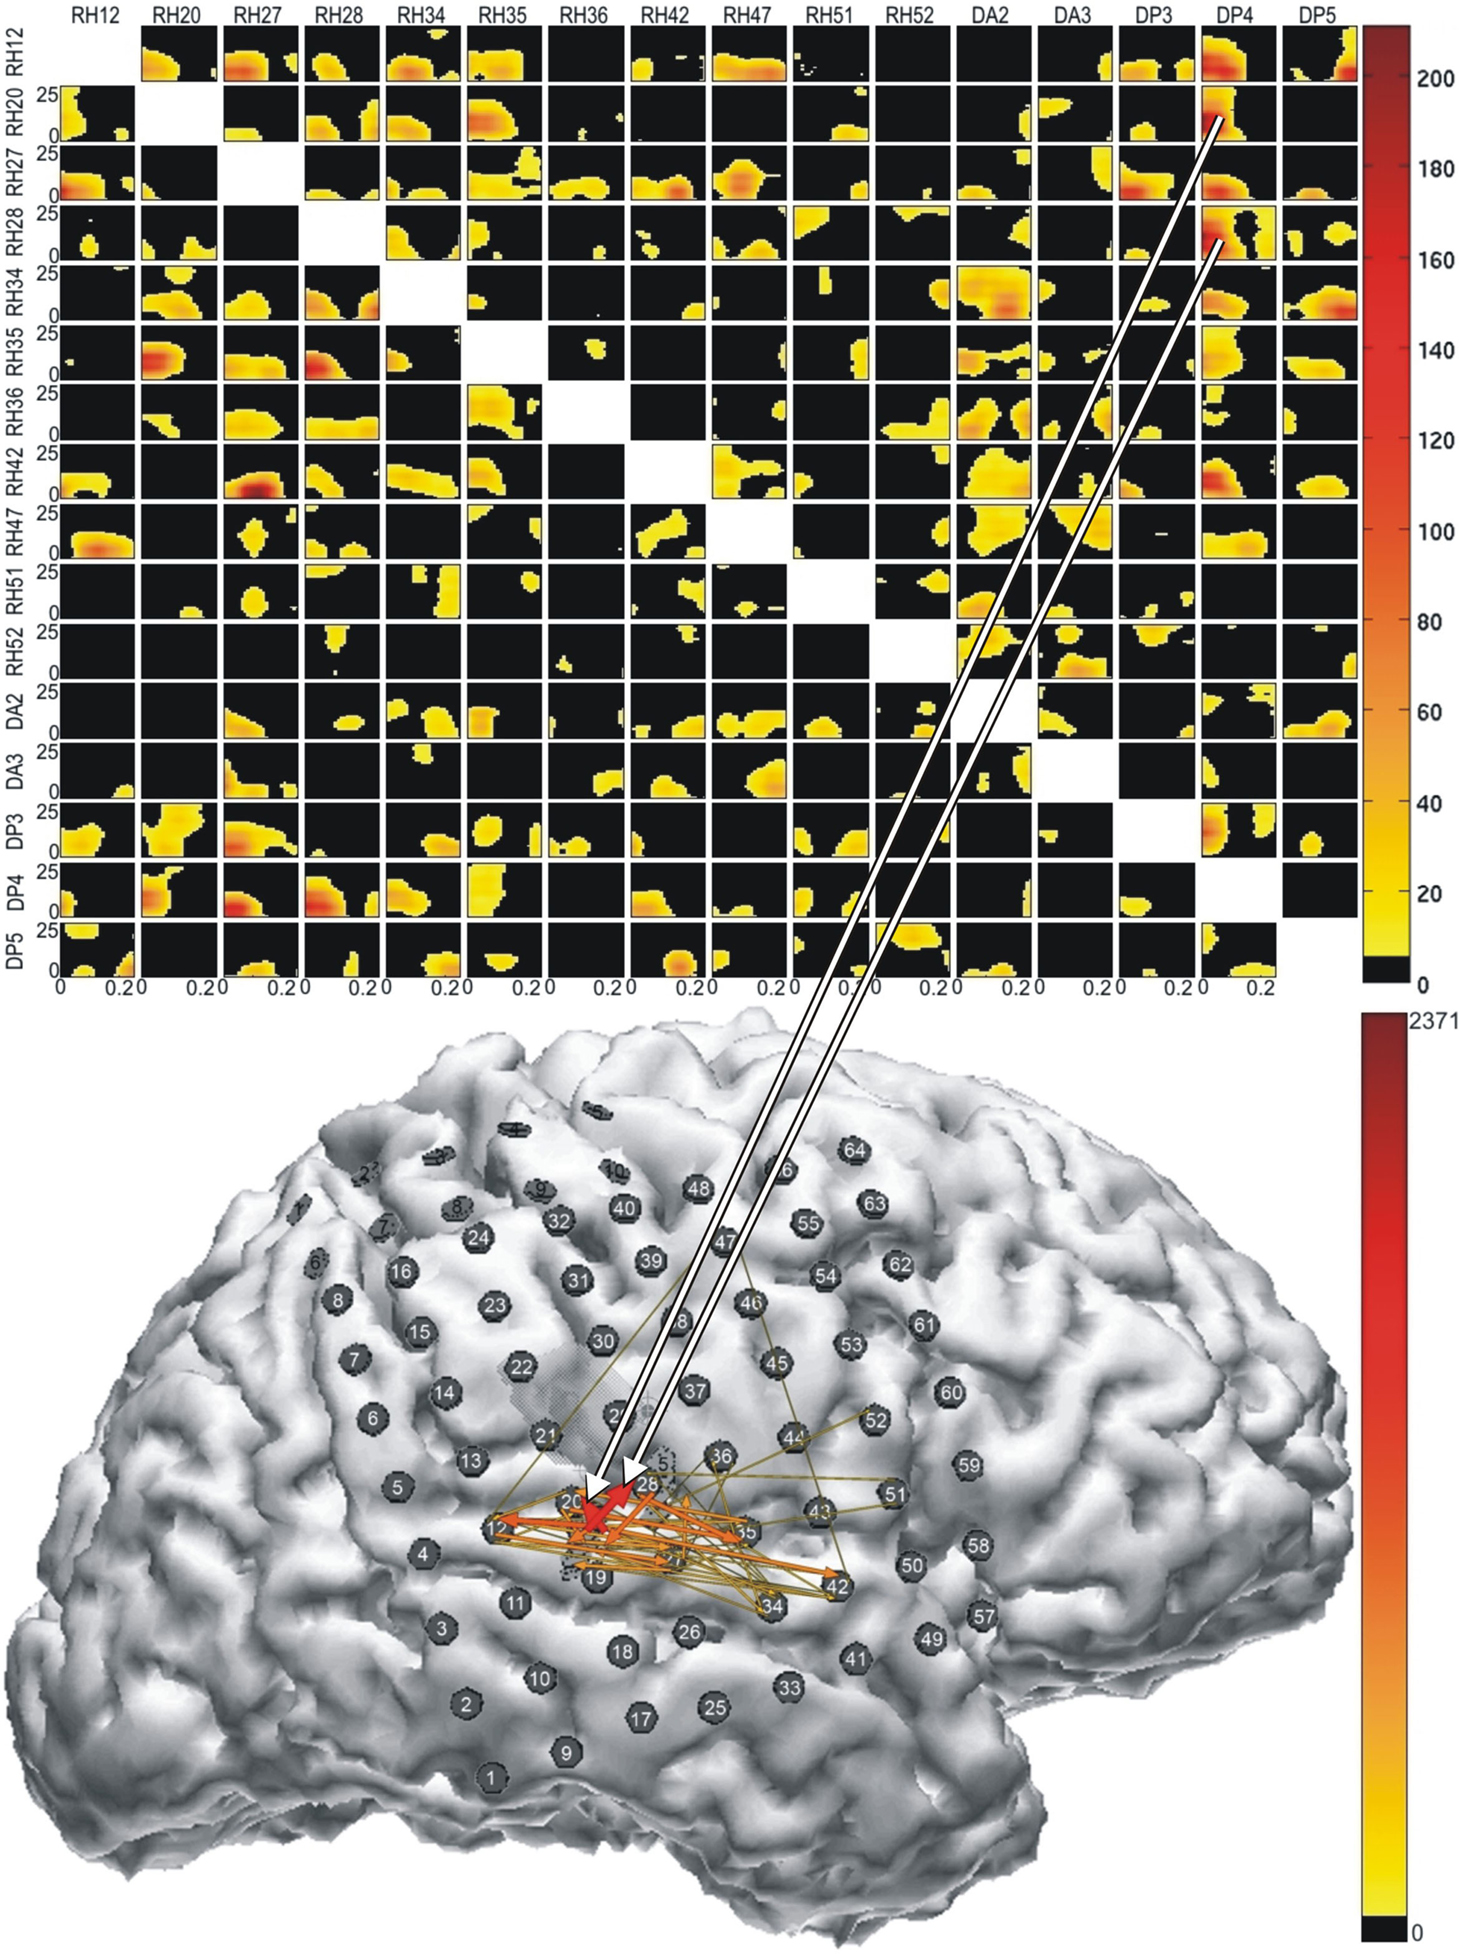
Figure 4. Results of multichannel event-related causality (ERC) analysis of ECoG signals recorded from a patient listening to speech sounds (syllables). Top panel shows ERC matrix. Direction of ERC flow is from the electrode labeled above each column to electrode labeled at left of each row. Time is on the horizontal axis (1–250 ms); frequency (0–25 Hz) is on the vertical axis. Color scale of ERC values (0 to max) is shown to right of array. Black indicates time–frequency points with no significant difference between SdDTF values after stimulus and SdDTFs for baseline. Colored time–frequency points indicate increases in post-stimulus SdDTF relative to baseline SdDTF (red > orange > yellow). Bottom panel depicts integrals of ERC for frequency range 0–25 Hz calculated for the same ECoG data set. Arrows indicate directionality of ERC. Width and color of arrows represent values of ERC integrals. Color scale is at the right. For clarity, only integrals for event-related flow increases are shown. White projecting lines show how matrix cells in top panel correspond to electrode recording channels in bottom panel.
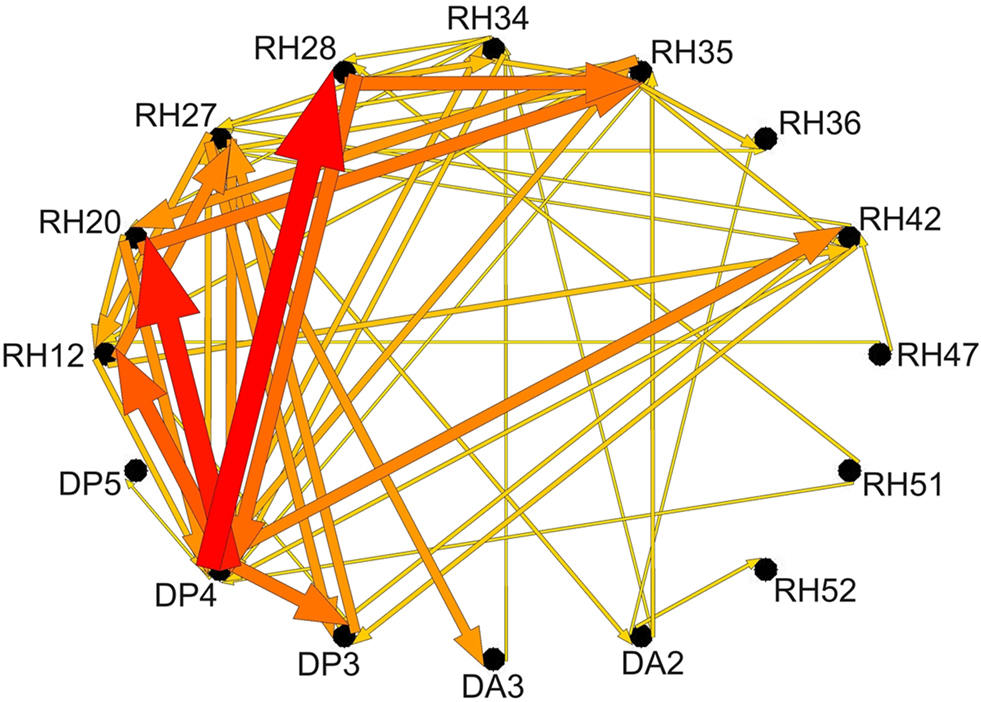
Figure 5. Schematic representation of ERC integrals for frequency range 0–25 Hz as shown in bottom panel of Figure 4
. Labels around the outside represent electrode channels shown in Figure 4
. Arrows indicate directionality of ERC. Arrow width and color represent the values of ERC integrals shown in Figure 4
.
Electrode placement for intracranial monitoring is determined by each patient’s clinical circumstances, resulting in restricted spatial sampling in individual patients and variability across patients. The ability to compare electrode locations across patients has become a challenge as ECoG studies have expanded from single case reports to include larger numbers of subjects. Volumetric three-dimensional (3D) MRI scans are obtained routinely before electrode implantation surgery and 3D CT scans are often used for post-implantation imaging. To localize electrodes in individual patients, the pre-implantation MRI and post-implantation CT scans must be co-registered. To compare electrode locations across patients (groups), individual 3D electrode positions are then transformed to a common reference space. The Talairach and Montreal Neurological Institute (MNI) 3D coordinate systems are standard reference systems for reporting brain locations in functional neuroimaging studies. Here we describe a semi-automated method to determine the 3D locations of intracranial electrodes (Ritzl et al., 2007
). This method uses two freely available software programs – SPM and MRIcro – to co-register individual CT and MRI images and then transform electrode locations to a standard 3D reference space (Talairach, MNI) for group comparisons.
Data Pre-Processing
The pre-implantation volumetric MRI (1–1.8 mm coronal slices) and post-implantation CT (1 mm axial slices) scans are acquired in digital imaging and communication (DICOM) format. The MRI and corresponding CT data are then converted to Analyze format using MRIcro
2
.
Co-Registration and Normalization
The CT data are automatically co-registered onto MRI data from the same patient using SPM8
3
and a six-parameter rigid body transformation (Ritzl et al., 2007
). The pre-implantation MRI is then normalized onto the standard MNI brain representation included in SPM8, using default normalization parameters. The 3D CT scan is then normalized using parameters derived from normalization of the 3D MRI.
Normalized Electrode Coordinates
The MRI, CT, and 3D co-registered data can be displayed in spatially linked windows in MRIcro (Figure 6
). This facilitates visualization and selection of individual electrodes. MRIcro automatically displays MNI coordinates of selected data points (electrodes). Talairach coordinates can be derived from MNI coordinates using the MATLAB mni2tal function
4
.
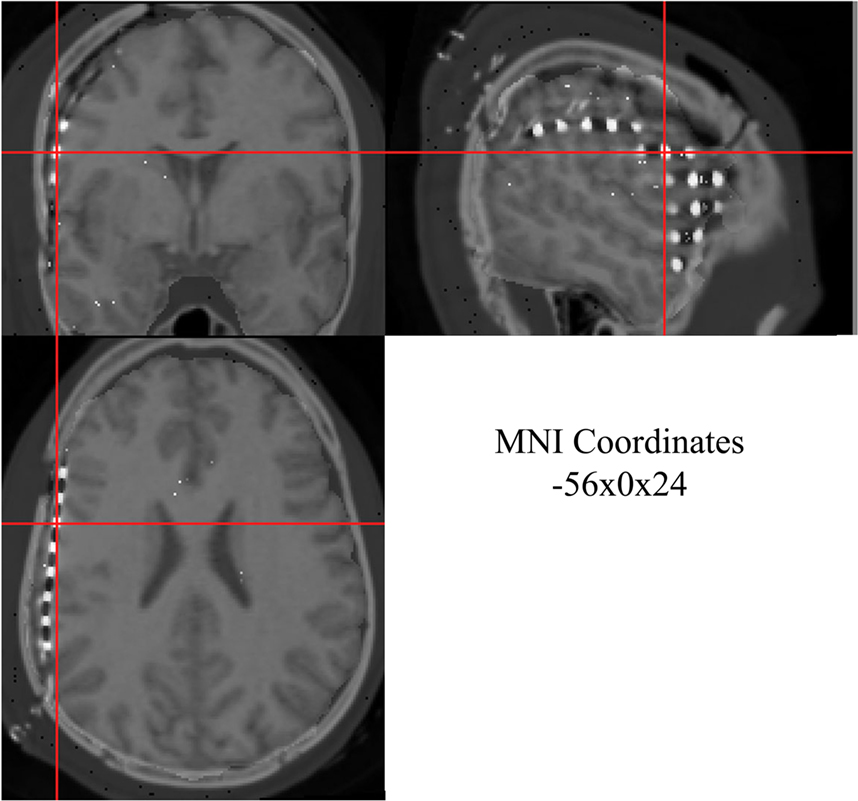
Figure 6. Co-registered 3D MRI and CT images from one patient displayed in MRIcro. Three linked views are shown with same subdural electrode selected at crosshair: coronal (top left), saggital (top right), and axial (bottom left). Normalized MNI coordinates for selected subdural electrode are displayed in bottom right window.
Advantages of this semi-automatic normalization approach include: (1) it uses freely available software programs; (2) it is useful for combining different imaging data sets, including fMRI; (3) co-registration is automatic, thereby avoiding human error; and (4) it can also be used to localize depth electrodes implanted in deeper brain structures including the hippocampus. This method was developed for extraoperative ECoG studies in which electrodes are implanted. Other approaches have been developed for localization of electrode positions during intraoperative recording studies, including co-registration of electrode locations derived from infrared probes with pre-surgical MRI scans (Edwards et al., 2005
).
The normalized electrode data may undergo further statistical modeling. For example, we have used template mixture modeling, a Bayesian hierarchical framework derived from normalized electrode coordinates, to quantify within- and between-patient variability in the distribution of cortical auditory responses (Miglioretti and Boatman, 2003
; Boatman and Miglioretti, 2005
).
Limitations of ECoG Studies
A potential limitation of the intracranial (ECoG) method is that electrodes are usually implanted only over one hemisphere (seizure side), precluding recording from both hemispheres in the same patient. Some patients have strips implanted on the contralateral side for improved lateralization, but this is less common. Likewise, implanted electrodes rarely cover an entire hemisphere, further restricting spatial sampling within patients. There is also considerable individual variability in electrode placement across patients, and the spatial resolution of electrode arrays is high enough that important anatomical distinctions can exist between similarly placed arrays. This may pose additional challenges for statistical group comparisons. Another potential limitation is that patients who undergo invasive recordings usually have longstanding neurological disorders that may result in atypical functional organization. To increase the generalizability of results, we routinely screen patients beforehand to detect functional abnormalities, including hearing loss and auditory dysfunction (Boatman and Miglioretti, 2005
; Sinai et al., 2009
). Another potential concern is that the reliability of ECoG recordings has yet to be determined. This is particularly problematic since recordings are often done over multiple sessions (days), and changes in clinical status due to seizures or medications are likely to occur. Studies are underway at our center to examine test-retest reliability of different event-related response measures. Finally, recent studies have suggested that EEG recordings of gamma activity may be contaminated by ocular and muscle artifact. Specifically, it has been shown that high frequency responses in scalp EEG are influenced by micro-saccades (Yuval-Greenberg et al., 2008
) and that recordings from the temporal pole region may influenced by myogenic artifact due to the proximity of extraocular muscles (Jerbi et al., 2009
). These potential limitations need to be taken into consideration in the interpretation of ECoG findings.
Multiple Comparisons
The multiple comparisons problem arises in ECoG studies because the event-related response of interest is measured at a large number of electrodes and time points requiring multiple statistical comparisons. Large numbers of statistical comparisons come with the potential to falsely reject the null hypothesis due to chance associations. The family-wise error rate is the probability of falsely concluding there is an effect (e.g., difference). The multiple comparisons problem can be resolved by controlling the family-wise error rate at a specified alpha level (e.g., 0.05). However, it is not possible to control the family-wise error rate by means of standard statistical methods that operate at the level of single samples (e.g., t-test).
Two correction methods are widely used in ECoG studies: the Bonferroni correction and the FDR (Benjamini and Hochberg, 1995
). The Bonferroni correction restricts the so-called family-wise error rate (i.e., the probability of at least one false rejection under the null hypothesis) by dividing the type I error rate by the total number of comparisons performed. This procedure is very conservative because it ignores correlations in the hypothesis test outcomes and bounds the family-wise error rate, a criterion that is generally too strict to be practical for modern high-throughput studies such as ECoG. To address this issue, several modifications to the Bonferroni method have been developed, including the Holm-Bonferonni method that controls family-wise error rate at the α level, thereby allowing more opportunity for rejection of the null hypothesis (Holm, 1979
). Alternatively, FDR is the expected proportion of falsely rejected null hypotheses for a specified threshold. The original work by Benjamini and Hochberg (1995) and recent work (Storey, 2002
) has shown how to develop thresholding rules that bound FDR, not unlike the rules by which the Bonferroni correction bounds the family-wise error rate. While the FDR procedure tends to be less conservative than the Bonferroni, both methods have been used to determine the statistical significance of event-related responses in multichannel ECoG data (Durka et al., 2004
; Edwards et al., 2005
; Sinai et al., 2009
). Because these two correction methods have different purposes, they are therefore not mutually exclusive.
In our time–frequency studies, the Bonferroni and FDR have yielded similar results. One potentially useful strategy is to combine both methods in a two-stage process: first implement the FDR method to identify data trends and then apply the Bonferroni method to verify the results. A promising new approach for handling multiple comparisons in ECoG data involves applying non-parametric permutation testing to estimate statistical significance (Maris and Oostenveld, 2007
; Jacobs and Kahana, 2009
) – a procedure that is gaining wide acceptance in neuroimaging studies (Nichols and Holmes, 2002
). When applying these non-parametric tests, it is important to use a sufficiently large number of permutations to achieve convergence to asymptotic values. As long as test results continue to change when the number of permutations is increased, they are considered not yet reliable.
We propose a comprehensive analytic framework that combines multiple, complementary methods for evaluating the statistical significance of event-related responses in ECoG data sets. We demonstrated the utility of this approach for intracranial auditory mapping studies. The individual methods described have been used in ECoG studies of sensory, motor, language, and cognitive functions (Ray et al., 2003
; Sinai et al., 2005
; Canolty et al., 2007
; Miller et al., 2007
; Oya et al., 2007
; Jacobs and Kahana, 2009
) as well as studies of cortical abnormalities, including seizures (Franaszczuk et al., 1994
, 1998
). The combination of multiple complementary single-channel and multichannel methods in a comprehensive unified framework is novel and potentially more powerful than the traditional single-method approach. This methodological framework may also be useful for analyzing intracortical recordings of local field potentials in animal studies. Future directions include development of new statistical approaches for quantifying differences in the temporal-spectral shape of event-related responses across subjects and experimental conditions (stimulus, task) and for integration of multimodal brain mapping data, including fMRI and whole-head magnetoencephalography (MEG).
The authors declare that the research was conducted in the absence of any commercial or financial relationships that could be construed as a potential conflict of interest.
The analytic framework and ECoG data described in this paper were developed with support from NIH grants RO1-DC05645 (Dana Boatman-Reich), K24-DC010028 (Dana Boatman-Reich), RO1-NS040596 (Nathan E. Crone), and RO1-NSO60910 (Brian Caffo). Special thanks to Paras Bhatt for assistance with the figures.
Astolfi, L., Cincotti, F., Mattia, D., Babiloni, C., Carducci, F., Basilisco, A., Rossini, P. M., Salinari, S., Ding, L., Ni, Y., and others. (2005). Assessing cortical functional connectivity by linear inverse estimation and directed transfer function: simulations and application to real data. Clin. Neurophysiol. 116, 920–932.
Astolfi, L., Cincotti, F., Mattia, D., De Vico Fallani, F., Colosimo, A., Salinari, S., Marciani, M.G., Ursino, M., Zavaglia, M., Hesse, W., Witte, H., and Babiloni, F. (2007a). Time-varying cortical connectivity by adaptive multivariate estimators applied to a combined foot-lips movement. Conf. Proc. IEEE Eng. Med. Biol. Soc. 2007, 4402–4405.
Astolfi, L., Cincotti, F., Mattia, D., Marciani, M. G., Baccala, L. A., De Vico, F. F., Salinari, S., Ursino, M., Zavaglia, M., Ding, L., Edgar, J. C., Miller, G. A., He, B., and Babiloni, F. (2007b). Comparison of different cortical connectivity estimators for high-resolution EEG recordings. Hum. Brain Mapp. 28, 143–157.
Astolfi, L., Cincotti, F., Mattia, D., Mattiocco, M., De Vico Fallani, F., Colosimo, A., Marciani, M. G., Hesse, W., Zemanova, L., Lopez, G. Z., Kurths, J., Zhou, C., and Babiloni, F. (2006). Estimation of the time-varying cortical connectivity patterns by the adaptive multivariate estimators in high resolution EEG studies. Conf. Proc. IEEE Eng. Med. Biol. Soc. 1, 2446–2449.
Astolfi, L., Cincotti, F., Mattia, D., Salinari, S., Babiloni, C., Basilisco, A., Rossini, P. M., Ding, L., Ni, Y., He, B., Marciani, M. G., and Babiloni, F. (2004). Estimation of the effective and functional human cortical connectivity with structural equation modeling and directed transfer function applied to high-resolution EEG. Magn. Reson. Imaging 22, 1457–1470.
Babiloni, F., Ferri, R., Binetti, G., Vecchio, F., Brisoni, G. B., Lanuzza, B., Miniussi, C., Nobili, F., Rodriguez, G., Rundo, F., Cassarino, A., Infarinato, F., Cassetta, E., Salinari, S., Eusebi, F., and Rossini, P. M. (2009). Directionality of EEG synchronization in Alzheimer’s disease subjects. Neurobiol. Aging 30, 93–102.
Jerbi, K., Ossandon, T., Hamame, C. M., Senova, S., Dalal, S. S., Jung, J., Minotti, L., Bertrand, O., Berthoz, A., Kahane, P., and Lachaux, J. P. (2009). Task-related gamma-band dynamics from an intracerebral perspective: review and implications for surface EEG and MEG. Hum. Brain Mapp. 30, 1758–1771.
Oya, H., Poon, P. W., Brugge, J. F., Reale, R. A., Kawasaki, H., Volkov, I. O., and Howard, M. A. III. (2007). Functional connections between auditory cortical fields in humans revealed by Granger causality analysis of intracranial evoked potentials to sounds: comparison of two methods. Biosystems 89, 198–207.