Neuronal processing of complex mixtures establishes a unique odor representation in the moth antennal lobe
- Department of Evolutionary Neuroethology, Max-Planck-Institute for Chemical Ecology, Jena, Germany
Animals typically perceive natural odor cues in their olfactory environment as a complex mixture of chemically diverse components. In insects, the initial representation of an odor mixture occurs in the first olfactory center of the brain, the antennal lobe (AL). The contribution of single neurons to the processing of complex mixtures in insects, and in particular moths, is still largely unknown. Using a novel multicomponent stimulus system to equilibrate component and mixture concentrations according to vapor pressure, we performed intracellular recordings of projection and interneurons in an attempt to quantitatively characterize mixture representation and integration properties of single AL neurons in the moth. We found that the fine spatiotemporal representation of 2–7 component mixtures among single neurons in the AL revealed a highly combinatorial, non-linear process for coding host mixtures presumably shaped by the AL network: 82% of mixture responding projection neurons and local interneurons showed non-linear spike frequencies in response to a defined host odor mixture, exhibiting an array of interactions including suppression, hypoadditivity, and synergism. Our results indicate that odor mixtures are represented by each cell as a unique combinatorial representation, and there is no general rule by which the network computes the mixture in comparison to single components. On the single neuron level, we show that those differences manifest in a variety of parameters, including the spatial location, frequency, latency, and temporal pattern of the response kinetics.
Introduction
Behaviorally relevant host odors are composed of complex mixtures of compounds that create a spatially and temporally dynamic olfactory environment through which insects navigate. An insect’s ability to perform odor-mediated behavior (e.g., nectar feeding, host location or mate finding) requires the olfactory system to process and reliably identify complex volatile signals in a constantly changing background. Nevertheless, the mechanism by which single neurons generate a unique mixture percept in the olfactory system remains largely unclear.
The antennal lobe (AL) of the insect brain is a conglomeration of anatomically discrete subunits of neuropil known as glomeruli, which confine synapses among four types of neurons (Stocker, 1994; Mori and Yoshihara, 1995; Shipley and Ennis, 1996; Hansson and Anton, 2000). Olfactory sensory neurons (OSNs) expressing the same receptor proteins at the periphery send their axons to a single glomerulus where they synapse with AL-intrinsic local interneurons (LNs) connecting glomeruli (Christensen et al., 1993), projection neurons (PNs) that transmit information to higher brain areas (Shepherd, 1972; Tolbert et al., 1983; Boeckh and Tolbert, 1993) and modulatory centrifugal input (Hu et al., 2010; Kent et al., 1987). Therefore, AL output is shaped by both excitatory and inhibitory activity requiring interglomerular connectivity (Vosshall and Stocker, 2007). The AL thus serves as the primary processing center for generating mixture information from the combined activity of OSNs.
Single neurons may process odor mixtures either as the linear sum of the constituent chemicals (elemental processing) and/or non-linear computation creating a unique mixture representation (configural processing; Rescorla, 1972). In vertebrates, non-linear mixture interactions have been observed both at the periphery (Duchamp-Viret et al., 2003) and in the central nervous system (Tabor et al., 2004; Lei et al., 2006; Lin et al., 2006; Davison and Katz, 2007; Johnson et al., 2010). In contrast, mixture interactions among insects have been witnessed mainly in the CNS (for review see Lei and Vickers, 2008, but see Akers and Getz, 1993; Ochieng et al., 2002; Hillier and Vickers, 2011). Optophysiological studies observing the response of (predominantly) OSNs in the insect AL showed that responses to odor mixtures could generally be predicted from the single component responses (Silbering and Galizia, 2007). Yet strong mixture interactions at the PN level were prominent (Silbering and Galizia, 2007), suggesting significant levels of non-linear information processing among single neurons within the AL.
In moths, one of the key insect models of olfaction, odor processing has been extensively studied among single pheromone-receptive neurons (Christensen and Hildebrand, 1987; Christensen et al., 1995; Anton et al., 1997; Barrozo et al., 2010; Lei and Vickers, 2008). In contrast, the nature of complex host mixture processing by single AL neurons remains unclear, although recent studies using optophysiological and multi-unit recording suggest that both linear and non-linear processing may occur (Carlsson et al., 2007; Riffell et al., 2009a,b). In the present study, we performed intracellular recordings of single LNs and PNs in female Manduca sexta while -presenting the antenna with controlled host volatile mixtures. Single neurons were stimulated with up to seven different host compounds and their mixtures using a novel multicomponent stimulus system that equilibrated component concentrations according to their vapor pressures. We asked two major questions:
(1) What is the degree and spread of non-linear interactions among single neurons in the AL? (2) How do cellular aspects of AL neuron responses contribute to mixture processing? Although the analysis of mixture processing is not novel, many mixture coding studies have historically utilized binary mixtures (De Jong and Visser, 1988; Galizia and Menzel, 2001; Deisig et al., 2003; Ditzen et al., 2003; Broome et al., 2006; Carlsson et al., 2007; Rospars et al., 2008; Fernandez et al., 2009; Niessing and Friedrich, 2010), or complex natural blends (Riffell et al., 2009a; Tasin et al., 2006; Pinero et al., 2008). Binary mixtures provide little insight into complex mixture coding, while natural extracts contain several compounds of varying concentration that are difficult to parse. It is for this reason that we chose to assess multicomponent mixtures with defined concentrations in order to quantitatively characterize the changes in response kinetics between mixtures and their single components. To our knowledge, this is the first study to attempt a rigorous characterization of complex mixture response kinetics at the single neuron level.
Materials and Methods
Animals
Manduca sexta (Lepidoptera, Sphingidae) larvae were reared on an artificial diet (Bell and Joachim, 1976). Sexes were separated as pupae and animals used for physiological experiments were isolated individually before eclosion in paper bags in an environmental chamber at 25°C with 50% relative humidity on a 16-/8-h photoperiod. All experiments were performed with naïve adult females 3–5 days post-eclosion.
Odor Stimulation
All stimuli were presented at physiologically relevant concentrations (see below), and a novel multicomponent stimulus device was used to present the same relative concentration of each component and mixture according to compound vapor pressures. The stimulation device is detailed in (Olsson et al., 2011). Briefly, compressed air was regulated through a series of eight flowmeters used to adjust for component vapor pressures (one for each odor component and the blank, see below). Each line then passed through a three-way valve attached to two chambers with check valves in each direction. Under normal flow conditions, airflow passed through the headspace of a distilled water chamber to establish a constant, humidified airsteam. Upon stimulation, the valves switched the regulated airstream through the headspace of the odor chambers to release the stimulus. The airstream from each chamber was then combined among all eight lines into a single, unified laminar flow that proceeded to the antenna as a blend or single component.
The following odors were used: (+)-linalool, (−)-linalool, phenyl acetaldehyde (PAA), benzaldehyde, hexanol, nonanal, or trans-2-hexenyl acetate (E2HA) and cis-3-hexenyl acetate (Z3HA; Table A1 in Appendix). As nonanal did not provide appreciable responses for most neurons, it was substituted with the Z3HA isomer, E2HA. All odors were acquired from Sigma at highest purity available. Odors were selected because of their ecological and physiological relevance as shown in previous studies of M. sexta (King et al., 2000; Shields and Hildebrand, 2001; Fraser et al., 2003; Hansson et al., 2003; Reisenman et al., 2004; Hoballah and Turlings, 2005). New odor dilutions were prepared approximately once per month and unused vials were kept at 4°C. Odor mixtures were obtained by switching up to seven valves simultaneously. A set of 50 bottles (seven concentration stages per odor + control) were available in order to alter concentrations. To achieve the same relative odor concentrations during presentation, the vapor pressure of each component was considered and single component airflows were altered accordingly (Olsson et al., 2011). For intracellular analyses, odors were always presented in a similar repetitive sequence across animals (500 ms odor pulse). Recorded cells were first presented with all seven components simultaneously (“all”), followed by a fully randomized stimulation sequence, testing each of the seven single components separately (“single”) with the control stimulus (mineral oil) in between. Stimulation breaks and random testing was crucial to rule out adaptation and cross adaptation effects (Stopfer and Laurent, 1999). Components that induced a response were subsequently presented together as a blend (“mixture”). Hence, each cell was tested with a blend composed of variable components [ranging from 2 (binary mixture) up to 7 components]. Finally, cells were randomly tested with the single components at appropriate “mixture” concentrations (e.g., for a tertiary mixture, single components were again tested using threefold concentration, 3 × 10⁻⁴; “single+”). This was necessary to compensate for concentration differences between the mixture and its single components (Silbering and Galizia, 2007; Olsson et al., 2011). In this fashion, we were able to assess the response of various mixture interactions, including synergism. Due to time constraints related to the complex odor set used, execution of multiple trials per component was unfeasible. However, to justify this approach we pretested a subset of cells and showed stable and reliable response patterns for repeated stimulation (compare Olsson et al., 2011). We are thus confident that analyzed responses in this study were robust and consistent regardless of number of repetitions. Only stable recordings (>40 min) of cells that successfully passed the entire stimulation protocol process were analyzed.
Intracellular Recordings
For electrophysiological recordings, moths were firmly restrained in plastic tubes (modified Falcon tubes 15 ml) with the head exposed and immobilized with dental wax (Surgident, Heraeus Kulzer, Dormagen, Germany). The head capsule was opened with a razor blade and labial palps and cibarial musculature removed to allow access to the brain. Obstructing trachea and parts of the neurolemma covering the ALs were removed with fine forceps to facilitate insertion of the recording electrode. The brain was superfused constantly with physiological saline solution containing (in mM): 150 NaCl, 3 CaCl2, 3 KCl, 10 TES buffer, and 25 sucrose, pH 6.9 (Heinbockel et al., 2004).
Sharp glass-capillary electrodes were produced from borosilicate tubing (1.0 mm OD, 0.5 mm ID, World Precision Instruments, Sarasota, FL, USA) using a CO2 Laser based micropipette Puller (P-2000, Sutter Instrument, Novato, CA, USA). Tips of the micropipettes were loaded with a 3% solution of Lucifer yellow (Sigma-Aldrich) in 0.2 M LiCl, or 2% neurobiotin (Molecular Probes, Carlsbad, CA, USA) in 0.2 M KCl. Shafts were filled with 2 M LiCl (Lucifer) or 2 M KCl (neurobiotin). Electrode resistances, measured in the tissue, ranged from 110 to 320 MΩ. The recording electrode was inserted randomly into the AL using a motorized micromanipulator (Luigs and Neumann, Ratingen, Germany). Typically, one neuron was recorded per animal. When intracellular contact was established, the ipsilateral antenna was stimulated and the activity of the neuron was recorded. The analog signal of the impaled neuron was amplified, filtered (Bramp 0.1, bridge amplifier npi Electronic GmbH Tamm, Germany), synchronized with the external stimulation device via an interface (INT-20MX Breakout Box Module, npi Electronic) and monitored on an oscilloscope (TDS 2000B, Tektronics Inc., Beaverton, OR, USA). The resultant signal was then digitized via a PCI card (6250E, National Instruments, Austin, TX, USA). Action potentials were recorded with a custom-made Labview 8.5 program (National Instruments) and stored on the PC. Spike analyses were performed using IgorPro software (Wavemetrics, Portland, OR, USA). After physiological characterization, neurons were injected iontophoretically with either Lucifer yellow by passing hyperpolarizing current (0.5–4 nA) for 3–40 min or neurobiotin (depolarizing current). Potentially stained brains were further processed as noted below.
Neuroanatomical Techniques and Confocal Microscopy
Brains were dissected from the head capsule and immediately transferred to ice-cold 4% formaldehyde in phosphate-buffered saline (PBS; pH 7.2) for at least 2 h on a shaker. To visualize -neurobiotin-injected neurons, brains were additionally incubated with Alexa-conjugated streptavidin (Molecular Probes; Invitrogen, Eugene, OR, USA) for 3 days at 4°. All brains were then dehydrated in an ascending series of ethanol (50, 70, 80, 90, 95, and 3 × 100%, 10 min each), cleared in methyl salicylate (M-2047; Sigma-Aldrich, Steinheim, Germany) overnight, and finally positioned in custom aluminum slides, each sealed with a coverslip. Neurons were examined by laser-scanning confocal microscopy using a Zeiss LSM 510 (Zeiss, Jena, Germany) equipped with a HeNe/Ar lasermodul and a 10-, 0.45-NA objective lens (C-Apochromat, Zeiss). Optical sections (1024 × 1024 pixel) were taken at intervals of 0.8 μm for detailed scans of the AL. In addition, serial 2 μm optical sections through the entire brain were performed for stained PNs in order to visualize the fine aborizations in higher brain areas, such as mushroom bodies.
3-D Reconstruction and Image Processing
Three dimensional reconstructions were carried out in AMIRA 4.1.2 (mercury Computer Systems, Berlin, Germany). Individual glomeruli were reconstructed by segmentation of each spherical structure around its center in three focal planes (xy, xz, yz). Subsequent use of the wrapping tool in Amira 4.1.2 allowed us to interpolate 3D shapes from just a few segmented slices. Single neurons were reconstructed using the skeleton-tool. Composite visualization of the neural architecture of different preparations was achieved by using landmark and label field registration techniques (compare Rybak et al., 2010). All figures presented here were edited by using Adobe Photoshop CS4 (Adobe Systems, Inc.) and compiled with Adobe Illustrator CS4 without further modification of brightness or contrast.
Spike Analysis
Analog intracellular data (mV) was sampled (50 kHz) and recorded (3 kHz) using customized Labview software (National Instruments, Austin, TX, USA). Action potentials were extracted as digital spikes using Igor Pro software (Wavemetrics, Portland, OR, USA). The number of spikes was counted 1.5 s before (prestimulus) and 1.5 s after stimulus onset (poststimulus) to determine response frequency (Figure 1D). To compensate for mechanical stimulus delay, spikes were counted 100 ms after stimulus onset (Figures 1D2,E2, blue dotted line) as dictated by PID (photoionization detector) measurement of stimulus presentation (Data not shown). For analysis, response frequencies for each trial were normalized to spontaneous activity as a ratio (Hz 1.5 s after stimulus onset/Hz 1.5 s before onset; Figures 1D2,E2).
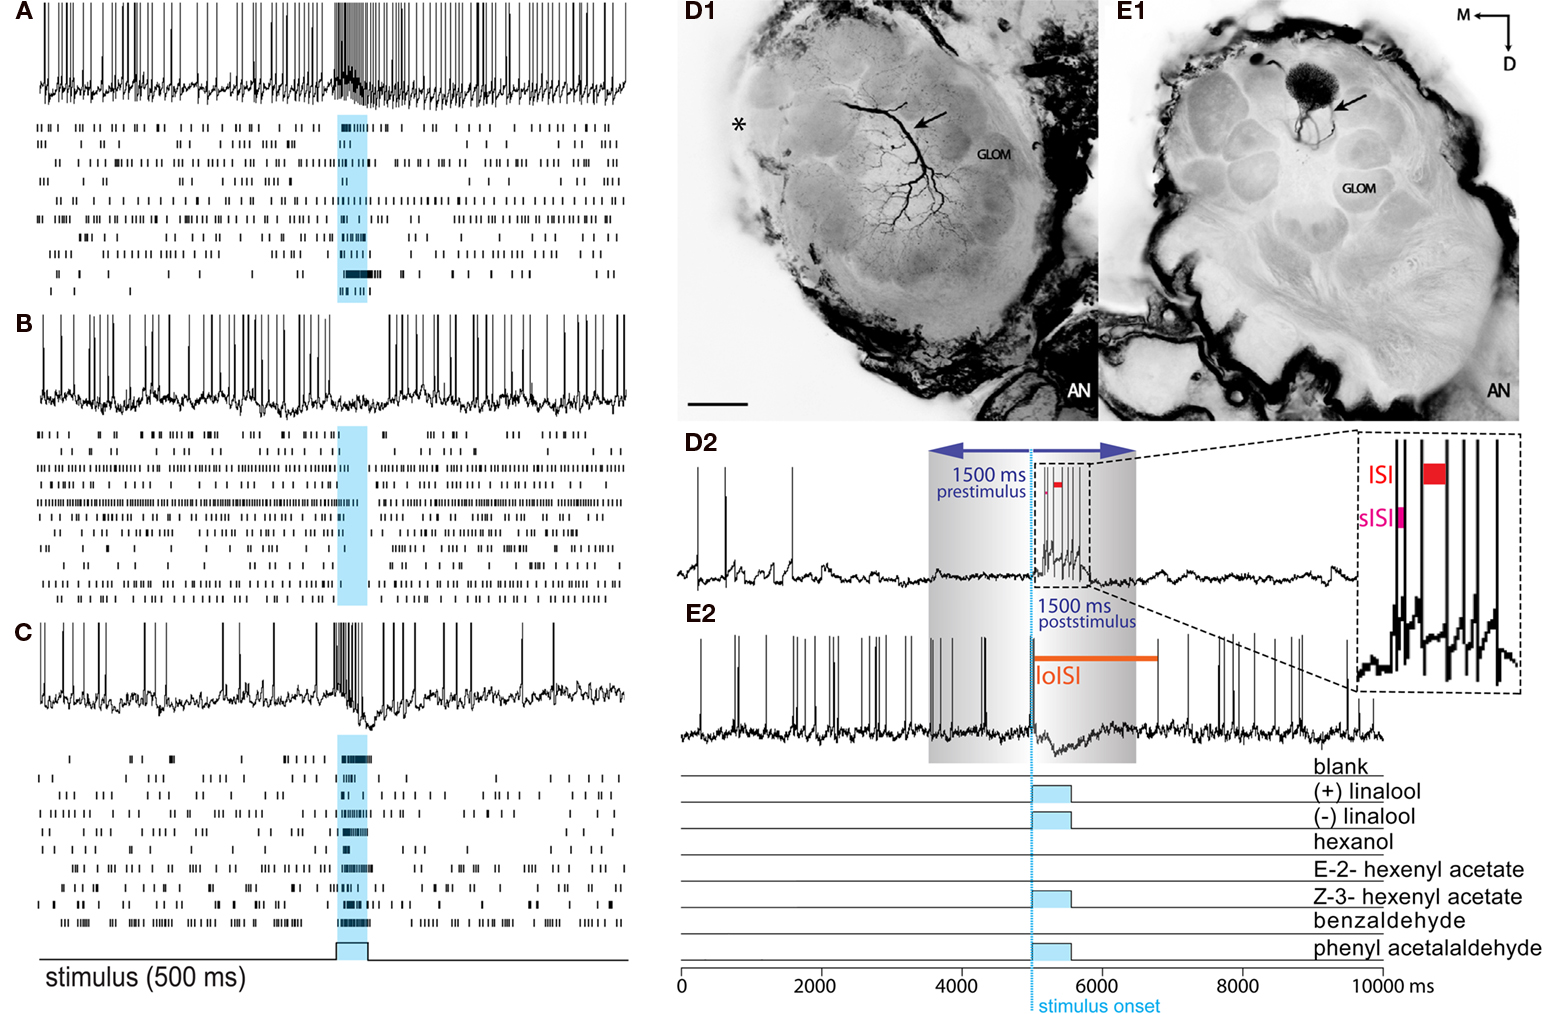
Figure 1. Response profiles of single AL neurons to an complex odor mixture. Left panel: (A–C) The three basic Manduca response types (A) Excitatory. (B) Inhibitory. (C) Biphasic. Each block shows one example of an intracellular recording trace and complete raster plots of action potentials for all analyzed cells of the dataset in response to plant odor mixtures. Blue squares and vertical bars indicate the 500 ms odor stimulus period. Right panel: Example of two common morphological types of AL neurons in the female Manduca sexta brain responding to an identical mixture of four components. Both neurons innervate the right antennal lobe. (D1) Typical local interneuron (LN) with a broad symmetrical aborization profile, branching in the vast majority of glomeruli with soma situated in the lateral cell cluster (not visual in the confocal plane but indicated by asterisk); LN neurites are restricted to the antennal lobe; excitatory response profile (D2). (E1) Uniglomerular projection neuron exhibiting dense dendritic arborization occupying one single ordinary glomerulus; soma antero-ventral, axon innervating the mushroom bodies via the inner antennocerebral tract (IACT, compare Figure 2E,F); inhibitory response profile (E2). Pictures were obtained by confocal microscopy of two separate whole mount brain preparations; anterior inverted projection view of picture stack [(D) = average of 50 pictures; (E) = 11]; M, medial; D, dorsal; AN, antennal nerve; GLOM, glomerulus; Scale bar, 100μm. (D2,E2) To determine response frequencies the number of spikes was counted 1.5 s before (prestimulus period) and 1.5 s after stimulus onset (poststimulus period; stimulus onset: blue, vertical dotted line). To determine latency, interspike intervals (ISIs) were calculated between successive spikes (ISI: red bar; shortest ISI “sISI”: magenta bar; longest ISI “loISI”: orange bar).
Interspike intervals (ISIs) were calculated between successive spikes (Figure 1D2, red bar). For cells exhibiting an inhibitory response (a drop in spike frequency), response latency was determined as the time between stimulus onset (including the 100 ms mechanical delay) to the beginning of the longest ISI (i.e., the beginning of the inhibitory response; Figure 1E2, orange bar indicates loISI). For cells exhibiting an excitatory or biphasic response (an increase in spike frequency), latency was calculated as the time between stimulus onset (including the 100 ms mechanical delay) to the beginning of the shortest ISI (i.e., the point of highest frequency response; Figure 1D2, sISI, magenta bar). To assess temporal patterns, raw spike frequencies were calculated in 50 ms bins and compared from 100 to 1500 ms following stimulus onset.
Mixture Interactions
Definition of mixture interactions was based on Duchamp-Viret et al. (2003) and Silbering and Galizia (2007) as illustrated in Figure A1 in the Appendix. Consider a neuronal response to two compounds, a and b: if there are no interactions between the components, the mixture of a and b will be perceived as the sum of the response to a and b alone. This is known as linear summation (A). Alternatively, if there is synergism between the two compounds (B), the mixture of a and b will produce a response greater than the maximum response of the single components at the same total concentration as the mixture (in this case, a + a). Suppression (C) causes a mixture response that is less than at least one of the single components. Finally, hypoadditivity (D) occurs when at least one of the components of the mixture is ignored and the blend response resembles that of a single component.
In order for a mixture interaction to be considered non-linear, the mixture response of an AL neuron must have exceeded the cell’s response to the single components of that mixture by at least one SD of all single compound responses. For synergism to occur, the mixture response must be at least one SD above the maximum response to the single components when tested at the same concentration as the total mixture (Tabor et al., 2004). In other words, if a mixture contained four components, the mixture response was compared to the single components tested at 4× their base concentration. Suppression constituted a mixture response at least one SD less than the maximum response to the single components. Hypoadditivity was defined as a mixture response between those two extremes, which would make the mixture response similar to at least one of the single components. Anything else was considered a linear response. SD were used to account for the diversity of single compound responses. Although increasing the criteria to 2 SD did not change overall ratios of linear/non-linear responses, it inflated the number of hypoadditive responses. Thus, 1 SD was chosen as a more conservative measure for linearity. This method also ensured that only mixture responses with highly divergent kinetics would be considered non-linear. The equations for determining mixture interactions were thus as follows:
Inhibitory responses
Synergism: Mixture Hz < Minimum single component Hz tested at the same concentration as the mixture – SD of single component Hz.
Suppression: Mixture Hz > Minimum single component Hz + SD of single components
Hypoadditivity: Minimum single component Hz – SD of the single components < Mixture Hz < Minimum single component Hz + SD.
Excititory/biphasic responses
Synergism Mixture Hz > Maximum single component Hz tested at the same concentration as the mixture + SD of single component Hz.
Suppression: Mixture Hz < Maximum single component Hz – SD of single components
Hypoadditivity: Maximum single component Hz – SD of single component Hz < Mixture Hz < Maximum single component Hz + SD.
Non-linear latencies were determined in a similar fashion with mixture responses compared to maximum or minimum latencies of the single component responses. Mixture latencies exhibiting synergism were at least one SD less than the minimum latency to the single components when tested mixture concentrations. Suppressed mixture latencies constituted a mixture response at least one SD greater than the maximum latency to the single components. Thus, latency synergism was defined as a short latency mixture response, and the reverse for suppression.
Statistical Analysis
Fisher’s exact test was used to compare percentages of projection and interneurons exhibiting various response characteristics. Temporal patterns were assessed using areas under the curve measured from each response peri-stimulus time histogram (PSTH; 50 ms bins; 100–1500 ms following stimulus onset). Areas were measured for each response profile using the trapezoid rule for each data bin. These areas were then divided by the time to establish a frequency average for each response. These averages were compared using independent Student’s t-tests separately for each type of response (excitatory, inhibitory, and biphasic). Differences in response latencies have been revealed using Wilcoxon Matched Pairs and t-test. All analyses were performed using PASW (SPSS) v 18 software.
Results
Odor-evoked electrophysiological responses were recorded from a total of 50 single projection neurons (PNs) and local interneurons (LNs), innervating ordinary glomeruli and the female-specific glomeruli (LFGs). Although all tested neurons exhibited mixture responses, 16 were discounted due to incomplete protocols (see Materials and Methods). The remaining 34 neurons were used in subsequent mixture analyses. Among these 34 neurons, 14 were morphologically confirmed as either PNs or LNs through intracellular staining (see Morphology, below). Another 17 could be physiologically confirmed as PNs or LNs based upon specific firing characteristics (see below). Finally, three neurons could not be unambiguously confirmed as either LNs or PNs and were thus not included in morphological analyses. In total, 10 LNs and 21 PNs were morphologically or physiologically identified for further analysis. Response to antennal stimulation exhibited three basic response types, characterized by either an abrupt depolarization with increased spiking (excitatory response), hypopolarization leading to a suppression of spiking (inhibitory response), or a biphasic response with an early excitatory phase followed by a period of hyperpolarization (Figures 1A–C). Another very rare fourth profile was defined as a bimodal response, where a single cell showed divergent response types for different stimuli. Although there was variation in the response pattern across single cells (compare Figure 1) the main characteristics of these basic response types (e.g., no inhibitory phase in excitatory response profiles) were apparent and therefore led to robust categorization of each cell.
Mixture Interactions
In general, the number of neurons responding to an odor mixture remained relatively sparse. Roughly 20 cells were contacted before obtaining a response to any of the seven tested compounds. Interestingly, 100% of all mixture-responsive cells responded to (+)-linalool (both PNs and LNs), 86% responded to the levo-rotoratory enantiomer (−)-linalool and 90% responded to phenyl acetaldehyde (see Table A1 “Table of Compounds” in Appendix). Apart from one exceptional case, no specific “blend” neurons were found: if a neuron responded to a blend it also responded to the single components and vice versa.
Table 1 displays the array of mixture interactions observed among the 34 AL neurons. Stimulus responses fell in each of the four response type categories described above. Mixture interactions were calculated separately for response frequency (Table 1A) and latency (Table 1B). Although some linear responses to the mixture were observed, 82% of the cells showed non-linear spike frequencies in response to the mixture and 73% displayed non-linear response latencies, even though mixture and component concentrations were equilibrated according to their vapor pressures (see Materials and Methods). Among these non-linear interactions, the majority of cells exhibited hypoadditivity (45% for spike frequency and 41% for latency), where the response to the mixture was similar to at least one of the single components within that mixture. Suppression (a diminished response compared to the single components) was also observed in approximately 25–30% of mixture responses, whereas synergism (an enhanced response compared to the single components) was witnessed in only two cells.
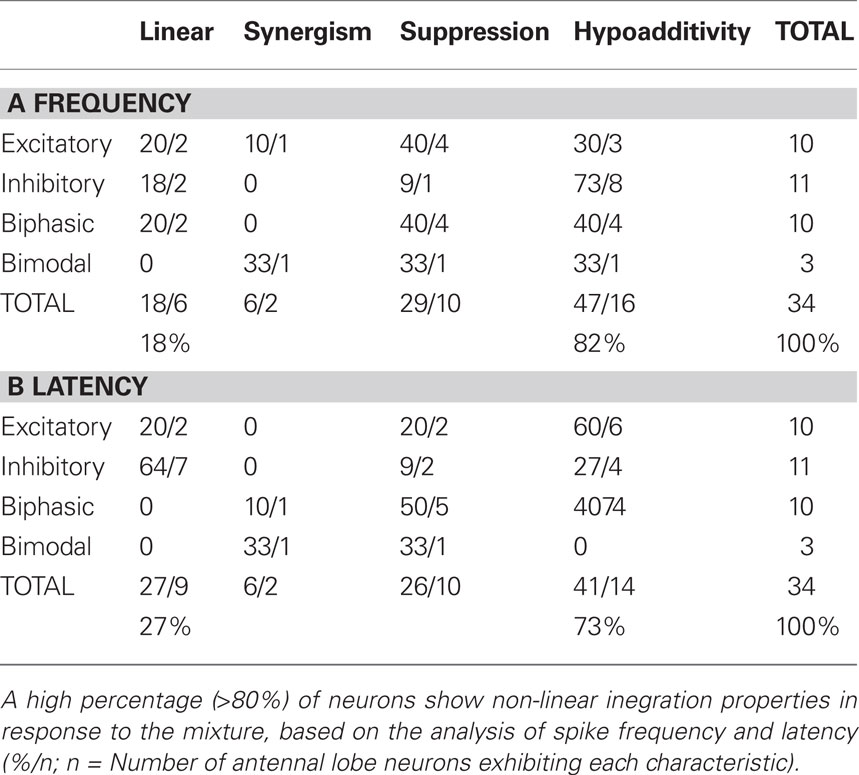
Table 1. Degree and spread of mixture interactions across the four major response types.
While the three major response types were equally distributed across recorded cells (excitatory 29%, inhibitory 32%, biphasic 29%), bimodal responses were only witnessed in three out of 34 cells. Interestingly 50% of hypoadditive frequency interactions were composed of inhibitory cells. Suppression, the second most common mixture interaction, was predominantly displayed by excitatory and biphasic cells (80% of all suppressive cells for frequency, 70% for latency). Synergism, although very rare (n = 2), was exhibited by one excitatory and one bimodal cell.
The number of compounds tested in the mixture (2–7; Table A1 in Appendix) did not alter the percentage of non-linear mixture responses. However, it is possible that “silent” compounds (i.e., compounds that did not elicit a significant response) could have imposed some non-linearities on the total mixture response. We thus compared the response of single components to the initial trial that tested all seven compounds simultaneously (Table A3 in Appendix). Although the overall proportion of non-linear responses to the complete mixture did not change appreciably, the percentage of non-linearities increased by roughly 10% for both frequency and latency. This indicates that a small proportion of “silent” compounds may indeed have an effect on the mixture response.
Morphology
In total, 25 AL neurons were intracellularly stained and 18 identified either as local neurons (LN, n = 8, e.g., Figures 2G–I) or projection neurons (uniglomerular PN, n = 8, e.g., Figures 2C–F multiglomerular PN, n = 2, e.g., Figure 2B). Among these, nine PNs and five LNs were included in the mixture interaction analysis. The seven other stained neurons could not be clearly characterized due to incomplete or multiple staining and were therefore excluded from the study. Most LNs (n = 7) were “symmetrical,” exhibiting a broad, symmetrical arborization pattern throughout the AL, as originally described (Matsumoto and Hildebrand, 1981). PNs arborizing in both uni- and multiglomerular patterns traveled to higher processing centers via all three antennocerebral tracts (Homberg et al., 1988, for example see also Figures 2D,E).
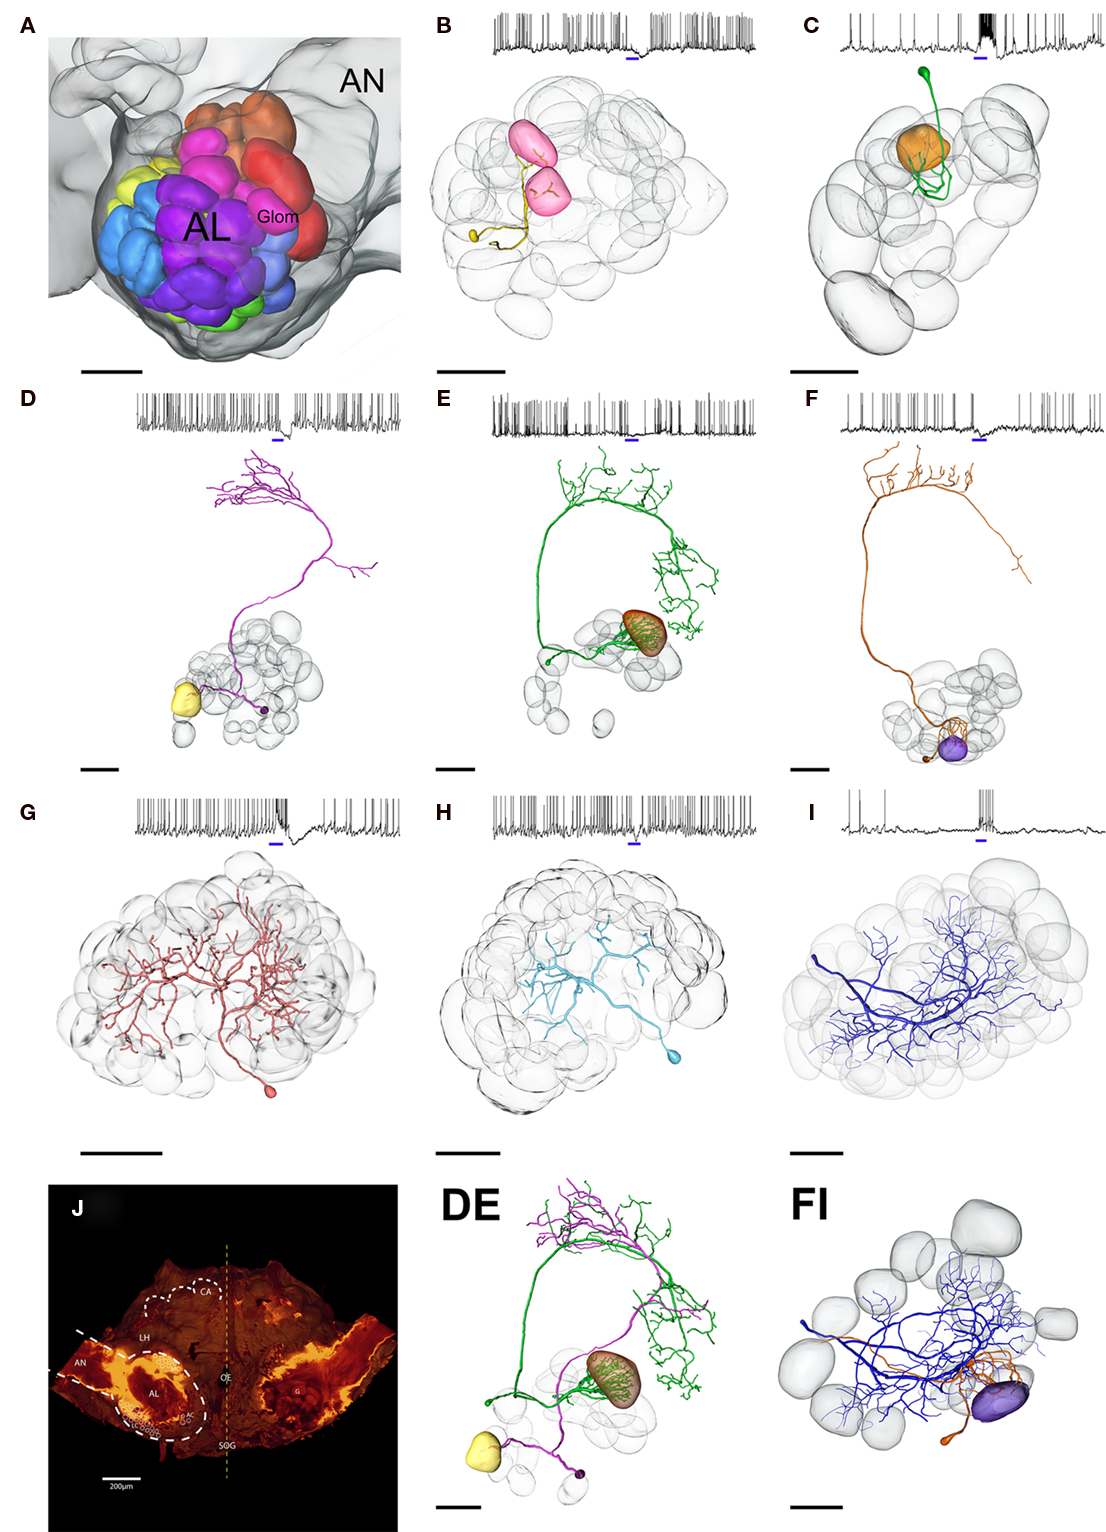
Figure 2. Three dimensional morphological reconstruction of blend responsive neurons in the Manduca brain. (A) Color coded map of antennal lobe (AL) glomeruli, female specific glomeruli depicted in red. (B–I) Subset of stained AL neurons (PNs and LNs) responding to the same blend of four componets: (+)-linalool, (−)-linalool, phenyl acetaldehyde, and cis-3-hexenyl acetate. Multi- (B) and uniglomerular (C–F) PNs show remarkably different innervation patterns as well as varying response profiles; blue bars indicate blend stimulus, 500 ms. (DE) Composite picture of two PNs running directly opposed tracts. (FI) Transformation of one LN and one uniglomerular PN responding to the same quadruple mixture; note that the purple glomerulus innervated by the Pn (F) is not innervated by the LN (I), although responding to the same stimulus. Transparent, gray glomeruli serve as landmarks for PNs in (B–F), and depict all innervated glomeruli in LNs (G–I). (J) Overview of the Manduca brain. AL, antennal lobe; AN, antennal nerve; CA, mushroom body calyces; AC, MC, LC, cell clusters; Oe, esophagus; LH, lateral horn; black scale bars, 100 μm.
Figure 2 depicts a subset of stained neurons (PN n = 5, LN p = 3) responding specifically to the same mixture of four components [(+)-linalool, (−)-linalool, phenyl acetaldehyde, and cis-3-hexenyl acetate]. By careful comparison with landmark neighbors, the spatial position of innervated glomeruli within the AL was designated and assigned to the glomeruli indicated on the AL map (Figure 2A). Although responding to the same mixture, reconstructed PNs revealed remarkably different innervation patterns. None of the five PNs targeted the same glomerulus. Transformation of one LN and one PN together on the map (Figure 2FJ) also showed that although responding to the same components, LN arborizations did not innervate the glomerulus strongly arborized by the dendrites of the uniglomerular PN.
Projection neurons could be physiologically distinguished from LNs on the basis of the average spike duration (spike width) measured during spontaneous activity at the base of spikes above threshold membrane oscillations (compare Figure 3B, dashed red line). Mean spike width for morphologically identified LNs [LN(morph), blue, 9.7 ± 3.9 ms, n = 6] was significantly different from that measured in PNs [PN(morph), green, 4.9 ± 1.7 ms, n = 9; t-test p = 0.028, Figure 3]. Spontaneous spike width did not differ notably during the recording [±0.27 ms in PNs(morph), ±0.54 ms in LNs(morph); measured for five consecutive spikes] and therefore was selected as a consistent character across cells. Several other inspected properties, including inhibitory post-synaptic potential (IPSP) and spontaneous activity (Mann–Whitney U-test p = 0.96) did not differ between these two morphological types. Also the spontaneous firing rate was very similar between stained PNs and LNs with a mean of 7.3 spikes/s for LNs and 8.3 spikes/s for PNs (same median ISI = 31 ms for LNs and PNs).
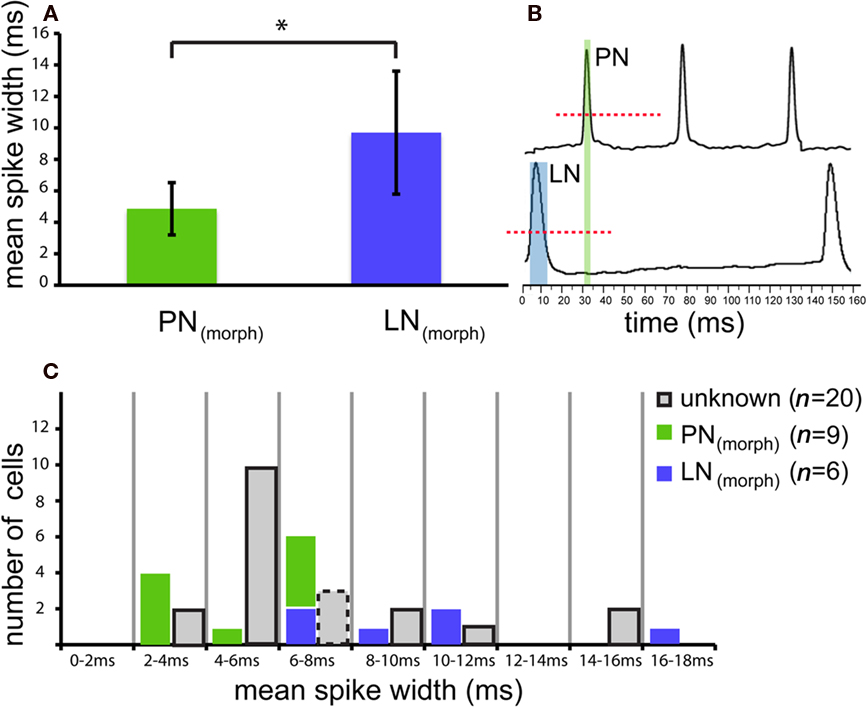
Figure 3. Projection neurons and LNs reveal different action potential characteristics. (A) Comparison of spike kinetics for morphologically confirmed local neurons [LN(morph), green] were significantly different from those measured in projection neurons [PN(morph), blue; t-test p = 0.028]. Average spike duration (mean spike width) measured during spontaneous activity of nine randomly selected PNs was roughly half the value (4.9 ± 1.7 ms; mean ± SD) found in LNs (9.7 ± 3.9 SD, n = 6). (B) Spontaneous action potential width was measured at the base of spikes above threshold membrane oscillations (dashed red line). (C) Based on this robust character, 17 other unknown neurons (gray) could be categorized as physiologically designated neurons [PN(phys) n = 12, LN(phys) n = 5]. Three unknown neurons possessed intermediate spontaneous spike widths (between 6 and 8 ms, gray, dashed outline) and therefore could not be determined.
Based on the robust spike width character, 12 other unidentified neurons could be categorized as PN(phys) (physiologically designated PNs) according to their spontaneous action potential width, and five categorized as physiologically designated LNs [LN(phys)]. Three unknown neurons possessed intermediate spontaneous spike widths and therefore could not be typed (see dashed outline, Figure 3C). The categorization of cells on the basis of spike width is not exhaustive and was not intended to replace the accurate but tedious staining method of morphological identification. This method rather offers an alternative approach to compare the two cell populations based on a solely physiological characteristic. Using this physiological method, Figure A2 in the Appendix shows the relative proportions of PNs and LNs across the four response types and four mixture interaction categories (n = 31, including stained neurons). Fisher’s exact test found no difference in response type or mixture interaction for either response frequency or latency between PNs and LNs (both morphologically and physiologically confirmed cells, p > 0.05 for all comparisons).
Latency
Figure 4 depicts mean latencies of response onset to the mixture and its single components tested at the higher mixture concentration (single+) within each type of neuron. Mean paired latencies were calculated for both morphologically and physiologically confirmed cells (Figure 4A, PNs n = 21; Figure 4A1, LNs n = 10). Absolute latencies to the mixture were highly variable and ranged between 65–766 ms for PNs and 86–358 ms for LNs. Single component latencies varied from 257 to 749 ms in PNs and from 129 to 788 ms in LNs. Mean response latencies of PNs to single components were not different from those of LNs [Figure 4B; t-test, p = 0.85 for single + in PNs (396 ± 114 ms) and LNs (408 ± 205 ms) and p = 0.28 for single]. However, responses to the mixture were significantly shorter in LNs [t-test, p = 0.0046 for LNs (168 ± 86 ms) vs. PNs (322 ± 192 ms)]. Latencies of LNs to the mixture were also significantly shorter than to single components (single+) within individual neurons (mixture vs. single+, Wilcoxon Matched Pairs LNs p = 0.0020), but not PNs (p = 0.133). Moreover, average response latencies to the mixture were shorter for LNs only (mixture vs. single t-test, LNs p = 0.003, PNs p = 0.28; mixture vs. single+ LNs, p = 0.005, PNs p = 0.85). Thus local neurons responded significantly faster to the mixture than to single components. The observed differences in latency were not caused by an ambiguously shorter latency to one of the single components [ANOVA; morphologically designated LNs(morph) p = 0.758 and PNs(morph) p = 0.631, Figure A3 in Appendix].
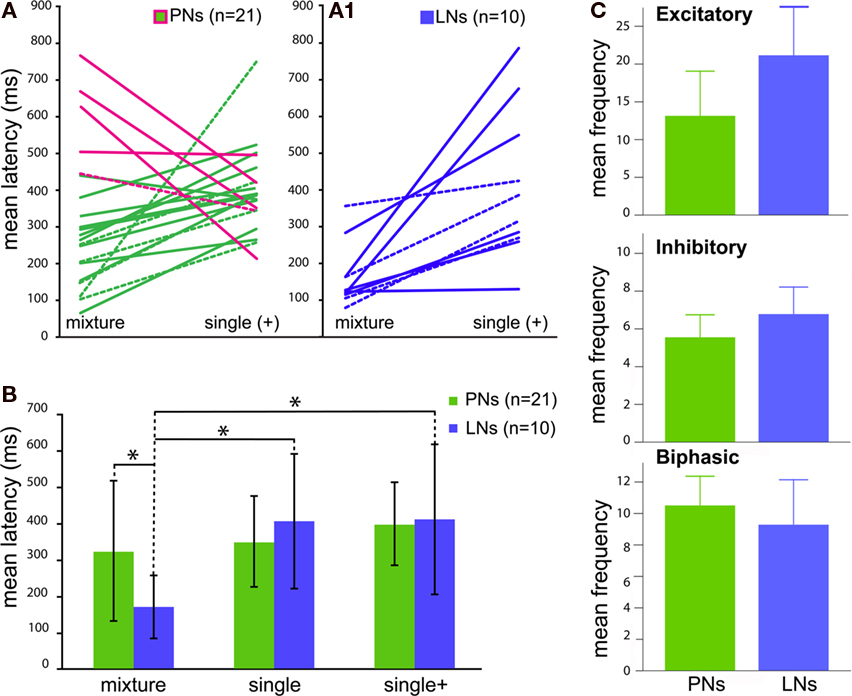
Figure 4. Comparison of the response kinetics to blends vs. single components for individual antennal lobe neurons [both morphologically (dashed lines) and physiologically confirmed cells]. (A1) All local interneurons (LNs, blue) show significantly shorter latencies to the blend, whereas five [(A), magenta line] out of 16 projection neurons (PNs, green) depict shorter latencies to single components (LNs p = 0.0020, PNs p = 0.103). Single components were tested at the higher blend concentration (single+). (B) Average response latencies show differences between blend vs. single component latencies at the two different concentrations for LNs (blue) but not PNs (green). (C) Comparison of mean temporal patterns to blend stimuli between projection (PN) and interneuron (LN) responses (both morphologically confirmed and physiologically designated neurons). Traces represent PNs (green) and LNs (blue) respectively. Graphs are arranged as Excitatory, Inhibitory and Biphasic responses. Bar graphs depict total mean frequencies calculated from areas under the PSTH curves (not shown, compare Figure 5).
Temporal Coding
The response frequency of each of the 34 cells was separated into 50 ms bins encompassing −300 to 1500 ms following stimulus onset (0 ms) to generate PSTHs for each trial (excluding mechanical stimulus delay). Figure 5 displays mean PSTHs for responses to mixtures, single compounds (single), and -compounds tested at the higher mixture concentration (single+). In this figure, PSTH’s are presented as lines rather than histogram bars. Separate graphs are presented for excitatory (Figure 5A), inhibitory (Figure 5B), and biphasic (Figure 5C) response profiles. Bar graphs to the right present mean frequencies based upon areas under the curve -created by the PSTHs. Although no significant difference was detected among inhibitory cells, both excitatory and biphasic cells showed differences in response pattern to the three types of stimuli (p < 0.05 for both response types). Notably, excitatory responses showed a difference in the single compound response as compared to higher concentrations. Alternatively, biphasic responses showed a difference in the mixture response as compared to the single compound responses (at both concentration steps).
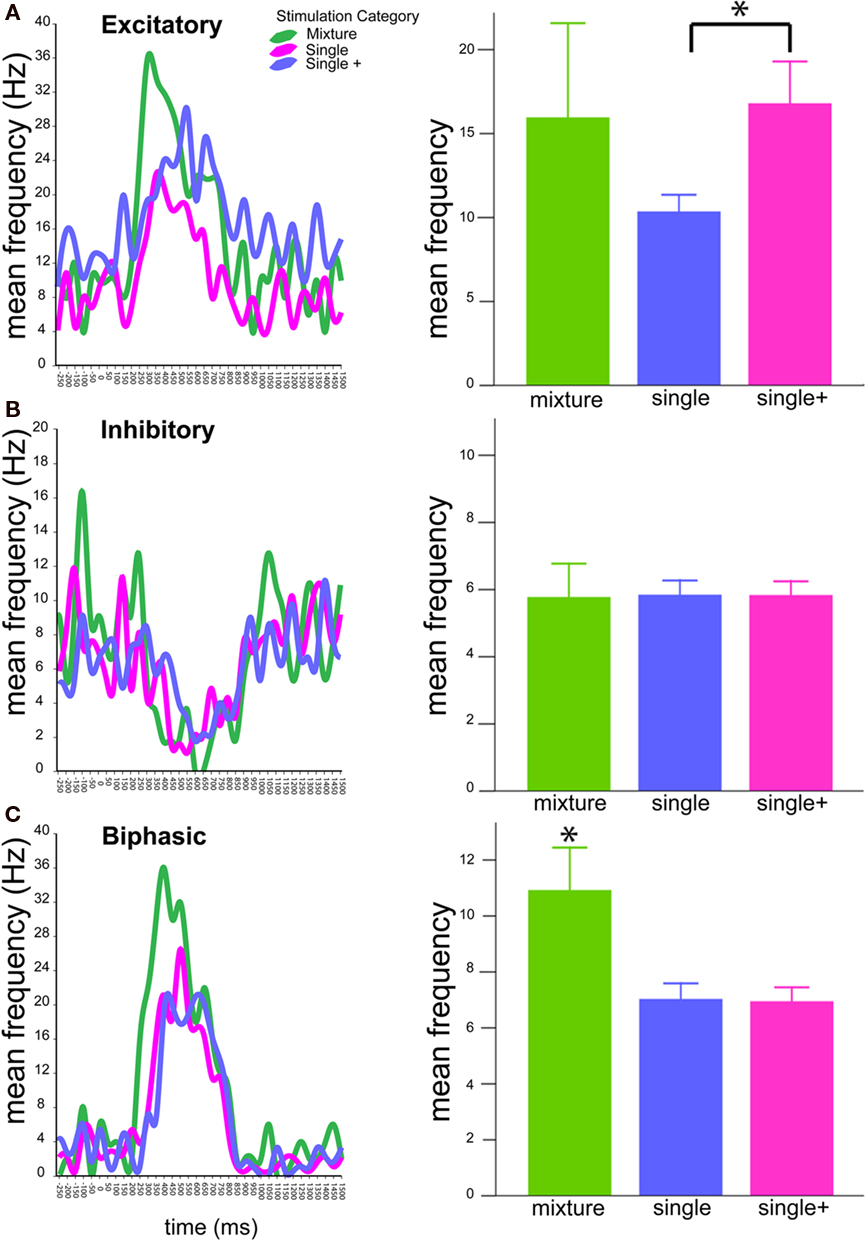
Figure 5. Temporal patterns of antennal lobe neuron responses. Graphs at left depict PSTHs of mean response frequencies (Hz) to blends (green), single compounds (magenta), and single compounds tested at the mixture concentration (blue). PSTHs are presented as lines rather than bars to allow simultaneous comparison of stimulus responses. Graphs are arranged as (A) Excitatory, (B) Inhibitory, (C) Biphasic responses. Bar graphs (right) depict total mean frequencies calculated from areas under the PSTH curves after stimulus onset (0 ms). Asterisks indicate significant differences according to Student’s t-tests. Bars ± SE.
Projection neurons and LNs typed either by morphological staining or spontaneous spike width measurement (see above) were also compared by their temporal pattern (see Figure 4C). In response to mixture stimuli, PN and LN response patterns did not differ for any type of response. Thus, temporal response patterns to mixtures did not differ based upon morphological type.
Discussion
We found significant non-linear mixture processing among 34 projection and interneurons examined in the M. sexta antennal lobe (AL). The high degree of across-fiber patterning shown in this study suggests the generation of a novel “mixture representation” within individual neurons throughout the AL.
Our findings reveal important aspects of neuronal mixture processing. In examining the cellular and spatiotemporal aspects of single AL neuron responses, at least three different cellular parameters appear to be involved in establishing the mixture response: (1) the morphology and location of neurons within the AL, (2) the firing rate of individual neurons (frequency and temporal pattern), and (3) the neuronal response latency. Conversely, stimulus concentration is encoded by the slow temporal patterning of single vs. higher concentration responses. We discuss each of these aspects of mixture processing below in relation to the overall network processing of mixtures within the AL.
Degree and Spread of Non-Linear Interactions
The degree of multicomponent response neurons in the AL was relatively sparse: Only one out of roughly 20 cells per animal responded to any of the seven compounds tested. However, all active cells responded to at least two of the components as well as the mixture. This translates to approximately 60 mixture-responsive cells for these compounds in the entire animal (roughly 1200 total PNs and LNs; Homberg et al., 1988). Mixture coding in Manduca thus represents a highly selective system, where less than 100 AL cells integrate information received from hundreds of OSNs. Admittedly, in order to avoid non-selective OSN responses the odor concentration used in our study (10′4) was in the lower part of the dynamic range of the dose–response curve (King et al., 2000; Reisenman et al., 2008) and may partially explain such high selectivity. Nevertheless, the mixture-responsive cells exhibited clear and robust signals (c.f. Figures 1 and 2).
Many mixture coding studies have historically utilized binary mixtures (see Introduction) but only 15% of all cells in our study responded to two compounds. Indeed, most cells responded to tertiary (26%) or quaternary mixtures (41%), whereas responses to quinary (12%) or six or seven components remained comparably sparse (3%; Table A1 in Appendix). This suggests that investigations of mixture interactions involving several compounds may reflect the natural processing of host odors more accurately, even though our selected compounds were still extremely limited compared to the plethora of odors Manduca encounters in nature. Additionally, unlike Deisig et al. (2006), we did not observe a general increase in response suppression and hypoadditivity with more complex mixtures (Table A2 in Appendix), although six and seven-component responses were scarce. This may suggest that the global inhibition and “gain control” suggested by Deisig et al. (2006) for complex mixtures is not a result of summed neuronal inhibition, but a global effect on the entire network. Moreover, this previous study assessed predominantly receptor neuron activity, while our study assessed LN and PN responses, which may not reflect this “gain control.”
Morphological Aspects of Mixture Processing
Non-linear interactions were observed among both projection and interneurons (Figure A2 in Appendix). In their review, Lei and Vickers (2008) suggest that multiglomerular innervation would aid mixture coding because single neurons integrate information directly from multiple OSN input channels. The presence of synergism and suppression in uniglomerular PNs in our study indicates a significant role for the across-fiber network in generating the unique mixture presentation. This assumption is also supported by our 3D morphological reconstructions. Tracing of four uni- and one multi glomerular projection neuron responding to the same mixture of four components [(+)-linalool, (−)-linalool, phenyl acetaldehyde, and cis-3-hexenyl acetate] showed radically different -innervation patterns (Figure 2). This suggests that the mixture percept of even a relatively simple four component mixture is represented globally across the AL network. Reisenman et al. (2008) also suggested that inhibitory interactions between PNs do not necessarily reflect spatial proximity. However, the neurons in Figure 2 responded to the same four components with diverse response types and morphologies that cannot be explained by a common inhibitory connection. This shows that the specific inhibition between pheromone/LFG and ordinary glomeruli in the Reisenman et al. (2008) study may not necessarily be a general property for multicomponent interactions across the AL.
Additionally, we showed that PNs and LNs exhibited similar levels of non-linear mixture interactions for both response frequency and latency (Figure A2 in Appendix), suggesting that neuron identity does not impact mixture response linearity. This is particularly surprising considering the vastly different -structure–activity relationships of the sensory neurons innervating these different cells. The presence of morphologically diverse cells with similar response profiles (Figure A2 in Appendix), suggests that receptor input cannot unambiguously predict either single or mixture response profiles of innervated neurons within the AL. As noted above, single AL neuron responses are thus shaped by the global circuitry of the entire AL itself, rather than simply relaying sensory information directly to higher brain centers.
Temporal Aspects of Mixture Processing
Response rate
We showed that 82% of the cells in this study exhibited non-linear spike frequencies in response to the mixture and 73% displayed non-linear response latencies (Table 1), even when component and mixture concentrations were equilibrated according to their vapor pressures. Among these non-linear interactions, the majority of cells exhibited hypoadditivity or suppression. Our findings on the single cell level correspond well to previous network-level studies of mixture interactions using calcium imaging (Carlsson et al., 2005; Deisig et al., 2006; Silbering and Galizia, 2007) or multi-unit recordings (Riffell et al., 2009a). Nevertheless, concentration effects and different dose–response properties among mixture components can also establish non-linearity in the odor response of single cells (Sachse and Galizia, 2003; Stopfer et al., 2003; Wright et al., 2005). We therefore equilibrated the concentration for each single component stimulus to the appropriate corresponding mixture concentration (Silbering and Galizia, 2007; Olsson et al., 2011). Testing odors (10−4) in the lower part of the dynamic range of the dose–response curve (King et al., 2000; Reisenman et al., 2008) can also prevent artifical non-linearity caused by eventual saturation. Moreover, fully randomized testing -prevented adaptation and cross adaptation effects as the repeated exposure to odors, even without a reward, can lead to plasticity in the AL (Stopfer and Laurent, 1999).
Although rare, synergism has been observed between essential behaviorally relevant components in oriental fruit moths (Pinero et al., 2008). In our data set, all four cells exhibiting synergism responded specifically to the same four volatiles [(+)/(−)-linalool, phenyl acetaldehyde, and (Z)-3-hexenyl acetate]. These compounds are all found in the odor bouquet of the flowers and plants on which Manduca feeds and oviposits (c.f. Kessler and Baldwin, 2001; Allmann and Baldwin, 2010). It is possible that synergism is restricted to very select cells responding in a context--dependent manner to important behavioral cues, although other cells responding to these same four compounds did not exhibit synergism. Interestingly, nearly all mixture-responsive cells responded to (+)-linalool, a compound suggested as particularly important for oviposition behavior in Manduca (Reisenman et al., 2010). Additionally, Table A1 in Appendix indicates that none of the volatiles used in this study had a specific impact on mixture linearity. All components tested exhibited similar levels of non-linearity across the recorded cells, suggesting that the unique mixture response established by the AL neurons is not due to a particular component. Future behavioral trials with female Manduca may clarify the correlation between compound identity and behavioral relevance, as has been shown recently for male feeding behavior (Riffell et al., 2009a).
Response latency
Sensory information incorporating both rate (i.e., average rate of spike firing) and spike timing allows for processing of complex mixtures by a limited number of cells, with mixtures coded not only by where and how cells fire, but when. The concept of a “latency code” is not novel (Krofczik et al., 2008). Indeed, response onset is the first information transmitted from the network (Krofczik et al., 2008). Applying different latencies for single components and mixtures can provide fast and definitive information about stimulus identity. Our results showed that mixture latencies not only revealed non-linear interactions when compared to single component responses (Table 1) but revealed significant differences between the two AL neuron classes: We report that mixture response latencies were significantly shorter than single compound latencies in LNs, but not in PNs (Figure 4A,B). In order for PNs to respond to a mixture, they must either be directly innervated by all OSNs responding to the mixture components, or be connected to the local interneuron network. Although a complete characterization of the Manduca periphery has yet to be performed, peripheral analyses (e.g., Shields and Hildebrand, 2001) suggest it is unlikely all components tested in this study are perceived by single OSN types directly innervating each of the diverse PNs assessed in this study (e.g., Figure 2). In addition, 80% of the mixture-responsive PNs were uniglomerular, and therefore unable to directly connect to all OSN populations specific to the mixture components. Consequently, the response latencies of LNs would reasonably be shorter as they must first transmit the relevant mixture information to the output PNs. Nevertheless, Krofczik et al. (2008) hypothesize that a “latency code” cannot accurately reflect both concentration and identity simultaneously. For this reason, the authors indicated that the temporal firing pattern of AL neurons could act in concert with latency to represent different stimuli.
Response Profiles
Interestingly, the relevance of the temporal response patterns seemed to differ depending on the response profile of the neuron recorded. Inhibitory responses did not show an overall difference in response pattern regardless of the type of stimulus presented. These cells also showed the highest level of hypoadditivity (73%, Table 1), indicating that the mixture response generally resembled at least one of the single components. Thus, inhibitory responses do not appear to provide any information about either identity or concentration, but may instead provide more binary information on the presence or absence of odor. On the other hand, excitatory responses showed a difference between low and high concentrations, regardless of whether the high concentration was a mixture or not (statistical significance only compared to single+ values). This indicates that excitatory responses may encode the concentration of the stimulus. Finally, mixture responses in biphasic cells were significantly different from both concentrations of single compound stimuli, suggesting that biphasic cells may carry the brunt of identity coding in the AL. Thus, both stimulus quality (with biphasic cells) and quantity (with excitatory cells) may be differentially coded by the slow temporal patterning of the response. Nevertheless, further investigations using dose–response curves for single odorants and mixtures would be necessary to test this hypothesis.
Conclusion
Our results suggest a global, highly combinatorial and non-linear scheme for processing complex host blends that is shaped by the AL network. On the single neuron level, mixture responses exhibit an array of interactions including suppression, hypoadditivity, and synergism that establish a new neuronal representation of the mixture that differs from single component responses. By assessing single neuron kinetics of mixture processing, our results suggest that each neuron utilizes a variety of parameters to produce the novel, unique signal representing the entire mixture. This suggests that analysis of mixture input from OSNs cannot unambiguously predict AL output on any spatial or temporal scale. Furthermore, simultaneous analysis of the entire AL network (rather than just the surface or a neuronal subset) is necessary to properly demonstrate the “mixture representation,” already occurring in AL.
Across single AL neurons, the slow, temporal patterning of the response may indicate specific aspects of stimulus quality or quantity. In fact, these differences among response profile types were some of the few consistent characteristics across this diverse neuronal data set. Specifically, inhibitory responses may signify the general presence of an odor, while excitatory and biphasic responses indicate odor concentration and identity, respectively. All neurons exhibited high levels of non-linearity for both response frequency and latency, indicating that both response rate and latency are important for coding the unique mixture identity. Finally, although both types of AL neurons analyzed were similar in terms of response patterns and types, LNs exhibited significantly shorter latencies. Along with the finding that uniglomerular PNs with similar response profiles revealed remarkably different innervation patterns, this supports the role of LNs at the first level of mixture processing in the AL and strengthens the assumption that mixtures are represented globally across the AL network.
Due to the obvious complexity of the system, and the inability to record all neurons involved, our findings cannot be interpreted in terms of a single model. Moreover, when studying early olfactory processing, we must consider that downstream events (e.g., mushroom bodies and/or lateral horn) may significantly alter mixture representations by combining information pooled across different channels (Laurent, 1999; Perez-Orive et al., 2002). However, our results on the single neuron kinetics of mixture processing provide a novel foundation for future studies on complex mixture processing.
Conflict of Interest Statement
The authors declare that the research was conducted in the absence of any commercial or financial relationships that could be construed as a potential conflict of interest.
Acknowledgments
We thank Daniel Veit for engineering the stimulus delivery system and solving technical problems. We are grateful to Christoph Kleineidam and Kirk Hillier for support and helpful advice on electrophysiology. We also thank Jürgen Rybak for invaluable advice on 3D-reconstructions and Sonja Bisch-Knaden for statistical help. We would like to express our gratitude to the Ichem consortium for fruitful discussion. This work was supported by Ichem (sixth programme of the EU) and funding from the Max Planck Society to Bill S. Hansson.
References
Akers, R. P., and Getz, W. M. (1993). Response of olfactory receptor neurons in honeybees to odorants and their binary mixtures. J. Comp. Physiol. A 173,169–185.
Allmann, S., and Baldwin, I. T. (2010). Insects betray themselves in nature to predators by rapid isomerization of green leaf volatiles. Science 329, 1075–1078.
Anton, S., Lofstedt, C., and Hansson, B. (1997). Central nervous processing of sex pheromones in two strains of the European corn borer Ostrinia nubilalis (Lepidoptera: Pyralidae). J. Exp. Biol. 200, 1073–1087.
Barrozo, R. B., Jarriault, D., Simeone, X., Gaertner, C., Gadenne, C., and Anton, S. (2010). Mating-induced transient inhibition of responses to sex pheromone in a male moth is not mediated by octopamine or serotonin. J. Exp. Biol. 213, 1100–1106.
Bell, R. A., and Joachim, F. A. (1976). Techniques for rearing laboratory colonies of tobacco hornworms and pink bollworms. Ann. Entomol. Soc. Am. 69, 365–373.
Boeckh, J., and Tolbert, L. P. (1993). Synaptic organization and development of the antennal lobe in insects. Microsc. Res. Tech. 24, 260–280.
Broome, B. M., Jayaraman, V., and Laurent, G. (2006). Encoding and decoding of overlapping odor sequences. Neuron 51, 467–482.
Carlsson, M. A., Chong, K. Y., Daniels, W., Hansson, B. S., and Pearce, T. C. (2007). Component information is preserved in glomerular responses to binary odor mixtures in the moth Spodoptera littoralis. Chem. Senses 32, 433–443.
Carlsson, M. A., Knüsel, P., Verschure, P. F. M. J., and Hansson, B. S. (2005). Spatio-temporal Ca2+ dynamics of moth olfactory projection neurones. Eur. J. Neurosci. 22, 647–657.
Christensen, T. A., Harrow, I. D., Cuzzocrea, C., Randolph, P. W., and Hildebrand, J. G. (1995). Distinct projections of two populations of olfactory receptor axons in the antennal lobe of the sphinx moth Manduca sexta. Chem. Senses 20, 313–323.
Christensen, T. A., and Hildebrand, J. G. (1987). Male-specific, sex pheromone-selective projection neurons in the antennal lobes of the moth Manduca sexta. J. Comp. Physiol. A 160, 553–569.
Christensen, T. A., Waldrop, B. R., Harrow, I. D., and Hildebrand, J. G. (1993). Local interneurons and information processing in the olfactory glomeruli of the moth Manduca sexta. J. Comp. Physiol. A 173, 385–399.
Davison, I. G., and Katz, L. C. (2007). Sparse and selective odor coding by mitral/tufted neurons in the main olfactory bulb. J. Neurosci. 27, 2091–2101.
De Jong, R., and Visser, J. H. (1988). Specificity-related suppression of responses to binary mixtures in olfactory receptors of the Colorado potato beetle. Brain Res. 447, 18–24.
Deisig, N., Giurfa, M., Lachnit, H., and Sandoz, J.-C. (2006). Neural representation of olfactory mixtures in the honeybee antennal lobe. Eur. J. Neurosci. 24, 1161–1174.
Deisig, N., Lachnit, H., Sandoz, J.-C., Lober, K., and Giurfa, M. (2003). A modified version of the unique cue theory accounts for olfactory compound processing in honeybees. Learn. Mem. 10, 199–208.
Ditzen, M., Evers, J.-F., and Galizia, C. G. (2003). Odor similarity does not influence the time needed for odor processing. Chem. Senses 28, 781–789.
Duchamp-Viret, P., Duchamp, A., and Chaput, M. A. (2003). Single olfactory sensory neurons simultaneously integrate the components of an odour mixture. Eur. J. Neurosci. 18, 2690–2696.
Fernandez, P. C., Locatelli, F. F., Person-Rennell, N., Deleo, G., and Smith, B. H. (2009). Associative conditioning tunes transient dynamics of early olfactory processing. J. Neurosci. 29, 10191–10202.
Fraser, A. M., Mechaber, W. L., and Hildebrand, J. G. (2003). Electroantennographic and behavioral responses of the sphinx moth Manduca sexta to host plant headspace volatiles. J. Chem. Ecol. 29, 1813–1833.
Galizia, C., and Menzel, R. (2001). The role of glomeruli in the neural representation of odours: results from optical recording studies. J. Insect Physiol. 47, 115–130.
Hansson, B. S., and Anton, S. (2000). Function and morphology of the antennal lobe: new developments. Annu. Rev. Entomol. 45, 203–231.
Hansson, B. S., Carlsson, M. A., and Kalinovà, B. (2003). Olfactory activation patterns in the antennal lobe of the sphinx moth, Manduca sexta. J. Comp. Physiol. A 189, 301–308.
Heinbockel, T., Christensen, T. A., and Hildebrand, J. G. (2004). Representation of binary pheromone blends by glomerulus-specific olfactory projection neurons. J. Comp. Physiol. A 190, 1023–1037.
Hillier, N. K., and Vickers, N. J. (2011). Mixture interactions in moth olfactory physiology: examining the effects of odorant mixture, concentration, distal stimulation, and antennal nerve transection on sensillar responses. Chem. Senses 36, 93–108.
Hoballah, M. E., and Turlings, T. C. J. (2005). The role of fresh versus old leaf damage in the attraction of parasitic wasps to herbivore-induced maize volatiles. J. Chem. Ecol. 31, 2003–2018.
Homberg, U., Montague, R. A., and Hildebrand, J. G. (1988). Anatomy of antenno-cerebral pathways in the brain of the sphinx moth Manduca sexta. Cell Tissue Res. 254, 255–281.
Hu, A., Zhang, W., and Wang, Z. (2010). Functional feedback from mushroom bodies to antennal lobes in the Drosophila olfactory pathway. Proc. Natl. Acad. Sci. U.S.A. 107, 10262–10267.
Johnson, B. A., Ong, J., and Leon, M. (2010). Glomerular activity patterns evoked by natural odor objects in the rat olfactory bulb are related to patterns evoked by major odorant components. J. Comp. Neurol. 518, 1542–1555.
Kent, K. S., Hoskins, S. G., and Hildebrand, J. G. (1987). A novel -serotoninimmunoreactive neuron in the antennal lobe of the sphinx moth Manduca sexta persists throughout postembryonic life. J. Neurobiol. 18, 451–465.
Kessler, A., and Baldwin, I. T. (2001). Defensive function of herbivore-induced plant volatile emissions in nature. Science 291, 2141–2144.
King, J. R., Christensen, T. A., and Hildebrand, J. G. (2000). Response characteristics of an identified, sexually dimorphic olfactory glomerulus. J. Neurosci. 20, 2391–2399.
Krofczik, S., Menzel, R., and Nawrot, M. P. (2008). Rapid odor processing in the honeybee antennal lobe network. Front. Comput. Neurosci. 2:9. doi: 10.3389/neuro.10.009.2008.
Lei, H., Mooney, R., and Katz, L. C. (2006). Synaptic integration of olfactory information in mouse anterior olfactory nucleus. J. Neurosci. 26, 12023–12032.
Lei, H., and Vickers, N. (2008). Central processing of natural odor mixtures in insects. J. Chem. Ecol. 34, 915–927.
Lin, D. Y., Shea, S. D., and Katz, L. C. (2006). Representation of natural stimuli in the rodent main olfactory bulb. Neuron 50, 937–949.
Matsumoto, S., and Hildebrand, J. (1981). Olfactory mechanisms in the moth Manduca sexta : response characteristics and morphology of central neurons in the antennal lobes. Proc. R. Soc. Lond. Biol. 249–277.
Mori, K., and Yoshihara, Y. (1995). Molecular recognition and olfactory processing in the mammalian olfactory system. Prog. Neurobiol. 45, 585–619.
Niessing, J., and Friedrich, R. W. (2010). Olfactory pattern classification by discrete neuronal network states. Nature 465, 47–52.
Ochieng, S. A., Park, K. C., and Baker, T. C. (2002). Host plant volatiles synergize responses of sex pheromone-specific olfactory receptor neurons in male Helicoverpa zea. J. Comp. Physiol. A 188, 325–333.
Olsson, S. B., Kuebler, L. S., Veit, D., Steck, K., Schmidt, A., Knaden, M., and Hansson, B. S. (2011). A novel multicomponent stimulus device for use in olfactory experiments. J. Neurosci. Methods 195, 1–9.
Perez-Orive, J., Mazor, O., Turner, G. C., Cassenaer, S., Wilson, R. I., and Laurent, G. (2002). Oscillations and sparsening of odor representations in the mushroom body. Science 297, 359–365.
Pinero, J. C., Giovanni Galizia, C., and Dorn, S. (2008). Synergistic behavioral responses of female oriental fruit moths (Lepidoptera:Tortricidae) to synthetic host plant-derived mixtures are mirrored by odor-evoked calcium activity in their antennal lobes. J. Insect Physiol. 54, 333–343.
Reisenman, C. E., Christensen, T. A., Francke, W., and Hildebrand, J. G. (2004). Enantioselectivity of projection neurons innervating identified olfactory glomeruli. J. Neurosci. 24, 2602–2611.
Reisenman, C. E., Heinbockel, T., and Hildebrand, J. G. (2008). Inhibitory interactions among olfactory glomeruli do not necessarily reflect spatial proximity. J. Neurophysiol. 100, 554–564.
Reisenman, C. E., Riffell, J. A., Bernays, E. A., and Hildebrand, J. G. (2010). Antagonistic effects of floral scent in an insect-plant interaction. Proc. R. Soc. B Biol. Sci. 1–9, doi: 10.1098/rspb.2010.0163
Rescorla, R. A. (1972). “Configural” conditioning in discrete-trial bar pressing. J. Comp. Physiol. Psychol. 85, 331–338.
Riffell, J. A., Lei, H., Christensen, T. A., and Hildebrand, J. G. (2009a). Characterization and coding of behaviorally significant odor mixtures. Curr. Biol. 19, 335–340.
Riffell, J. A., Lei, H., and Hildebrand, J. G. (2009b). Inaugural Article: Neural correlates of behavior in the moth Manduca sexta in response to complex odors. Proc. Natl. Acad. Sci. U.S.A. 106, 19219–19226.
Rospars, J. P., Lansky, P., Chaput, M., and Duchamp-Viret, P. (2008). Competitive and noncompetitive odorant interactions in the early neural coding of odorant mixtures. J. Neurosci. 28, 2659–2666.
Rybak, J. R., Kuss, A., Hans, L., Zachow, S., Hege, H.-C., Lienhard, M., Singer, J., Neubert, K., and Menzel, R. (2010). The digital bee brain: integrating and managing neurons in a common 3D reference system. Front. Syst. Neurosci. 4:12. doi: 10.3389/fnsys.2010.00030
Sachse, S., and Galizia, C. G. (2003). The coding of odour-intensity in the honeybee antennal lobe: local computation optimizes odour representation. Eur. J. Neurosci. 18, 2119–2132.
Shepherd, G. M. (1972). Synaptic organization of the mammalian olfactory bulb. Physiol. Rev. 52, 864–917.
Shields, V. D., and Hildebrand, J. G. (2001). Responses of a population of antennal olfactory receptor cells in the female moth Manduca sexta to plant-associated volatile organic compounds. J. Comp. Physiol. A 186, 1135–1151.
Shipley, M. T., and Ennis, M. (1996). Functional organization of olfactory system. J. Neurobiol. 30, 123–176.
Silbering, A. F., and Galizia, C. G. (2007). Processing of odor mixtures in the Drosophila antennal lobe reveals both global inhibition and glomerulus-specific interactions. J. Neurosci. 27, 11966–11977.
Stocker, R. F. (1994). The organization of the chemosensory system in Drosophila melanogaster : a review. Cell Tissue Res. 275, 3–26.
Stopfer, M., Jayaraman, V., and Laurent, G. (2003). Intensity versus identity coding in an olfactory system. Neuron 39, 991–1004.
Stopfer, M., and Laurent, G. (1999). Short-term memory in olfactory network dynamics. Nature 402, 664–668.
Tabor, R., Yaksi, E., Weislogel, J.-M., and Friedrich, R. W. (2004). Processing of odor mixtures in the zebrafish olfactory bulb. J. Neurosci. 24, 6611–6620.
Tasin, M., Bäckman, A.-C., Bengtsson, M., Ioriatti, C., and Witzgall, P. (2006). Essential host plant cues in the grapevine moth. Naturwissenschaften 93, 141–144.
Tolbert, L. P., Matsumoto, S. G., and Hildebrand, J. G. (1983). Development of synapses in the antennal lobes of the moth Manduca sexta during metamorphosis. J. Neurosci. 3, 1158–1175.
Keywords: odor processing, network, intracellular, electrophysiological recording, single cell
Citation: Kuebler LS, Olsson SB, Weniger R and Hansson BS (2011) Neuronal processing of complex mixtures establishes a unique odor representation in the moth antennal lobe. Front. Neural Circuits 5:7. doi: 10.3389/fncir.2011.00007
Received: 20 February 2011; Paper pending published: 17 March 2011;
Accepted: 27 April 2011; Published online: 11 May 2011.
Edited by:
Mark A. Frye, University of California Los Angeles, USAReviewed by:
Matthieu Louis, Center for Genomic Regulation, SpainJeff Riffell, University of Washington, USA
Copyright: © 2011 Kuebler, Olsson, Weniger and Hansson. This is an open-access article subject to a non-exclusive license between the authors and Frontiers Media SA, which permits use, distribution and reproduction in other forums, provided the original authors and source are credited and other Frontiers conditions are complied with.
*Correspondence: Linda Sara Kuebler, Department of Evolutionary Neuroethology, Max-Planck-Institute for Chemical Ecology, Hans-Knoell Str.8, 07745 Jena, Germany. e-mail: lkuebler@ice.mpg.de