A Novel Optical Quantal Analysis of Miniature Events Reveals Enhanced Frequency Following Amyloid β Exposure
 Henry B. C. Taylor
 Rudi Tong1,2
  Alexander F. Jeans
 Nigel J. Emptage
- 1Department of Pharmacology, University of Oxford, Mansfield Road, Oxford, United Kingdom
- 2Montreal Neurological Institute and Hospital, Montreal, QC, Canada
Non-evoked miniature release of neurotransmitters is increasingly recognized as playing an important role in neural function and is implicated in synaptic plasticity, metaplasticity, and homeostasis. Spontaneous miniature release events (minis) are usually measured electrophysiologically by recording the miniature postsynaptic currents (mEPSCs) that they evoke. However, this indirect technique can be confounded by changes within the postsynaptic neuron. Here, using the fluorescent probe SynaptopHluorin 2×, we have developed an optical method for the measurement of minis that enables direct assessment of release events. We use the technique to reveal that the frequency of minis following incubation of hippocampal neurons with Amyloid β oligomers (Aβo) is increased. Electrophysiological mEPSC recordings obtained under the same conditions report a decrease in frequency, with the discrepancy likely due to Aβo-induced changes in quantal size. Optical quantal analysis of minis may therefore have a role in the study of minis in both normal physiology and disease, as it can circumvent potential confounds caused by postsynaptic changes.
Introduction
It is well documented that, in addition to neurotransmitter release evoked by action potential (AP) invasion into boutons, neurons occasionally release vesicles of neurotransmitter in a non-evoked or spontaneous manner. Until quite recently presynaptic “miniature release events” (minis) were thought to be functionally unimportant, however, it is now clear that they serve distinct physiological roles. Miniature release mechanisms are, in part, separate from those of evoked release (Deitcher et al., 1998), and minis appear to have partially distinct receptor targets (Atasoy et al., 2008; Reese and Kavalali, 2016) and release machinery (Ramirez et al., 2012) to evoked release. Spontaneous miniature excitatory postsynaptic currents (mEPSC) amplitude and frequency reflect previous activity at the synapse (Turrigiano et al., 1998; Liu et al., 2000; Bacci et al., 2001), and may play a role in metaplasticity, with increased mEPSC amplitude and frequency accompanying long-term potentiation (LTP; Oliet et al., 1996) and lowered mEPSC amplitude and frequency correlating with the strength of long-term depression (LTD) induction (Zhang et al., 2005). Also, minis have been implicated in homeostatic synaptic scaling (Pozo and Goda, 2010; Turrigiano, 2012; Kavalali, 2015; Gonzalez-Islas et al., 2018) via the regulation of dendritic protein synthesis (Sutton et al., 2004, 2006; Sutton and Schuman, 2006). Synaptic scaling is impaired in certain neurodegenerative diseases such as Alzheimer’s disease (AD; Frere and Slutsky, 2018), and indeed minis appear to be altered in AD. Following exposure to disease-relevant assembly states and concentrations of the AD-associated peptide amyloid β (Aβ), in particular highly pathogenic Aβ oligomers (Aβo; Viola and Klein, 2015), multiple studies have shown that mini frequency is reduced (Kamenetz et al., 2003; Shankar et al., 2007; Nimmrich et al., 2008; Talantova et al., 2013), although in one study this reduction was preceded by a short-lived frequency increase (Parodi et al., 2010). These Aβo-induced changes in mini frequency have usually been explained by a presumed presynaptic weakening over time, although there is no direct evidence for this. There is, however, a well-established process of postsynaptic weakening and depression which begins rapidly following the addition of Aβo (Sheng et al., 2012).
Minis are typically studied experimentally by recording the currents that they produce (mEPSCs) at the soma of the postsynaptic neuron. This approach introduces some important confounds into the measurements. First, it is not possible to attribute events measured at the soma to specific synapses, precluding the study of a specific contribution of minis at a specific site, or those arising at clusters of synapses on specific axonal or dendritic branches. The latter may be particularly important as there is clear evidence that dendritic branches are an important spatial unit for synaptic regulation (Branco et al., 2008) and information storage (Govindarajan et al., 2011). Second, electrical signals from distal synapses can be attenuated by the time they reach the soma due to the passive cable properties of dendrites. This will produce a sampling bias towards synapses on proximal dendritic branches in electrophysiological recordings (Williams and Stuart, 2003). Finally, changes in postsynaptic strength, particularly weakening, can occur as a result of physiological processes such as LTD, or as a consequence of pathology, as in Aβo addition. These changes will affect the amplitude of mEPSCs and, if postsynaptic weakening is significant, could cause some events to fall below the detection threshold of the recording. Under these circumstances lost events reduce the total mini count and will generate mini frequency measurements that are artefactually low.
Direct imaging of presynaptic terminals offers the opportunity to circumvent these problems. There have been successful attempts to optically measure quantal release events, both evoked and spontaneous, using the fluorescent dye FM 1–43 (Ryan et al., 1997; Tokuoka and Goda, 2008), but very few attempts have been made to look specifically at miniature release. Here, we demonstrate a novel, optical method of directly measuring miniature presynaptic release events using the genetically encoded fluorescent probe SynaptopHluorin 2× (SypH 2×). We show that this circumvents the confounds associated with postsynaptic weakening and allows accurate changes in the frequency of miniature release to be measured following Aβo exposure. Given the importance of minis in the regulation of synaptic strength this technique should facilitate study in several areas of synaptic biology.
Materials and Methods
Primary Neuronal Culture and Transfection
Hippocampal neurons from postnatal day 1 (P1) Wistar rats were seeded onto poly-D-lysine-coated coverslips and cultured in Neurobasal medium A supplemented with 2% fetal bovine serum (FBS), 2% B27 Plus, 1% Glutamax, and 1% penicillin/streptomycin. The day after plating, half the medium was exchanged for Neurobasal medium A supplemented with 2% B27 Plus and 1% Glutamax only, which was used for all subsequent feeds. Cells were transfected at 8 days in vitro (DIV) with SypH 2× (gift of Dr. Y. Zhu) plasmids using Lipofectamine 2000 (Invitrogen). To investigate the effects of Aβo, cells were incubated in Aβo [200 nM; prepared according to a well-validated protocol (Klein, 2002)] for over an hour in the incubator.
Aβo Synthesis
Experiments were conducted using a single batch of Aβ1–42 peptide (Abcam) and oligomers were synthesized according to a validated protocol (Klein, 2002). This widely-used and highly reproducible preparation has previously been characterized in detail and found to contain predominantly the low molecular weight species most associated with synaptotoxicity (Lambert et al., 2007; Velasco et al., 2012). Briefly, solid Aβ1–42 was dissolved in cold hexafluoro-2-propanol (HFIP; Sigma Aldrich). The peptide was incubated at room temperature for at least 1 h to establish monomerization and randomization of the structure. The HFIP was aliquoted and allowed to evaporate overnight, followed by 10 min in a Savant Speed Vac. The resulting peptide was stored as a film at −80°C. The film was dissolved in anhydrous dimethylsulfoxide (DMSO; Sigma Aldrich) to 5 mM, diluted to approximately 100 μM with Ham’s F12 (without phenol red, with glutamine; Caisson Laboratories, Logan, UT) and briefly vortexed. The solution was incubated at 4°C for 22–24 h, and soluble oligomers obtained by centrifugation at 14,000 g for 10 min at 4°C.
Live Cell Imaging
Experiments were performed on dissociated hippocampal cultures prepared as described above at DIV 14–18 when synapses have matured. Coverslips were mounted in a Chamlide EC-B18 stimulation chamber on the stage of an Olympus IX-71 inverted microscope fitted with a 100×, NA 1.40 UPlanSApo objective and an Andor iXon EM CCD camera. Fluorescence illumination was supplied by a 100 W mercury lamp used with appropriate neutral density filters and shuttered (Uniblitz CS25, Vincent Associates) during all non-data acquisition periods. Suitable fields of boutons were selected using the readily visualized resting fluorescence signal exhibited by SypH 2×, the additional criterion being that boutons show normal, healthy morphology with a regular outline, and relatively modest resting fluorescence signal that increases following NH4Cl unquenching. When required, APs were evoked by passing 20 V, 1 ms current pulses from a custom-made stimulation box via platinum electrodes. We have previously shown that each of these 20 V pulses has a greater than 97% probability of eliciting a single AP in stimulated neurons in our experimental setup (Jeans et al., 2017). Imaging of pHluorins was carried out at 1 Hz, with stimulation, image acquisition, and shuttering all under the coordinated control of WinWCP software (Strathclyde Electrophysiology Software). Experiments were carried out at room temperature in Tyrode’s solution (120 mM NaCl, 2.5 mM KCl, 20 mM HEPES, 30 mM glucose, 2 mM CaCl2, 2 mM MgCl2, pH 7.4) with APV (50 μM) and NBQX (10 M) to block recurrent activity. TTX (1 μM) was added for experiments investigating minis. NH4Cl unquenching was achieved by replacing Tyrodes solution with a Tyrodes solution containing 50 mM NH4Cl in substitution of 50 mM NaCl. For experiments examining minis, folimycin (10 nM) was added after 10 baseline images (Figure 2A). For experiments using nicotine, this was present (20 μM) in the Tyrode’s solution. Where cells have been incubated in Aβo, this is also present during the experiment.
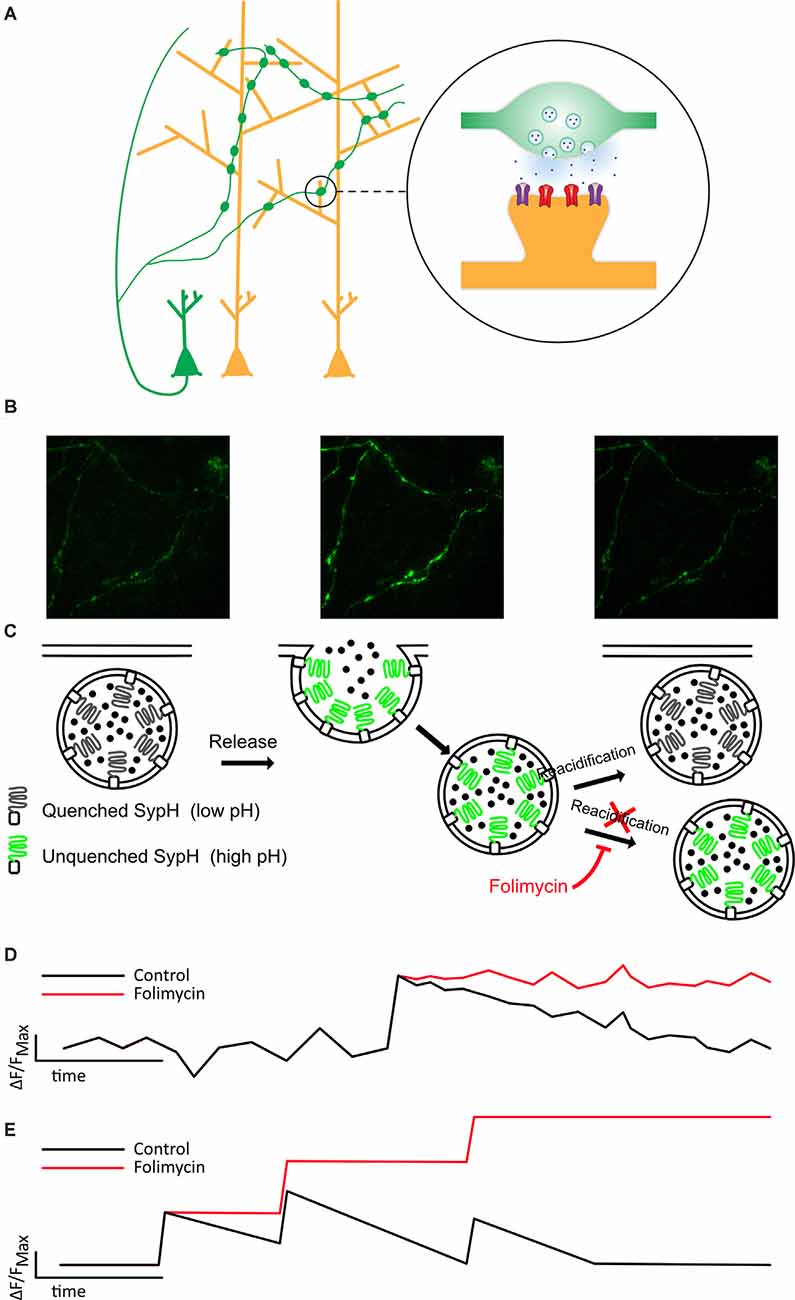
Figure 1. Folimycin allows the summation of SypH 2× signals from multiple miniature release events. (A) Schematic illustrating the presynaptic expression of SypH 2× in boutons of dissociated neurons (green) that form synapses on postsynaptic dendrites of other neurons (yellow). (B,C) Top images show representative fields from a SypH 2×-expressing neuronal culture during a typical experiment. The left panel shows SypH 2× fluorescence quenched at baseline before vesicle exocytosis occurs (middle panel) with accompanying unquenching of SypH 2× fluorescence as it is exposed to the neutral pH of the extracellular milieu. Following this, vesicles are reclaimed by endocytosis and as these are reacidified, fluorescence is once again quenched. These phases are represented in the schematic images below, which also demonstrate how the cell-impermeable inhibitor of vesicular reacidification folimycin can be used to block the quenching of endocytosed vesicles so that the final signal change at a bouton reflects all vesicles released during the experiment. (D) This schematic cartoon of a fluorescence signal at a bouton following a single release event with (red) and without (black) folimycin demonstrates how preventing vesicle reacidification prevents the SypH 2× fluorescence signal from being quenched, ensuring that the total signal change will reflect a sum of all vesicles released during the experiment, as shown in (E).
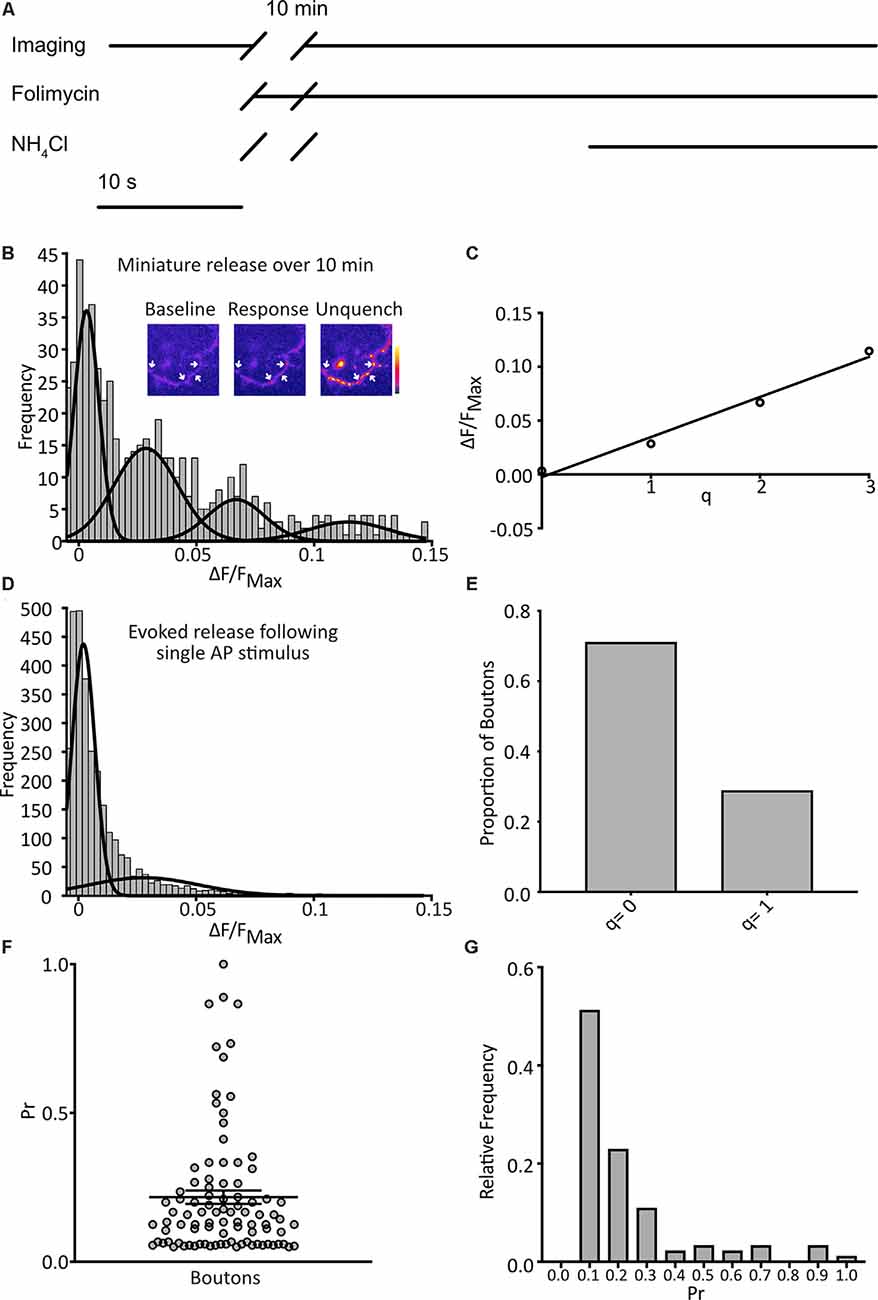
Figure 2. Detection of quantal spontaneous miniature release. (A) Experimental scheme with baseline images taken before the addition of the vesicular ATPase inhibitor, folimycin, and 10 min wait, before further image acquisition and unquenching using basic NH4Cl-containing buffer. TTX is present throughout. (B) Following a 10 min incubation in TTX and folimycin, a frequency distribution of responses, calculated for each bouton as the background-subtracted total signal change over the 10-min incubation normalized to the maximum signal change following NH4Cl addition, was plotted (n = 574 synapses from 31 coverslips). Multiple Gaussian curves were fit as described in the main text. Inset: a representative field showing boutons (arrows) at different points of an experiment. (C) The mean of each Gaussian was plotted against the number of release events it represents and after linear regression fitting the interpeak distance, a measure of quantal size (q), was estimated as the slope (q = 0.037 ΔF/FNH4Cl). (D) Responses of boutons to 1 action potential (AP) stimuli with a frequency distribution of responses (n = 4297 observations from three coverslips) and an objective Gaussian curve fitting algorithm was used to model the distribution with a mean of the second Gaussian giving q = 0.028. (E) Proportion of observations contributing to each Gaussian (q = 0: 0.79; q = 1: 0.21). (F) Pr of individual boutons over the experiment (n = 92 boutons from three coverslips, mean Pr = 0.22 ± 0.02). (G) frequency distribution of Pr derived from data presented in (E).
Patch Clamp Recording of mEPSCs
mEPSCs were recorded from dissociated hippocampal cultures at DIV 14–18. These recordings were carried out in whole-cell voltage-clamp, holding cells to −70 mV, using patch electrodes (5–8 MΩ) filled with Cs internal solution (135 mM CsCl, 2 mM MgCl2, 2 mM Na2-ATP, 0.2 mM Na-GTP, 10 mM HEPES). The internal solution was allowed to diffuse for 2 min before mEPSCs were recorded using an Axopatch 2A amplifier (Axon Instruments) and WinWCP software (Strathclyde Electrophysiology Software). Recordings were then analyzed using Mini Analysis from Synaptosoft, and mEPSCs were detected manually.
Analysis of Imaging
Boutons were selected for analysis using a 2 μm diameter ROI. Experiments imaging pHluorins were analyzed using a custom-written MATLAB script. For analysis of minis, background fluorescence was subtracted from data points, which were then normalized to the bouton’s NH4Cl signal to allow for changes in expression of SypH 2× between boutons. The difference in fluorescence between baseline and 10 min after folimycin incubation was then calculated. Responses of each bouton were classified into bins of fixed-width, and this binned data were used to plot a frequency distribution. A Gaussian mixture model was then fitted to the (unbinned) data, with the optimal number of Gaussians determined by the model resulting in the lowest Akaike Information Criterion (AIC). The Gaussian distributions were ranked according to their expected values, with the rank corresponding to the number of release events (q). Having identified the boundaries (defined as the intersections between Gaussian distributions), we assigned each bouton within those boundaries as having undergone the number of miniature release events to which that distribution corresponds. To compare different conditions with different numbers of boutons, the relative proportions of boutons in each Gaussian distribution rather than the absolute numbers were used.
For one AP experiment, data points were background adjusted as before, and for each simulation, a response was measured as a response (average two points after stim) - baseline (average of first five points). These were then normalized to the NH4Cl signal. A frequency distribution was then generated in the same range as before, and two Gaussians fitted. Having found the intersection of the Gaussians, observations below the intersection were designated as not released, while those above were assigned as a release event. Probability of release (Pr) was then calculated for each bouton, discarding any bouton that did not release at all or had fewer than 15 usable measurements.
For 100 AP experiments, data points were background adjusted and normalized to the NH4Cl signal as before. The maximum response was calculated as the average of two points immediately following the end of stimulation minus the average of the first eight baseline time points.
Results
SypH 2× Allows Direct Measurement of Miniature Release in the Presence of Folimycin
To directly probe release, we used SypH 2×, a genetically encoded, presynaptically expressed reporter of vesicle fusion (Zhu et al., 2009) that fluoresces at neutral pH, and is quenched at the low pH observed within acidified synaptic vesicles (Figures 1A–C). SypH 2× and variants have been used to observe responses to single AP stimulation (Zhang et al., 2009; Jeans et al., 2017) given their enhanced signal-to-noise ratio due to the inclusion of multiple pHluorin moieties (Zhu et al., 2009). Despite this, it is difficult to resolve single release events from the background signal, particularly when seeking to detect events that are not time-locked to a stimulus. Therefore, we used the cell-impermeable vesicular ATPase inhibitor folimycin (Figure 1), which blocks reacidification of synaptic vesicles (Ertunc et al., 2007), thereby allowing events to be summed to produce a signal that is readily quantified (Figures 1C,D).
We imaged cultured hippocampal neurons expressing SypH 2× in the presence of tetrodotoxin (TTX; 1 μM) at pH 7.4 to isolate spontaneous miniature release events. Images were taken at 1 Hz over 10 s to give a baseline signal before the addition of folimycin (10 nM). After waiting for 10 min a series of images was again acquired at 1 Hz for 30 s. Over the last 10 s, SypH 2× was unquenched by alkalization using a buffer containing NH4Cl (pH 7.4) to reveal the maximal SypH 2× response at each terminal (Figure 2A). All responses were normalized to this maximal response to control for inter-terminal differences in pHluorin expression level (Jeans et al., 2017). Background adjusted responses were then plotted as a frequency distribution. Using a control dataset, the AIC was determined for Gaussian mixture models with varying numbers of Gaussian distributions (1–10 Gaussians) fitted to the data. The lowest (optimal) AIC value corresponded to a fit of four Gaussians (Figure 2B). The expected values of these distributions were equally spaced, as would be anticipated if events were quantal. Indeed, the resultant plot fitted well with a linear relationship (R2 = 0.98), with the interpeak distance representing quantal size (q; q = 0.037 ΔF/FNH4Cl; Figure 2C).
To validate our calculated value for q we studied evoked release events following single AP stimuli. We serially imaged SypH 2×-expressing boutons over 10 s while giving a single stimulus, subjecting each to 23 trials with 30 s rest between each one. Using the same equipment and conditions, we have previously confirmed that >97% of delivered stimuli elicit a single AP in stimulated neurons (Jeans et al., 2017). We plotted a frequency distribution of the NH4Cl-normalized responses and fitted this with two Gaussian distributions (corresponding to either no release or one release event) using a custom-written objective curve fitting script. We again derived q as the interpeak distance (Figure 2D). This yielded a q estimate of comparable magnitude to that derived from the mini-experiment (q = 0.028 ΔF/FNH4Cl). The proportion of events that showed successful release was 21%, corresponding to an average probability of release across all events of 0.21 (Figure 2E). Next, we examined the properties of the individual boutons, calculating the probability of release (Pr) as the proportion of events where the release occurred for that bouton over the 23 trials, and discarding silent boutons. We plotted these values as a frequency distribution (Figure 2G) with a mean Pr of 0.22 and a median of 0.14, which is highly consistent with that observed by others in cultured hippocampal neurons (Branco et al., 2008; Tokuoka and Goda, 2008). Overall, these results indicate that our method can detect quantal miniature release events with high sensitivity.
SypH 2× Detects Miniature Release Frequency Changes, and Aβo Incubation Increases the Frequency of Miniature Release Events
In the first experimental application of our new method, we wanted to confirm an ability to detect changes in mini frequency under conditions where this is known to change. We, therefore, applied nicotine (20 μM), well documented to cause robust increases in mini frequency (Gray et al., 1996; Sharma and Vijayaraghavan, 2003). Cultured neurons expressing SypH 2× were imaged as before in an experimental buffer containing nicotine. Background adjusted responses were plotted as frequency distribution, and four Gaussians were fitted as before (Figure 3A). The mean values of each Gaussian were plotted to reveal an evenly spaced distribution (R2 = 0.97), with q = 0.44 ΔF/FNH4Cl, similar to that of control (Figure 3B).
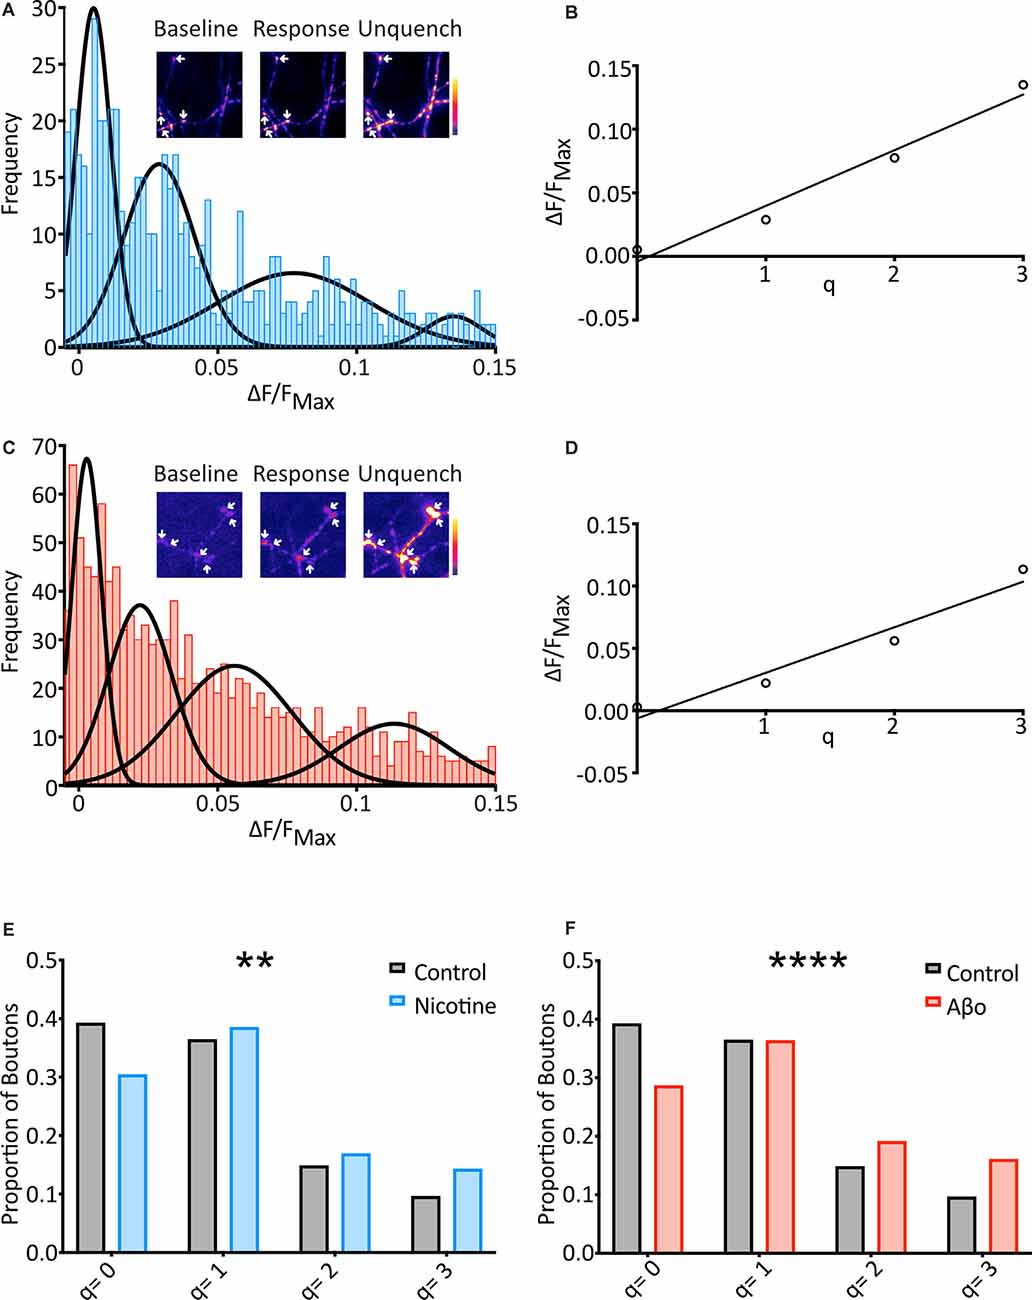
Figure 3. SypH 2× can detect changes in mini frequency, and Aβo treatment increases the frequency of optically-detected miniature events. (A) Cells were subjected to the same protocol as previously (see Figure 2A) in the presence of nicotine (20 μM) and frequency distribution of responses were plotted (n = 569 synapses from 21 coverslips). Multiple Gaussians were fit as for control. Inset: a representative field showing boutons (arrows) at different points of an experiment. (B) Linear regression fitting of a plot of the mean of each Gaussian vs. number of release events allowed an estimation of quantal size (q) as the slope of the plot (q = 0.044 ΔF/FNH4Cl). (C) Aβo-incubated cells were also subjected to the protocol shown in Figure 2A, and the frequency distribution of responses was plotted (n = 1217 synapses from 57 coverslips). Multiple Gaussians were fit as for control. Inset: a representative field showing boutons (arrows) at different points of an experiment. (D) Linear regression fitting of a plot of the mean of each Gaussian vs. number of release events allowed an estimation of quantal size (q) as the slope of the plot (q = 0.037 ΔF/FNH4Cl). (E) The proportion of boutons contributing to each Gaussian for control (black/gray) vs. nicotine (blue: Control: 39.2% of boutons not releasing, 36.4% of boutons releasing 1 quantum, 14.8% of boutons releasing 2 quanta, 9.6% of boutons releasing 3 quanta, n = 574 synapses from 31 coverslips; Nicotine: 30.4% of boutons not releasing, 38.5% of boutons releasing 1 quantum, 16.9% of boutons releasing 2 quanta, 14.2% of boutons releasing 3 quanta, n = 569 synapses from 21 coverslips). Note the control data-set is that shown in Figure 2. (F) Proportion of boutons contributing to each Gaussian for control (black/grey) vs. Aβo-incubated (red). The control data-set is that shown in Figure 2 and used in (E) above (Aβo: 28.6% of boutons not releasing, 36.3% of boutons releasing 1 quantum, 19.1% of boutons releasing 2 quanta, 16.0% of boutons releasing 3 quanta, n = 1,217 synapses from 36 coverslips). Chi-squared test. **p < 0.01, ****p< 0.0001.
To investigate changes in the frequency of minis between conditions, the fraction of boutons undergoing different numbers of release events (q = 0, q = 1, etc.) was assessed. The boundaries of each pair of Gaussians were calculated, and boutons that responded within each range were assigned as corresponding to that number of release events (Figure 3E). When nicotine was applied the data right-shifted as compared to control, with more boutons showing spontaneous release over the two minutes (Figure 3E). This confirms that our technique can report changes in mini frequency.
We then applied the technique to an investigation of changes in mini frequency following application of the Alzheimer’s-associated peptide Aβ in its most pathogenic (oligomeric) form (Aβo; Viola and Klein, 2015). This is an important question as miniature transmission may regulate synaptic strength (Sutton et al., 2006), which is reduced via poorly-understood mechanisms following Aβo treatment (Sheng et al., 2012). Previous studies examining the effects of Aβo on minis have performed electrophysiological recordings and conclude that mini frequency in cultured hippocampal neurons is reduced by Aβo treatment (Kamenetz et al., 2003; Shankar et al., 2007; Nimmrich et al., 2008; Parodi et al., 2010; Talantova et al., 2013). However, Aβo causes rapid postsynaptic depression and weakening (Li et al., 2009) that may reduce the number of electrically detectable events. We hypothesized that this might have confounded the electrophysiological data.
Cultured neurons expressing SypH 2× were incubated in media containing Aβo (200 nM) for over an hour and miniature release events were then measured as described above with the Aβo concentration maintained in the experimental buffer. Once again, responses were plotted as a frequency distribution in the same range as the control, and four Gaussians were objectively fitted (Figure 3C). The mean values of each Gaussian were plotted to find an evenly spaced distribution (R2 = 0.95) with q = 0.037 ΔF/FNH4Cl (Figure 3D), identical to that of control.
We then used the fraction of boutons undergoing different numbers of release events (q = 0, q = 1, etc.) to investigate changes in mini frequency as before (Figure 3F). As with our nicotine control, this revealed that the Aβo condition was right-shifted compared to control, with more boutons showing spontaneous release over 10 min, and more release events evident from those boutons. Chi-squared analysis of these results compared to control confirmed that the differences were highly significant (Figure 3F).
Electrophysiological Recording of Miniature Release Shows a Decrease in Frequency Upon Aβo Incubation
As the result of using the optical analysis approach is different from electrophysiological studies that report reduced mini frequency with Aβo, we wanted to ensure that this was not simply a reflection of differences in our experimental preparation. We therefore sought to replicate previous studies and recorded mEPSCs in hippocampal neurons electrophysiologically. Recordings were performed under voltage-clamp conditions, with the cell held at −70 mV, taking steps to maximize the sensitivity of mEPSC detection, including the use of a high impedance (low noise) amplifier and a cesium-containing internal solution to increase input resistance (Spruston et al., 1993; Fleidervish and Libman, 2008). In contrast to the increase in mini frequency we observed using direct optical measurements, we found a small reduction in mEPSC frequency (Figures 4A,B). Also, we found a decrease in mEPSC amplitude, consistent with Aβo-induced synaptic depression (Figure 4C). These data are similar to those reported by others performing electrophysiological recordings and suggest that our experimental preparation is comparable, and the effects of Aβo treatment are an appropriate context in which to test our optical method.
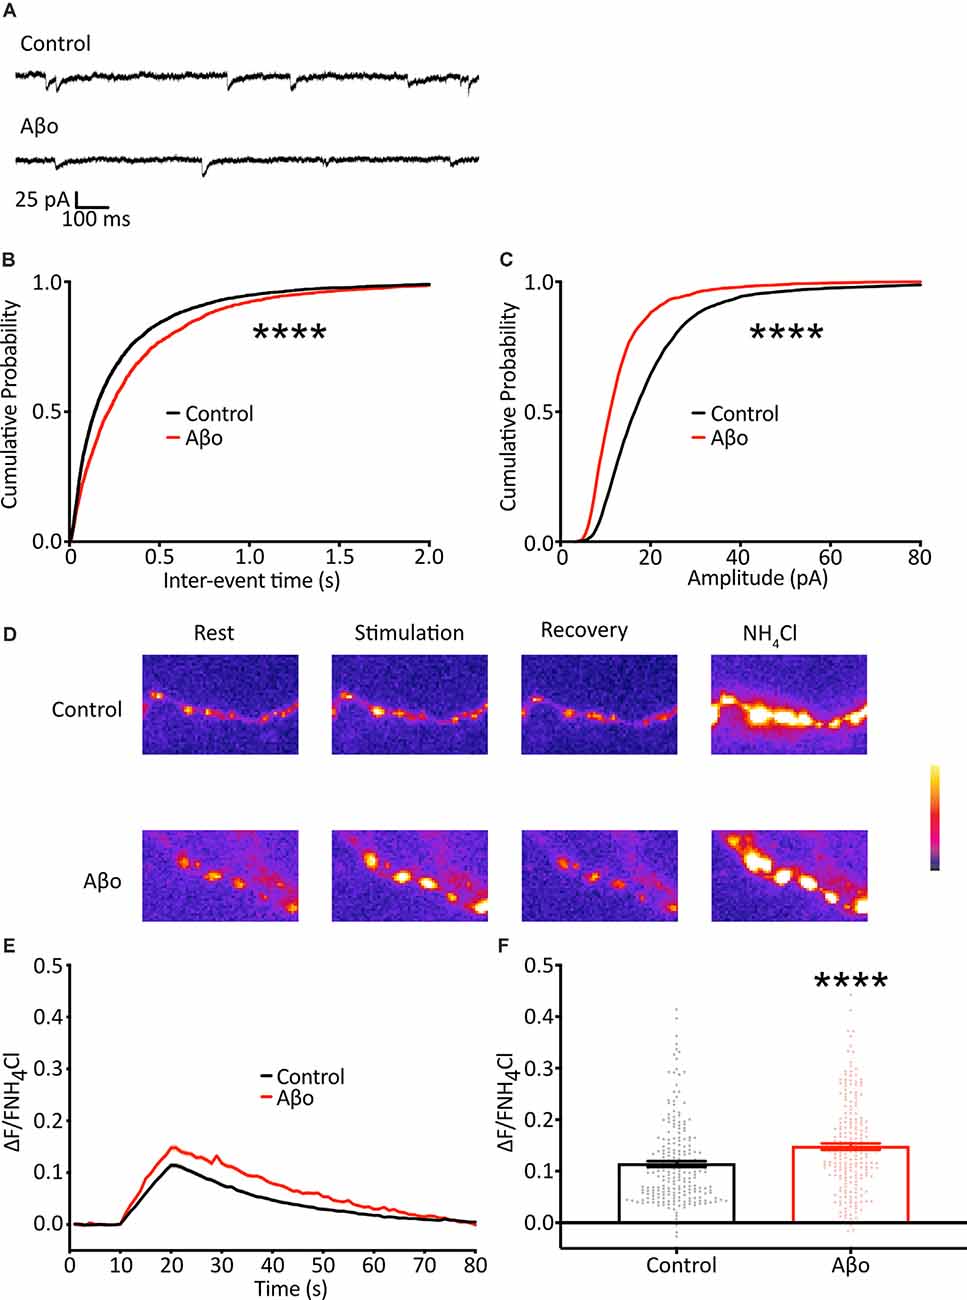
Figure 4. Electrophysiological recordings of mEPSCs show a reduction in frequency and amplitude following Aβo treatment. (A) Representative traces of mEPSC recordings. (B) Cumulative frequency distribution of mEPSC frequency. Kolmogorov-Smirnov test. (C) Cumulative frequency distribution of mEPSC amplitude. Kolmogorov-Smirnov test. (D) SypH 2×-expressing neurons were subjected to a 10 Hz/10 s stimulus train with or without prior incubation in Aβo. Panels show representative fluorescence images at stages of the experiment as indicated. (E) Average SypH 2× fluorescence traces. Shading represents ± SEM. (F) Mean peak amplitudes of responses ± SEM: control 0.114 ± 0.005, n = 218 synapses from seven coverslips; Aβo 0.148 ± 0.006, n = 212 synapses from six coverslips. Student’s t-test, ****p < 0.0001.
Aβo Incubation Causes an Increase in Evoked Release
There is evidence both at the Drosophila neuromuscular junction (NMJ) and at mammalian central synapses that upon partial or complete blockage or loss of neurotransmitter receptors at the postsynaptic terminus (reduction in quantal size) there is a swift increase in the probability of evoked presynaptic release as a result of mechanisms of homeostatic synaptic plasticity (Pozo and Goda, 2010; Turrigiano, 2012; Davis and Muller, 2015). Here, we show a reduction in quantal size, evident as a decrease in mini amplitude, following Aβo incubation (Figure 4C), and we hypothesized that, in addition to the changes in the miniature release we describe above, the reduction in quantal size might elicit a homeostatic increase in evoked neurotransmitter release. Accordingly, we imaged cultured neurons expressing SypH 2× with and without incubation in Aβo (200 nM) and delivered 100 APs at 10 Hz to examine changes in evoked release (Figure 4D). We found that Aβo incubation potentiated release by about 30% compared to control (Figures 4E,F). This would be in keeping with a compensatory increase in the evoked release, although other interpretations, such as a direct effect of Aβo on the presynaptic terminal, remain possible.
Discussion
We have developed a new optical technique for observing spontaneous miniature release events that allows direct detection of release, rather than relying on traditional, indirect measurements at the postsynaptic terminus such as the recording of mEPSCs. We found that this method gave a consistent ΔF/FNH4Cl value for q across experimental conditions that was similar to that found with a one AP evoked stimulus, arguing in favor of its ability to detect quantal release events. To further validate the method, we investigated Pr in response to a one AP stimulus and found that it was comparable to that of previous studies (Branco et al., 2008).
In addition to pHluorin probes such as SypH 2×, several other methods of directly observing release at the presynaptic terminal have been developed. In particular, the fluorescent FM dyes have an inherently high signal and have been used to good effect to image presynaptic release in several systems (Kavalali and Jorgensen, 2014), including optical quantal analysis in cultured neurons (Tokuoka and Goda, 2008). New, optimized variants of the genetically encoded glutamate reporter iGluSnFR are also promising, as they allow rapid visualization of glutamate release both in vitro and in vivo (Hires et al., 2008; Marvin et al., 2013, 2018; Hefendehl et al., 2016; Xie et al., 2016; Helassa et al., 2018). While either of these techniques could, in principle, also be used to develop an optical quantal analysis of minis, they both have disadvantages: FM dyes are not genetically encoded, and therefore cannot be used to label genetically defined subpopulations as SypH 2× can. The iGluSnFR probe is genetically encoded, but as a glutamate sensor detection could be confounded by any change in the dynamics of glutamate concentration, including alterations to the rate of clearance by synaptic transporters. Nonetheless, it would be valuable to develop such tools for optical analysis of minis, not least as it offers a means of validation for results obtained using pHluorin probes.
Having established our optical measurement of minis, we demonstrated that the technique can be used to show alterations in spontaneous miniature release in cultured neurons, and critically reveal that changes not detected electrophysiologically in neurons exposed to the AD-associated peptide Aβ can be unmasked using our new approach. This outcome has particular significance as previous studies have shown that the addition of the pathogenic, oligomeric form of Aβ leads to postsynaptic weakening at an early stage in in vitro AD models, possibly via mechanisms of LTD leading to AMPAR internalization (Shankar et al., 2007, 2008; Li et al., 2009). Similar postsynaptic weakening seems to be evident at an early stage in vivo (Chang et al., 2006; Whitcomb et al., 2015; Zhang et al., 2018). Because minis are a key regulator of postsynaptic strength (Sutton et al., 2006), it is important to understand changes in mini frequency in the presence of Aβo. It is also important as an addition to our overall understanding of presynaptic regulation in AD. There is a growing body of evidence, which includes this study, that Aβo enhances evoked presynaptic release (Brito-Moreira et al., 2011; Russell et al., 2012; Lazarevic et al., 2017), although this is somewhat controversial (Nimmrich et al., 2008; He et al., 2019). At the same time, most studies that have examined mEPSC frequency in the presence of Aβo show that, in contrast to the changes in evoked release, it is reduced (Kamenetz et al., 2003; Shankar et al., 2007; Nimmrich et al., 2008; Talantova et al., 2013). This is puzzling since evoked and miniature release are typically tightly correlated; indeed, for this reason, mini frequency is often used as an indicator of overall presynaptic strength (Prange and Murphy, 1999). Our result helps resolve this apparent contradiction and suggests that Aβo does indeed enhance presynaptic function globally.
It is possible that enhanced neurotransmitter release (spontaneous and/or evoked) might result from the induction of homeostatic plasticity in response to postsynaptic weakening caused by Aβo, as can occur rapidly when the postsynaptic terminus is blocked or pharmacologically suppressed (Davis and Muller, 2015; Delvendahl et al., 2019). However, synaptic activity can itself homeostatically regulate postsynaptic strength on relatively short timescales (Ibata et al., 2008), and it remains possible that changes in presynaptic function are a primary event. Further work will be required to verify either these or alternative, possibilities.
It is increasingly apparent that regulation of presynaptic function is critical in mechanisms of learning and memory, and that presynaptic dysregulation can play an early role in a host of neurological disorders, including neurodegenerative diseases such as Parkinson’s disease and AD (Waites and Garner, 2011). Our findings add to the repertoire of techniques available to probe these important processes, as well as providing specific insight into the dysregulation of miniature neurotransmission in AD.
Data Availability Statement
The raw data supporting the conclusions of this article will be made available by the authors, without undue reservation.
Ethics Statement
Ethical review and approval was not required for the animal study because in vivo work was not performed in this study, and all procedures were carried out in accordance with the Animals (Scientific Procedures) Act, 1986 (UK).
Author Contributions
HT and AJ planned and designed the study. HT performed the experiments. RT assisted with coding and analysis of SypH 2× data. AJ and NE provided oversight for the work. All authors contributed to the article and approved the submitted version.
Funding
AJ was supported in part for this work by an Medical Research Council (MRC) Clinician Scientist Fellowship (G0802812). This work was funded by the MRC (UK; G0501572) and Biotechnology and Biological Sciences Research Council (BBSRC; UK; BB/J018724/1).
Conflict of Interest
The authors declare that the research was conducted in the absence of any commercial or financial relationships that could be construed as a potential conflict of interest.
Acknowledgments
We thank Dr. Y. Zhu for gifting SypH 2×.
References
Atasoy, D., Ertunc, M., Moulder, K. L., Blackwell, J., Chung, C., Su, J., et al. (2008). Spontaneous and evoked glutamate release activates two populations of NMDA receptors with limited overlap. J. Neurosci. 28, 10151–10166. doi: 10.1523/JNEUROSCI.2432-08.2008
Bacci, A., Coco, S., Pravettoni, E., Schenk, U., Armano, S., Frassoni, C., et al. (2001). Chronic blockade of glutamate receptors enhances presynaptic release and downregulates the interaction between synaptophysin-synaptobrevin-vesicle-associated membrane protein 2. J. Neurosci. 21, 6588–6596. doi: 10.1523/JNEUROSCI.21-17-06588.2001
Branco, T., Staras, K., Darcy, K. J., and Goda, Y. (2008). Local dendritic activity sets release probability at hippocampal synapses. Neuron 59, 475–485. doi: 10.1016/j.neuron.2008.07.006
Brito-Moreira, J., Paula-Lima, A. C., Bomfim, T. R., Oliveira, F. B., Sepulveda, F. J., De Mello, F. G., et al. (2011). Abeta oligomers induce glutamate release from hippocampal neurons. Curr. Alzheimer Res. 8, 552–562. doi: 10.2174/156720511796391917
Chang, E. H., Savage, M. J., Flood, D. G., Thomas, J. M., Levy, R. B., Mahadomrongkul, V., et al. (2006). AMPA receptor downscaling at the onset of Alzheimer’s disease pathology in double knockin mice. Proc. Natl. Acad. Sci. U S A 103, 3410–3415. doi: 10.1073/pnas.0507313103
Davis, G. W., and Muller, M. (2015). Homeostatic control of presynaptic neurotransmitter release. Annu. Rev. Physiol. 77, 251–270. doi: 10.1146/annurev-physiol-021014-071740
Deitcher, D. L., Ueda, A., Stewart, B. A., Burgess, R. W., Kidokoro, Y., and Schwarz, T. L. (1998). Distinct requirements for evoked and spontaneous release of neurotransmitter are revealed by mutations in the Drosophila gene neuronal-synaptobrevin. J. Neurosci. 18, 2028–2039. doi: 10.1523/JNEUROSCI.18-06-02028.1998
Delvendahl, I., Kita, K., and Muller, M. (2019). Rapid and sustained homeostatic control of presynaptic exocytosis at a central synapse. Proc. Natl. Acad. Sci. U S A 116, 23783–23789. doi: 10.1073/pnas.1909675116
Ertunc, M., Sara, Y., Chung, C., Atasoy, D., Virmani, T., and Kavalali, E. T. (2007). Fast synaptic vesicle reuse slows the rate of synaptic depression in the CA1 region of hippocampus. J. Neurosci. 27, 341–354. doi: 10.1523/JNEUROSCI.4051-06.2007
Fleidervish, I. A., and Libman, L. (2008). How cesium dialysis affects the passive properties of pyramidal neurons: implications for voltage clamp studies of persistent sodium current. New J. Phys. 10:035001. doi: 10.1088/1367-2630/10/3/035001
Frere, S., and Slutsky, I. (2018). Alzheimer’s disease: from firing instability to homeostasis network collapse. Neuron 97, 32–58. doi: 10.1016/j.neuron.2017.11.028
Gonzalez-Islas, C., Bulow, P., and Wenner, P. (2018). Regulation of synaptic scaling by action potential-independent miniature neurotransmission. J. Neurosci. Res. 96, 348–353. doi: 10.1002/jnr.24138
Govindarajan, A., Israely, I., Huang, S. Y., and Tonegawa, S. (2011). The dendritic branch is the preferred integrative unit for protein synthesis-dependent LTP. Neuron 69, 132–146. doi: 10.1016/j.neuron.2010.12.008
Gray, R., Rajan, A. S., Radcliffe, K. A., Yakehiro, M., and Dani, J. A. (1996). Hippocampal synaptic transmission enhanced by low concentrations of nicotine. Nature 383, 713–716. doi: 10.1038/383713a0
He, Y., Wei, M., Wu, Y., Qin, H., Li, W., Ma, X., et al. (2019). Amyloid beta oligomers suppress excitatory transmitter release via presynaptic depletion of phosphatidylinositol-4,5-bisphosphate. Nat. Commun. 10:1193. doi: 10.1038/s41467-019-09114-z
Hefendehl, J. K., Ledue, J., Ko, R. W., Mahler, J., Murphy, T. H., and Macvicar, B. A. (2016). Mapping synaptic glutamate transporter dysfunction in vivo to regions surrounding Abeta plaques by iGluSnFR two-photon imaging. Nat. Commun. 7:13441. doi: 10.1038/ncomms13441
Helassa, N., Durst, C. D., Coates, C., Kerruth, S., Arif, U., Schulze, C., et al. (2018). Ultrafast glutamate sensors resolve high-frequency release at Schaffer collateral synapses. Proc. Natl. Acad. Sci. U S A 115, 5594–5599. doi: 10.1073/pnas.1720648115
Hires, S. A., Zhu, Y., and Tsien, R. Y. (2008). Optical measurement of synaptic glutamate spillover and reuptake by linker optimized glutamate-sensitive fluorescent reporters. Proc. Natl. Acad. Sci. U S A 105, 4411–4416. doi: 10.1073/pnas.0712008105
Ibata, K., Sun, Q., and Turrigiano, G. G. (2008). Rapid synaptic scaling induced by changes in postsynaptic firing. Neuron 57, 819–826. doi: 10.1016/j.neuron.2008.02.031
Jeans, A. F., Van Heusden, F. C., Al-Mubarak, B., Padamsey, Z., and Emptage, N. J. (2017). Homeostatic presynaptic plasticity is specifically regulated by P/Q-type Ca(2+) channels at mammalian hippocampal synapses. Cell Rep. 21, 341–350. doi: 10.1016/j.celrep.2017.09.061
Kamenetz, F., Tomita, T., Hsieh, H., Seabrook, G., Borchelt, D., Iwatsubo, T., et al. (2003). APP processing and synaptic function. Neuron 37, 925–937. doi: 10.1016/s0896-6273(03)00124-7
Kavalali, E. T. (2015). The mechanisms and functions of spontaneous neurotransmitter release. Nat. Rev. Neurosci. 16, 5–16. doi: 10.1038/nrn3875
Kavalali, E. T., and Jorgensen, E. M. (2014). Visualizing presynaptic function. Nat. Neurosci. 17, 10–16. doi: 10.1038/nn.3578
Klein, W. L. (2002). Abeta toxicity in Alzheimer’s disease: globular oligomers (ADDLs) as new vaccine and drug targets. Neurochem. Int. 41, 345–352. doi: 10.1016/s0197-0186(02)00050-5
Lambert, M. P., Velasco, P. T., Chang, L., Viola, K. L., Fernandez, S., Lacor, P. N., et al. (2007). Monoclonal antibodies that target pathological assemblies of Abeta. J. Neurochem. 100, 23–35. doi: 10.1111/j.1471-4159.2006.04157.x
Lazarevic, V., Fienko, S., Andres-Alonso, M., Anni, D., Ivanova, D., Montenegro-Venegas, C., et al. (2017). Physiological concentrations of amyloid beta regulate recycling of synaptic vesicles via alpha7 acetylcholine receptor and CDK5/calcineurin signaling. Front. Mol. Neurosci. 10:221. doi: 10.3389/fnmol.2017.00221
Li, S., Hong, S., Shepardson, N. E., Walsh, D. M., Shankar, G. M., and Selkoe, D. (2009). Soluble oligomers of amyloid beta protein facilitate hippocampal long-term depression by disrupting neuronal glutamate uptake. Neuron 62, 788–801. doi: 10.1016/j.neuron.2009.05.012
Liu, C., Shirasaki, T., Tanaka, S., and Kuba, K. (2000). Activity-dependent enhancement of miniature excitatory postsynaptic current amplitude and its modulation by protein kinase C in cultured rat sympathetic neurons. Neurosci. Lett. 280, 57–60. doi: 10.1016/S0304-3940(99)00992-1
Marvin, J. S., Borghuis, B. G., Tian, L., Cichon, J., Harnett, M. T., Akerboom, J., et al. (2013). An optimized fluorescent probe for visualizing glutamate neurotransmission. Nat. Methods 10, 162–170. doi: 10.1038/nmeth.2333
Marvin, J. S., Scholl, B., Wilson, D. E., Podgorski, K., Kazemipour, A., Muller, J. A., et al. (2018). Stability, affinity and chromatic variants of the glutamate sensor iGluSnFR. Nat. Methods 15, 936–939. doi: 10.1038/s41592-018-0171-3
Nimmrich, V., Grimm, C., Draguhn, A., Barghorn, S., Lehmann, A., Schoemaker, H., et al. (2008). Amyloid beta oligomers (Aβ1–42 globulomer) suppress spontaneous synaptic activity by inhibition of P/Q-type calcium currents. J. Neurosci. 28, 788–797. doi: 10.1523/JNEUROSCI.4771-07.2008
Oliet, S. H., Malenka, R. C., and Nicoll, R. A. (1996). Bidirectional control of quantal size by synaptic activity in the hippocampus. Science 271, 1294–1297. doi: 10.1126/science.271.5253.1294
Parodi, J., Sepulveda, F. J., Roa, J., Opazo, C., Inestrosa, N. C., and Aguayo, L. G. (2010). Beta-amyloid causes depletion of synaptic vesicles leading to neurotransmission failure. J. Biol. Chem. 285, 2506–2514. doi: 10.1074/jbc.M109.030023
Pozo, K., and Goda, Y. (2010). Unraveling mechanisms of homeostatic synaptic plasticity. Neuron 66, 337–351. doi: 10.1016/j.neuron.2010.04.028
Prange, O., and Murphy, T. H. (1999). Analysis of multiquantal transmitter release from single cultured cortical neuron terminals. J. Neurophysiol. 81, 1810–1817. doi: 10.1152/jn.1999.81.4.1810
Ramirez, D. M., Khvotchev, M., Trauterman, B., and Kavalali, E. T. (2012). Vti1a identifies a vesicle pool that preferentially recycles at rest and maintains spontaneous neurotransmission. Neuron 73, 121–134. doi: 10.1016/j.neuron.2011.10.034
Reese, A. L., and Kavalali, E. T. (2016). Single synapse evaluation of the postsynaptic NMDA receptors targeted by evoked and spontaneous neurotransmission. eLife 5:e21170. doi: 10.7554/eLife.21170
Russell, C. L., Semerdjieva, S., Empson, R. M., Austen, B. M., Beesley, P. W., and Alifragis, P. (2012). Amyloid-beta acts as a regulator of neurotransmitter release disrupting the interaction between synaptophysin and VAMP2. PLoS One 7:e43201. doi: 10.1371/journal.pone.0043201
Ryan, T. A., Reuter, H., and Smith, S. J. (1997). Optical detection of a quantal presynaptic membrane turnover. Nature 388, 478–482. doi: 10.1038/41335
Shankar, G. M., Bloodgood, B. L., Townsend, M., Walsh, D. M., Selkoe, D. J., and Sabatini, B. L. (2007). Natural oligomers of the Alzheimer amyloid-beta protein induce reversible synapse loss by modulating an NMDA-type glutamate receptor-dependent signaling pathway. J. Neurosci. 27, 2866–2875. doi: 10.1523/JNEUROSCI.4970-06.2007
Shankar, G. M., Li, S., Mehta, T. H., Garcia-Munoz, A., Shepardson, N. E., Smith, I., et al. (2008). Amyloid-beta protein dimers isolated directly from Alzheimer’s brains impair synaptic plasticity and memory. Nat. Med. 14, 837–842. doi: 10.1038/nm1782
Sharma, G., and Vijayaraghavan, S. (2003). Modulation of presynaptic store calcium induces release of glutamate and postsynaptic firing. Neuron 38, 929–939. doi: 10.1016/s0896-6273(03)00322-2
Sheng, M., Sabatini, B. L., and Sudhof, T. C. (2012). Synapses and Alzheimer’s disease. Cold Spring Harb. Perspect. Biol. 4:a005777. doi: 10.1101/cshperspect.a005777
Spruston, N., Jaffe, D. B., Williams, S. H., and Johnston, D. (1993). Voltage- and space-clamp errors associated with the measurement of electrotonically remote synaptic events. J. Neurophysiol. 70, 781–802. doi: 10.1152/jn.1993.70.2.781
Sutton, M. A., and Schuman, E. M. (2006). Dendritic protein synthesis, synaptic plasticity and memory. Cell 127, 49–58. doi: 10.1016/j.cell.2006.09.014
Sutton, M. A., Ito, H. T., Cressy, P., Kempf, C., Woo, J. C., and Schuman, E. M. (2006). Miniature neurotransmission stabilizes synaptic function via tonic suppression of local dendritic protein synthesis. Cell 125, 785–799. doi: 10.1016/j.cell.2006.03.040
Sutton, M. A., Wall, N. R., Aakalu, G. N., and Schuman, E. M. (2004). Regulation of dendritic protein synthesis by miniature synaptic events. Science 304, 1979–1983. doi: 10.1126/science.1096202
Talantova, M., Sanz-Blasco, S., Zhang, X., Xia, P., Akhtar, M. W., Okamoto, S., et al. (2013). Abeta induces astrocytic glutamate release, extrasynaptic NMDA receptor activation and synaptic loss. Proc. Natl. Acad. Sci. U S A 110, E2518–2527. doi: 10.1073/pnas.1306832110
Tokuoka, H., and Goda, Y. (2008). Activity-dependent coordination of presynaptic release probability and postsynaptic GluR2 abundance at single synapses. Proc. Natl. Acad. Sci. U S A 105, 14656–14661. doi: 10.1073/pnas.0805705105
Turrigiano, G. (2012). Homeostatic synaptic plasticity: local and global mechanisms for stabilizing neuronal function. Cold Spring Harb. Perspect. Biol. 4:a005736. doi: 10.1101/cshperspect.a005736
Turrigiano, G. G., Leslie, K. R., Desai, N. S., Rutherford, L. C., and Nelson, S. B. (1998). Activity-dependent scaling of quantal amplitude in neocortical neurons. Nature 391, 892–896. doi: 10.1038/36103
Velasco, P. T., Heffern, M. C., Sebollela, A., Popova, I. A., Lacor, P. N., Lee, K. B., et al. (2012). Synapse-binding subpopulations of Abeta oligomers sensitive to peptide assembly blockers and scFv antibodies. ACS Chem. Neurosci. 3, 972–981. doi: 10.1021/cn300122k
Viola, K. L., and Klein, W. L. (2015). Amyloid beta oligomers in Alzheimer’s disease pathogenesis, treatment and diagnosis. Acta Neuropathol. 129, 183–206. doi: 10.1007/s00401-015-1386-3
Waites, C. L., and Garner, C. C. (2011). Presynaptic function in health and disease. Trends Neurosci. 34, 326–337. doi: 10.1016/j.tins.2011.03.004
Whitcomb, D. J., Hogg, E. L., Regan, P., Piers, T., Narayan, P., Whitehead, G., et al. (2015). Intracellular oligomeric amyloid-beta rapidly regulates GluA1 subunit of AMPA receptor in the hippocampus. Sci. Rep. 5:10934. doi: 10.1038/srep10934
Williams, S. R., and Stuart, G. J. (2003). Role of dendritic synapse location in the control of action potential output. Trends Neurosci. 26, 147–154. doi: 10.1016/S0166-2236(03)00035-3
Xie, Y., Chan, A. W., Mcgirr, A., Xue, S., Xiao, D., Zeng, H., et al. (2016). Resolution of high-frequency mesoscale intracortical maps using the genetically encoded glutamate sensor iGluSnFR. J. Neurosci. 36, 1261–1272. doi: 10.1523/JNEUROSCI.2744-15.2016
Zhang, J., Yang, Y., Li, H., Cao, J., and Xu, L. (2005). Amplitude/frequency of spontaneous mEPSC correlates to the degree of long-term depression in the CA1 region of the hippocampal slice. Brain Res. 1050, 110–117. doi: 10.1016/j.brainres.2005.05.032
Zhang, Q., Li, Y., and Tsien, R. W. (2009). Response to comment on “the dynamic control of kiss-and-run and vesicular reuse probed with single nanoparticles”. Science 325, 1499–1499. doi: 10.1126/SCIENCE.1176007
Zhang, Y., Guo, O., Huo, Y., Wang, G., and Man, H. Y. (2018). Amyloid-beta induces AMPA receptor ubiquitination and degradation in primary neurons and human brains of Alzheimer’s disease. J. Alzheimers Dis. 62, 1789–1801. doi: 10.3233/JAD-170879
Keywords: pHluorin, neurotransmitter release, mEPSC, Alzheimer’s, presynaptic, miniature neurotransmission
Citation: Taylor HBC, Tong R, Jeans AF and Emptage NJ (2020) A Novel Optical Quantal Analysis of Miniature Events Reveals Enhanced Frequency Following Amyloid β Exposure. Front. Cell. Neurosci. 14:564081. doi: 10.3389/fncel.2020.564081
Received: 20 May 2020; Accepted: 01 October 2020;
Published: 03 November 2020.
Edited by:
Alessandro Tozzi, University of Perugia, ItalyReviewed by:
Thomas Behnisch, Fudan University, ChinaPete Wenner, Emory University, United States
Shaomin Li, Brigham and Women’s Hospital and Harvard Medical School, United States
Copyright © 2020 Taylor, Tong, Jeans and Emptage. This is an open-access article distributed under the terms of the Creative Commons Attribution License (CC BY). The use, distribution or reproduction in other forums is permitted, provided the original author(s) and the copyright owner(s) are credited and that the original publication in this journal is cited, in accordance with accepted academic practice. No use, distribution or reproduction is permitted which does not comply with these terms.
*Correspondence: Henry B. C. Taylor, henry.taylor@pharm.ox.ac.uk; Alexander F. Jeans, alexander.jeans@pharm.ox.ac.uk; Nigel J. Emptage, nigel.emptage@pharm.ox.ac.uk