Developmental changes in GABAergic mechanisms in human visual cortex across the lifespan
- 1 McMaster Integrative Neuroscience Discovery and Study Program, McMaster University, Hamilton, ON, Canada
- 2 Department of Psychology, Neuroscience and Behaviour, McMaster University, Hamilton, ON, Canada
Functional maturation of visual cortex is linked with dynamic changes in synaptic expression of GABAergic mechanisms. These include setting the excitation–inhibition balance required for experience-dependent plasticity, as well as, intracortical inhibition underlying development and aging of receptive field properties. Animal studies have shown that there is developmental regulation of GABAergic mechanisms in visual cortex. In this study, we show for the first time how these mechanisms develop in the human visual cortex across the lifespan. We used Western blot analysis of postmortem tissue from human primary visual cortex (n = 30, range: 20 days to 80 years) to quantify expression of eight pre- and post-synaptic GABAergic markers. We quantified the inhibitory modulating cannabinoid receptor (CB1), GABA vesicular transporter (VGAT), GABA synthesizing enzymes (GAD65/GAD67), GABAA receptor anchoring protein (Gephyrin), and GABAA receptor subunits (GABAAα1, GABAAα2, GABAAα3). We found a complex pattern of different developmental trajectories, many of which were prolonged and continued well into the teen, young adult, and even older adult years. These included a monotonic increase or decrease (GABAAα1, GABAAα2), a biphasic increase then decrease (GAD65, Gephyrin), or multiple increases and decreases (VGAT, CB1) across the lifespan. Comparing the balances between the pre- and post-synaptic markers we found three main transition stages (early childhood, early teen years, aging) when there were rapid switches in the composition of the GABAergic signaling system, indicating that functioning of the GABAergic system must change as the visual cortex develops and ages. Furthermore, these results provide key information for translating therapies developed in animal models into effective treatments for amblyopia in humans.
Introduction
Functional maturation of the visual cortex is linked with dynamic changes in synaptic expression of GABAergic signaling mechanisms. Even small changes in the relative amounts of excitation and inhibition can dramatically alter experience-dependent plasticity (Kirkwood and Bear, 1994 ; Hensch et al., 1998 ; Iwai et al., 2003 ). During development, specific components of the GABAergic signaling affect ocular dominance plasticity (Hensch et al., 1998 ; Fagiolini et al., 2004 ; Hensch, 2005 ) and orientation selectivity (Tsumoto and Sato, 1985 ; Fagiolini et al., 2004 ). Furthermore, the emergence of normal binocular visual function depends on interocular inhibition that is mediated by GABAergic inhibitory circuitry in visual cortex (Sengpiel and Vorobyov, 2005 ). In adult visual cortex, activity regulates GABAA receptor expression (Hendry et al., 1994 ) and during aging the loss of orientation tuning in visual cortical receptive fields (Leventhal et al., 2003 ) and changes in visual perception (Betts et al., 2005 ) have been linked with an overall loss of GABA.
When GABAergic signaling in visual cortex is manipulated to shift the excitatory-inhibitory balance, the effect can either enhance or reduce experience-dependent plasticity (Kirkwood and Bear, 1994 ; Iwai et al., 2003 ; Maffei et al., 2004 ; Hensch and Fagiolini, 2005 ). This approach has been extended in a series of recent studies using pharmacological manipulations of GABA signaling, such as fluoxetine, to reinstate ocular dominance plasticity in adult visual cortex and facilitate recovery from amblyopia (Maya Vetencourt et al., 2008 ; Harauzov et al., 2010 ). Taken together, these studies are providing a better understanding for the role of GABAergic signaling in the maturation and function of the visual cortex, and have opened the door for the development of new treatments for neurodevelopmental disorders such as amblyopia.
The GABAergic synapse is a complex structure with a large set of pre- and post-synaptic proteins, many of which have been linked with experience-dependent plasticity in the cortex. On the pre-synaptic side these include: the two isoforms of the GABA synthesizing enzyme glutamic acid decarboxylase (GAD), GAD65 and GAD67; the CB1 receptor that modulates GABA release; and the vesicular transporter VGAT that is responsible for loading GABA into synaptic vesicles (McIntire et al., 1997 ; Sagne et al., 1997 ). GAD65 is localized in the axon terminals and synthesizes the on-demand pool of GABA, while GAD67 is located in the cell body and synthesizes the basal pool of GABA (Feldblum et al., 1993 , 1995 ). Knocking out GAD65 leads to a loss of critical period ocular dominance plasticity, however, it can be rescued by infusion of diazepam (Iwai et al., 2003 ). Activation of CB1 receptors is involved in regulating activity-dependent synaptic plasticity (Sjöström et al., 2003 ; Jiang et al., 2010 ) and blocking CB1 receptors during the critical period alters activity patterns (Bernard et al., 2005 ). Finally, VGAT contributes to an efficient up- and down-regulation of vesicular GABA content that effects post-synaptic currents and the fine-tuning of inhibitory strength (Engel et al., 2001 ).
On the post-synaptic side many components of the ionotropic GABAA receptor complex contribute to experience-dependent plasticity. Gephyrin is the GABAA receptor anchoring protein. Gephyrin clusters GABAA receptors (Essrich et al., 1998 ; Kneussel et al., 1999 ), and it seems to fulfill a modulator role for changes in synaptic activity and structure. Furthermore, expression levels of Gephyrin give an indication of the total amount of GABAA receptors at a given time. The GABAA receptor is a pentameric structure and is functionally diverse, with 20 known subunits. Three subunits are of particular interest, α1, α2, and α3, because they are developmentally regulated (Hendrickson et al., 1994 ; Chen et al., 2001 ; Bosman et al., 2002 ), they affect receptor kinetics (Laurie et al., 1992 ; Gingrich et al., 1995 ), and the α subunit is the interface for binding GABA (Smith and Olsen, 1995 ) and benzodiazepine (Sigel, 2002 ). Both α1 and α2 subunits play key functional roles, with α2 involved in regulating cell firing, and α1 necessary for critical period plasticity (Fagiolini et al., 2004 ). The α1 subunit also has high-affinity for binding GABA and benzodiazepine receptor ligands (Pritchett et al., 1989 ).
Although there have been many animal studies of developmental and aging changes in expression of GABAergic signaling components in visual cortex (e.g., Shaw et al., 1991 ; Hendrickson et al., 1994 ; Hornung and Fritschy, 1996 ; Guo et al., 1997 ; Leventhal et al., 2003 ; Minelli et al., 2003 ), there have been relatively few studies of human visual cortex (Murphy et al., 2005 ). This poses a challenge when considering how to translate GABAergic drug treatments for amblyopia from animal models to human trials. To fill this gap, we have carried out a comprehensive study of changes in the expression of a collection of pre- and post-synaptic GABAergic signaling mechanisms in human visual cortex across the lifespan. Using Western blot analysis we quantified the developmental trajectories for four pre- and four post-synaptic components of GABA signaling. These results show a complex pattern of different developmental trajectories among the GABA signaling mechanisms in human visual cortex. Many of the changes are prolonged, highlighting a long time course for the development of GABA signaling in human visual cortex, much longer than would be predicted from animal studies. Furthermore, there are three transition stages when there are rapid switches in the relative amounts of the different components, indicating that functioning of the GABAergic system must change as the visual cortex develops and ages. A portion of these data has been presented previously (Pinto et al., 2008 ).
Materials and Methods
Samples and Tissue
Tissue samples were obtained from the Brain and Tissue Bank for Developmental Disorders at the University of Maryland (Baltimore, MD, USA). The samples were from the posterior pole of the left hemisphere of human visual cortex, including both superior and inferior portions of the calcarine fissure where the central visual field is represented in primary visual cortex (V1) according to the gyral and sulcal landmarks. The samples were from 28 individuals ranging in age from 20 days to 80 years (Table 1 ). All samples were obtained within 23 h postmortem, and at the Brain and Tissue Bank were fresh frozen after being sectioned coronally in 1-cm intervals, rinsed with water, blotted dry, placed in a quick-freeze bath (dry ice and isopentane), and stored frozen (−70°C). The individuals had no history of neurological or mental health disorders.
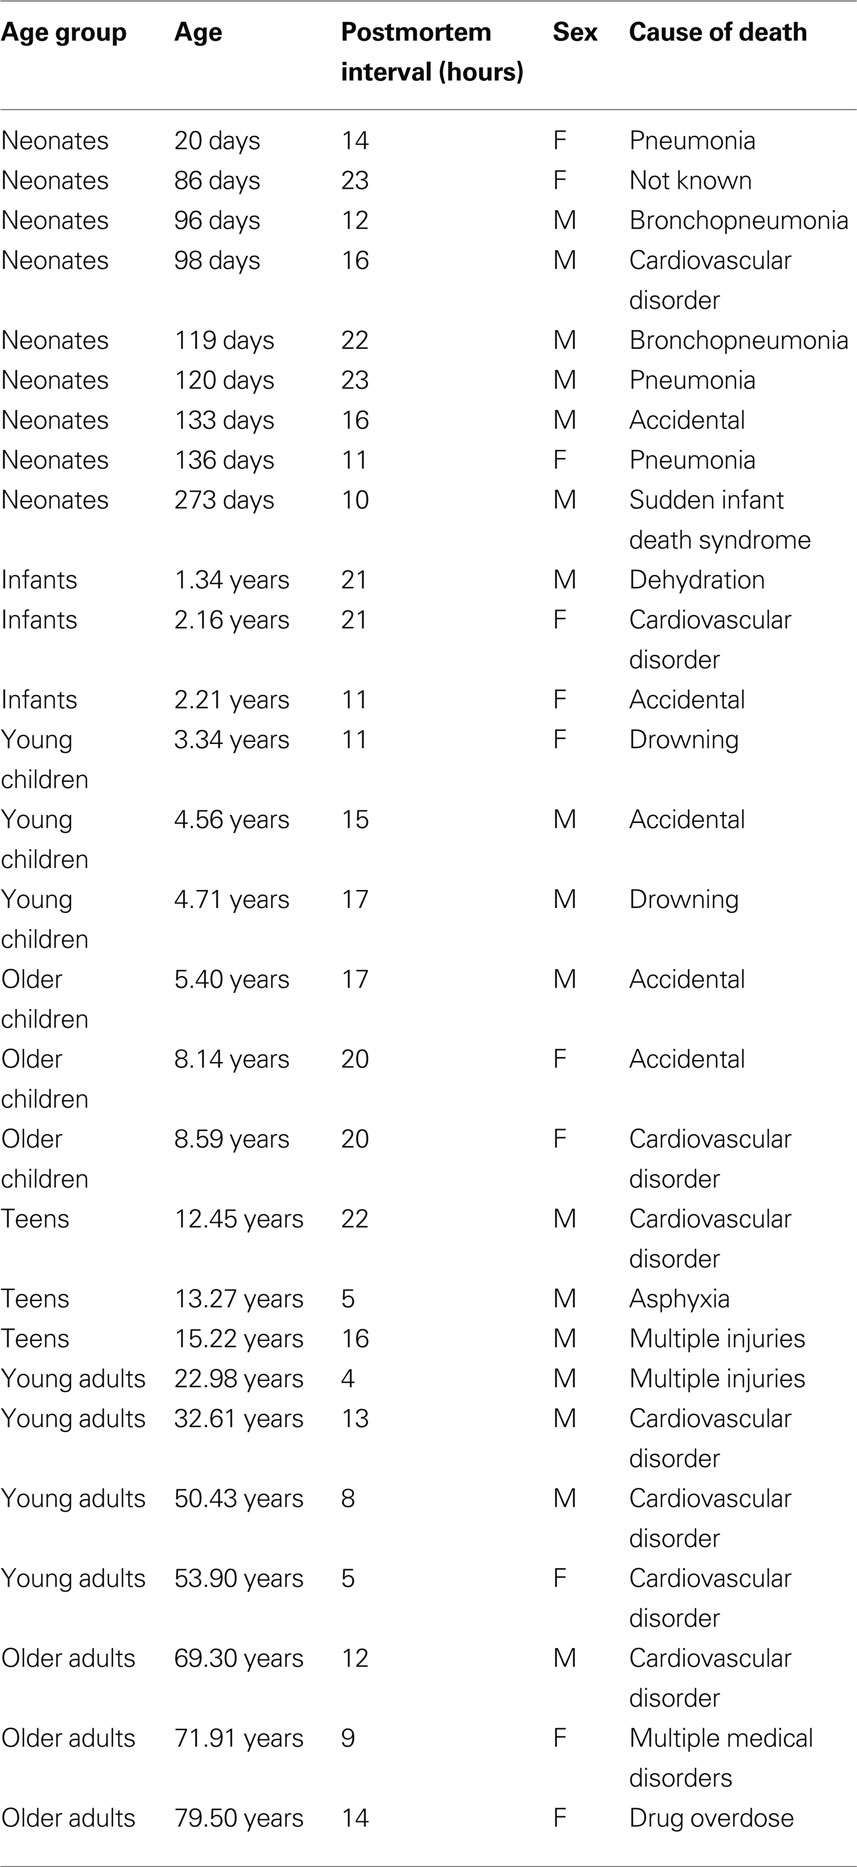
Table 1. Human tissue samples. The age group, age, postmortem interval and cause of death for each of the human cortical tissue samples.
Tissue Sample Preparation
Tissue samples (50–100 mg) were cut from the frozen block of V1 and suspended in cold homogenization buffer (1 ml buffer:50 mg tissue, 0.5 mM DTT, 1 mM EDTA, 2 mM EGTA, 10 mM HEPES, 10 mg/L leupeptin, 100 nM microcystin, 0.1 mM PMSF, 50 mg/L soybean trypsin inhibitor). The tissue samples were homogenized in a glass-glass Dounce homogenizer (Kontes, Vineland, NJ, USA). A subcellular fractionation procedure (synaptoneurosomes) (Hollingsworth et al., 1985 ; Titulaer and Ghijsen, 1997 ; Quinlan et al., 1999 ) was performed to obtain protein samples that were enriched for synaptic proteins. The synaptoneurosome was obtained by passing the homogenized sample through a coarse (100 μm) pore nylon-mesh filter followed by a fine (5 μm) pore hydrophilic mesh filter (Millipore, Bedford, MA, USA), then centrifuged at 1000 × g for 10 min to obtain the synaptic fraction of the membrane. The synaptic pellet was resuspended in boiling 1% sodium-dodecyl-sulfate (SDS) and stored at −80°C. Protein concentrations were determined using the bicinchonic acid (BCA) assay guidelines (Pierce, Rockford, IL, USA). A control sample was made by combining a small amount of the prepared tissue sample from each of the cases.
Immunoblotting
The samples (20 μg) were separated on sodium-dodecyl-sulfate polyacrylamide gels (SDS-PAGE) and transferred to polyvinylidene difluoride (PVDF-FL) membranes (Millipore, Billerica, MA, USA). Each sample was run multiple times. Blots were pre-incubated in blocking buffer [Odyssey Blocking Buffer 1:1 with phosphate buffered saline (PBS)] for 1 h (LI-COR Biosciences; Lincoln, NE, USA), then incubated in primary antibody overnight at 4°C using the following concentrations: GAD65, 1:500 (Chemicon International, Temecula, CA, USA); GAD67, 1:1000 (Chemicon International, Temecula, CA, USA); VGAT, 1:1000 (Synaptic Systems, Göttingen, Germany); CB1, 1:1000 (Cayman, Ann Arbor, MI, USA); Gephyrin, 1:500 (Chemicon International, Temecula, CA, USA); GABAAα1, 1:500 (Imgenex, San Diego, CA, USA); GABAAα2, 1:1000 (Imgenex, San Diego, CA, USA); GABAAα3, 1:1000 (Imgenex, San Diego, CA, USA). The blots were washed with PBS containing 0.05% Tween (PBS-T, Sigma, St. Louis, MO, USA) (3 × 10 min), incubated (1 h, room temperature) with the appropriate IRDye labeled secondary antibody, (Anti-Mouse, 1:8000, Anti-Rabbit, 1:10,000) (LI-COR Biosciences; Lincoln, NE, USA), and washed in PBS-T (3 × 10 min). The blots were visualized using the Odyssey scanner (LI-COR Biosciences; Lincoln, NE). The blots were stripped and prepared to be re-probed with additional antibodies (Blot Restore Membrane Rejuvenation kit, Chemicon International, Temecula, CA, USA).
Analysis
To analyze the bands, we scanned the blots (Odyssey Infrared Scanner) and quantified the bands using densitometry (LI-COR Odyssey Software version 3.0; LI-COR Biosciences; Lincoln, NE, USA). Density profiles were determined by performing a subtraction of the background, integrating the pixel intensity across the area of the band, and dividing the intensity by the width of the band to control for variations in band size. A control sample (a mixture of all the samples) was run on all of the gels and the density of each sample was measured relative to that control (sample density/control density).
To visualize changes in expression of the GABAergic signaling mechanisms, the results were plotted in two ways. This was done to facilitate analysis of changes between developmental stages, to describe the pattern of changes, and to be able to quantify the time course of changes. First, the samples were grouped into developmental ages (<1 year neonates, 1–2 years infants, 3–4 years young children, 5–11 years older children, 12–20 years teens, 21–55 years young adults, and >55 years older adults) with three or more cases in each group and following the age groups used by Law et al. (2003 ) and Duncan et al. (2010 ). Group mean values and standard errors were calculated for each antibody and normalized to the mean level of expression for the youngest group. Second, we plotted scattergrams for each antibody that included both the average expression level (black symbols) for each case and every point from all runs (gray symbols). To help describe the pattern of change in expression across the lifespan, a weighted average curve was fit to each scatter plots using the locally weighted least squares method at 50% (dotted lines). In addition, an exponential decay function (solid lines) was fit to the scattergrams when there was a clear monotonic increase or decrease in the expression across the lifespan. The goodness of fit was determined (R) and the time constant (τ) for the rise or fall of expression level was calculated from the exponential decay function. The age when adult levels were reached was defined as 3τ. This provides an objective measure, representing the age at which expression had reached 87.5% of their asymptotic level.
Four indices were calculated to quantify relative changes in expression levels of the GABAergic signaling components: maturation of receptor composition {GABAAα1:GABAAα2 ([GABAAα1 − GABAAα2]/[GABAAα1 + GABAAα2]); GABAAα1:GABAAα3 ([GABAAα1 − GABAAα3]/[GABAAα1 + GABAAα3]); changes in pre-synaptic production versus trafficking, GAD65:VGAT ([GAD65 − VGAT]/[GAD65 + VGAT]); and changes in pre- versus post-synaptic GABAergic signaling, GAD65:Gephyrin ([GAD65 − Gephyrin]/[GAD65 + Gephyrin])}.
Statistical comparisons of differences in expression levels between the age groups were calculated using Kruskal–Wallis nonparametric analysis of variance and planned pairwise comparisons using a Tukey’s HSD test (p < 0.05).
Results
The tissue samples were collected over a range (4–23 h) of postmortem intervals and the first step was to determine if that interval affected expression of any of the GABAergic proteins. There were no significant correlations (p values >0.1) between postmortem interval and the expression level for any of the antibodies (GAD65, R = 0.26; GAD67, R = 0.08; VGAT, R = 0.20; GABAAα1, R = 0.04; GABAAα2, R = 0.25; GABAAα3, R = 0.17; Gephyrin, R = 0.17; CB1, R = 0.19).
Changes in Pre-Synaptic GABAergic Components
Expression levels of the two GABA synthesizing enzymes (GAD65 and GAD67) were quantified in human V1 across the lifespan. GAD65 is the isoform that localizes in the axon terminals and is responsible for supplying the “on-demand” pool of GABA. GAD67 is the isoform that is predominant in the cell body and supplies the basal pool of GABA (Feldblum et al., 1993 ; Esclapez et al., 1994 ). Expression levels of GAD67 did not change across the lifespan (Figures 1 A,B). In contrast, developmental changes were found for GAD65 expression levels (p < 0.0002; Figures 1 C,D). GAD65 showed a progressive 60% increase in expression levels from early in life (<4 years) to the teenage and adult years (p < 0.05), with a slight decline into older adults (>55 years). The difference in the developmental trajectories of these two enzymes indicates that the basal pool of GABA is maintained across the lifespan, whereas the axonal pool has a time window of heightened production capacity.
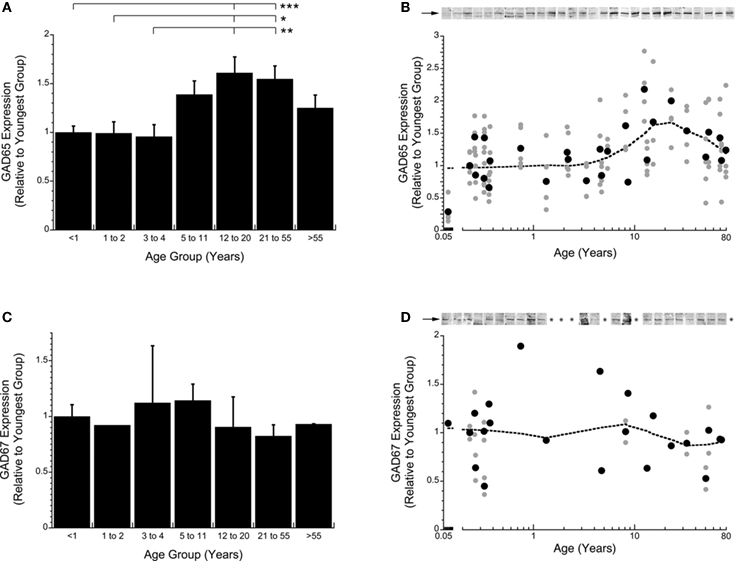
Figure 1. Developmental changes in GAD65 (A,B) and GAD67 (C,D) expression in human visual cortex across the lifespan plotted relative to the youngest age group (<1 year) for the grouped means and scattergrams (● average expression for each case;  all runs). Example blots for each case are presented above the scattergrams (B,D). The arrow indicates the band that was quantified. A weighted average curve was fit to each scatter plots using the locally weighted least squares method at 50% (dotted line). GAD65 showed a significant change across the lifespan (Kruskal–Wallis, p < 0.0001) with progressive increase in expression levels into the teenage and adult years then a loss with aging (A,B). There was no change in expression levels of GAD67 across the lifespan (C,D). The lines above the histograms identify the groups that were significantly different (Tukey’s post hoc HSD, *p < 0.05, **p < 0.02, ***p < 0.001).
To further examine how the pre-synaptic components of the GABAergic system change across the lifespan in human V1, we quantified the expression of two key inhibitory proteins, CB1 and VGAT (Figure 2 ). CB1 is a pre-synaptic receptor involved in modulating GABA release (Hajos and Freund, 2002 ); over the lifespan there were significant changes in the expression of CB1 in human V1 (p < 0.0002). In infants (<1 year) and pre-teens (5–11 years), CB1 expression was high, but in young children (1–2 years), adults (21–55 years), and older adults (>55 years) it was about 40% less (p < 0.05; Figures 2 A,B). The GABA vesicular transporter VGAT showed a similar pattern of expression levels across the lifespan (p < 0.002). VGAT expression was highest in infants (<1 year) and pre-teens (5–11 years), and had about 32% less expression in adults (21–55 years; p < 0.02; Figures 2 C,D).
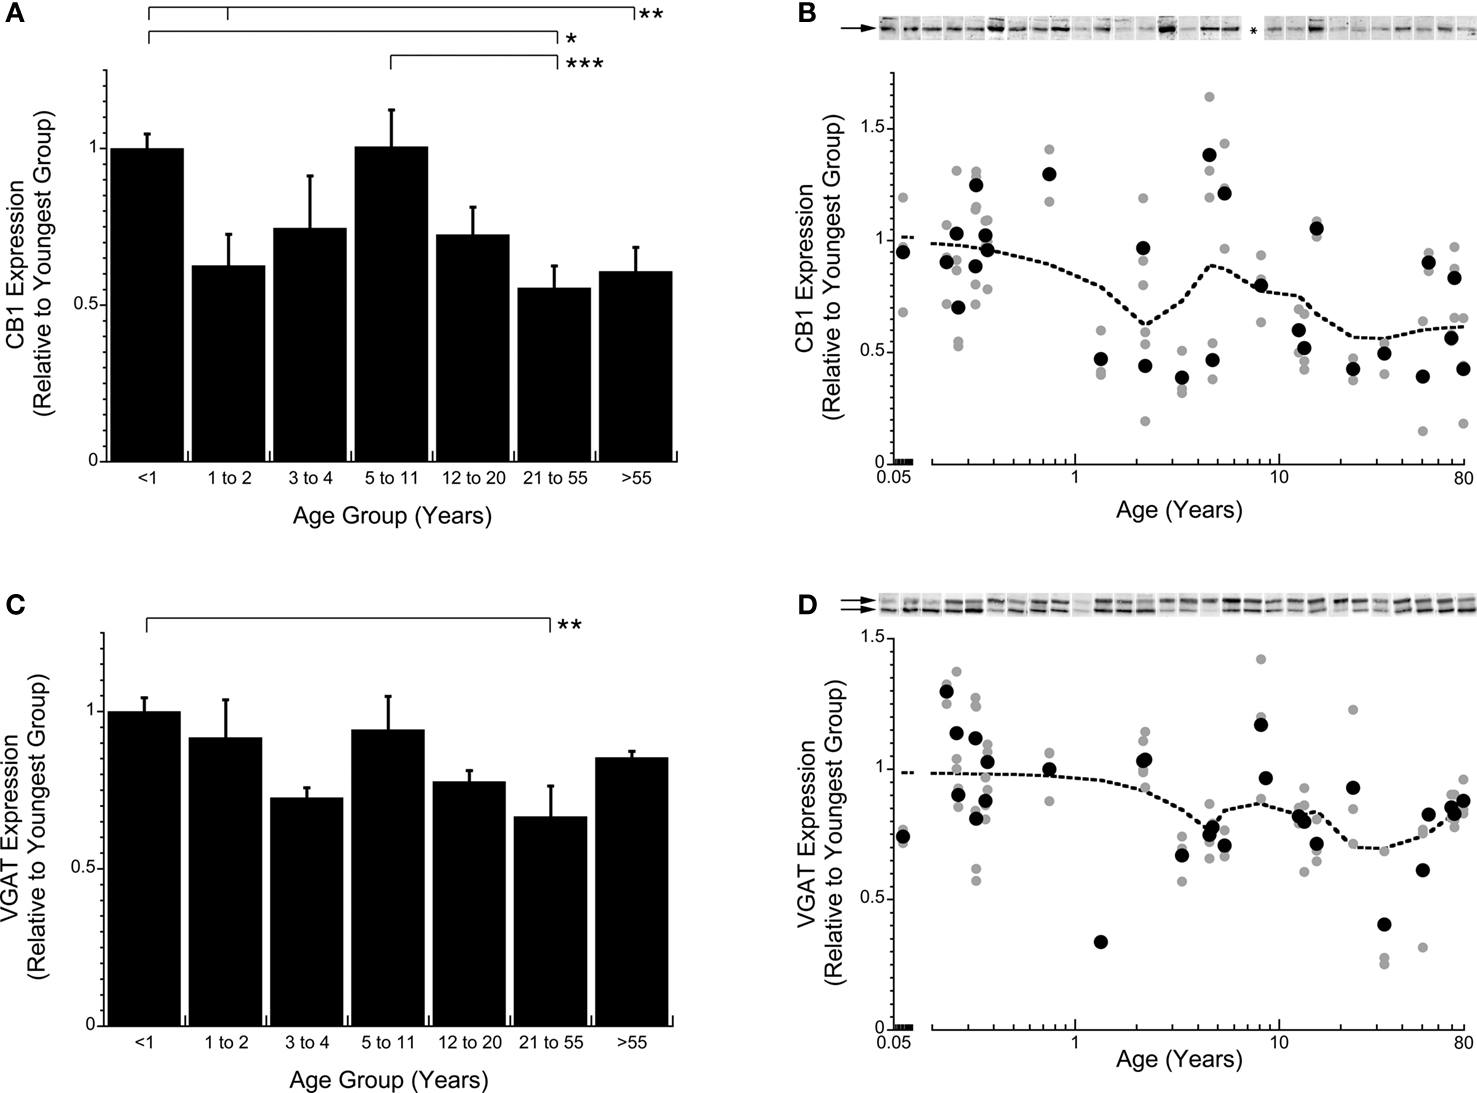
Figure 2. Quantification of changes in expression levels of CB1 (A,B) and VGAT (C,D) in human visual cortex across the lifespan. The graphs follow the same conventions as described in Figure 1
. CB1 levels are high in infants (<1 year) then fall into young children (1–2 years) before rising again in pre-teens (5–11 years) and falling again in teens (12–20 years) and leveling off (Kruskal–Wallis, p < 0.0001) (A,B). For VGAT 2 bands were quantified (arrows at 50 and 57 kDa). VGAT levels are highest in infants (<1 year) then gradually fall into children (3–4 years) before rising again into pre-teens (5–11 years) then falling into adults (21–55 years) before finally rising again in older adults (>55 years) (Kruskal–Wallis, p < 0.005) (C,D). The lines above the histograms identify the groups that were significantly different (Tukey’s post hoc HSD, *p < 0.05, **p < 0.02, ***p < 0.001) (● average expression for each case; all runs; dotted line is the weighted average).
To quantify changes in the balance between the mechanisms that produce and traffic GABA in the pre-synaptic terminal, we calculated an index of GAD65:VGAT expression. There were significant changes in the balance between GAD65:VGAT across the lifespan (p < 0.0005). There was more VGAT expression in both young children (<11 years) and older adults (>55 years; Figure 3 ). In contrast, there was an abrupt switch to much more GAD65 during the teenage (p < 0.02) and young adult years (p < 0.001). These shifts in the balance between GAD65 and VGAT indicate that the rate limiting component regulating GABA transmission changes across the lifespan (Figure 3 ).
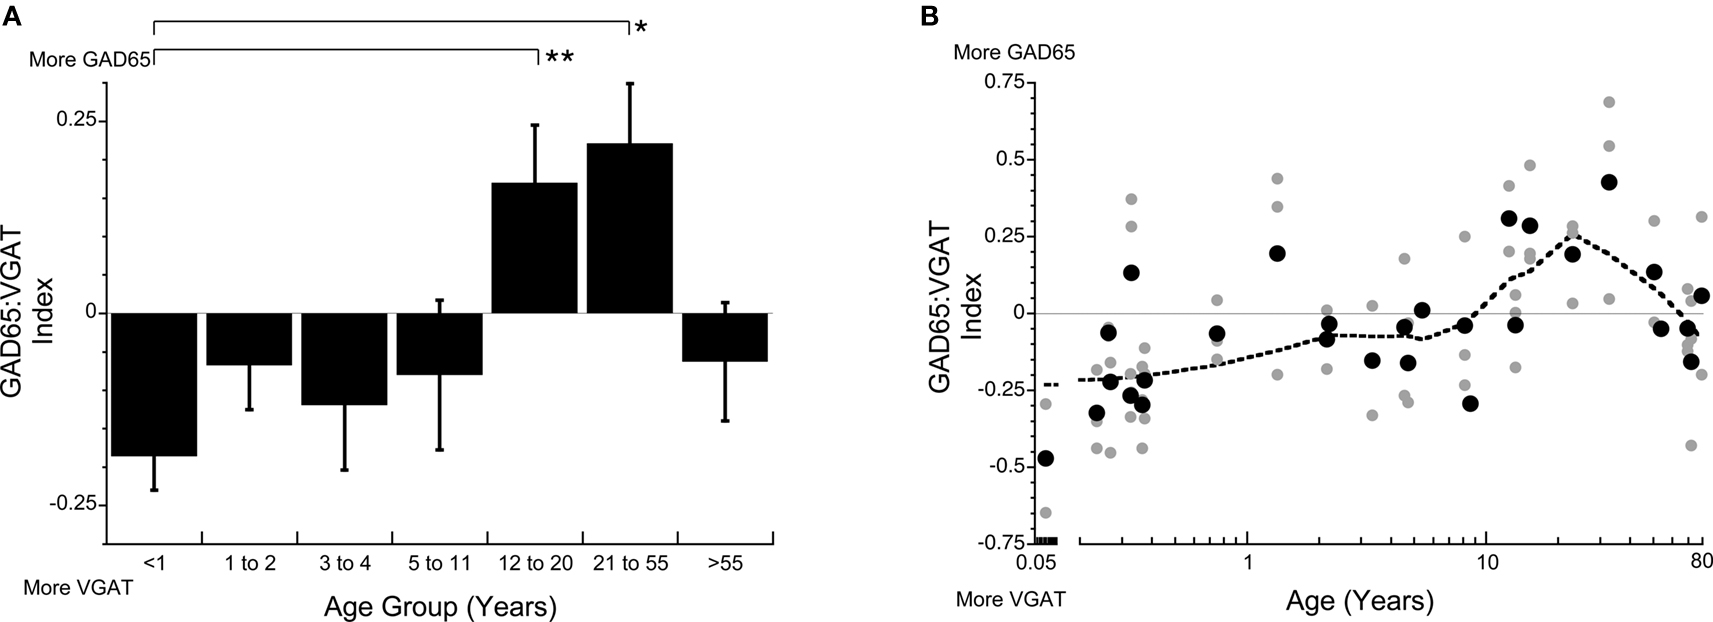
Figure 3. The index of GAD65:VGAT (A,B) gives insight into the relative balance between production and trafficking of GABA. The balance is in favor of VGAT early (<11 years) and late (>55 years) in development, but there is much more GAD65 during the teenage to adult years (12–55 years) (Kruskal–Wallis, p < 0.0002) (A,B). The lines above the histograms identify the groups that were significantly different (Tukey’s post hoc HSD, *p < 0.05, **p < 0.02, ***p < 0.001) (● average expression for each case; all runs; dotted line is the weighted average).
Post-Synaptic Changes in GABAA Receptors
Expression levels for three subunits of the ionotropic GABAA receptor were quantified (GABAAα1, GABAAα2, GABAAα3). Each subunit exhibited a unique developmental trajectory across the lifespan (Figure 4 ). Quantification of GABAAα1 expression in human V1 showed a prolonged development profile, increasing about 75% to reach adult levels at 13.5 years of age (3τ, τ = 4.50 years, R = 0.67; p < 0.0001; Figure 4 B). GABAAα2 expression changed in the opposite direction and had a slightly more rapid developmental profile, decreasing by about 65% to reach adult levels at 10 years of age (3τ, τ = 3.34 years, R = 0.96; p < 0.0001; Figure 4 D). GABAAα3 had no significant change in expression levels across the lifespan (p > 0.36; Figures 4 E,F).
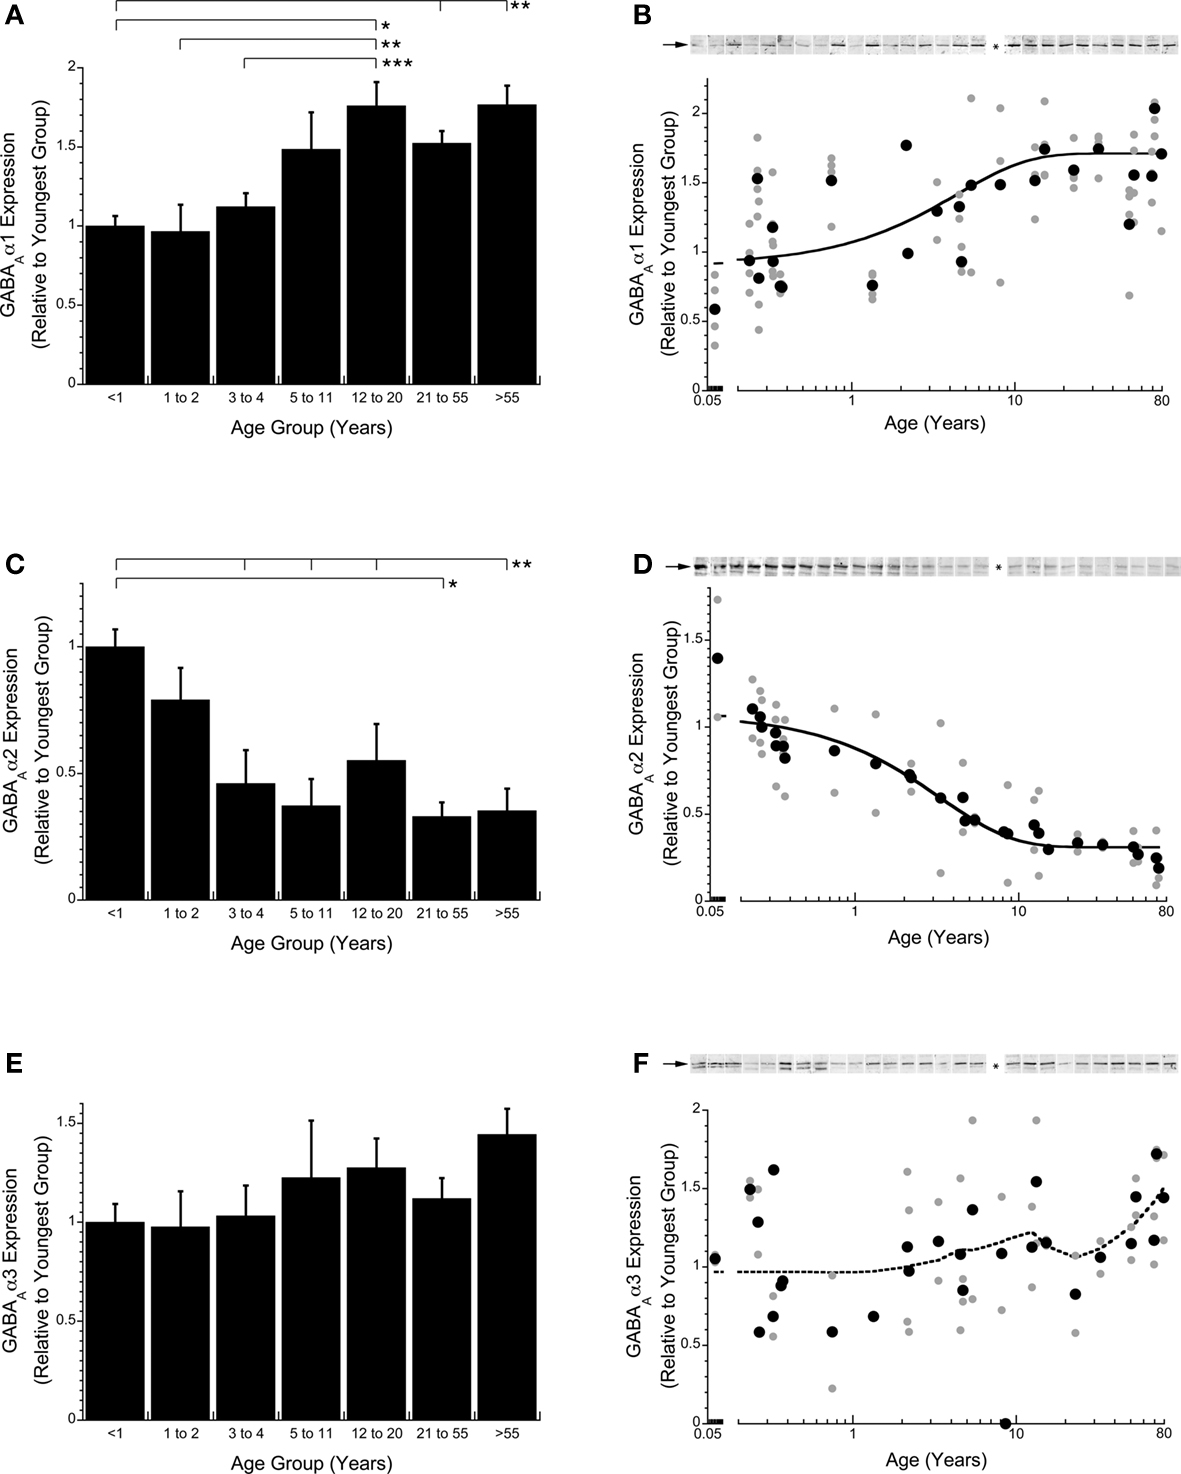
Figure 4. Changes in expression of GABAA receptor subunits GABAAα1 (A,B), GABAAα2 (C,D), and GABAAα3 (E,F) during postnatal development. An exponential decay function (solid line) was fit to the expression levels for GABAAα1 and GABAAα2 and the time constants (τ) were calculated with adult levels defined as 3τ. GABAAα1 expression increased until early teens when it leveled off (3τ = 13.5 years, τ = 4.50 years, R = 0.67; p < 0.0001; B). GABAAα2 expression decreased until older childhood when it leveled off (3τ = 10 years of age, τ = 3.34 years, R = 0.96; p < 0.0001; D). GABAAα3 expression levels did not change significantly throughout the lifespan (E,F) (dotted line is the weighted average). The lines above the histograms identify the groups that were significantly different (Tukey’s post hoc HSD, *p < 0.05, **p < 0.02, ***p < 0.001) (● average expression for each case; all runs).
The three GABAA receptor subunits that we quantified are classified into two categories, immature (GABAAα2, GABAAα3) and mature (GABAAα1), with the mature subunit conferring faster receptor decay times and great affinity for GABA compared with the immature subunits. To determine the magnitude and time course of receptor maturation we calculated two indices (GABAAα1:GABAAα2, GABAAα1:GABAAα3). The GABAAα1:GABAAα2 balance was initially in favor of GABAAα2, then progressively shifted toward more GABAAα1 (Figure 5 ). We fit a tau (τ) function to the index to quantify the time course of the switch in receptor composition. The mature balance was reached at 4.5 years of age (3τ, τ = 1.50 years, R = 0.84; p < 0.0001; Figure 5 B). The GABAAα1:GABAAα3 switch was smaller in magnitude and much more abrupt. There was initially more GABAAα3, but that switched within the first year to slightly more GABAAα1, and reached mature levels at about 8 months of age (3τ, τ = 0.23 years, R = 0.65; p < 0.0001; Figure 5 D). Both indices showed a shift to more GABAAα1, however, there was a greater change for the shift from more GABAAα2 to more GABAAα1.
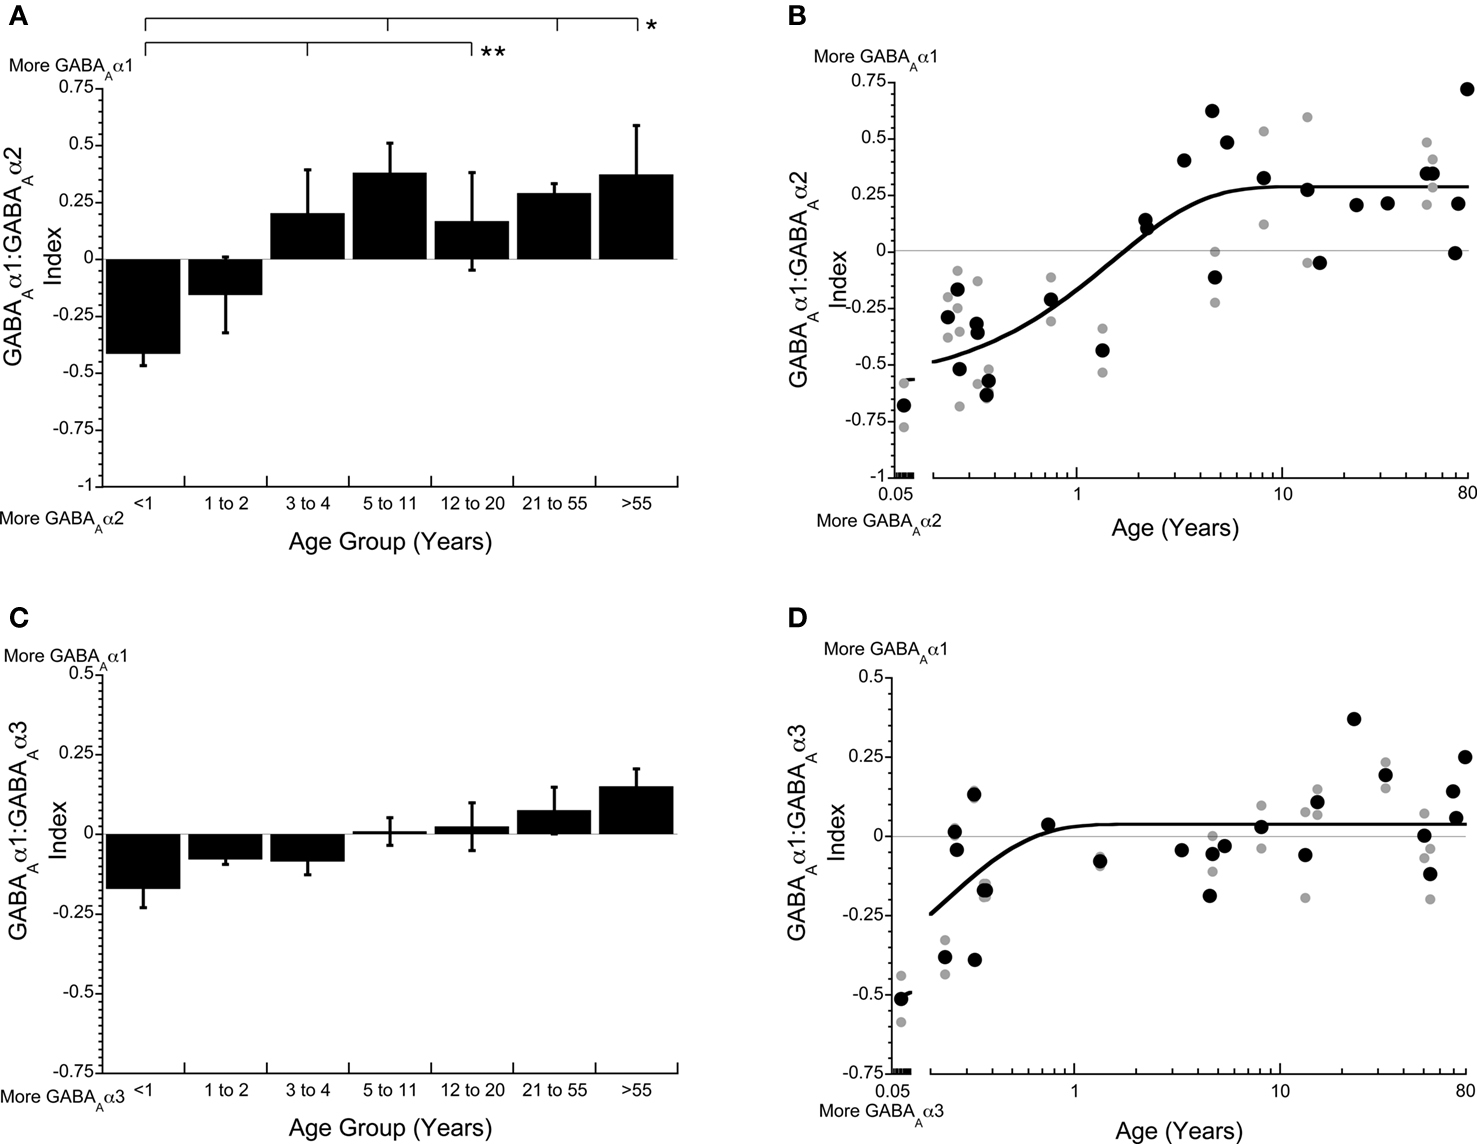
Figure 5. The indices of GABAAα1:GABAAα2 (A,B) and GABAAα1:GABAAα3 (C,D) are important for determining the kinetics and maturation of the GABAA receptor. The GABAAα1:GABAAα2 index starts in favor of GABAAα2, then shifts to more GABAAα1 in children (3–4 years), reaching the adult balance in younger childhood (3τ = 4.5 years of age, τ = 1.50 years, R = 0.84; p < 0.0001; B). The GABAAα1: GABAAα3 index starts out with more GABAAα3 very early, then quickly shifts to slightly more GABAAα1, reaching adult levels within the first year (3τ = 0.69 years of age, τ = 0.23 years, R = 0.65; p < 0.0001; D). The lines above the histograms identify the groups that were significantly different (Tukey’s post hoc HSD, *p < 0.05, **p < 0.02, ***p < 0.001) (● average expression for each case; all runs; solid lines are exponential decay functions).
To examine the overall levels of GABAA receptors in human V1, we quantified the expression of Gephyrin across the lifespan. Gephyrin is the GABAA receptor anchoring protein and these expression levels provide an indication of total GABAA receptor expression. There were significant changes in Gephyrin expression across the lifespan (p < 0.002). Early in development (<1 year) and for older adults (>55 years), the expression levels for Gephyrin were low. In contrast, during the rest of the lifespan, Gephyrin expression was significantly higher (∼120% increase) and had a peak in expression during childhood (5–11 years; p < 0.05; Figure 6 A).
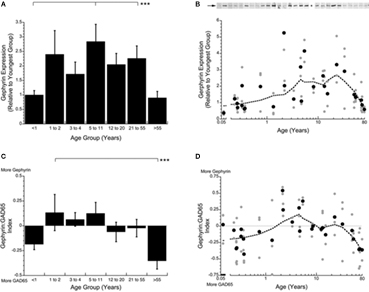
Figure 6. Changes in expression of Gephyrin (A,B) and the index of Gephyrin:GAD65 (C,D) during postnatal development. Expression levels of Gephyrin are lowest in infants (<1 year) and older adults (<55 years) and higher for the rest of the lifespan (Kruskal–Wallis, p < 0.005) (A). The Gephyrin:GAD65 index shows a shift from more GAD65 in infants (<1 year) to more Gephyrin in children (1–11 years) to a balance from the teenage to adult years (12–55) then a switch to much more GAD65 in aging (>55 years) (Kruskal–Wallis, p < 0.008) (C). The lines above the histograms identify the groups that were significantly different (Tukey’s post hoc HSD, *p < 0.05, **p < 0.02, ***p < 0.001) (● average expression for each case; all runs; dotted line is the weighted average).
Pre- Versus Post-Synaptic Development
To determine the relative contribution of pre- versus post-synaptic components of GABAergic signaling across the lifespan, we calculated a index of Gephyrin:GAD65 expression (Figure 6 ). In young infants (<1 year) this pre- versus post-synaptic balance was in favor of more GAD65, the pre-synaptic side (p < 0.01). This switched to more Gephyrin during childhood (1–11 years of age), then a balance during the teenage and adult years, followed by an abrupt switch to relatively more GAD65 in older adults (p < 0.05; Figures 6 C,D). These changes represent a shift in GABAergic signaling mechanisms from more pre-synaptic, to more post-synaptic, to a balance, to substantially more pre-synaptic. This index captures an important aspect of the changing nature of the pre- and post-synaptic GABAergic signaling mechanisms in human V1 across the lifespan. There is not a single balance that is maintained across the lifespan.
Discussion
Our study is the first to characterize changes in pre- and post-synaptic components of the GABAergic signaling system across the lifespan in human primary visual cortex. We found a complex pattern of different developmental trajectories among these GABAergic signaling mechanisms. Many of the changes were prolonged and continued well into the teen, young adult, and even older adult years. For example, the peak of GAD65 expression was not reached until the teen to young adult years before falling off in aging. Thus, the potential to produce the on-demand pool of GABA, which enables repeated waves of phasic inhibition and experience-dependent plasticity, must have a very long developmental time course in human visual cortex. Changes in expression of GABAAα1 and GABAAα2 subunits were also prolonged and increased or decreased, respectively, into the teenage years. Comparing the balance between these subunits, however, showed that the switch from relatively more GABAAα2 to more GABAAα1 occurred during childhood. This switch is important for understanding changes in GABAergic signaling, since it is the relative balance of the GABAA subunits that influences the shift to more phasic inhibition (Prenosil et al., 2006 ). The current results extend our previous study that focused on synaptic changes during the first 5 years of life (Murphy et al., 2005 ). In addition, we found a number of changes in GABAergic signaling during aging. Gephyrin and GAD65 declined into aging, highlighting that there are both pre- and post-synaptic losses of GABAergic signaling in the aging visual cortex. The changes across the life span in expression of these components of GABA signaling undoubtedly affects experience-dependent plasticity (Hensch, 2005 ), development and tuning of cortical receptive fields (Leventhal et al., 2003 ; Fagiolini et al., 2004 ), and visual perception (Betts et al., 2005 ; Edden et al., 2009 ).
There is a heterogenous array of GABAergic neurons and circuits in primate visual cortex (Jones, 1993 ). The diversity of anatomical and physiological characteristics points to 14–19 different types of GABAergic neurons in the cortex (Gupta et al., 2000 ). They are spread across all layers of the cortex and in primate visual cortex the largest concentration is in layers II–III and IVa (Beaulieu et al., 1992 ). The GABAA receptor is also very diverse. This pentameric receptor has at least 20 different subunits, including α, β, γ, σ, ε, θ, and π, that combine to make a very wide range of different GABAA receptors (Sieghart, 1995 ; Cherubini and Conti, 2001 ; Rudolph et al., 2001 ). GABAergic interneurons make connections onto specific compartments of cortical pyramidal neurons. Synapses containing α-subunits are differentially distributed across pyramidal neurons with all types of α-subunits found at synapses on dendrites, α1 and α2 are also found on the soma, and only α2 is on the axon initial segment. This diversity of morphologies, receptor compositions, and connectivity patterns confers a wide range of specific functions to the different GABAergic circuits (Hensch, 2005 ). This heterogeneity poses a challenge for understanding the organization and function of GABAergic signaling.
The diversity in the GABAergic system introduces a number of sources of variability. We found substantial inter-individual variability for expression of the GABAergic proteins in human visual cortex and this probably reflects the heterogeneous nature of the GABAergic system. In addition, we also found substantial variability when measuring the expression levels of the GABAergic proteins from individuals. This measurement variability likely arises because the GABAergic system represents a smaller fraction of the total number of neurons and synapses in visual cortex compared to the excitatory system. This smaller sample size will contribute to increased measurement variability when quantifying GABAergic expression. For example, GABAergic signaling in primate visual cortex comprises about 20% of the total number of neurons (Beaulieu et al., 1992 ; Jones, 1993 ), and an even smaller portion (17%) of the total number of synapses (Beaulieu et al., 1992 ). Based on the difference in proportion of excitatory versus inhibitory synapses, statistics predicts that there should be about 4.8 times more measurement variability when quantifying expression of GABAergic synaptic proteins. This is very close to the larger measurement variability that we have found when quantifying the expression of inhibitory (gephyrin) versus excitatory (PSD-95) anchoring proteins in rat cortex (Pinto and Murphy, unpublished results). Additional variability in higher mammals will arise from inter-individual differences in the number of inhibitory synapses (Beaulieu and Colonnier, 1985 ), and the relatively smaller number of inhibitory synapses per neuron in primates compared with rats (Beaulieu et al., 1992 ). Taken together, the diversity and smaller proportion of GABAergic synapses predicts that there must be substantial variability when measuring expression of GABAergic synaptic proteins. Furthermore, previous studies suggest that there is greater synaptic specialization in non-human primates (Beaulieu et al., 1992 ) raising the possibility of even greater diversity in human cortex. In spite of these inherent sources of variability, our large data set makes it clear that there are significant changes in GABAergic expression in human visual cortex across the lifespan.
Monyer and Markram (2004) aptly describe studying GABAergic interneurons as a daunting task because of the diverse nature of this system. They also point out that combinatorial approaches are helping to clarify the diversity of GABAergic interneurons. In our study, we used a large number of samples from human visual cortex covering the lifespan to quantify the expression and developmental trajectories of eight components of the GABAergic system. The number of proteins quantified allowed us to capture a unique perspective on both pre- and post-synaptic development that would be missed by studying a smaller set of synaptic proteins. Furthermore, by quantifying the expression of GABAergic proteins in a preparation enriched for synaptic proteins (Hollingsworth et al., 1985 ; Titulaer and Ghijsen, 1997 ; Quinlan et al., 1999 ), we are able to tie the current findings closer to functional changes at the synapse. This is especially important for changes that affect experience-dependent plasticity (Quinlan et al., 1999 ). This contrasts with other approaches, such as measuring mRNA expression of GABAergic components (e.g., Duncan et al., 2010 ), because it is hard to make the link between mRNA expression and the level of protein expression at the synapse. Finally, the developmental trajectories that we describe reflect the average across the whole group of samples and this type of cross sectional design cannot address how the levels of these GABAergic markers change in an individual. The higher level of variability in expression that we found for older children through young adults suggests that the timing of rapid changes may vary across individuals.
The immunoblotting technique used for the current study does not allow for an analysis of developmental changes in the variety of different morphological types of GABAergic interneurons, specific intracortical inhibitory circuits, or locations of receptor subunits on different compartments of the post-synaptic neuron. It will be important for future studies to extend this work to include anatomical methods that describe and quantify laminar and morphological changes in GABAergic neurons, as well as tracing the specific locations of GABAergic synapses in cortical circuits. These will be challenging studies because of the difficulty obtaining postmortem tissue that is both appropriate for anatomical investigations and covers a wide range of ages. Despite these obstacles they should be a priority, especially since site-specific optimization of GABA synapses may trigger experience-dependent plasticity in visual cortex (Katagiri et al., 2007 ).
Transitional Stages in GABAergic Signaling
The pattern of changes in expression of the GABAergic signaling mechanisms was complex and there was not one or two key components driving these changes. Instead, each pre- and post-synaptic mechanisms followed different developmental trajectory that combine to create a complex pattern of overall changes. The expression patterns for individual proteins can be characterized as either no change (GAD67, GABAAα3), a monotonic increase or decrease (GABAAα1, GABAAα2), a biphasic increase then decrease (GAD65, Gephyrin), or multiple increases and decreases (VGAT, CB1) across the lifespan. These different developmental trajectories may be linked to functional changes and the different roles that these synaptic proteins play in GABAergic signaling. For example, the multiple increases and decreases found for CB1 may reflect the multiple roles that it has in synaptic development, plasticity, and regulating GABA release (Hajos and Freund, 2002 ). By calculating a series of indices to quantify the balance between the various pre- and post-synaptic GABAergic mechanisms, we found three transitional stages during early development, teen years, or aging when there were large switches in the relative amounts of the components of the GABAergic signaling system. The three distinct transitional stages in GABAergic signaling reflect important times during the lifespan when there must be significant changes in the function of GABAergic inhibition. Interestingly, these transition stages line up with time points when visual functions are changing and when the visual system is sensitive to experience-dependent change (Faubert, 2002 ; Lewis and Maurer, 2005 ; Maurer et al., 2007a ,b ).
The first stage reflects an early developmental transition between neonates/infants (<2 years) and young children (3–5 years) when there was a switch in composition of the GABAA receptor. The relative expression switched from more of the immature subunits (GABAAα2 and GABAAα3) to more of the mature (GABAAα1) subunit. The GABAAα1 subunit has a special role in development of the visual cortex driving experience-dependent plasticity whereas GABAAα2 modulates neuronal firing (Fagiolini et al., 2004 ). The kinetics of the GABAA receptor speed up threefold when the GABAAα1 subunit dominates (Gingrich et al., 1995 ) and gamma bursts depend on circuits dominated by GABAAα1 (Cardin et al., 2009 ; Sohal et al., 2009 ). Furthermore, the switch has pharmacological implications as the α2 subunit exhibits the anxiolytic effects of benzodiazepines, whereas α1, α3, and α5 mediate the sedative and amnesic effects (Rudolph et al., 1999 ; Löw et al., 2000 ). This developmental switch in GABAA receptor subunits also occurs in rats (Bosman et al., 2002 ), cats (Chen et al., 2001 ), and macaque monkeys (Hendrickson et al., 1994 ). For these species, however, the switch is correlated with different aspects of the critical period. In rats, the switch occurs before the start of the critical period (Heinen et al., 2004 ), but in cats and macaque monkeys the switch overlaps the critical period for ocular dominance plasticity (Hendrickson et al., 1994 ; Chen et al., 2001 ). The current results show that in human V1 this transitional switch in expression of GABAA receptor subunits spans the critical period, when disrupting vision can cause long lasting changing in visual acuity (Lewis and Maurer, 2005 ). Perhaps this first stage defines the period of ocular dominance plasticity in human V1.
In the second stage, the teenage transition was a switch from a greater capacity for trafficking GABA (more VGAT) to a greater capacity to produce the on-demand pool of GABA (more GAD65). In addition, there was a high level of GABAAα1 expression during this stage. These suggest that in teens and young adults the pool of on-demand GABA can be readily replenished and binds with α1 containing receptors to maintain a high level of phasic inhibition. Perhaps this combination is needed for optimal coding of neural signals, especially during periods of sustained neural activity. Optimal orientation tuning of receptive fields (Leventhal et al., 2003 ) and perceptual performance on orientation discrimination (Edden et al., 2009 ) depend on the level of GABA concentration. It seems likely that the high levels of GAD65 and GABAAα1 at this stage are contributing to optimal visual performance on tasks such as orientation discrimination.
In the third stage, during the transition to older adults, there were two switches in the balance between components of the GABAergic signaling system: from greater capacity to produce GABA (more GAD65) to greater capacity to traffic GABA to the synapse (more VGAT); and from relatively more post-synaptic (more Gephyrin) to more pre-synaptic (more GAD65) expression. Both of these changes were large switches from those found for young adults and point to significant changes in functioning of GABAergic synapses in the aging visual cortex. Furthermore, the time course of the GABAergic changes in aging is similar to the decline of visual abilities. The changes could contribute to the loss of orientation tuning (Leventhal et al., 2003 ) and processing of complex visual stimuli that are particularly vulnerable during aging (Habak and Faubert, 2000 ; Faubert, 2002 ). For example, the perception of a moving stimulus in the context of a moving surround is particularly affected in aging (Betts et al., 2005 ) and a loss of GABA inhibition has been suggested as the mechanism underlying this perceptual loss. It seems likely that the changes in the balance of GABAergic components at aging synapses contribute to the visual losses that accompany aging.
Links with Experience-Dependent Plasticity
Previous studies have shown that a specific excitatory-inhibitory balance and expression of the GABAAα1 subunit are required for ocular dominance plasticity in the developing rodent visual cortex (Hensch et al., 1998 ; Fagiolini et al., 2004 ). Furthermore, inhibition is abnormal in visual cortex of monocularly deprived (Burchfiel and Duffy, 1981 ) and strabismic cats (Singer et al., 1980 ). Our findings suggest that the period of ocular dominance plasticity in the human visual cortex is prolonged. If ocular dominance plasticity follows the development of GABAAα1 then it would extend through childhood into teenage and possibly even to young adult years. This idea is consistent with the prolonged period of visual changes found in children with cataracts (Lewis and Maurer, 2005 ; Maurer et al., 2007a ,b ). Importantly, the current findings indicate that primary visual cortex continues to have the necessary balance of GABAergic signaling mechanisms to mediate experience-dependent plasticity well into the teenage years. In addition, because the development of GAD65 expression may extend into the young adult years it is possible that this affects plasticity in primary visual cortex and contributes to visual recovery promoted by perceptual learning treatment in adults with amblyopia (Levi and Li, 2009 ). Finally, the losses in aging may contribute to reduced synaptic plasticity and may be part of a more generalized change in the balance of synaptic proteins (Williams et al., 2010 ) in the aging cortex that could underlie age-related perceptual and cognitive declines.
The prolonged window of GABA changes in human visual cortex provides an opportunity to translate experimental treatments that target GABAergic signaling in the visual system into therapeutics that may even be useful in treating amblyopia in young adults. For example, new studies have shown that fluoxetine can reinstate ocular dominance plasticity in the adult cortex by reducing intracortical inhibition (Maya Vetencourt et al., 2008 ; Harauzov et al., 2010 ). The current study provides the necessary information about GABAergic signaling in human cortex to begin the process of translating the exciting therapies being developed in animal models into effective treatments for amblyopia in humans.
Conflict of Interest Statement
The authors declare that the research was conducted in the absence of any commercial or financial relationships that could be construed as a potential conflict of interest.
Acknowledgments
This research was supported by grants from NSERC and CIHR to Kathryn M. Murphy and David G. Jones. Joshua G.A. Pinto is the recipient of an OGSST PhD award.
References
Beaulieu, C., and Colonnier, M. (1985). A laminar analysis of the number of round-asymmetrical and flat-symmetrical synapses on spines, dendritic trunks, and cell bodies in area 17 of the cat. J. Comp. Neurol. 231, 180–189.
Beaulieu, C., Kisvarday, Z., Somogyi, P., Cynader, M., and Cowey, A. (1992). Quantitative distribution of GABA-immunopositive and -immunonegative neurons and synapses in the monkey striate cortex (area 17). Cereb. Cortex 2, 295–309.
Bernard, C., Milh, M., Morozov, Y. M., Ben-Ari, Y., Freund, T. F., and Gozlan, H. (2005). Altering cannabinoid signaling during development disrupts neuronal activity. Proc. Natl. Acad. Sci. U.S.A. 102, 9388–9393.
Betts, L. R., Taylor, C. P., Sekuler, A. B., and Bennett, P. J. (2005). Aging reduces center-surround antagonism in visual motion processing. Neuron 45, 361–366.
Bosman, L. W., Rosahl, T. W., and Brussaard, A. B. (2002). Neonatal development of the rat visual cortex: synaptic function of GABAA receptor alpha subunits. J. Physiol. 545(Pt 1), 169–181.
Burchfiel, J. L., and Duffy, F. H. (1981). Role of intracortical inhibition in deprivation amblyopia: reversal by microiontophoretic bicuculline. Brain Res. 206, 479–484.
Cardin, J. A., Carlen, M., Meletis, K., Knoblich, U., Zhang, F., Deisseroth, K., Tsai, L. H., and Moore, C. I. (2009). Driving fast-spiking cells induces gamma rhythm and controls sensory responses. Nature 459, 663–667.
Chen, L., Yang, C., and Mower, G. D. (2001). Developmental changes in the expression of GABA(A) receptor subunits (alpha(1), alpha(2), alpha(3)) in the cat visual cortex and the effects of dark rearing. Brain Res. Mol. Brain Res. 88, 135–143.
Cherubini, E., and Conti, F. (2001). Generating diversity at GABAergic synapses. Trends Neurosci. 24, 155–162.
Duncan, C. E., Webster, M. J., Rothmond, D. A., Bahn, S., Elashoff, M., and Weickert, C. S. (2010). Prefrontal GABA(A) receptor alpha-subunit expression in normal postnatal human development and schizophrenia. J. Psychiatr. Res. [Epub ahead of print].
Edden, R. A., Muthukumaraswamy, S. D., Freeman, T. C., and Singh, K. D. (2009). Orientation discrimination performance is predicted by GABA concentration and gamma oscillation frequency in human primary visual cortex. J. Neurosci. 29, 15721–15726.
Engel, D., Pahner, I., Schulze, K., Frahm, C., Jarry, H., Ahnert-Hilger, G., and Draguhn, A. (2001). Plasticity of rat central inhibitory synapses through GABA metabolism. J. Physiol. 535(Pt 2), 473–482.
Esclapez, M., Tillakaratne, N. J., Kaufman, D. L., Tobin, A. J., and Houser, C. R. (1994). Comparative localization of two forms of glutamic acid decarboxylase and their mRNAs in rat brain supports the concept of functional differences between the forms. J. Neurosci. 14(Pt 2), 1834–1855.
Essrich, C., Lorez, M., Benson, J. A., Fritschy, J. M., and Luscher, B. (1998). Postsynaptic clustering of major GABAA receptor subtypes requires the gamma 2 subunit and gephyrin. Nat. Neurosci. 1, 563–571.
Fagiolini, M., Fritschy, J. M., Low, K., Mohler, H., Rudolph, U., and Hensch, T. K. (2004). Specific GABAA circuits for visual cortical plasticity. Science 303, 1681–1683.
Feldblum, S., Dumoulin, A., Anoal, M., Sandillon, F., and Privat, A. (1995). Comparative distribution of GAD65 and GAD67 mRNAs and proteins in the rat spinal cord supports a differential regulation of these two glutamate decarboxylases in vivo. J. Neurosci. Res. 42, 742–757.
Feldblum, S., Erlander, M. G., and Tobin, A. J. (1993). Different distributions of GAD65 and GAD67 mRNAs suggest that the two glutamate decarboxylases play distinctive functional roles. J. Neurosci. Res. 34, 689–706.
Gingrich, K. J., Roberts, W. A., and Kass, R. S. (1995). Dependence of the GABAA receptor gating kinetics on the alpha-subunit isoform: implications for structure-function relations and synaptic transmission. J. Physiol. 489(Pt 2), 529–543.
Guo, Y., Kaplan, I. V., Cooper, N. G., and Mower, G. D. (1997). Expression of two forms of glutamic acid decarboxylase (GAD67 and GAD65) during postnatal development of the cat visual cortex. Brain Res. Dev. Brain Res. 103, 127–141.
Gupta, A., Wang, Y., and Markram, H. (2000). Organizing principles for a diversity of GABAergic interneurons and synapses in the neocortex. Science 287, 273–278.
Habak, C., and Faubert, J. (2000). Larger effect of aging on the perception of higher-order stimuli. Vision Res. 40, 943–950.
Hajos, N., and Freund, T. F. (2002). Distinct cannabinoid sensitive receptors regulate hippocampal excitation and inhibition. Chem. Phys. Lipids 121, 73–82.
Harauzov, A., Spolidoro, M., DiCristo, G., De Pasquale, R., Cancedda, L., Pizzorusso, T., Viegi, A., Berardi, N., and Maffei, L. (2010). Reducing intracortical inhibition in the adult visual cortex promotes ocular dominance plasticity. J. Neurosci. 30, 361–371.
Heinen, K., Bosman, L. W., Spijker, S., van Pelt, J., Smit, A. B., Voorn, P., Baker, R. E., and Brussaard, A. B. (2004). GABAA receptor maturation in relation to eye opening in the rat visual cortex. Neuroscience 124, 161–171.
Hendrickson, A., March, D., Richards, G., Erickson, A., and Shaw, C. (1994). Coincidental appearance of the alpha 1 subunit of the GABA-A receptor and the type I benzodiazepine receptor near birth in macaque monkey visual cortex. Int. J. Dev. Neurosci. 12, 299–314.
Hendry, S. H., Huntsman, M. M., Viñuela, A., Möhler, H., de Blas, A. L., and Jones, E. G. (1994). GABAA receptor subunit immunoreactivity in primate visual cortex: distribution in macaques and humans and regulation by visual input in adulthood. J. Neurosci. 14, 2383–2401.
Hensch, T. K. (2005). Critical period mechanisms in developing visual cortex. Curr. Top. Dev. Biol. 69, 215–237.
Hensch, T. K., and Fagiolini, M. (2005). Excitatory-inhibitory balance and critical period plasticity in developing visual cortex. Prog. Brain Res. 147, 115–124.
Hensch, T. K., Fagiolini, M., Mataga, N., Stryker, M. P., Baekkeskov, S., and Kash, S. F. (1998). Local GABA circuit control of experience-dependent plasticity in developing visual cortex. Science 282, 1504–1508.
Hollingsworth, E. B., McNeal, E. T., Burton, J. L., Williams, R. J., Daly, J. W., and Creveling, C. R. (1985). Biochemical characterization of a filtered synaptoneurosome preparation from guinea pig cerebral cortex: cyclic adenosine 3′:5′-monophosphate-generating systems, receptors, and enzymes. J. Neurosci. 5, 2240–2253.
Hornung, J. P., and Fritschy, J. M. (1996). Developmental profile of GABAA-receptors in the marmoset monkey: expression of distinct subtypes in pre- and postnatal brain. J. Comp. Neurol. 367, 413–430.
Iwai, Y., Fagiolini, M., Obata, K., and Hensch, T. K. (2003). Rapid critical period induction by tonic inhibition in visual cortex. J. Neurosci. 23, 6695–6702.
Jiang, B., Huang, S., de Pasquale, R., Millman, D., Song, L., Lee, H., Tsumoto, T., and Kirkwood, A. (2010). The maturation of GABAergic transmission in the visual cortex requires endocannabinoid-mediated LTD of inhibitory inputs during a critical period. Neuron 66, 248–259.
Jones, E. G. (1993). GABAergic neurons and their role in cortical plasticity in primates. Cereb. Cortex 3, 361–372.
Katagiri, H., Fagiolini, M., and Hensch, T. K. (2007). Optimization of somatic inhibition at critical period onset in mouse visual cortex. Neuron 53, 805–812.
Kirkwood, A., and Bear, M. F. (1994). Hebbian synapses in visual cortex. J. Neurosci. 14(Pt 2), 1634–1645.
Kneussel, M., Brandstatter, J. H., Laube, B., Stahl, S., Muller, U., and Betz, H. (1999). Loss of postsynaptic GABA(A) receptor clustering in gephyrin-deficient mice. J. Neurosci. 19, 9289–9297.
Laurie D. J., Wisden W., and Seeburg P. H. (1992). The distribution of thirteen GABAA receptor subunit mRNAs in the rat brain. III. Embryonic, and postnatal development. J. Neurosci. 12, 4151–4172.
Law, A. J., Weickert, C. S., Webster, M. J., Herman, M. M., Kleinman, J. E., and Harrison, P. J. (2003). Expression of NMDA receptor NR1, NR2A and NR2B subunit mRNAs during development of the human hippocampal formation. Eur. J. Neurosci. 18, 1197–1205.
Leventhal, A. G., Wang, Y., Pu, M., Zhou, Y., and Ma, Y. (2003). GABA and its agonists improved visual cortical function in senescent monkeys. Science 300, 812–815.
Levi, D. M., and Li, R. W. (2009). Perceptual learning as a potential treatment for amblyopia: a mini-review. Vision Res. 49, 2535–2549.
Lewis, T. L., and Maurer, D. (2005). Multiple sensitive periods in human visual development: evidence from visually deprived children. Dev. Psychobiol. 46, 163–183.
Löw, K., Crestani, F., Keist, R., Benke, D., Brünig, I., Benson, J. A., Fritschy, J. M., Rülicke, T., Bluethmann, H., Möhler, H., and Rudolph, U. (2000). Molecular and neuronal substrate for the selective attenuation of anxiety. Science 290, 131–134.
Maffei, A., Nelson, S. B., and Turrigiano, G. G. (2004). Selective reconfiguration of layer 4 visual cortical circuitry by visual deprivation. Nat. Neurosci. 7, 1353–1359.
Maurer, D., Mondloch, C. J., and Lewis, T. L. (2007a). Effects of early visual deprivation on perceptual and cognitive development. Prog. Brain Res. 164, 87–104.
Maya Vetencourt, J. F., Sale, A., Viegi, A., Baroncelli, L., De Pasquale, R., O’Leary, O. F., Castren, E., and Maffei, L. (2008). The antidepressant fluoxetine restores plasticity in the adult visual cortex. Science 320, 385–388.
McIntire, S. L., Reimer, R. J., Schuske, K., Edwards, R. H., and Jorgensen, E. M. (1997). Identification and characterization of the vesicular GABA transporter. Nature 389, 870–876.
Minelli, A., Alonso-Nanclares, L., Edwards, R. H., DeFelipe, J., and Conti, F. (2003). Postnatal development of the vesicular GABA transporter in rat cerebral cortex. Neuroscience 117, 337–346.
Monyer, H., and Markram, H. (2004). Interneuron diversity series: molecular and genetic tools to study GABAergic interneuron diversity and function. Trends Neurosci. 27, 90–97.
Murphy, K. M., Beston, B. R., Boley, P. M., and Jones, D. G. (2005). Development of human visual cortex: a balance between excitatory and inhibitory plasticity mechanisms. Dev. Psychobiol. 46, 209–221.
Pinto, J. A. G., Hornby, K. R., Jones, D. G., and Murphy, K. M. (2008). “Developmental changes in GABAergic inhibitory mechanisms in human primary visual cortex,” in International Society for Developmental Neuroscience Meeting, 1–4 June 2008, Asilomar, CA.
Prenosil, G. A., Schneider Gasser, E. M., Rudolph, U., Keist, R., Fritschy, J. M., and Vogt, K. E. (2006). Specific subtypes of GABAA receptors mediate phasic and tonic forms of inhibition in hippocampal pyramidal neurons. J. Neurophysiol. 96, 846–857.
Pritchett, D. B., Sontheimer, H., Shivers, B. D., Ymer, S., Kettenmann, H., Schofield, P. R., and Seeburg, P. H. (1989). Importance of a novel GABAA receptor subunit for benzodiazepine pharmacology. Nature 338, 582–585.
Quinlan, E. M., Olstein, D. H., and Bear, M. F. (1999). Bidirectional, experience-dependent regulation of N-methyl-d-aspartate receptor subunit composition in the rat visual cortex during postnatal development. Proc. Natl. Acad. Sci. U.S.A. 96, 12876–12880.
Rudolph, U., Crestani, F., Benke, D., Brünig, I., Benson, J. A., Fritschy, J. M., Martin, J. R., Bluethmann, H., and Möhler, H. (1999). Benzodiazepine actions mediated by specific gamma-aminobutyric acid (A) receptor subtypes. Nature 401, 796–800.
Rudolph, U., Crestani, F., and Möhler, H. (2001). GABA(A) receptor subtypes: dissecting their pharmacological functions. Trends Pharmacol. Sci. 22, 188–194.
Sagne, C., El Mestikawy, S., Isambert, M. F., Hamon, M., Henry, J. P., Giros, B., and Gasnier, B. (1997). Cloning of a functional vesicular GABA and glycine transporter by screening of genome databases. FEBS Lett. 417, 177–183.
Sengpiel, F., and Vorobyov, V. (2005). Intracortical origins of interocular suppression in the visual cortex. J. Neurosci. 25, 6394–6400.
Shaw, C., Cameron, L., March, D., Cynader, M., Zielinski, B., and Hendrickson, A. (1991). Pre- and postnatal development of GABA receptors in Macaca monkey visual cortex. J. Neurosci. 11, 3943–3959.
Sieghart, W. (1995). Structure and pharmacology of gamma-aminobutyric acid A receptor subtypes. Pharmacol. Rev. 47, 181–232.
Sigel, E. (2002). Mapping of the benzodiazepine recognition site on GABA(A) receptors. Curr. Top. Med. Chem. 2, 833–839.
Singer, W., von Grünau, M., and Rauschecker, J. (1980). Functional amblyopia in kittens with unilateral exotropia. I. Electrophysiological assessment. Exp. Brain Res. 40, 294–304.
Sjöström, P. J., Turrigiano, G. G., and Nelson, S. B. (2003). Neocortical LTD via coincident activation of presynaptic NMDA and cannabinoid receptors. Neuron 39, 641–654.
Smith, G. B., and Olsen, R. W. (1995). Functional domains of GABAA receptors. Trends Pharmacol. Sci. 16, 162–168.
Sohal, V. S., Zhang, F., Yizhar, O., and Deisseroth, K. (2009). Parvalbumin neurons and gamma rhythms enhance cortical circuit performance. Nature 459, 698–702.
Titulaer, M. N., and Ghijsen, W. E. (1997). Synaptoneurosomes. A preparation for studying subhippocampal GABAA receptor activity. Methods Mol. Biol. 72, 49–59.
Tsumoto, T., and Sato, H. (1985). GABAergic inhibition and orientation selectivity of neurons in the kitten visual cortex at the time of eye opening. Vision Res. 25, 383–388.
Keywords: GABA, development, human, aging, visual cortex, inhibition, plasticity
Citation: Pinto JGA, Hornby KR, Jones DG and Murphy KM (2010) Developmental changes in GABAergic mechanisms in human visual cortex across the lifespan. Front. Cell. Neurosci. 4:16. doi: 10.3389/fncel.2010.00016
Received: 06 February 2010;
Paper pending published: 28 March 2010;
Accepted: 26 April 2010;
Published online: 10 June 2010
Edited by:
Yehezkel Ben-Ari, Institut National de la Santé et de la Recherche Médicale, FranceReviewed by:
Peter C. Kind, University of Edinburgh, UKCopyright: © 2010 Pinto, Hornby, Jones and Murphy. This is an open-access article subject to an exclusive license agreement between the authors and the Frontiers Research Foundation, which permits unrestricted use, distribution, and reproduction in any medium, provided the original authors and source are credited.
*Correspondence: Kathryn M. Murphy, McMaster Integrative Neuroscience Discovery and Study (MiNDS), McMaster University, 1280 Main Street West, L8S 4K1, Hamilton, ON, Canada. e-mail: kmurphy@mcmaster.ca