Non-invasive imaging of neuroanatomical structures and neural activation with high-resolution MRI
- 1 Department of Psychology, University of Maryland, College Park, MD, USA
- 2 Neuroscience and Cognitive Science Program, University of Maryland, College Park, MD, USA
- 3 Department of Chemistry and Biology, Georgia State University, Atlanta, GA, USA
- 4 Brains and Behavior Program, Neuroscience Institute, Georgia State University, Atlanta, GA, USA
- 5 Armed Forces Institute of Pathology, Rockville, MD, USA
Several years ago, manganese-enhanced magnetic resonance imaging (MEMRI) was introduced as a new powerful tool to image active brain areas and to identify neural connections in living, non-human animals. Primarily restricted to studies in rodents and later adapted for bird species, MEMRI has recently been discovered as a useful technique for neuroimaging of invertebrate animals. Using crayfish as a model system, we highlight the advantages of MEMRI over conventional techniques for imaging of small nervous systems. MEMRI can be applied to image invertebrate nervous systems at relatively high spatial resolution, and permits identification of stimulus-evoked neural activation non-invasively. Since the selection of specific imaging parameters is critical for successful in vivo micro-imaging, we present an overview of different experimental conditions that are best suited for invertebrates. We also compare the effects of hardware and software specifications on image quality, and provide detailed descriptions of the steps necessary to prepare animals for successful imaging sessions. Careful consideration of hardware, software, experiments, and specimen preparation will promote a better understanding of this novel technique and facilitate future MEMRI studies in other laboratories.
Introduction
Functional magnetic resonance imaging (fMRI) was developed 20 years ago as a new technique to non-invasively measure patterns of brain activity. fMRI has many useful features. Neural activity can be made visible in fully intact subjects tested under controlled experimental settings and exposed to selectable stimulation regimes. The technique is appropriate for systems where more invasive methods cannot be used (e.g., humans), and repeated measurements of the same subject are possible. Moreover, fMRI has been successfully applied in both clinical and basic scientific studies. Yet, for most fMRI studies, interpretations of the results are often complicated by the low accuracy of measurements that are based on hemodynamic changes, the blood-oxygen-level dependent (BOLD) response, rather than neural responses (Aguirre et al., 1998). In addition, imaging artifacts may interfere with the statistical analysis and while spatial resolution (∼1 mm3) of fMRI exceeds other techniques that are commonly used to measure brain activity in humans (e.g., EEG or PET), temporal resolution is low because the BOLD response peaks several seconds after neural firing has occurred (Heeger and Ress, 2002). Thus, fMRI typically provides a measurement of delayed activity in large brain regions that are difficult to characterize by other means because further exploration of the underlying cellular mechanisms requires invasive procedures which are not applicable, especially in humans (Logothetis, 2008).
For animal fMRI studies, low temporal resolution of the BOLD signal is a limiting factor, but scanners that produce higher magnetic fields (7.0–11.7 T) are used to improve on the spatial resolution. Animal magnet systems are typically equipped with horizontal bores of 20–40 cm diameter, and to achieve sufficient spatial resolution in smaller animals (e.g., mice), customized “head coils” have to be used (Benveniste and Blackband, 2002). Thus, for animals with very small bodies and nervous systems such as invertebrates, magnets would have to be high-field scanners equipped with sufficient gradient strength and a very small solenoid coil.
A different approach for micro-imaging of small animals is the use of standard narrow bore (5.2 cm ID) or wide bore (8.9 cm ID) high-field nuclear magnetic resonance (NMR) spectrometers that are traditionally used for macromolecular studies. Most research institutions are equipped with high-field NMR spectrometers and upgrading to micro-imaging is much less expensive than acquisition of a new animal magnet system. Micro-imaging permits scanning of small samples and benefits from improved image quality, increased spatial resolution, and/or reduced scan times due to the improvements in signal-to-noise. Spatial resolution can be better than 100 μm in more than one dimension, and imaging at this resolution is often referred to as MR microscopy (Benveniste and Blackband, 2002). However, as with any other magnet, the bore size of NMR spectrometers is fixed and smaller compared to animal magnet systems, thus limiting the diameter of the imaged sample to a few centimeters at most (i.e., a maximum of 1 cm for the narrow-bore magnets and 3 cm for wide-bore magnets).
Different paramagnetic contrast agents have been developed to improve tissue discrimination in MR images. Most MRI agents used in clinical studies are based on chelated gadolinium which remains in the extracellular space (Carr et al., 1984; Caravan, 2006). However, one agent that accumulates intracellularly is manganese, a calcium analog that can enter depolarized cells through voltage-gated calcium channels. Due to the tendency of the paramagnetic manganese ions (Mn2+) to differentially accumulate in most soft tissues, higher overall signal intensity and strongly improved contrast between structures is achieved providing for a high degree of anatomical detail (Silva et al., 2004; Van der Linden et al., 2007). Moreover, Mn2+ ions that enter active nerve cells are transported along the axons in an anterograde direction and also trans-synaptically, which allows for investigation of neural pathways and interneuronal connections (Pautler and Fraser, 2003; Lee and Koretsky, 2004). Importantly, due to the slow clearing rate of manganese from intracellular regions, the systemic application of the neural marker can take place outside of the magnet, i.e., in an unrestrained freely behaving animal, before it is subsequently imaged (Pautler et al., 1998; Pautler and Koretsky, 2002). While manganese-enhanced magnetic resonance imaging (MEMRI) is characterized by much higher sensitivity and increased signal-to-noise ratio (SNR) as compared to BOLD fMRI, there are certain shortcomings associated with using this technique in vertebrate species. Systemic injections into the bloodstream require opening of the blood–brain barrier due to limited Mn2+ permeability, whereas focal injections into brain regions of interest (ROIs) require invasive procedures under anesthesia (Aoki et al., 2004). Moreover, manganese at high concentrations is known to be a neurotoxin (Crossgrove and Zheng, 2004; Canals et al., 2008).
Previous studies have demonstrated that the uptake of Mn2+ into the crayfish nervous tissue is rapid, and Mn2+ clears out of the nervous tissue slowly before it is completely eliminated (Herberholz et al., 2004). In our current study we have extended the use of MEMRI to image localized Mn2+ uptake in live juvenile crayfish brains for identification of stimulus-evoked neural activity. We used live juvenile crayfish as an invertebrate model as they are well suited for MEMRI studies for several reasons: (1) Crayfish can be systemically injected with manganese due to the absence of a blood–brain barrier and survive long imaging sessions (>24 h) under conditions described in this manuscript. (2) Crayfish can be imaged using standard high-field NMR spectrometers equipped with micro-imaging probes and strong gradients after they are placed into small sample tubes where they remain motionless without anesthesia. We also present detailed anatomical images of the crayfish nervous system and discuss parameters critical for successful MEMRI experiments, ranging from hardware and software requirements, to imaging sequences, to specimen preparation. Our results underscore the advantages of MEMRI in obtaining non-invasive images at high spatial resolution with increased SNRs providing a novel approach that can be used for anatomical and functional studies in other small invertebrates.
Methods
In previous studies images were acquired with adult crayfish using a 4.7-T horizontal bore (33 cm) magnet and a quadrature birdcage (3.7 cm) radiofrequency (RF) coil (Herberholz et al., 2004); however we achieved superior imaging results more recently by using two different NMR micro-imaging systems that are described below.
Micro-Imaging Systems
This 600 MHz (14.1 T) Avance NMR spectrometer (Bruker, Billerica, MA, USA) is located at Georgia State University (Figure 1A) and equipped with a MICRO 5 probe (4.8 G cm−1 A−1) for imaging, three gradient current amplifiers (40 A), gradient water cooling system using Paravision© for data acquisition, image reconstruction, and processing. Different sized (saddle coil) exchangeable inserts (0.5–10 mm) are available.
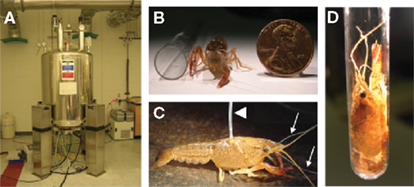
Figure 1. (A) 600 MHz (14.1 T) NMR spectrometer located at Georgia State University. The spectrometer is equipped with a MICRO 5 probe for imaging. (B) Juvenile crayfish (3.6–3.7 cm lengths from rostrum to telson) were used in all studies. (C) MnCl2 was injected into the pericardial chamber after crayfish were cannulated by inserting a short piece of fused silica connected to polyethylene tubing (arrowhead). To measure functional Mn2+ uptake in the brain, animals were implanted with stimulating silver wire electrodes placed around the left antenna II nerve (arrows). (D) Animals were gently moved into NMR tubes (1 cm diameter) prior to imaging where there remained motionless during the session. All photos were taken by Jens Herberholz.
The 400 MHz (9.4 T) Bruker DMX spectrometer is located at the Armed Forces Institute of Pathology in Rockville, Maryland. It is equipped with a MICRO 2.5 probe (2.5 G cm−1 A−1) for micro-imaging, three gradient current amplifiers (60 A), gradient water cooling system and Paravision© software for acquisition, image reconstruction, and processing. Exchangeable RF inserts for the MICRO 2.5 range from 2.5 to 25 mm in diameter.
Animal Preparation
Juvenile crayfish (Procambarus clarkii) of both sexes (size: 3.6–3.7 cm rostrum to telson) were used in our experiments (Figure 1B). They were prepared for imaging sessions by cooling on crushed ice for several minutes. A cannula for systemic injections of the contrast agent was constructed by inserting a short piece (∼0.2 cm) of fused silica (ID 0.2 mm; Polymicro Technologies) into one end of 50 cm of polyethylene tubing (ID 0.28 mm, OD 0.61 mm; Becton Dickinson Co.). Red food-coloring dye (10 μl) was injected into the tube by connecting a Hamilton Microliter syringe to the other end, and the length of tubing that corresponded to the injected volume was measured and marked on the tube. Next, the Hamilton syringe was replaced by a MicroFil non-metallic syringe needle (World Precision Instruments) and connected to a 1-ml syringe. The syringe was filled with deionized water and the cannula was flushed multiple times. Next, the cannula was filled with MnCl2 (manganese [II] chloride tetra-hydrate, minimum 99%; Sigma-Aldrich) dissolved in buffered (pH 7.4) crayfish saline. Once filled, a small bubble was introduced at the end of the polyethylene tubing and a 1-ml syringe filled with food-color dye was connected to the syringe needle. In this way, an easy visual reference (the position of the dye within the transparent tubing) was available to determine the amount of Mn2+ injected into the animal. Under a microscope, a small hole was drilled with a 27-gauge needle in the dorsal carapace of the anesthetized crayfish. The location of the hole was always above the pericardial sac to the immediate left or right of the heart. The fused silica attached to the polyethylene tube was inserted into the hole. The entry of the polyethylene tube was prevented by its larger diameter. The juncture was then sealed with a few drops of superglue gel (Figure 1C, arrowhead).
Before acquiring neuroanatomical scans, the animals were injected with different concentrations of MnCl2 while performing random behavioral activities (see Results). For measurements of stimulus-dependent neural activation, the animals were implanted with a pair of fine silver wire electrodes (A-M Systems Inc.); two different implantations were performed. For stimulation of the antenna II nerve (mechanosensory input to the brain), two small holes were punctured using metallic insect pins into the fifth basal segment of the right or left antenna (posterior to the first segment of the flagellum) to allow access to the nerve (Figure 1C, arrows). Approximately 1 mm of insulation was stripped off one end of the electrodes and the bare wires (0.2 mm diameter) were inserted through the holes in the cuticle and placed next to each other onto the nerve. They were attached to the cuticle using superglue gel and the other ends were connected to a square pulse stimulator (Model SD9; Grass Technologies). For stimulation of the ventral nerve cord and activation of the lateral giant escape circuit, two small holes were punctured into the soft membrane covering the ventral side of the nerve cord between the fourth and fifth abdominal segments. The stripped-off ends of the wires were inserted through the holes and placed next to each other onto the ventral nerve cord. The electrodes were glued in place and the other ends were connected to a pulse stimulator (Model 2100; A-M Systems Inc.).
Different stimulation protocols were applied while the animals were injected with MnCl2 before the start of the imaging session (see Results). Before placing the animals into the magnet, the cannula was cut off near the entrance point into the carapace, the implanted electrodes were carefully removed using forceps, and the animals were gently moved into either transparent plastic tubes (55 mm length, 10 mm diameter) or conventional NMR tubes (180 mm length, 10 mm diameter; Figure 1D). Most animals remained motionless inside the tubes and did not need any additional restrain. However, to prevent motion artifacts during high-resolution scans, the cephalothorax of most animals that had received antenna II nerve stimulation was embedded in 2% agarose. The agarose completely eliminated movements of the antennae and eyestalks during long scans without affecting the quality of the images. After scans were completed, the agarose was removed from the animals before they were returned to their holding tanks.
Imaging Protocols
The overall signal intensity in an MR image is dependent on tissue specific parameters such as the proton density (PD), the longitudinal (T1), and the transverse (T2) relaxation times. Signal is also affected by instrument-dependent parameters such as sensitivity of the electronic circuitry of the scanner, repetition time (TR), echo time (TE) as well as other factors such as inversion time and flip angle based on the specific imaging sequence used. The contrast between different tissues in a MR image is determined by the difference in the signal intensities resulting from the tissue specific parameters. Additionally, the combination of TR and TE define the “weighting” (e.g., T1, PD, T2) of the image and different weightings generate optimal results for specific tissues. In MEMRI studies, a positive contrast agent like manganese shortens the T1 relaxation time in the absorbed tissue consequently producing a bright signal in T1-weighted images (TR << T1, TE < T2).
T1-weighted images were acquired with a standard multi-slice-multi-echo (MSME) imaging sequence with a TR ranging from 600 to 1005 ms and a TE of 8 to 10.4 ms, respectively. Multi-slice T2-weighted images were acquired with a rapid acquisition with relaxation enhancement (RARE) sequence with TR = 2 s, TE = 25 ms, and a RARE factor of 4. Three-dimensional images were acquired using a RARE imaging sequence with TR/TE = 800/8 ms and a RARE factor of 8. The field of view (FOV) in combination with matrix size determines final resolution of images and affects acquisition time, whereas a higher number of averages improves SNR but increases total acquisition time. The combination of parameters selected for each scan is specified in Section “Result.”
Post-Imaging Data Processing
The Paravision software available with the Bruker imaging systems can be used for image reconstruction. Image data can also be exported to a DICOM format which can then be viewed, processed, and analyzed by the other software packages. Much of the data processing of images presented in this study was performed using ImageJ (Abramoff et al., 2004). ImageJ is a public domain image processing and analysis program written in Java. It offers over 500 different available plug-ins including many that are relevant for post-imaging data analysis, e.g., measurements of intensity thresholds and grayscale values within a pre-selected image area, and it accepts image stacks that can be visualized in 3D.
We used the ImageJ software to compare manganese uptake in the brains of five stimulated samples and one unstimulated sample by measuring grayscale values for four consecutive slices (100 μm thick) that covered the major brain structures. This ensured that we covered most of the brain regions axially and allowed us to analyze the differences between the sides of the brain objectively. ROIs were specified for each sample according to image size and kept constant within each sample. Two ROIs of identical size were selected covering either the left or right half of the brain; the dimensions of the ROIs were determined by viewing a single image that showed most of the brain areas. Individual grayscale values were measured within each ROI for T1- and/or T2-weighted brain images of both the stimulated and unstimulated animal. The mean grayscale values were averaged over all four brain slices for the respective sides (left and right) and compared statistically with a non-parametric test (Wilcoxon signed-rank test) using SPSS (Version 17.0).
Results
Neuroanatomy
Traditional neuroanatomical studies use histological and microscopic techniques that provide superb spatial resolution, but are destructive and labor and time intensive. On the other hand, MRI is non-invasive and suitable for small nervous systems when sufficient contrast between different brain parts can be detected (Michaelis et al., 2005). In our earlier study, we found that traditional MRI is not sufficient to differentiate between brain structures in crayfish, but this could be dramatically improved by systemic injections of MnCl2 into the hemolymph. We have also previously shown that uptake of Mn2+ begins several minutes after administration of the contrast agent and remains in the nervous tissue for up to 48 h before it is slowly eliminated (Herberholz et al., 2004).
In our current study, we first imaged Mn2+ uptake into the nervous system of a juvenile crayfish (Figure 2). The animal was slowly (over 2–3 min) injected with 45 μl of 50 mM MnCl2 and allowed to move freely for 30 min in a small water-filled but otherwise empty tank following the injection. After this period, the cannula was removed and the animal was placed in the magnet. Figure 2A shows one single section (selected from a total of 32 coronal sections) that provides a good view of both the central brain regions and the right eyestalk (left eye is out of plane). Individual neuroanatomical structures can be seen, including different ganglia located in the right eyestalk (Figure 2B), the accessory and olfactory lobes in the central brain area (Figure 2C, arrows), and the rostral parts of the brain connectives (Figures 1A,C, arrowheads). The following imaging parameters were used for this T1-weighted scan sequence: TR = 600 ms, TE = 10.4 ms, FOV = 1.3 cm × 1.3 cm, matrix = 256 × 256, averages = 8, slice thickness = 100 μm, (in-plane) resolution = 50 μm × 50 μm, acquisition time = 21 min.
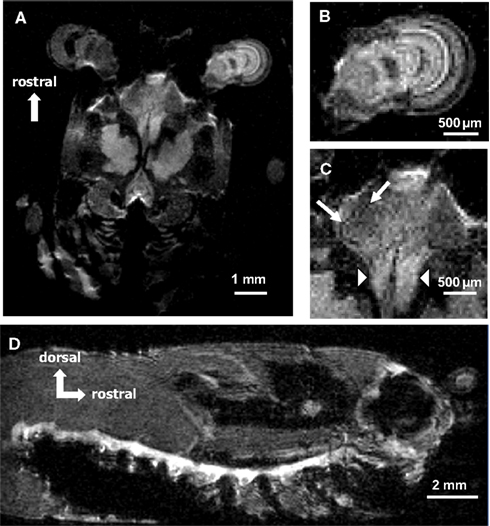
Figure 2. (A) A single coronal section through the head and thorax of a crayfish injected with 45 μl of 50 mM MnCl2 and imaged with a T1-weighted MSME sequence. Mn2+ uptake into the central brain areas and into the right eyestalk can be seen. (B) Magnified view of the right eyestalk. Individual anatomical regions are visible. (C) Magnified view of the central brain areas. Olfactory and accessory lobe (arrows) and the rostral parts of the brain connectives (arrowheads) can be identified. (D) A single sagittal section from a 3D stack acquired with a RARE imaging sequence after the animal was injected with 100 μl of 20 mM MnCl2. Mn2+ uptake into the entire ventral nerve cord as well as individual thoracic and abdominal ganglia can be detected.
Mn2+ uptake into the ventral nerve cord is shown in Figure 2D. A different animal was injected with 100 μl of 20 mM MnCl2 and allowed to move freely and undisturbed in a small tank for 15 min before the imaging session. After this period, the cannula was removed and the animal was placed in the magnet. A total of 128 sections were taken using a 3D imaging protocol (see below for parameters). Figure 2D represents a single sagittal section from the 3D stack showing the animal inside the tube with its tail curled under the abdomen. The entire ventral nerve cord as well as individual thoracic and abdominal ganglia are visualized. The following imaging parameters were used for this T1-weighted RARE scan sequence: TR = 800 ms, TE = 8 ms, rare = 8, FOV = 2 cm × 1 cm × 1 cm, matrix = 256 × 128 × 128, averages = 32, resolution = 78 μm × 78 μm × 78 μm, acquisition time = 4 h, 33 min.
Neural Activity
Besides its important role as a contrast agent for neuroanatomical studies, we have tested the suitability of Mn2+ as a marker for neural activity by imaging uptake into the brain after electrical stimulation of the right or left antenna II nerve in five different animals. All five animals received the same dose of MnCl2, received the same type of antenna II nerve stimulation, and were scanned using the same imaging protocol. An example of the neural activity after left antenna II nerve stimulation in one representative animal is shown in Figures 3 and 4. The animal was slowly injected with 40 μl of 25 mM MnCl2 (over 4–5 min). Stimulation with electric shocks (1 V at 4 Hz) of the antenna II nerve was started simultaneously with MnCl2 injection and continued for 25 min after the injection was finished. Immediately after stimulation, the implanted electrodes and cannula were removed and the animal was placed into the scanner. A total of 40 axial sections through the head region were taken and two individual slices (200 μm apart) are shown. Using a T1-weighted imaging protocol, uptake of Mn2+ into the brain is visible in both sections (Figures 3A,B). More Mn2+ uptake can be seen on the left (i.e., stimulated) side of the brain, especially in the left antenna II nerve and the left accessory lobe (note that in these axial slices, the animal’s left side corresponds to the viewer’s right side). For better identification of brain structures, a schematic of the main brain regions allows to compare the histological reconstruction to our MEMRI images. Positions of both the antenna II nerve and the left accessory lobe are indicated. The imaging parameters for this scan were as follows: TR = 800 ms, TE = 10.4 ms, FOV = 0.4 cm × 0.4 cm, matrix = 128 × 128, averages = 32, slice thickness = 100 μm, (in-plane) resolution = 31 μm × 31 μm, acquisition time = 55 min.
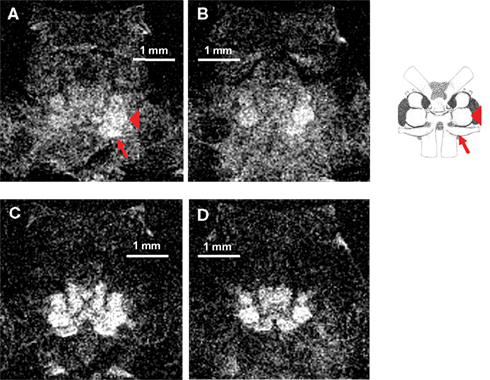
Figure 3. (A) A single axial section through the head acquired using a T1-weighted MSME imaging sequence. Note that in these axial slices, the animal’s left side corresponds to the viewer’s right side. After the animal was injected with 40 μl of 25 mM MnCl2 and stimulated with electric shocks delivered to the left antenna II nerve, Mn2+ uptake into different areas of the central brain can be detected. More Mn2+ uptake can be seen on the left (i.e., stimulated) side of the brain, especially in the left antenna II nerve (arrow) and the left accessory lobe (arrowhead). (B) Another axial section from the same scan located 200 μm more posterior. Clear differences between the two sides of the brain are still visible in this section. (C) The same animal and axial section shown in (A) but imaged with a T2-weighted RARE imaging sequence. More overall signal intensity and contrast can be seen but differential Mn2+ uptake between the two sides of the brain is less discrete. (D) The same animal and axial section as shown in (B) but imaged with a T2-weighted RARE imaging sequence. More overall signal intensity and contrast can be seen but differences in Mn2+ uptake between the two sides of the brain are less pronounced. A schematic of the main structures of the crayfish brain is shown on the right (modified from Sandeman et al., 1988). The left antenna II nerve (arrow) and the left accessory lobe (arrowhead) are labeled in the schematic for comparison.
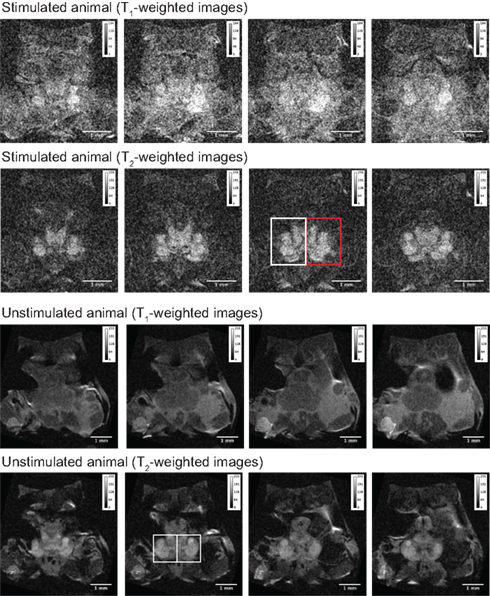
Figure 4. Stacks of four single brain slices obtained from one stimulated and one unstimulated animal. T1- and T2-weighted images from both animals were used to measure grayscale values for each brain slice (Table 1). The regions of interest (ROIs) for the two sides of the brain were selected using a single T2-weighted image from each animal and kept identical for all slices. The ROIs are shown as rectangular boxes in the respective images; the red box in the image of the stimulated animal indicates the side of the animal that received electric stimulation of the antenna II nerve. The imaging parameters for each scan are given in the results.
The same animal was subsequently imaged using a T2-weighted RARE imaging sequence (Figures 3C,D). Using this imaging protocol, Mn2+ uptake into the brain was clearly visible, with more contrast obtained than in the previous protocol. However, the difference in Mn2+ uptake between the two sides of the brain observed in the T1-weighted images was obscured in these T2-weighted images. The imaging parameters were as follows: TR = 2211 ms, TE = 25 ms, RARE = 4, FOV = 0.4 cm × 0.4 cm, matrix = 128 × 128, averages = 32, slice thickness = 100μm, (in-plane) resolution = 31 μm × 31 μm, acquisition time = 38 min.
We determined individual and mean grayscale values within pre-selected ROIs that covered the left and right brain regions of this animal and a control (unstimulated) animal (Table 1). The same analysis was used to measure grayscale values in the control animal of equal size and weight (Figure 4). The control animal was injected with the same amount of MnCl2 and scanned at the same time after injection but did not receive any stimulation of the antenna II nerve. It was scanned using the same imaging parameters as used for the stimulated animals except averages = 48 and FOV = 0.55 cm × 0.55 cm. The difference in the individual and mean grayscale values, of the left and the right side, was highest for the T1-weighted images obtained from the animal that received a combination of MnCl2 injection and antenna II stimulation; the difference was smaller for T2-weighted images obtained from the same animal. In comparison the individual and mean grayscale values were similar for both sides of the brain in the control animal for the T1- and T2-weighted images. Thus, the differences (stimulated animal) or the lack thereof (unstimulated control animal) between the two sides of the brain is consistent throughout the 400 μm region covered axially by these slices.
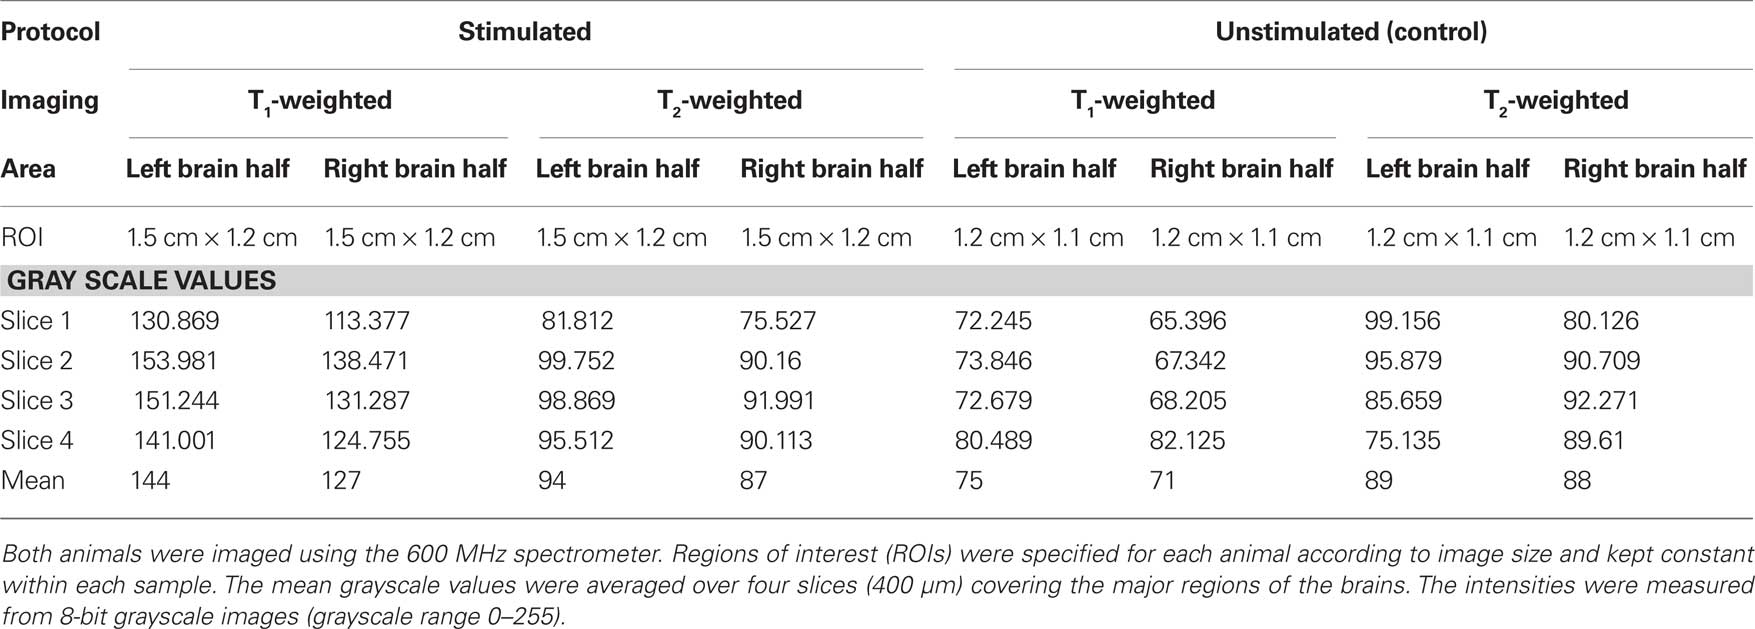
Table 1. Comparison of individual and mean grayscale values for one stimulated and one unstimulated sample.
In order to confirm the suitability of MEMRI for functional imaging, we obtained T1-weighted scans after antenna II stimulation and manganese injection in four additional animals using the 400 MHz spectrometer. We determined individual and mean grayscale values within pre-selected ROIs that covered the left and right brain regions. Table 2 shows the mean grayscale values averaged over four selected brain slices from all five animals. We found higher mean grayscale values for the stimulated side in all five animals although the differences varied largely across samples. Despite having a small sample size included in our statistical analysis, we found a significant difference between the stimulated and unstimulated brain regions (Wilcoxon signed-rank test, p = 0.043).
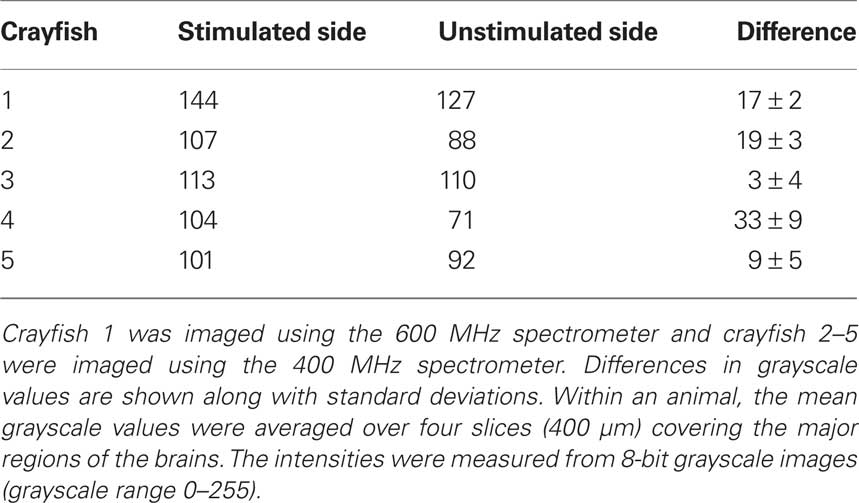
Table 2. Comparison of mean grayscale values of brain areas ipsilateral and contralateral to the electrically stimulated antenna II nerve for all five tested individuals.
Uptake into the ventral nerve cord and abdominal ganglia after electrical stimulation was imaged in one other animal (Figure 5). This animal was slowly injected (over 1.5 min) with a modest dose (10 μl of 50 mM) of MnCl2 and the ventral nerve cord was stimulated for 20 min (1.5 V, 60 shocks at 0.05 Hz) to elicit escape tail-flips mediated by the lateral giant neurons. Each stimulus evoked a tail-flip response from the animal. Figure 5A shows a single section chosen from 15 coronal slices to illustrate Mn2+ uptake into the thoracic and abdominal ganglia. Most of the nerve cord is visible, and ganglia as well as ganglionic nerve roots can be seen. The imaging parameters for this T1-weighted scan were as follows: TR = 1005 ms, TE = 10 ms, FOV = 2 cm × 1 cm, matrix = 256 × 128, averages = 32, slice thickness = 100 μm, (in-plane) resolution = 78 μm × 78 μm, acquisition time = 1 h, 8 min.
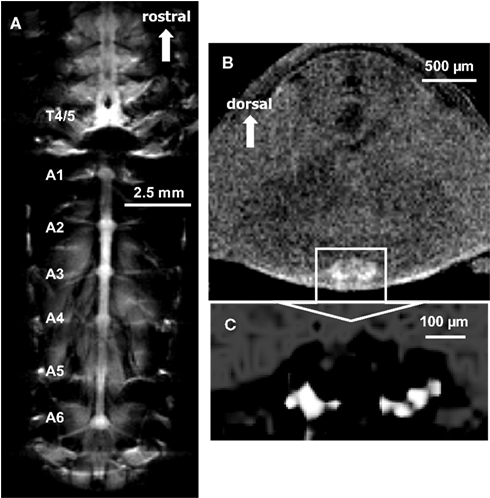
Figure 5. (A) A single coronal section through the thorax and abdomen illustrating Mn2+ uptake into the ventral nerve cord. Images were acquired using a T1-weighted MSME sequence after the animal was injected with 10 μl of 50 mM MnCl2 and the ventral nerve cord was repeatedly stimulated to elicit escape tail-flips mediated by the lateral giant neurons. Most of the nerve cord is visible, and ganglia as well as ganglionic nerve roots can be seen. (B) Using a slightly modified T1-weighted MSME sequence in the same animal, a single axial section of the abdomen at the location of the third abdominal ganglion is shown. The boundaries of the abdominal ganglion and localized Mn2+ uptake within the ganglion are visible. (C) Magnified view of the third abdominal ganglion. By highlighting the most intensely labeled areas, Mn2+ uptake is seen in discrete areas of the ganglion.
The same animal was subsequently imaged in the axial plane. Figure 5B shows a selected single section (from 11 axial slices) of the third abdominal ganglion. The boundaries of the abdominal ganglion and what appears to be individually labeled cells within the ganglion have been visualized by highlighting the most intense labeled areas (Figure 5C). We used the following imaging parameters for this T1-weighted scan: TR = 805 ms, TE = 10 ms, FOV = 0.5 cm × 0.5 cm, matrix = 128 × 128, averages = 64, slice thickness = 100 μm, resolution = 39 μm × 39 μm × 100 μm, acquisition time = 1 h, 49 min.
Discussion
Results
The suitability of MEMRI to image the nervous system and other soft tissues of adult crayfish has previously been shown using different MEMRI procedures (Herberholz et al., 2004; Brinkley et al., 2005). These studies established that systemic injections of MnCl2 into the open circulatory system of crayfish significantly improved signal intensity in MR images when compared to control animals that were not injected. Moreover, the time course of manganese uptake into the brain and subsequent elimination from the brain was determined (Herberholz et al., 2004). In the only other published study using MEMRI in an invertebrate, Watanabe et al. (2006) investigated neural activity in both antennal lobes of Manduca sexta pupae after antennal transection on one side. Using T1-weighted imaging, they found a higher increase in SNR on the intact side as compared to the disrupted side indicating normal synaptic activity at pupal stage P13.
The current study supports previous reports that MEMRI is a highly successful technique to visualize the nervous system of live invertebrate animals. Moreover, we have demonstrated that MEMRI can be successfully used to label activity-dependent Mn2+ uptake into the brain and ventral nerve cord. Thus, MEMRI is well suited for both non-invasive neuroanatomical studies and functional studies of brain activity in various animals with small nervous systems. Since crayfish tolerate long imaging sessions in intense magnetic fields, MR images of high spatial resolution can be achieved. While overall spatial resolution cannot compete with conventional microscopic techniques, MEMRI is performed non-invasively in live animals and images can be generated within minutes to hours.
Although manganese is a strong T1 relaxation agent, our T2-weighted RARE images were characterized by high signal-to-noise. This is in agreement with previous studies and suggests that RARE pulse sequences may be well suited for anatomical studies using MEMRI or conventional MRI (Brinkley et al., 2005; Michaelis et al., 2005). T2-weighted images are also helpful for post-imaging data processing. They provide sufficient signal intensity across all brain areas and can guide ROI selection for quantitative measurements (e.g., grayscale values). In addition, detailed neuroanatomical structures can be visualized using 3D RARE scanning sequences which provide images that are not affected by positional changes of the animal inside the imaging tube and allow for better intra- and inter-individual comparisons.
For detection of localized Mn2+ uptake during functional MEMRI experiments, however, we found T1-weighted MSME imaging sequences to be most effective. The localized uptake of Mn2+ into one side of the brain after ipsilateral stimulation of the antenna II nerve was more clearly visible in T1-weighted MSME images, suggesting that this imaging sequence best reveals activity-dependent manganese uptake.
For analyzing grayscale values in the brain, we selected rectangular ROIs for each animal and used the same ROIs for both the stimulated and unstimulated sides of the brain. This allowed us to include all regions of the brain that are expected to be activated by the stimulation, and to compare the area to the exact same area on the unstimulated side. However, rectangular ROIs would sometimes include regions outside the brain that contained tissues of varying signal intensity, which slightly affected grayscale values. We explored an alternative method by hand-drawing localized ROIs around brain regions, and thereby excluding surrounding tissues. We found this challenging, however, as the brain outline was not always clearly detectable, and it was nearly impossible to use the same ROIs for both sides of the brain. Overall, using rectangular ROIs was a more conservative way to measure grayscale values in both halves of the brain, and yet revealed statistical differences between the stimulated and unstimulated regions.
Measurement of grayscale values showed differences between the two sides of the brain in all five stimulated animals; higher values were always found on the stimulated side indicating more Mn2+ uptake into the part of the brain that exhibited higher neural activity due to the stimulation. However, the differences between brain areas ipsilateral and contralateral to the electrically stimulated antenna II nerve varied across animals. This variation may be explained by differences in activity pattern of individual crayfish. We did not restrain the animals during stimulation and noticed that differences between the stimulated and unstimulated sides of the brain were less pronounced in crayfish that were more physically active during this period (e.g., some animals repeatedly tail-flipped in response to the stimulus while others did not). Thus, it seems possible that behaviorally more active animals experienced higher overall brain activity leading to an increase in non-localized Mn2+ uptake, which then masked the effects of antenna II stimulation. We are currently carrying out additional experiments to investigate this possibility.
Crayfish (and many other invertebrates) have large neurons, allowing MEMRI resolution to be sufficient for labeling of individual active cells. Our images of the third abdominal ganglion after repeated electrical stimulation of the LG circuit hint on this possibility. The bilateral pattern of highly localized uptake suggests that we imaged some of the large neurons that are part of this circuit (Zucker et al., 1971; Wine, 1984; Edwards et al., 1999). However, more experiments are needed to confirm this notion, and the localization of manganese labeled neurons must be carefully compared to existing morphological descriptions of this circuit before firm conclusions can be reached.
Challenges
Very fast T1-weighted sequences such as fast low angle shot (FLASH) or echo planar imaging (EPI) can be used for manganese uptake studies. However, with our crayfish model these gradient echo based techniques yielded suboptimal results due to imaging artifacts caused by large air-filled areas inside the animal. The susceptibility differences between air and surrounding tissue results in additional field gradients on top of the imaging gradients which do not get refocused by the gradient echo and therefore result in marked signal loss and image distortion (Michaelis et al., 2005). At higher magnetic fields these effect are magnified, thus to minimize the effect of air-filled cavities on neuroanatomical images it is advisable to use imaging protocols based on spin echo techniques.
The signal intensity and maximum spatial resolution that can be obtained for an MR image are directly proportional to the magnetic field strength and gradient strengths. Higher field strengths are especially beneficial for studying smaller animals since their tomographic slices have lower spin density resulting in lower signal. The thickness of a slice imaged is further limited by the capability of the slice selective RF pulse generator in conjunction with the gradient field strength. Furthermore, for any 2D slice selected, the resolution is a function of FOV/matrix size, where the matrix size depends on the number of data points collected in the phase encoding and frequency encoding directions (the axes orthogonal to the selected slice). While the matrix size depends on the user input and should be based on the amount of time available for imaging (phase encoding steps increase acquisition time) the FOV is inversely correlated to the gradient strength. Hence, depending on the spatial resolution desired for the sample all the above factors must be taken into consideration for the choice of field and gradient strengths.
The injected amount of manganese and the temporal relationship between injection and the start of the imaging session is not critical for neuroanatomical studies. In fact, higher concentrations and amounts of manganese yield the best results because neural tissue is more intensely labeled and results in higher contrast between neural tissue and other surrounding tissues (Herberholz et al., 2004). Similar to previous reports, we found that animals used in our current study survived long periods inside the scanner (>24 h); however, the amount and concentration that can be tolerated by the animals must be newly determined for each species and each developmental stage and adjusted to size and/or weight of the sample. Moreover, not all studies will require Mn2+ as a contrast agent and conventional MRI can be used if contrast between different neural structures is high. This was demonstrated by Michaelis et al. (2005) using T1- and T2-weighted 3D MRI to describe morphological changes during metamorphosis in male pupae of M. sexta, although at a lower spatial resolution compared to our study.
In functional studies, temporal resolution of MEMRI images is associated with two factors; first, the time between manganese injection and the start of the imaging session, and secondly, the time needed to sample images at sufficient spatial resolution. Although manganese is quickly taken up from the bloodstream and slowly eliminated from the nervous tissue of crayfish (Herberholz et al., 2004), these factors can complicate unambiguous identification of stimulus-evoked neural activity. This is because our current knowledge predicts that all active neurons will take up manganese, and manganese ions are also transported across synapses from one neuron to the next albeit at a very slow rate. Thus, in order to identify a specific ensemble of neurons that is activated by the stimulation procedure, it is necessary to clearly distinguish its activity from other “unrelated” neural activity. Since manganese is injected into freely behaving animals outside the magnet, neural activity related to behavioral expressions as well as neural activity elicited by handling the animals during imaging preparation will cause manganese uptake into the activated neurons. This makes interpretation of the acquired images more difficult. One solution to this problem is injection of small amounts of Mn2+ that are only available in the bloodstream for a restricted time period, i.e., during and immediately following the stimulation of sensory pathways. Although this was attempted in our study, variation in mean grayscale values indicate that uptake into the brain and possible transport across brain areas has occurred at different times for different animals. In highly active animals, MnCl2 is probably circulated more quickly and uptake into the brain could start earlier than in less active animals. Thus, during the time of scanning (which we kept constant) the nervous tissue of each animal may have been exposed to different amounts of Mn2+.
Future Applications
Manganese-enhanced magnetic resonance imaging is a useful technique to investigate neuroanatomical features in vertebrates and invertebrates. The spatial resolution is high amongst non-invasive imaging techniques. Spatial resolution obtained with MEMRI may not compare to conventional microscopy, but it has the advantage of imaging live animals that can also be re-imaged after manganese has been eliminated from the neural tissue. This opens up new applications of MEMRI in a variety of different species, including recovery from injury and developmental studies when maturation of the nervous system can be tracked over several stages (Watanabe et al., 2006). Since RF inserts are available in different sizes, it may be possible to image animals from juvenile stage to adulthood (provided the typical size of the adult is smaller than the highest diameter insert).
Functional studies, if confirmed feasible by future experiments, will not have to be limited to protocols that measure neural activation by sensory stimulation. Invertebrates are characterized by large and accessible neurons, many of which are individually identified. It may therefore be possible to measure neural uptake into neurons and neural circuits that control specific patterns of behavior expressed in freely behaving animals. MEMRI holds the possibility of identifying CNS regions and perhaps single cells whose labeling changes as a result of behavioral changes. This would provide the necessary basis for further investigation of neural mechanisms using other techniques such as intracellular electrophysiology.
Conflict of Interest Statement
The authors declare that the research was conducted in the absence of any commercial or financial relationships that could be construed as a potential conflict of interest.
Acknowledgments
This work is currently supported by National Science Foundation grant IOS-0919845 (Jens Herberholz) and has received prior support from the General Research Board of the Graduate School at the University of Maryland (Jens Herberholz). Additional support has been received from the Georgia Cancer Coalition (Markus W. Germann) and the Brains and Behavior Program of the Neuroscience Institute at Georgia State University (Donald H. Edwards).
References
Abramoff, M. D., Magelhaes, P. J., and Ram, S. J. (2004). Image processing with image. J. Biophotonics Int. 11, 36–42.
Aguirre, G. K., Zarahn, E., and D’Esposito, M. (1998). The variability of human, BOLD hemodynamic responses. Neuroimage 8, 360–369.
Aoki, I., Wu, Y. J., Silva, A. C., Lynch, R. M., and Koretsky, A. P. (2004). In vivo detection of neuroarchitecture in the rodent brain using manganese-enhanced MRI. Neuroimage 22, 1046–1059.
Benveniste, H., and Blackband, S. (2002). MR microscopy and high resolution small animal MRI: applications in neuroscience research. Prog. Neurobiol. 67, 393–420.
Brinkley, C. K., Kolodny, N. H., Kohler, S. J., Sandeman, D. C., and Beltz, B. S. (2005). Magnetic resonance imaging at 9.4 T as a tool for studying neural anatomy in non-vertebrates. J. Neurosci. Methods 146, 124–132.
Canals, S., Beyerlein, M., Keller, A. L., Murayama, Y., and Logothetis, N. K. (2008). Magnetic resonance imaging of cortical connectivity in vivo. Neuroimage 40, 458–472.
Caravan, P. (2006). Strategies for increasing the sensitivity of gadolinium based MRI contrast agents. Chem. Soc. Rev. 35, 512–523.
Carr, D. H., Brown, J., Bydder, G. M., Steiner, R. E., Weinmann, H. J., Speck, U., Hall, A. S., and Young, I. R. (1984). Gadolinium-DTPA as a contrast agent in MRI: initial clinical experience in 20 patients. AJR Am. J. Roentgenol. 143, 215–224.
Crossgrove, J., and Zheng, W. (2004). Manganese toxicity upon overexposure. NMR. Biomed. 17, 544–553.
Edwards, D. H., Heitler, W. J., and Krasne, F. B. (1999). Fifty years of a command neuron: the neurobiology of escape behavior in the crayfish. Trends Neurosci. 22, 153–161.
Heeger, D. J., and Ress, D. (2002). What does fMRI tell us about neuronal activity? Nat. Rev. Neurosci. 3, 142–151.
Herberholz, J., Mims, C. J., Zhang, X., Hu, X., and Edwards, D. H. (2004). Anatomy of a live invertebrate revealed by manganese-enhanced magnetic resonance imaging. J. Exp. Biol. 207, 4543–4550.
Lee, J. H., and Koretsky, A. P. (2004). Manganese enhanced magnetic resonance imaging. Curr. Pharm. Biotechnol. 5, 529–537.
Michaelis, T., Watanabe, T., Natt, O., Boretius, S., Frahm, J., Utz, S., and Schachtner, J. (2005). In vivo 3D MRI of insect brain: cerebral development during metamorphosis of Manduca sexta. Neuroimage 24, 596–602.
Pautler, R. G., and Fraser, S. E. (2003). The year(s) of the contrast agent – micro-MRI in the new millennium. Curr. Opin. Immunol. 15, 385–392.
Pautler, R. G., and Koretsky, A. P. (2002). Tracing odor-induced activation in the olfactory bulbs of mice using manganese-enhanced magnetic resonance imaging. Neuroimage 16, 441–448.
Pautler, R. G., Silva, A. C., and Koretsky, A. P. (1998). In vivo neuronal tract tracing using manganese-enhanced magnetic resonance imaging. Magn. Reson. Med. 40, 740–748.
Sandeman, D. C., Sandeman, R. E., and Aitken, A. R. (1988). Atlas of serotonin-containing neurons in the optic lobes and brain of the crayfish, Cherax destructor. J. Comp. Neurol. 269, 465–478.
Silva, A. C., Lee, J. H., Aoki, I., and Koretsky, A. P. (2004). Manganese-enhanced magnetic resonance imaging (MEMRI): methodological and practical considerations. NMR Biomed. 17, 532–543.
Van der Linden, A., Van Camp, N., Ramos-Cabrer, P., and Hoehn, M. (2007). Current status of functional MRI on small animals: application to physiology, pathophysiology, and cognition. NMR Biomed. 20, 522–545.
Watanabe, T., Schachtner, J., Krizan, M., Boretius, S., Frahm, J., and Michaelis, T. (2006). Manganese-enhanced 3D MRI of established and disrupted synaptic activity in the developing insect brain in vivo. J. Neurosci. Methods 158, 50–55.
Wine, J. J. (1984). The structural basis of an innate behavioral-pattern. J. Exp. Biol. 112, 283–319.
Keywords: manganese-enhanced magnetic resonance imaging, neuroanatomy, neural activity, crayfish
Citation: Herberholz J, Mishra SH, Uma D, Germann MW, Edwards DH and Potter K (2011) Non-invasive imaging of neuroanatomical structures and neural activation with high-resolution MRI. Front. Behav. Neurosci. 5:16. doi: 10.3389/fnbeh.2011.00016
Received: 01 March 2011;
Accepted: 18 March 2011;
Published online: 31 March 2011.
Edited by:
Kathleen A. French, University of California at San Diego, USAReviewed by:
Kathleen A. French, University of California at San Diego, USAJoachim Schachtner, Philipps-University Marburg, Germany
Copyright: © 2011 Herberholz, Mishra, Uma, Germann, Edwards and Potter. This is an open-access article subject to a non-exclusive license between the authors and Frontiers Media SA, which permits use, distribution and reproduction in other forums, provided the original authors and source are credited and other Frontiers conditions are complied with.
*Correspondence: Jens Herberholz, Department of Psychology, University of Maryland, College Park, MD 20742, USA. e-mail: jherberholz@psyc.umd.edu