Classification and prediction of cognitive trajectories of cognitively unimpaired individuals
 Young Ju Kim1,2†
  Si Eun Kim3†
  Alice Hahn4†
  Hyemin Jang1,2
  Jun Pyo Kim1,2,5
  Hee Jin Kim1,2 Duk L. Na1,2,6,7 Juhee Chin1,2* Sang Won Seo1,2,6,7,8,9,10*‡ on behalf of Alzheimer’s Disease Neuroimaging Initiative‡
- 1Department of Neurology, Samsung Medical Center, Sungkyunkwan University School of Medicine, Seoul, Republic of Korea
- 2Neuroscience Center, Samsung Medical Center, Seoul, Republic of Korea
- 3Department of Neurology, Haeundae Paik Hospital, Inje University College of Medicine, Busan, Republic of Korea
- 4Department of Mental Health, Johns Hopkins Bloomberg School of Public Health, Baltimore, MD, United States
- 5Center for Neuroimaging, Radiology and Imaging Sciences, Indiana University School of Medicine, Indianapolis, IN, United States
- 6Institute of Stem Cell and Regenerative Medicine, Seoul, Republic of Korea
- 7Samsung Alzheimer Research Center, Samsung Medical Center, Seoul, Republic of Korea
- 8Center for Clinical Epidemiology, Samsung Medical Center, Seoul, Republic of Korea
- 9Department of Health Sciences and Technology, Seoul, Republic of Korea
- 10Clinical Research Design and Evaluation, Samsung Advanced Institute for Health Sciences & Technology (SAIHST), Sungkyunkwan University, Seoul, Republic of Korea
Objectives: Efforts to prevent Alzheimer’s disease (AD) would benefit from identifying cognitively unimpaired (CU) individuals who are liable to progress to cognitive impairment. Therefore, we aimed to develop a model to predict cognitive decline among CU individuals in two independent cohorts.
Methods: A total of 407 CU individuals from the Alzheimer’s Disease Neuroimaging Initiative (ADNI) and 285 CU individuals from the Samsung Medical Center (SMC) were recruited in this study. We assessed cognitive outcomes by using neuropsychological composite scores in the ADNI and SMC cohorts. We performed latent growth mixture modeling and developed the predictive model.
Results: Growth mixture modeling identified 13.8 and 13.0% of CU individuals in the ADNI and SMC cohorts, respectively, as the “declining group.” In the ADNI cohort, multivariable logistic regression modeling showed that increased amyloid-β (Aβ) uptake (β [SE]: 4.852 [0.862], p < 0.001), low baseline cognitive composite scores (β [SE]: −0.274 [0.070], p < 0.001), and reduced hippocampal volume (β [SE]: −0.952 [0.302], p = 0.002) were predictive of cognitive decline. In the SMC cohort, increased Aβ uptake (β [SE]: 2.007 [0.549], p < 0.001) and low baseline cognitive composite scores (β [SE]: −4.464 [0.758], p < 0.001) predicted cognitive decline. Finally, predictive models of cognitive decline showed good to excellent discrimination and calibration capabilities (C-statistic = 0.85 for the ADNI model and 0.94 for the SMC model).
Conclusion: Our study provides novel insights into the cognitive trajectories of CU individuals. Furthermore, the predictive model can facilitate the classification of CU individuals in future primary prevention trials.
Introduction
Populations around the world are aging more rapidly, and aging-related health issues and diseases are projected to lead to greater societal and economic burdens (Patterson, 2018). As individuals age, they may experience progressive physiological (“normal”) cognitive decline, although each follows a unique trajectory (Deary et al., 2009). In particular, reductions in memory, conceptual reasoning, and processing speed are frequently observed in aged individuals (Committee on the Public Health Dimensions of Cognitive Aging et al., 2015). Pathological cognitive decline may occur due to Alzheimer’s disease (AD)-related processes, eventually resulting in mild cognitive impairment (MCI) due to AD or AD dementia (Mormino and Papp, 2018). The WHO reported in 2012 that about 150 million people will be impacted by dementia by 2050, with a consequent increase in the total costs of AD to over $1 trillion (Patterson, 2018). Therefore, early diagnosis and prevention are critical to reduce the burdens of AD. In particular, AD prevention may be improved by identifying cognitively unimpaired (CU) individuals who are liable to progress to cognitive impairment (Jack et al., 2018).
Previous studies of early AD diagnosis were based on hypothesis-driven analyses, in which researchers classified individuals into subgroups based on their hypothesis. In contrast, in trajectory analyses, individuals are classified into distinct subgroups or classes using a data-driven classification method (Nguena Nguefack et al., 2020). Trajectory analyses enable researchers to better characterize and understand intra- and inter-individual variability as well as to investigate the patterns of health outcomes in longitudinal data (Jung and Wickrama, 2008). In this regard, mixture modeling approaches, such as growth mixture modeling (GMM) and latent class growth analysis (LCGA), have been increasingly used to identify homogeneous subpopulations within a larger heterogeneous population and to identify meaningful classes (Jung and Wickrama, 2008). Group-based models have been applied to patients with cognitive impairments in order to identify developmental trajectories (David et al., 2016; Lee et al., 2018; Kim S. J. et al., 2022). However, there have been only a few studies applying trajectory analyses to CU individuals (Small and Bäckman, 2007; Min, 2018).
Previously, several factors have been found to influence the progression of CU to MCI or dementia (Rusinek et al., 2003; Chen et al., 2017; Mormino and Papp, 2018; Cho H. et al., 2020). Specifically, advanced age, reductions in baseline executive function, and smaller total brain volume were independently associated with the risk of conversion to MCI (Chen et al., 2017). In addition, CU individuals with the apolipoprotein E ε4 allele (APOE ε4), cerebral amyloid burdens, and cortical atrophy were more likely to progress to cognitive impairment (Rusinek et al., 2003; Mormino and Papp, 2018; Cho H. et al., 2020). While these study results are important, methods to translate such findings to clinical practice are needed in order to enable individualized prediction of cognitive decline.
As a prediction model for personalized application, the nomogram is a valuable tool. A nomogram is a chart describing the numerical relationships between diseases and risk factors and their graphical calculation (Kattan and Marasco, 2010). Based on the specific characteristics of patients or diseases, it is designed to help doctors and patients for risk assessment and predicting results of treatment (Tsikitis et al., 2016). Also, with its advantages of visual presentation and easy accessibility, nomogram can be easily used in busy clinical environments (Kim W. et al., 2016). Nomograms have been applied for more than a decade in oncology or cardiology. Nomograms are being developed and used more frequently in patients with cognitive deficits (Jang et al., 2017; Kim et al., 2018), but their development and application are lacking for CU individuals.
In the present study, we aimed to investigate the feasibilities of classification of cognitive trajectories of CU individuals in two independent cohorts with different genetic and sociocultural backgrounds. First, we determined if there were distinct growth patterns in the cognitive trajectories of the CU individuals by using mixture modeling in two independent cohorts. Second, we evaluated the features that significantly impact the classification of latent class. We hypothesized that there might be differences in the effects of features on the classification between the two datasets because participants of the two datasets have different genetic and sociocultural backgrounds. Finally, using these features, we developed a predictive model for cognitive decline in CU individuals and a nomogram to visualize risk probability.
Materials and methods
Clinical data collection
We collected the data from two independent cohorts. Data used for the preparation of the current study were obtained from the ADNIMERGE dataset of the Alzheimer’s Disease Neuroimaging Initiative (ADNI) database (adni.loni.usc.edu) (n = 407) and from the Samsung Medical Center (SMC) (n = 285).
The ADNI was launched in 2003 as a public-private partnership, led by principal investigator Michael W. Weiner, MD. The primary purpose of the ADNI is to test whether serial magnetic resonance imaging (MRI), positron emission tomography (PET), other biological markers, and clinical or neuropsychological assessments, can be combined to evaluate the progression of MCI and early AD. For up-to-date information, see www.adni-info.org. Participants from the ADNI-1 to ADNI-3 and ADNI GO were included in the current study if (1) their baseline diagnosis was CU or subjective memory complaints, (2) they had valid cognitive assessments, and (3) they had at least two follow-up assessments of cognitive function. The baseline diagnoses were determined using the standard criteria described in the ADNI procedure manuals.1 As a result, a total of 407 individuals met these qualifications to be included in the current study. All individuals had usable neuropsychological data, and 352 individuals had hippocampal volumetric data.
In addition, 285 CU individuals were recruited from the SMC. These patients also had usable neuropsychological data, and 231 individuals had hippocampal volumetric data. They underwent amyloid PET scans at the SMC between September 2015 and December 2021, and were followed up at least twice through clinical interviews and thorough cognitive tests until December 2021. The following were used to establish the baseline diagnostic criteria for CU: (i) the Korean Mini-Mental State Examination (K-MMSE) ≥24 or above −1.5 SD from the age-, gender-, and education-adjusted norms if education level was <9 years; (ii) above −1 SD from the age-, gender-, and education-adjusted norms on the delayed recall of the Seoul Verbal Learning Test-Individuals version (SVLT-E); (iii) above −2 SD from the age-, gender-, and education-adjusted norms on the Korean version of the Boston Naming Test (K-BNT), the Rey-Osterrieth Complex Figure Test (RCFT) copy, and the Korean Color Word Stroop Test (K-CWST) color reading; and (iv) absence of other neurological diseases.
Standard protocol approval, registration, and patient consent
The authors obtained approval from the ADNI Data Sharing and Publications Committee for data use and publication. No Institutional Review Board (IRB) review approval was required to use de-identified ADNI data that is available for download. All methods were carried out in accordance with the approved guidelines. At the SMC, the IRB approved the use of SMC data for this study, and all of the methods used were carried out in compliance with the approved standards.
Acquisition of neuroimaging data
The current study employed the following neuroimaging data from the ADNIMERGE dataset: average AV45 standardized uptake value ratios (SUVRs) of the frontal cortex, parietal cortex, anterior cingulate cortex and precuneus relative to the cerebellum, and the hippocampal volume (HV). The detailed protocols for image acquisition have been described in previous studies (Jagust et al., 2010) and the ADNI database.2 Cortical reconstruction and volumetric segmentation were performed using the FreeSurfer image analysis program (Hartig et al., 2014).3
For SMC data, all individuals underwent either FBB or FMM PET scans at the SMC using a Discovery STe PET/CT scanner (GE Medical Systems, Milwaukee, WI, USA) in 3D scanning mode to examine 47 slices of 3.3-mm thickness spanning the entire brain (Kim et al., 2018; Jang et al., 2019). In our previous study, we used a direct comparison Centiloid units (dcCL) conversion equation to directly convert the SUVR values of the FBB or FMM cortical target volume of interest (CTX VOI) into dcCL units (Klunk et al., 2015; Cho S. H. et al., 2020). The conversion was performed using equations for the FBB (dcCLFBB = 151.42 × dcSUVRFBB − 142.24); and the FMM (dcCLFMM = 148.52 × dcSUVRFMM − 137.09) PET. All individuals also underwent 3D T1-weighted turbo field echo MRI at SMC using a 3.0-T MRI scanner (Philips 3.0T Achieva; Philips Healthcare, Andover, MA, USA) as previously described (Kim H. J. et al., 2016). Images were processed using the CIVET anatomical image-processing pipeline (version 2.1.0) (Zijdenbos et al., 2002). We calculated the intracranial volume (ICV) by measuring the total volume of the voxels within the brain mask (Smith, 2002). The FMRIB (Functional Magnetic Resonance Imaging of the Brain) Software Library (FSL) method was used to create brain masks. Since cortical surface models were extracted from brain MRI volumes transformed into stereotaxic space, cortical thickness was assessed in the native space by applying an inverse transformation matrix to the cortical surfaces and rebuilding them in native space (Im et al., 2006). To measure HV, we employed a computerized hippocampus segmentation technique that combined graph-cut optimization, atlas-based segmentation, and morphological opening (Kwak et al., 2013).
Neuropsychological assessments
The current study used the ADNI-modified Preclinical Alzheimer Cognitive Composite with the Trail-Making Test, Part B time to completion (mPACCtrt) as the cognitive endpoint from the original ADNIMERGE dataset. The PACC was developed as an outcome measure of cognitive changes in preclinical AD (Donohue et al., 2014). The original version includes (a) the total recall score of the Free and Cued Selective Reminding Test (FCSRT), (b) the delayed recall score of the Logical Memory IIa (LM), (c) the Digit Symbol Substitution score from the Wechsler Adult Intelligence Scale revised version (DSST), (d) Mini-Mental State Examination (MMSE) total score. Because the FCSRT was not included in the ADNI battery, the FCSRT was replaced by the delayed recall of the Alzheimer’s Disease Assessment Scale (ADAS) in the mPACCtrt. Also, we used the Trail-Making Test, Part B (TMT-B) instead of the DSST (Donohue et al., 2014). As a result, the mPACCtrt consisted of (a) ADAS-cognitive subscale delayed word recall, (b) logical memory delayed recall, (c) the MMSE total score, and (d) (log-transformed) trail-making test time to completion. The composite score was the sum of the z-scores of each constituent test, which were based upon the mean and standard deviations of the baseline scores of the CU individuals in the ADNI (Donohue et al., 2014, 2017).
For the SMC dataset, the Longitudinal Amyloid Cognitive Composite in Preclinical AD (LACPA) was used. The LACPA was developed for longitudinal tracking of amyloid-β (Aβ)-related cognitive decline in CU individuals using well-characterized and relatively large Korean CU cohorts (Kim Y. J. et al., 2022). The LACPA equation is as follows:
where IR is the immediate recall, DR is the delayed recall, K-TMT-B is the Korean Trail-Making Test Part B and Z is the z-score.
Statistical analyses
We used mixture modeling to test for distinct growth patterns in the cognitive trajectories of the CU individuals. Mixture modeling generally uses categorical latent variables representing the composition of a subpopulation, in which case the members of the subpopulation are unknown and inferred from the data (Wang and Bodner, 2007). In mixture modeling using longitudinal data, unperceived heterogeneity is captured through categorical and continuous latent variables (Wang and Bodner, 2007). We used mixture modeling with GMM and the LCGA for the ADNI dataset and SMC datasets, respectively. The LCGA is a special type of GMM that limits the variance and covariance estimates for growth factors within each class to zero (Jung and Wickrama, 2008). To determine the adequate number of latent classes, we compared the following four methods: Bayesian information criterion (BIC) (Schwarz, 1978); Akaike information criterion (AIC) (Akaike, 1974); Lo, Mendell, Rubin test (LMR) (Lo et al., 2001); and parametric bootstrapped likelihood ratio test (BLRT) (McLachlan and Peel, 2000). After determining the number of latent classes, the baseline characteristics of the latent classes were analyzed using the independent t-test and the Chi-square test.
To investigate the effects of variables on the cognitive trajectory group based on the mPACCtrt score derived from the ADNI dataset, we performed multivariable logistic regression analyses, which include AV45 SUVR, baseline mPACCtrt score, and HV associated with covariates including age, gender, education level, APOEε4. In addition, to determine the effects of variables on the cognitive trajectory group based on the LACPA score derived from the SMC dataset, we conducted multivariable logistic regression analyses, which include dcCL, baseline LACPA score, and HV associated with covariates including age, gender, education level, and APOE ε4 (Figure 1). The HV was used as the value divided by the ICV (HV/ICV) to consider the cranial cavity. The corrected HV was multiplied by 1,000, because of the relatively small scale. The dcCL was used as the value divided by 100.
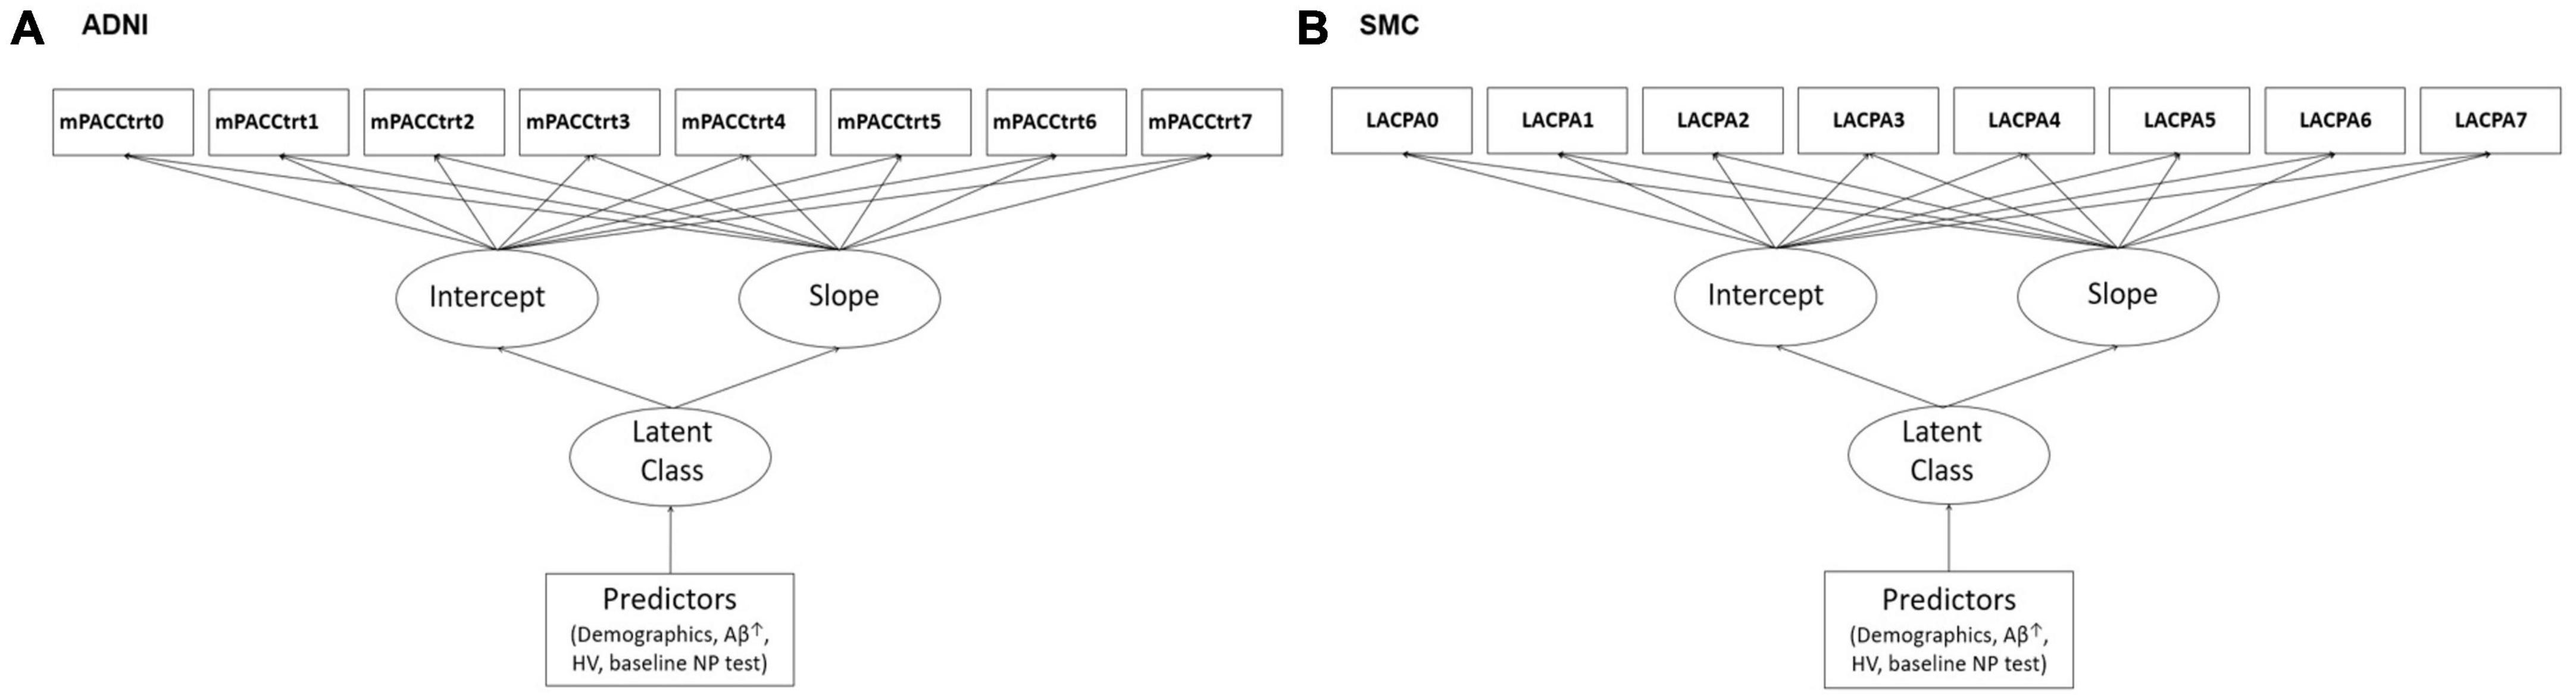
Figure 1. Illustrations of the study models including predictors in the latent growth mixture modeling in (A) ADNI and (B) SMC. ↑AV45 SUVR in ADNI and dcCL in SMC. ADNI, Alzheimer’s Disease Neuroimaging Initiative; SMC, Samsung Medical Center; mPACCtrt, modified Preclinical Alzheimer’s Cognitive Composite with Trail-Making Test, Part B; LACPA, Longitudinal Amyloid Cognitive Composite in Preclinical AD; HV, hippocampal volume; NP, neuropsychological.
After developing the predictive models, we constructed a nomogram using the dataset. We assigned a point value to each variable using the beta coefficients from the logistic regression model. Then, the most powerful variable was set at 100 points, while other variables were assigned between 0 and 100 points based on their proportions. The total points summed by the scores corresponding to each variable were immediately converted to risk probability. Finally, the predictive accuracy of the nomogram was verified by discrimination (C-index) and calibration.
Mplus version 8.3 was used for the GMM, and the LCGA (Muthén and Muthén, 2019). Full information maximum likelihood (FIML) estimation was employed for the missing values found in the longitudinal data. R 4.0.3 (Vienna, Austria4) was used for the logistic regression analyses and to develop the nomogram.
Data availability
The datasets used and/or analyzed during the present study are available from the corresponding authors on reasonable request.
Results
Demographic characteristics
The baseline demographic characteristics of the CU individuals included in the ADNI and SMC datasets are shown in Table 1. The mean age of the individuals was 73.2 years in the ADNI dataset and 70.7 years in the SMC dataset (p < 0.001). The proportion of APOE ε4 carriers was 30.2 and 29.8% in the ADNI dataset and the SMC dataset, respectively. The proportion of females was 53.8% in the ADNI dataset and 61.8% in the SMC dataset (p = 0.038).
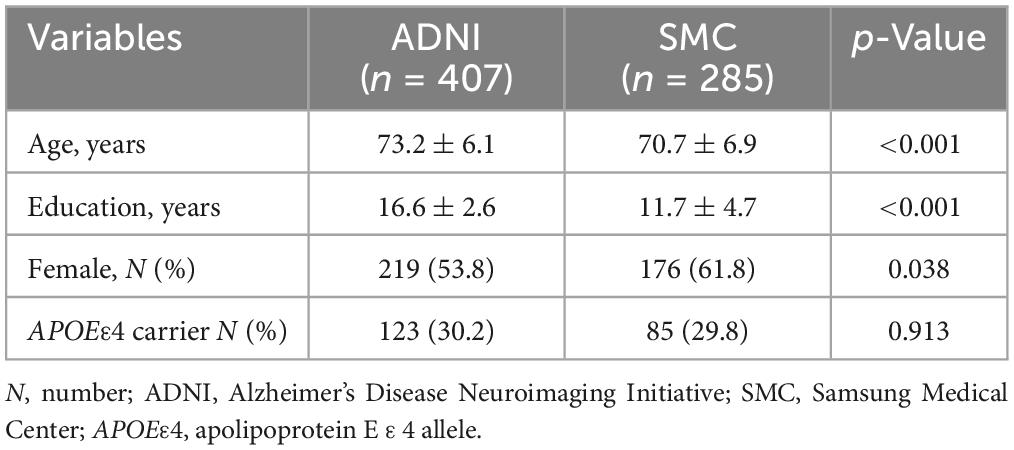
Table 1. Baseline demographic and neuropsychological characteristics of the study participants.
Identifying distinguishable trajectory subgroups
For the ADNI dataset, to explore the number of latent class, BIC, adjusted BIC and AIC values were compared as we increased the number of classes to determine the appropriate model. Then, we compared the models using the LMR and BLRT (Table 2). Although the three-class model exhibited smaller AIC and adjusted BIC values, the two-class model had the smallest BIC value. Moreover, the difference between these values when obtained from the two- and three-class models was minimal compared to the difference for the one- and two-class models. This finding indicated that the two-class model was an appropriate model. To determine whether the two- or three-class model was better, we also used the LMR and BLRT. The LMR comparing the two- and three-class models indicated the two-class model was better (p = 0.014), and the BLRT result also supported the two-class model (p < 0.001). Considering these results comprehensively, we decided that the two-class model would be adequate for the final model. Its entropy (the quality of the classification) was high at 0.79. For the SMC dataset, the LMR comparing the one-, two-, and three-class models indicated that the two-class model was better (p = 0.018), and the BLRT result also supported the two-class model (p < 0.001). Considering these results comprehensively, we again decided that the two-class model would be adequate for the final model. Its entropy, the quality of the classification, was high at 0.861.
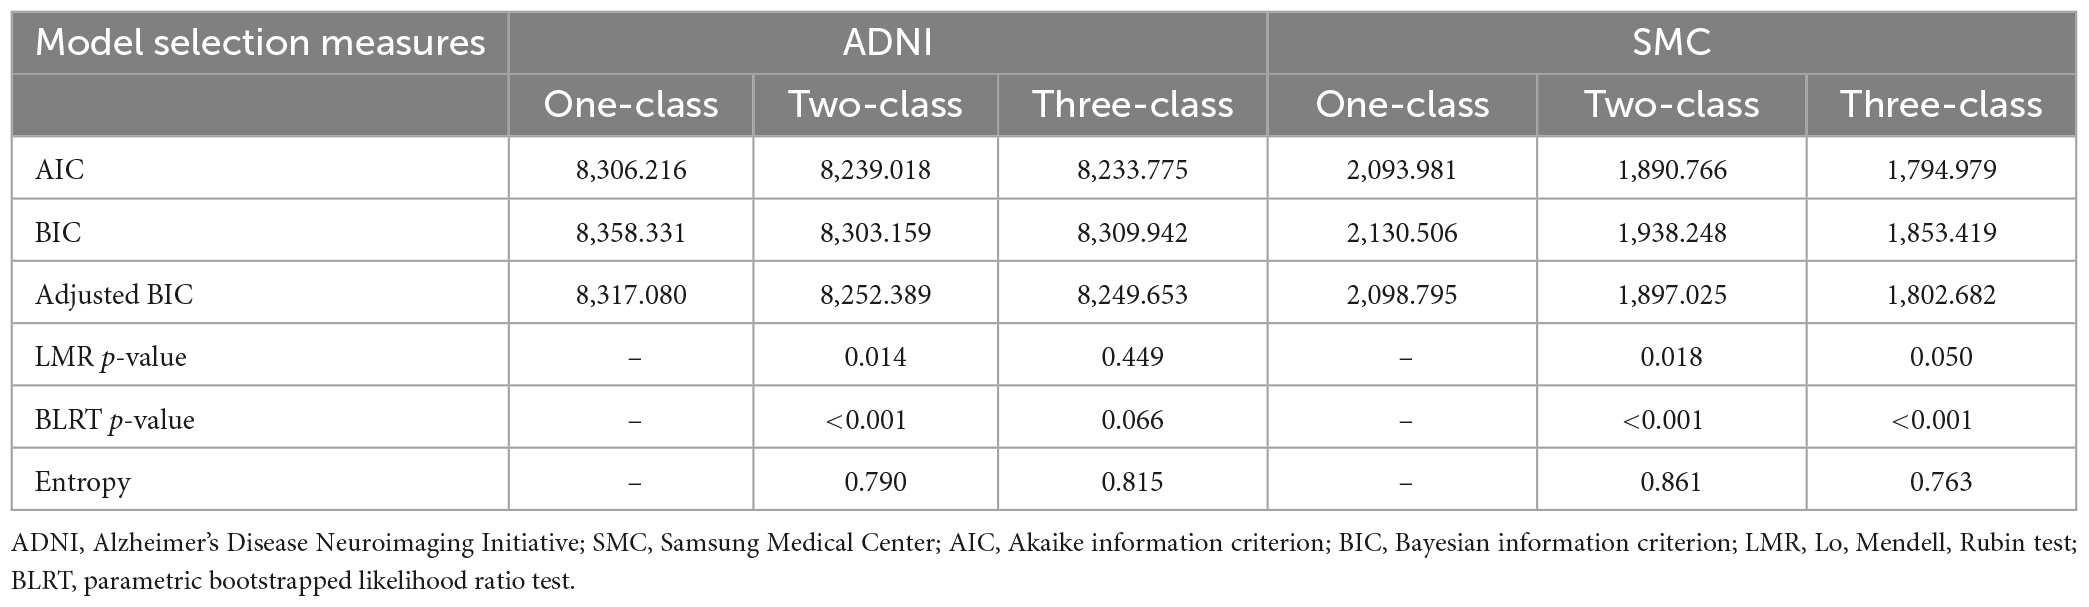
Table 2. Fitting information for the growth mixture models of cognitive trajectories from the ADNI and SMC cohort datasets.
Figure 2 shows the cognitive trajectories of the two-class model using the PACC and LACPA for the ADNI and SMC datasets, respectively. In the ADNI dataset, Class 1, in which the estimated class percentage was 86.2%, was a group whose cognitive function remained stable for 7 years (intercept = 0.479, SE = 0.148, p = 0.001; slope = −0.012, SE = 0.027, p = 0.649). Class 2, in which the estimated class percentage was 13.8%, showed cognitive decline during the same period (intercept = −1.058, SE = 0.534, p = 0.047; slope = −1.262, SE = 0.088, p < 0.001). Thus, we identified Class 1 a “stable group” and Class 2 as a “declining group” (Figure 2A). The same trajectory subgroups were also identified in CU individuals of the SMC dataset. Class 1, in which the estimated class percentage was 87.0%, was a group whose cognitive function remained stable for 7 years (intercept = 0.257, SE = 0.045, p < 0.001; slope = −0.060, SE = 0.023, p = 0.008). Class 2, in which the estimated class percentage was 13.0%, showed cognitive decline during the same period (intercept = −0.734, SE = 0.180, p < 0.001; slope = −0.424, SE = 0.075, p < 0.001) (Figure 2B).
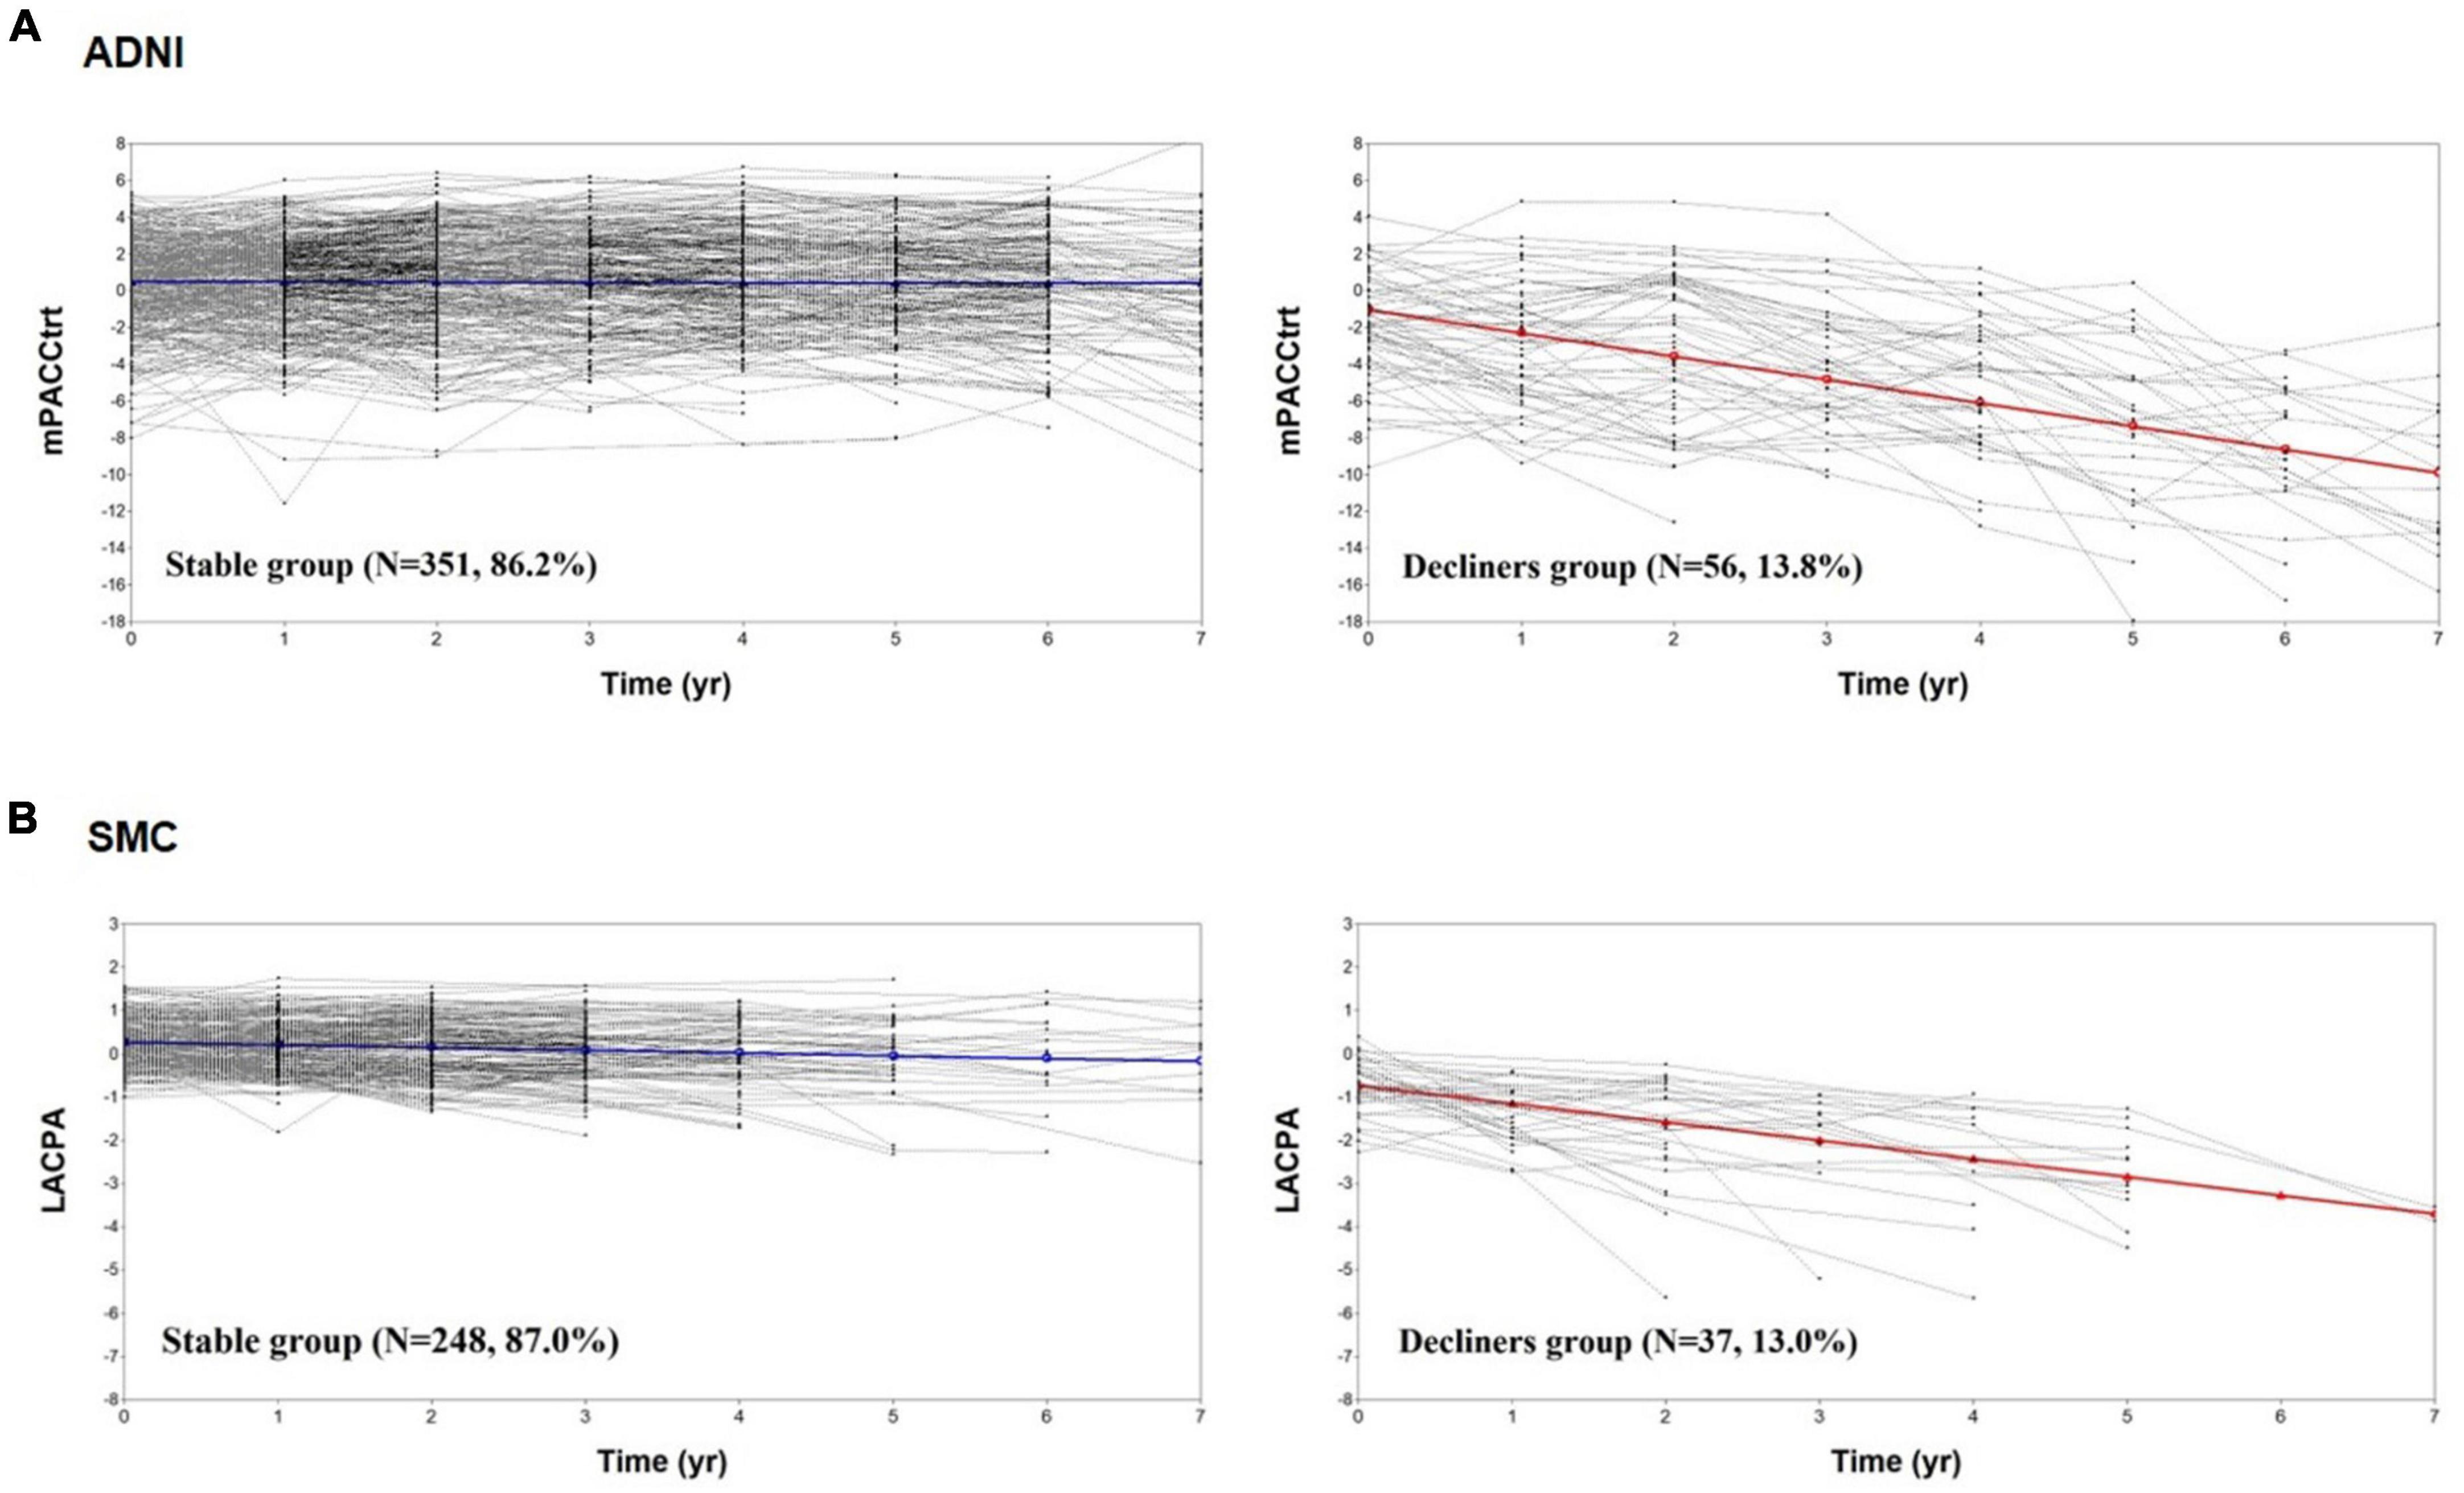
Figure 2. The cognitive trajectories of the two-class model. The mPACCtrt (A) and LACPA (B) for the two-class unconditional growth mixture modeling solution. ADNI, Alzheimer’s Disease Neuroimaging Initiative; SMC, Samsung Medical Center; mPACCtrt, modified Preclinical Alzheimer’s Cognitive Composite with Trail-Making Test, Part B; LACPA, Longitudinal Amyloid Cognitive Composite in Preclinical AD; N, number; yr, year.
Comparisons of the clinical characteristics of the trajectory subgroups
The baseline characteristics of the two trajectory groups in the ADNI dataset (351 stable and 56 decliners), and the SMC dataset (248 stable and 37 decliners) are shown in Table 3. The data analyses indicated there were significant predictive factors among the demographic variables and biomarkers at baseline identifying individuals who were at risk of cognitive decline among the two cohorts. The mean age was higher in the decliners than in the stable groups of both datasets (t-test; ADNI p < 0.001; SMC p = 0.032). The years of education and gender distribution did not significantly differ between the two groups. The presence of APOEε4 was more frequent among decliners than in the stable group (Chi-square test; ADNI p = 0.028; SMC p = 0.021). In a comparison of biomarkers including Aβ and HV, Aβ uptake was higher in the decliners than in the stable group (t-test; ADNI p < 0.001; SMC p < 0.001). In terms of the HV, it was lower in the decliners than in the stable group in ADNI, whereas there was no significant difference between the two groups in the SMC dataset (t-test; ADNI p < 0.001; SMC p = 0.063). The baseline neuropsychological composite score was lower in the decliners than in the stable group in both datasets (t-test; ADNI p < 0.001; SMC p < 0.001).
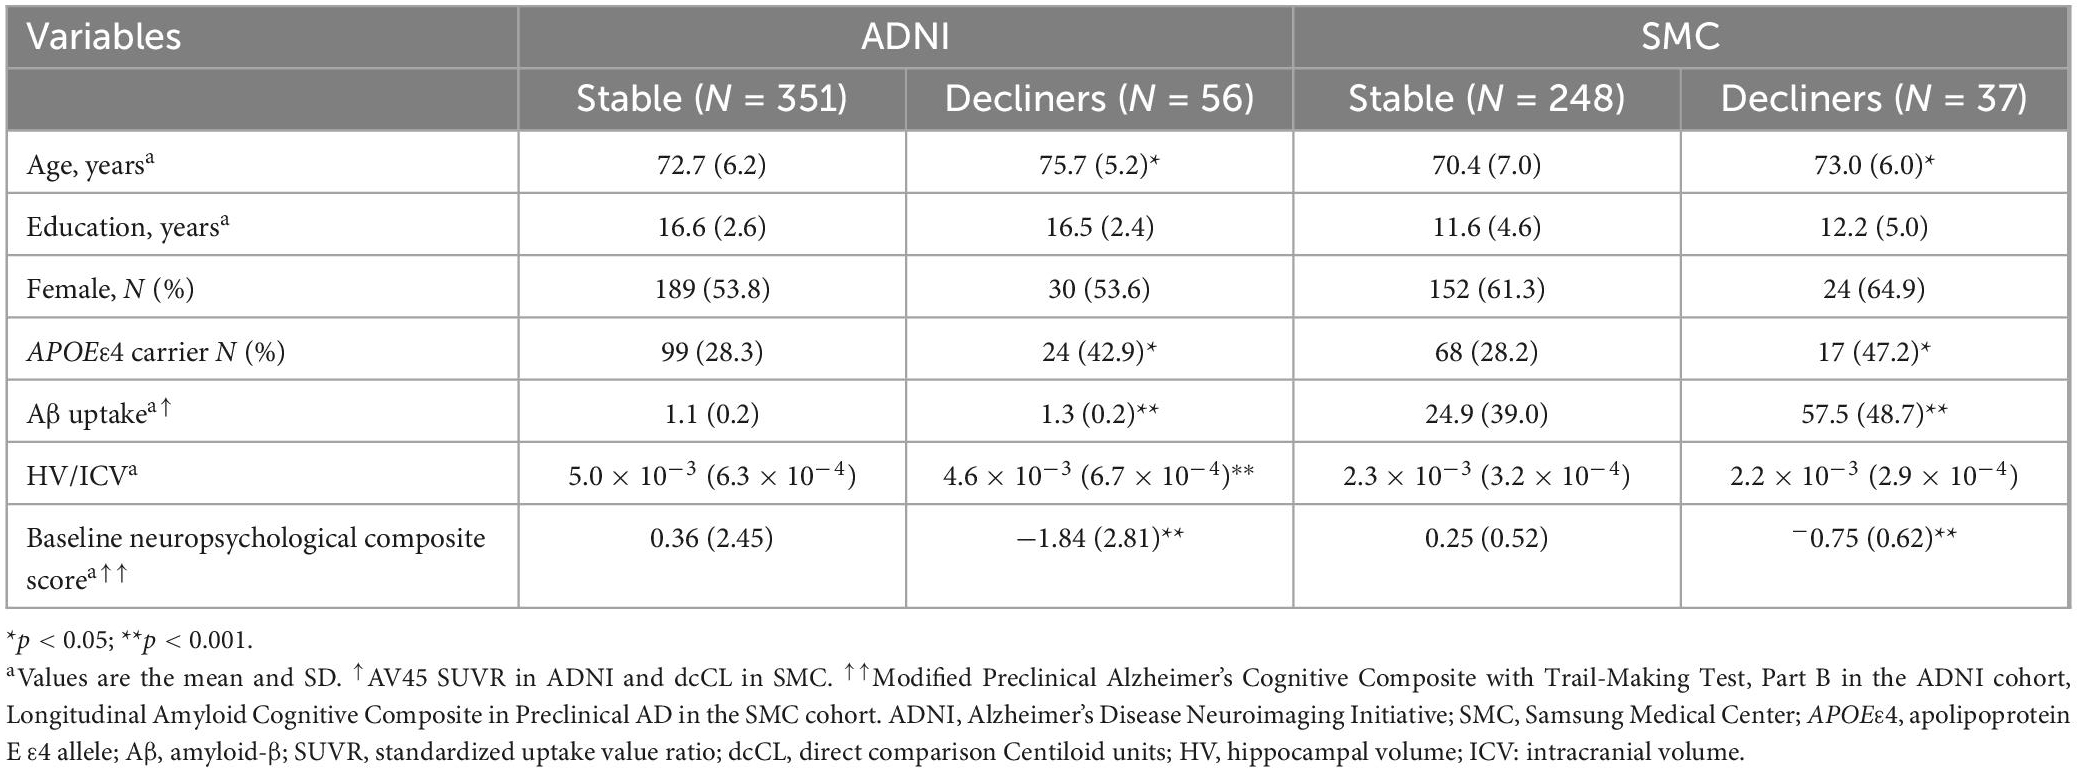
Table 3. Baseline demographic and neuropsychological characteristics of the individuals assigned to each latent class.
Development of the predictive model
Multivariable logistic regression was used to analyze the associations between cognitive decline and potential predictors. Table 4 shows the significant measures predicting cognitive decline. In the model using the ADNI dataset, the multivariable logistic regression model showed that Aβ uptake, baseline neuropsychological composite score and HV were predictive of being included in the cognitive decline group. Increased Aβ uptake (β [SE]: 4.852 [0.862], p < 0.001), lower baseline neuropsychological composite score (β [SE]: −0.274 [0.070], p < 0.001), and lower HV (β [SE]: −0.952 [0.302], p = 0.002) were significantly correlated with greater likelihood of being included in the cognitive decline group. The predictive performance (C-index) in the ADNI model was 0.85 (Table 4). In the model using the SMC dataset increased Aβ uptake (β [SE]: 2.007 [0.549], p = 0.007) and lower baseline neuropsychological composite scores (β [SE]: −4.464 [0.758] p < 0.001) were significantly correlated with greater risk probability. The C-index in the SMC model was 0.94. In addition, gender (β [SE]: 0.517 [0.386], p = 0.180) in ADNI data, age (β [SE]: 0.081 [0.039], p = 0.038) and gender (β [SE]: 1.093 [0.532], p = 0.040) in SMC data were also statistically significant variables when the p-value is based on 0.2, although the statistical significance is lower than other variables (Table 4).
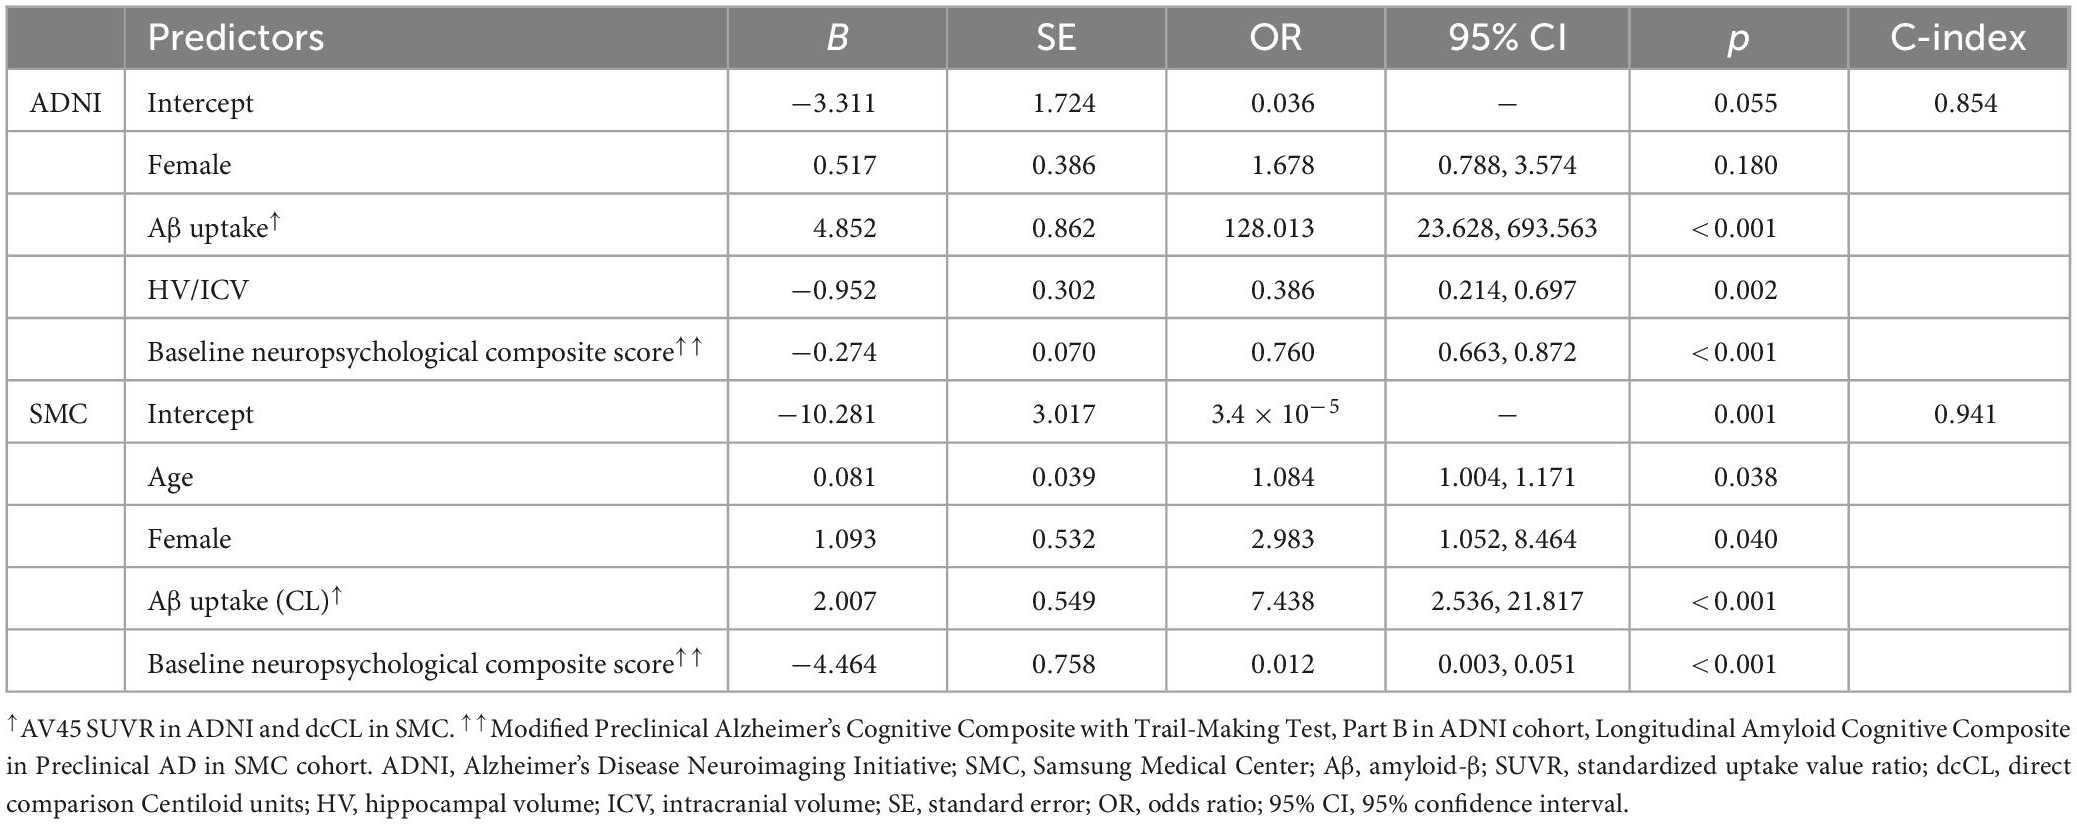
Table 4. Multivariable logistic regression for the predictive model.
We then constructed nomograms based on the multivariable logistic regression results (Figure 3). The total points were calculated from the sum of each point, and the risk probability was calculated from the total points. The probability in our nomograms referred to risk probability of being assigned to a cognitive decline group. The bias-corrected calibrated values were generated from validations based on 1,000 bootstrap resamples. The non-parametric calibration curves revealed that the bias-corrected calibration plots were close to the 45° line, indicating the nomograms are well calibrated (Supplementary Figure 1).
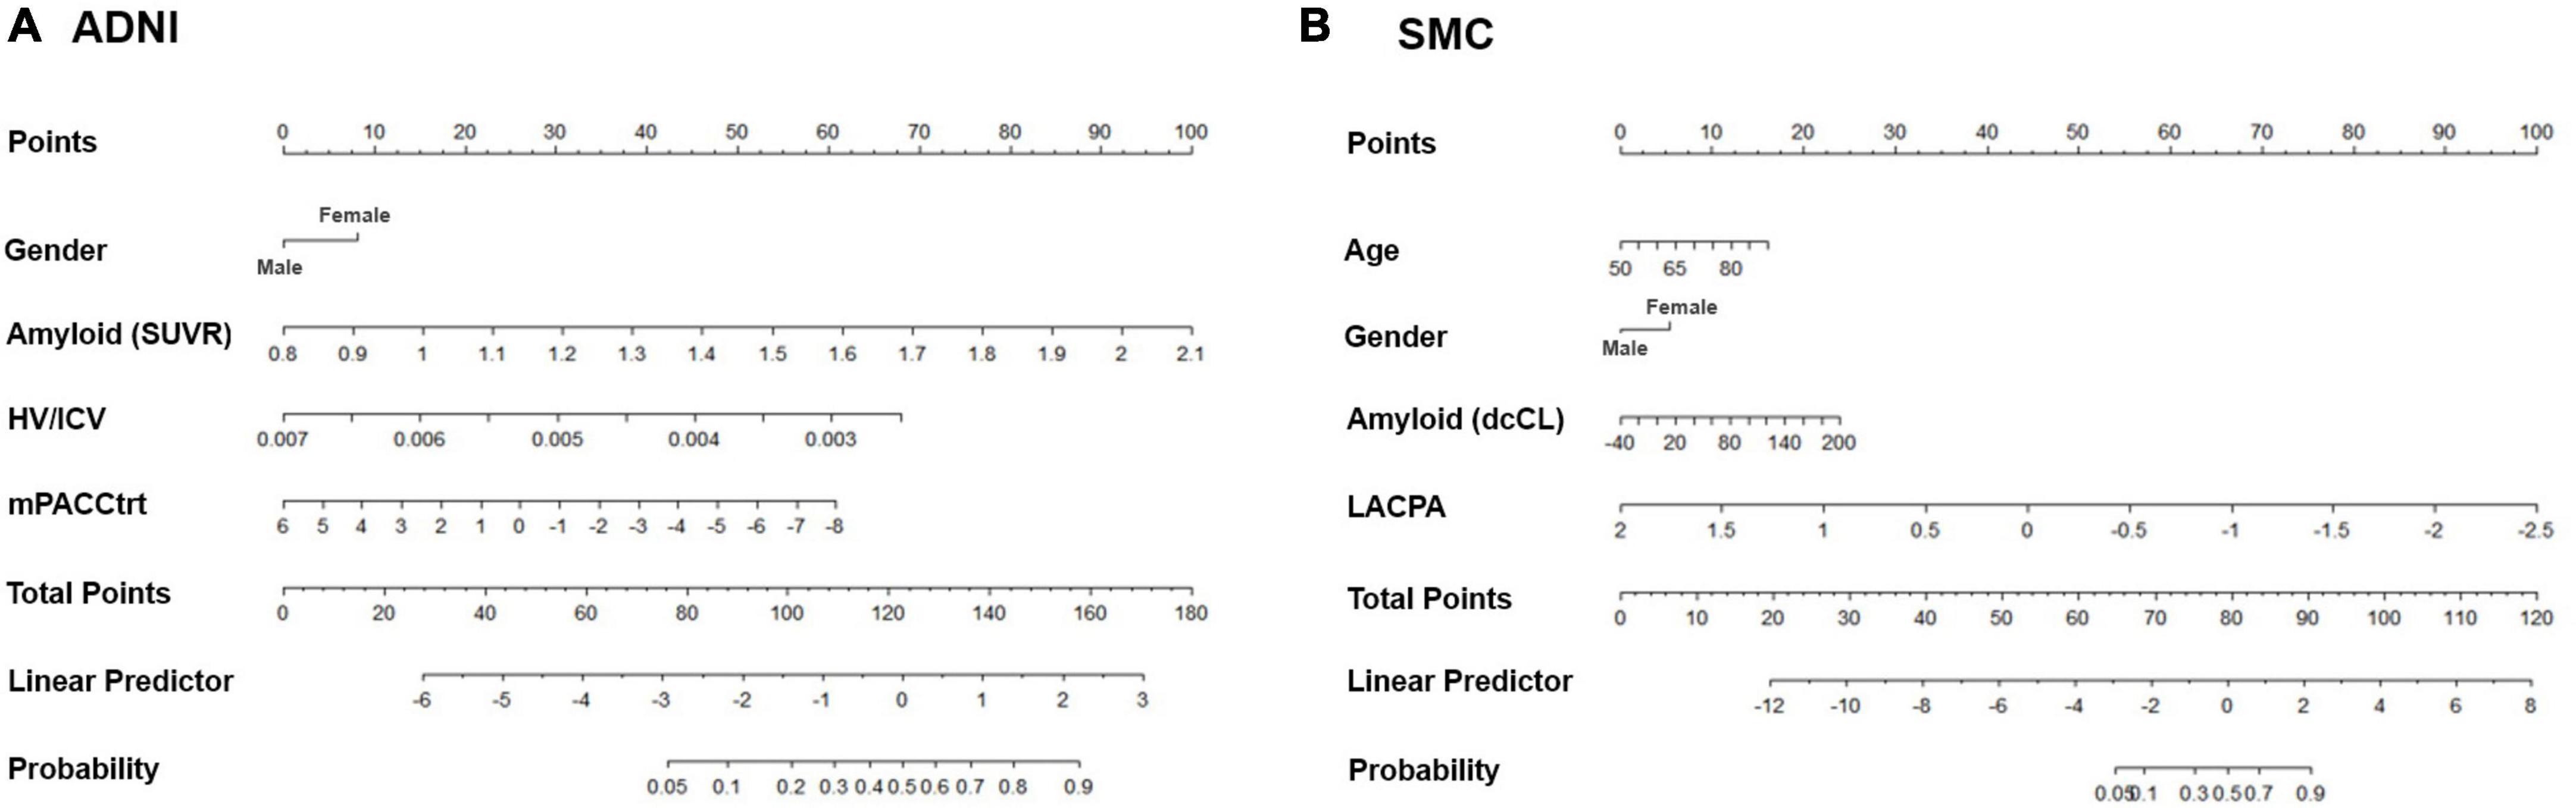
Figure 3. Nomograms predicting the cognitive decline of the cognitively unimpaired individuals in (A) ADNI and (B) SMC. Age (only in SMC), gender, amyloid uptake, hippocampal volume (only in ADNI), and baseline neuropsychological composite score are variables that significantly and independently affected the cognitive trajectory of the cognitively unimpaired individuals. Using odd ratios from the regression model, each variable was assigned points. The total points from all variables indicated the probability of the declining group in the nomogram. ADNI, Alzheimer’s Disease Neuroimaging Initiative; SMC, Samsung Medical Center; SUVR: standardized uptake value ratio; dcCL: direct comparison Centiloid units; HV, hippocampal volume; ICV, intracranial volume; mPACCtrt, modified Preclinical Alzheimer’s Cognitive Composite with Trail-Making Test, Part B; LACPA, Longitudinal Amyloid Cognitive Composite in Preclinical AD.
Visualization of the predictive model
Finally, we visualized the risk score of each predictor and the predicted probability of belonging to a trajectory group using the predictive model (Figure 4). Specifically, for a woman with an AV45 SUVR of 1.5, HV/ICV of 0.004 and an mPACCtrt of −2, the risk scores of all predictors are 142, so the probability of belonging to the declining group was estimated to be 77.2%.
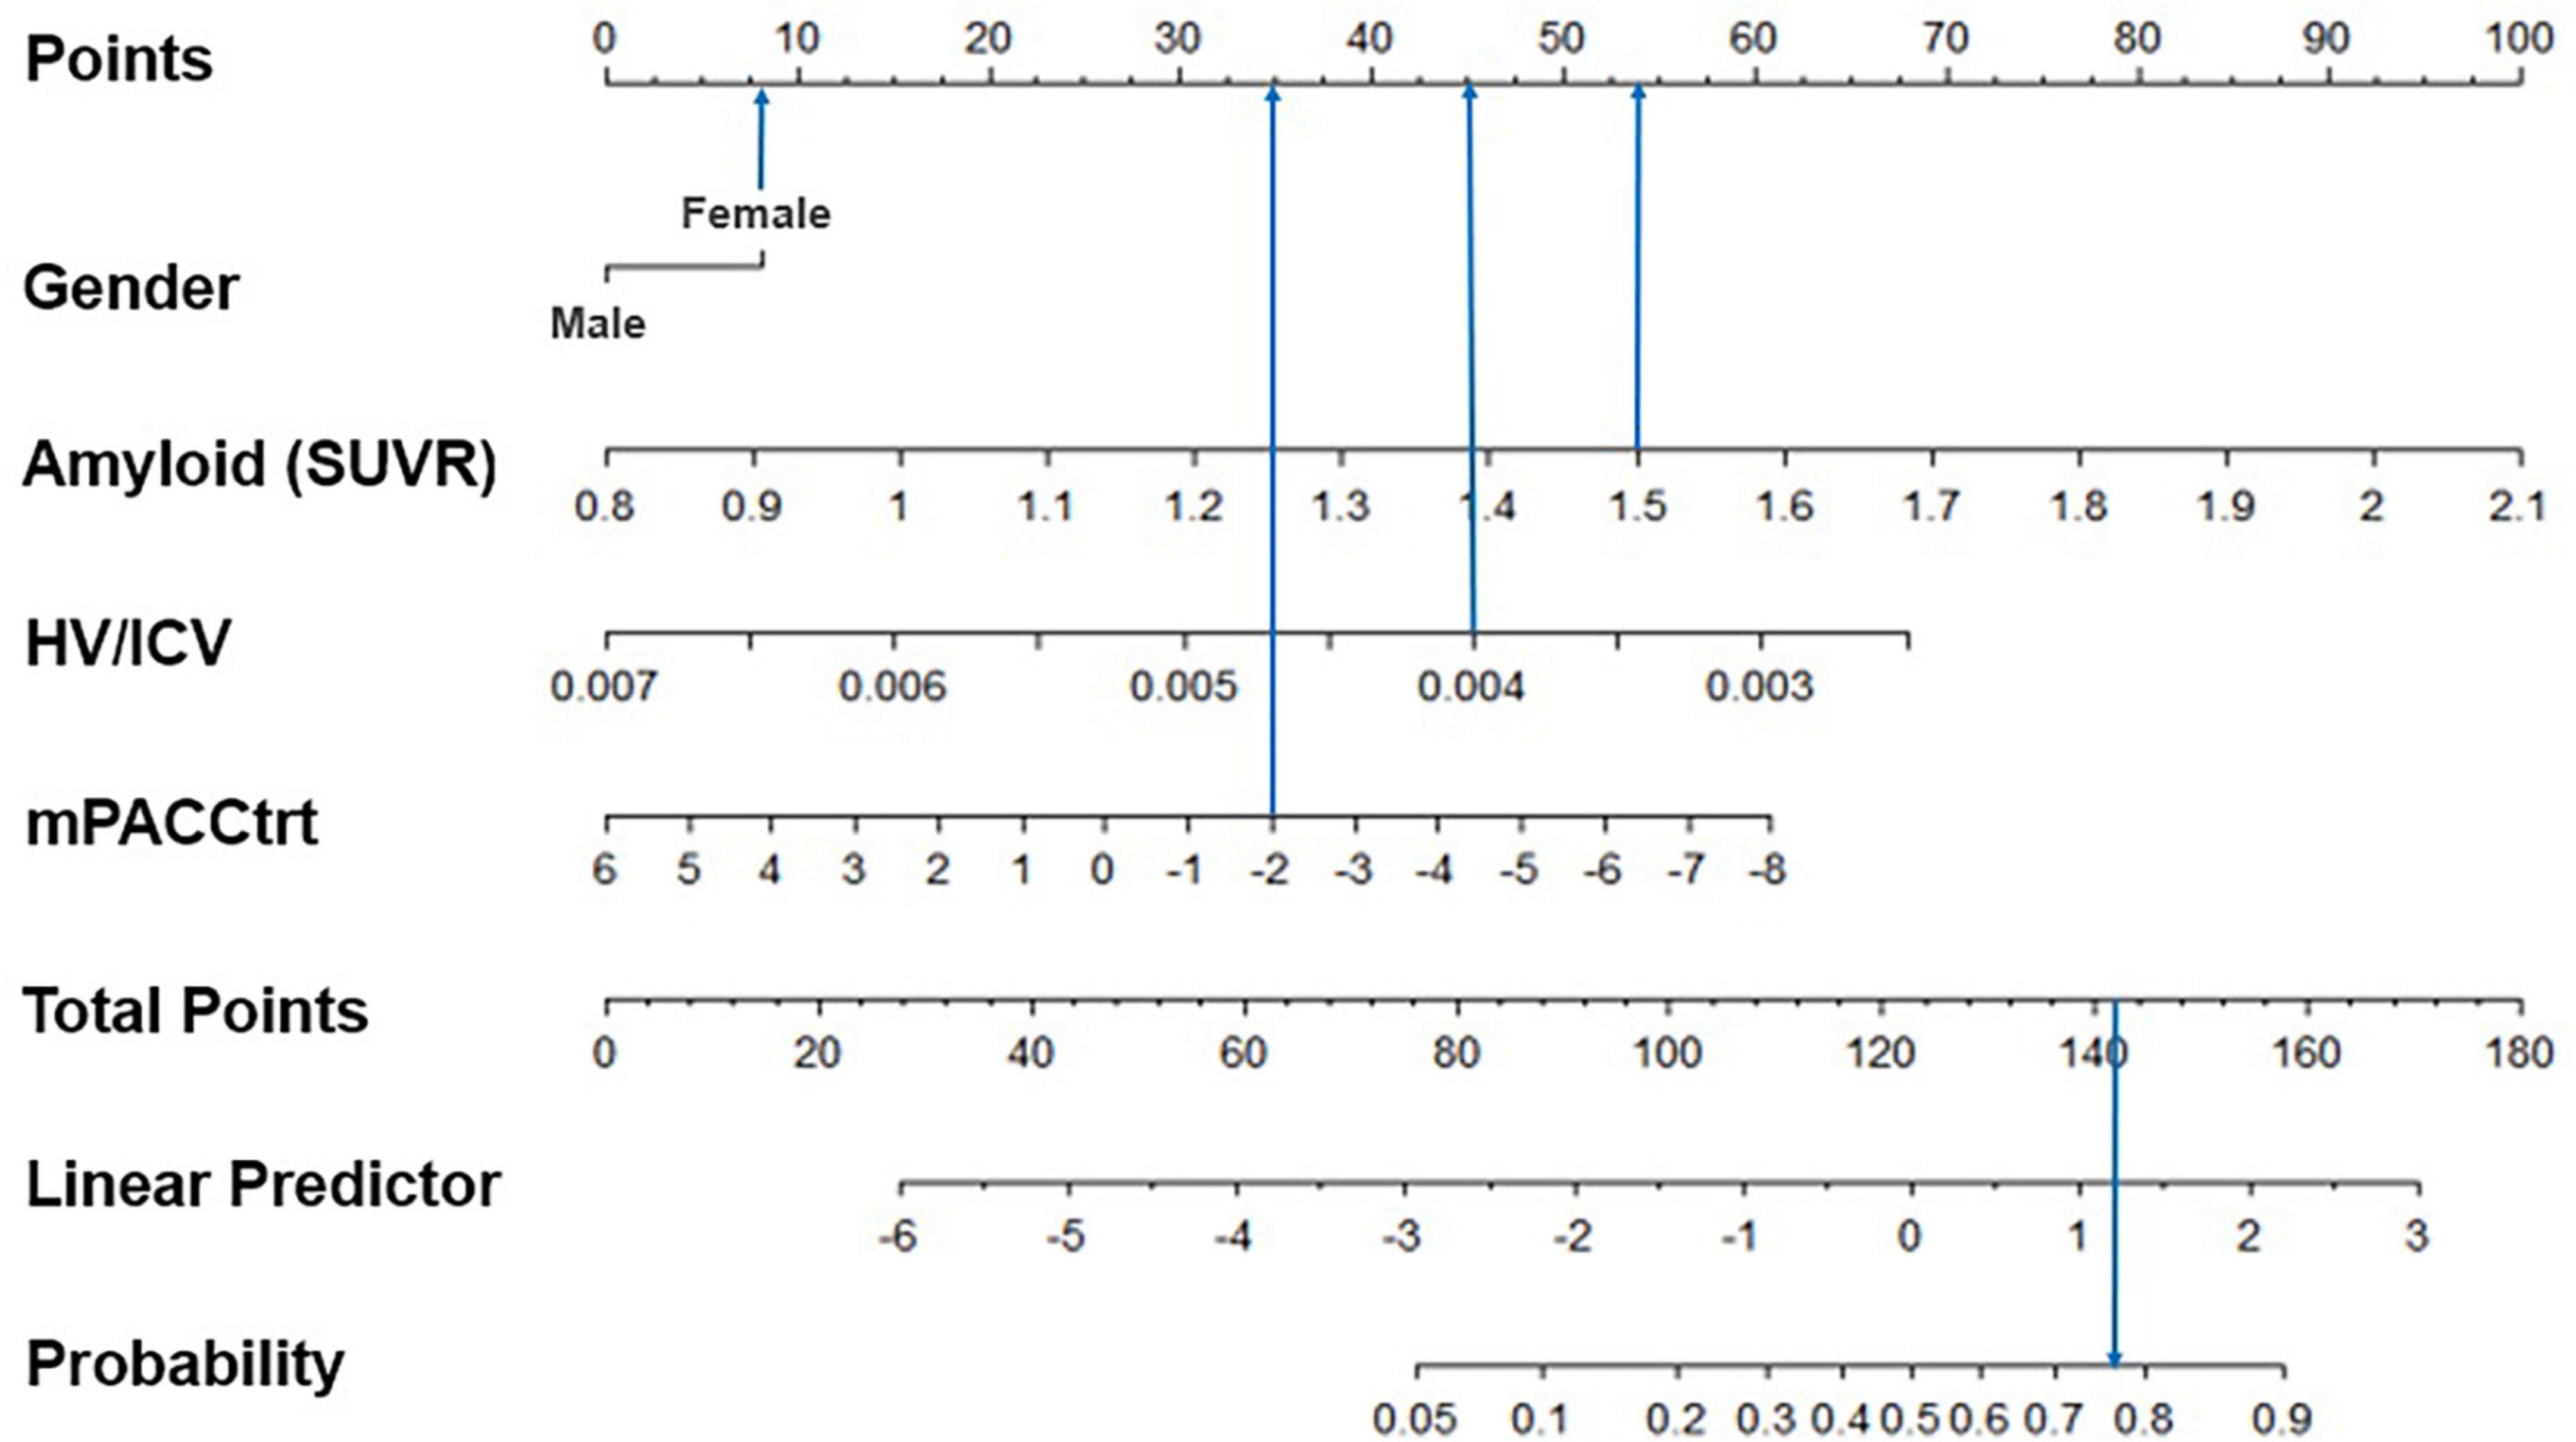
Figure 4. Example of the graphical representation of the model predictors. The subject was a woman with an AV45 SUVR of 1.5, HV/ICV of 0.004, and an mPACCtrt of –2. As a result, her total score was 142 and the model predicted her corresponding probability of cognitive decline would be 77.2%. SUVR, standardized uptake value ratio; HV, hippocampal volume; ICV, intracranial volume; mPACCtrt, modified Preclinical Alzheimer’s Cognitive Composite with Trail-Making Test, Part B.
Discussion
In the present study, we explored the cognitive trajectories of CU individuals in two independent cohorts identified from the ADNI and SMC datasets. Our major findings were as follows. First, 13.8% of the CU individuals in the ADNI dataset were classified in the declining group, which was similar to the proportion of the decliners in the SMC dataset. Second, increased amyloid uptake, lower baseline neuropsychological composite score, and decreased HV (only in ADNI) were predictive of being classified within the declining group. Finally, predictive models of cognitive decline showed fair to good discrimination and calibration capabilities. Taken together, our analysis provided novel insights into the different cognitive trajectories of CU individuals. Furthermore, the predictive model may facilitate the classification of CU individuals, and could be employed in future primary prevention trials.
Our first major finding was that 13.8% of the CU individuals in the ADNI dataset were classified to the declining group, similar to the results for the SMC dataset. Regarding the conversion from CU to MCI, a previous study revealed that clinic-based sample populations demonstrated an annual conversion rate of 30% (95% CI 17–54%) per person-year, and the community-based sample population demonstrated a conversion rate of 5% (95% CI 3–6%) per person-year (Chen et al., 2017). In another study, 6.7% of CU individuals converted to MCI within a mean of 13.1 months (Fernandez-Blazquez et al., 2016). While previous studies used the binary classification of conversion of CU to MCI, our study employed a data-driven classification to the CU based on longitudinal cognitive performance rather than on a priori classifications. A previous study using the mixture modeling showed that 6.7% of CU were classified into the declining group (Min, 2018). This discrepancy might be explained by the differences in neuropsychological test measurements between the previous study and our study. Previous studies used the MMSE (Small and Bäckman, 2007; Min, 2018), and this measure may not be sensitive enough to detect subtle cognitive changes in CU. However, our study used cognitive composites that are sensitive enough to detect subtle cognitive changes in CU, such as the PACC for the ADNI dataset and the LACPA for the SMC dataset. These two composite scores assess episodic memory, executive function, and global cognition (Donohue et al., 2014; Kim Y. J. et al., 2022) and have been frequently used to track cognitive changes in CU individuals (Donohue et al., 2014; Kim Y. J. et al., 2022).
Our second major finding was that increased Aβ uptake, decreased neuropsychological composite scores and decreased HV (only in ADNI) in individuals were predictive of being assigned to the declining group. Our findings are consistent with converging evidence. Specifically, a previous study suggested that cognitive performance, APOE ε4, decreased hippocampal and entorhinal cortex volumes, and increased cerebrospinal fluid p-tau were the most feasible predictors of CU to MCI conversion within 5 years (Albert et al., 2018). Therefore, the detection of these predictors in CU individuals has provided an important opportunity to understanding the contributions of these predictors to cognitive decline (Mormino and Papp, 2018).
Notably, there were some differences between the ADNI and SMC datasets with respect to the relative effects of each predictor. Specifically, relative to the ADNI dataset, the SMC dataset showed greater relative effects of females on the faster decliner. Previous studies indicated that females showed faster cognitive decline than males. Considering that the ADNI and SMC datasets include mainly non-Hispanic Whites (NHW) and Koreans, respectively, it might be related to the interactive effects of ethnicity and gender on cognitive decline. Although the underlying mechanisms are not fully understood, these gender- and ethnicity-specific differences might be related to genetic and sociocultural differences between Korean and NHW participants. In fact, a previous study from our group suggested that females suffered more deleterious effects of cardiometabolic syndrome on brain aging than males, which is more pronounced in Koreans than in UKs (Kang et al., 2022). Also, relative to the ADNI dataset, the SMC dataset showed greater relative effects of decreased neuropsychological composite scores than increased Aβ uptake and decreased HV. Further studies are needed to determine whether ethnicity influences Alzheimer’s pathology and progression.
Our final major finding was that predictive models of cognitive decline in CU individuals revealed fair to good discrimination and calibration capabilities. Previously, there were few predictive models for CU to MCI conversion. Nevertheless, previous studies have shown that the conversion of CU to MCI is influenced by fixed time and cognitive impairment levels. Our study’s contribution is the development of a model that can predict and visualize the individual risk of cognitive decline regardless of fixed time and set cognitive impairment levels. Furthermore, in the present study, visualization was performed by utilizing the nomogram to assess the predicted probability of a trajectory subgroup. As a result, our model may be able to produce clinically useful results allowing for a more clear interpretation. This model could facilitate identification of individuals who are at risk of cognitive decline.
The strength of the present study was that we developed predictive models based on two independent cohorts with multimodal imaging markers and by using a sophisticated GMM method. However, there are several issues that should be discussed. First, we did not include longitudinal changes in HV and Aβ in our model. Future studies are needed to determine whether incorporating longitudinal changes in HV and Aβ might increase prediction accuracy. In addition, since GMM estimates all variances, convergence errors can occur (McNeish et al., 2021). Nomograms assume that outcomes remain constant over time, and can become less accurate over time for a variety of reasons, such as improvements in earlier detection and management (Balachandran et al., 2015). Finally, other pathologies such as tau, argyrophilic grain disease, Lewy body disease, transactive response DNA-binding protein (TDP-43) pathology, hippocampal sclerosis, atherosclerosis, and gross infarcts that are associated with global cognitive decline were not considered (Wilson et al., 2020). Overall, despite these limitations, our study is unique in that it focuses on the cognitive trajectory of CU individuals and provides useful predictive models to identify CU individuals who may show future cognitive decline.
Conclusion
In conclusion, our study provides novel insights into different cognitive trajectories among CU individuals. Since the predictive model was able to classify CU individuals with respect to potential future cognitive decline, this model could be employed in future primary AD prevention trials.
Data availability statement
The raw data supporting the conclusions of this article will be made available by the authors, without undue reservation.
Ethics statement
The studies involving human participants were reviewed and approved by the Institutional Review Board of Samsung Medical Center. The patients/participants provided their written informed consent to participate in this study.
Author contributions
YK: conceptualization, formal analysis, methodology, resources, writing—original draft, and writing—review and editing. SK and AH: conceptualization, methodology, resources, writing—original draft, and writing—review and editing. HJ and JK: methodology, resources, and writing—review and editing. HK and DN: conceptualization, resources, and writing—review and editing. JC: conceptualization, resources, supervision, and writing—review and editing. SS: conceptualization, funding acquisition (lead), resources, supervision (lead), and writing—review and editing. All authors contributed to the article and approved the submitted version.
Funding
This research was supported by a grant of the Korea Health Technology R&D Project through the Korea Health Industry Development Institute (KHIDI), funded by the Ministry of Health & Welfare and Ministry of Science and ICT, Republic of Korea (HI19C1132, HU20C0111, and HU22C0170), the National Research Foundation of Korea (NRF) grant funded by the Korea Government (MSIT) (NRF-2019R1A5A2027340), Institute of Information & Communications Technology Planning & Evaluation (IITP) grant funded by the Korea Government (MSIT) (No. 2021-0-02068, Artificial Intelligence Innovation Hub), Future Medicine 20*30 Project of the Samsung Medical Center (#SMX1230081), and the “National Institutes of Health” Research Project (2021-ER1006-02).
Conflict of interest
The authors declare that the research was conducted in the absence of any commercial or financial relationships that could be construed as a potential conflict of interest.
Publisher’s note
All claims expressed in this article are solely those of the authors and do not necessarily represent those of their affiliated organizations, or those of the publisher, the editors and the reviewers. Any product that may be evaluated in this article, or claim that may be made by its manufacturer, is not guaranteed or endorsed by the publisher.
Supplementary material
The Supplementary Material for this article can be found online at: https://www.frontiersin.org/articles/10.3389/fnagi.2023.1122927/full#supplementary-material
Supplementary Figure 1 | Bootstrap calibration curve for the ADNI (A) and SMC (B) models, showing the validation results in terms of discrimination capabilities. Dotted line, apparent calibration accuracy; solid line, bias-corrected calibration curve; and dashed line, ideal calibration. This model is well calibrated, because the bias-corrected calibration plot is close to the 45° line. ADNI, Alzheimer’s Disease Neuroimaging Initiative; SMC, Samsung Medical Center.
Footnotes
- ^ www.adni-info.org
- ^ adni.loni.usc.edu
- ^ http://surfer.nmr.mgh.harvard.edu/
- ^ http://www.R-project.org/
References
Akaike, H. (1974). A new look at the statistical model identification. IEEE Trans. Autom. Control 19, 716–723. doi: 10.1109/TAC.1974.1100705
Albert, M., Zhu, Y., Moghekar, A., Mori, S., Miller, M. I., Soldan, A., et al. (2018). Predicting progression from normal cognition to mild cognitive impairment for individuals at 5 years. Brain 141, 877–887. doi: 10.1093/brain/awx365
Balachandran, V. P., Gonen, M., Smith, J. J., and DeMatteo, R. P. (2015). Nomograms in oncology: more than meets the eye. Lancet Oncol. 16, e173–e180. doi: 10.1016/S1470-2045(14)71116-7
Chen, Y., Denny, K. G., Harvey, D., Farias, S. T., Mungas, D., DeCarli, C., et al. (2017). Progression from normal cognition to mild cognitive impairment in a diverse clinic-based and community-based elderly cohort. Alzheimers Dement. 13, 399–405. doi: 10.1016/j.jalz.2016.07.151
Cho, H., Kim, Y.-E., Chae, W., Kim, K. W., Kim, J.-W., Kim, H. J., et al. (2020). Distribution and clinical impact of apolipoprotein E4 in subjective memory impairment and early mild cognitive impairment. Sci. Rep. 10:13365. doi: 10.1038/s41598-020-69603-w
Cho, S. H., Choe, Y. S., Kim, H. J., Jang, H., Kim, Y., Kim, S. E., et al. (2020). A new Centiloid method for (18)F-florbetaben and (18)F-flutemetamol PET without conversion to PiB. Eur. J. Nucl. Med. Mol. Imaging 47, 1938–1948. doi: 10.1007/s00259-019-04596-x
Committee on the Public Health Dimensions of Cognitive Aging, Board on Health Sciences Policy, and Institute of Medicine (2015). “The National academies collection: reports funded by National Institutes of Health,” in Cognitive Aging: Progress in Understanding and Opportunities for Action, eds D. G. Blazer, K. Yaffe, and C. T. Liverman (Washington, DC: National Academies Press).
David, N. D., Lin, F., Porsteinsson, A. P., and Alzheimer’s Disease Neuroimaging Initiative (2016). Trajectories of neuropsychiatric symptoms and cognitive decline in mild cognitive impairment. Am. J. Geriatr. Psychiatry 24, 70–80. doi: 10.1016/j.jagp.2015.06.001
Deary, I. J., Corley, J., Gow, A. J., Harris, S. E., Houlihan, L. M., Marioni, R. E., et al. (2009). Age-associated cognitive decline. Br. Med. Bull. 92, 135–152. doi: 10.1093/bmb/ldp033
Donohue, M. C., Sperling, R. A., Petersen, R., Sun, C. K., Weiner, M. W., and Aisen, P. S. (2017). Association between elevated brain amyloid and subsequent cognitive decline among cognitively normal persons. JAMA 317, 2305–2316. doi: 10.1001/jama.2017.6669
Donohue, M. C., Sperling, R. A., Salmon, D. P., Rentz, D. M., Raman, R., Thomas, R. G., et al. (2014). The preclinical Alzheimer cognitive composite: measuring amyloid-related decline. JAMA Neurol. 71, 961–970. doi: 10.1001/jamaneurol.2014.803
Fernandez-Blazquez, M. A., Avila-Villanueva, M., Maestu, F., and Medina, M. (2016). Specific features of subjective cognitive decline predict faster conversion to mild cognitive impairment. J. Alzheimers Dis. 52, 271–281. doi: 10.3233/JAD-150956
Hartig, M., Truran-Sacrey, D., Raptentsetsang, S., Simonson, A., Mezher, A., Schuff, N., et al. (2014). UCSF FreeSurfer Methods. Chicago, IL: Alzheimer’s Association.
Im, K., Lee, J.-M., Lee, J., Shin, Y.-W., Kim, I. Y., Kwon, J. S., et al. (2006). Gender difference analysis of cortical thickness in healthy young adults with surface-based methods. NeuroImage 31, 31–38. doi: 10.1016/j.neuroimage.2005.11.042
Jack, C. R. Jr., Bennett, D. A., Blennow, K., Carrillo, M. C., Dunn, B., Haeberlein, S. B., et al. (2018). NIA-AA Research framework: toward a biological definition of Alzheimer’s disease. Alzheimers Dement. 14, 535–562. doi: 10.1016/j.jalz.2018.02.018
Jagust, W. J., Bandy, D., Chen, K., Foster, N. L., Landau, S. M., Mathis, C. A., et al. (2010). The Alzheimer’s Disease Neuroimaging Initiative positron emission tomography core. Alzheimers Dement. 6, 221–229. doi: 10.1016/j.jalz.2010.03.003
Jang, H., Jang, Y. K., Kim, H. J., Werring, D. J., Lee, J. S., Choe, Y. S., et al. (2019). Clinical significance of amyloid beta positivity in patients with probable cerebral amyloid angiopathy markers. Eur. J. Nucl. Med. Mol. Imaging 46, 1287–1298. doi: 10.1007/s00259-019-04314-7
Jang, H., Ye, B. S., Woo, S., Kim, S. W., Chin, J., Choi, S. H., et al. (2017). Prediction model of conversion to dementia risk in subjects with amnestic mild cognitive impairment: a longitudinal, multi-center clinic-based study. J. Alzheimers Dis. 60, 1579–1587. doi: 10.3233/jad-170507
Jung, T., and Wickrama, K. A. S. (2008). An introduction to latent class growth analysis and growth mixture modeling. Soc. Pers. Psychol. Compass 2, 302–317. doi: 10.1111/j.1751-9004.2007.00054.x
Kang, S. H., Liu, M., Seo, S. W., and Kim, H. (2022). Differential Effects of Cardiometabolic Syndrome on Brain Age in Relation to Sex and Ethnicity. San Francisco, CA: CTAD22.
Kattan, M. W., and Marasco, J. (2010). What is a real nomogram? Semin. Oncol. 37, 23–26. doi: 10.1053/j.seminoncol.2009.12.003
Kim, H. J., Yang, J. J., Kwon, H., Kim, C., Lee, J. M., Chun, P., et al. (2016). Relative impact of amyloid-beta, lacunes, and downstream imaging markers on cognitive trajectories. Brain 139(Pt 9), 2516–2527. doi: 10.1093/brain/aww148
Kim, W., Kim, K. S., and Park, R. W. (2016). Nomogram of naive bayesian model for recurrence prediction of breast cancer. Healthc. Inform. Res. 22, 89–94. doi: 10.4258/hir.2016.22.2.89
Kim, S. E., Woo, S., Kim, S. W., Chin, J., Kim, H. J., Lee, B. I., et al. (2018). A nomogram for predicting amyloid PET positivity in amnestic mild cognitive impairment. J. Alzheimers Dis. 66, 681–691. doi: 10.3233/jad-180048
Kim, S. J., Woo, S. Y., Kim, Y. J., Jang, H., Kim, H. J., Na, D. L., et al. (2022). Development of prediction models for distinguishable cognitive trajectories in patients with amyloid positive mild cognitive impairment. Neurobiol. Aging 114, 84–93. doi: 10.1016/j.neurobiolaging.2022.02.012
Kim, Y. J., Hahn, A., Park, Y. H., Na, D. L., Chin, J., and Seo, S. W. (2022). Longitudinal amyloid cognitive composite in preclinical Alzheimer’s disease. Eur. J. Neurol. 29, 980–989. doi: 10.1111/ene.15241
Klunk, W. E., Koeppe, R. A., Price, J. C., Benzinger, T. L., Devous, M. D. Sr., Jagust, W. J., et al. (2015). The centiloid project: standardizing quantitative amyloid plaque estimation by PET. Alzheimers Dement. 11, 1–15. doi: 10.1016/j.jalz.2014.07.003
Kwak, K., Yoon, U., Lee, D.-K., Kim, G. H., Seo, S. W., Na, D. L., et al. (2013). Fully-automated approach to hippocampus segmentation using a graph-cuts algorithm combined with atlas-based segmentation and morphological opening. Magn. Resonan. Imaging 31, 1190–1196. doi: 10.1016/j.mri.2013.04.008
Lee, J. S., Cho, S. K., Kim, H. J., Kim, Y. J., Park, K. C., Lockhart, S. N., et al. (2018). Prediction models of cognitive trajectories in patients with nonamnestic mild cognitive impairment. Sci. Rep. 8:10468. doi: 10.1038/s41598-018-28881-1
Lo, Y., Mendell, N. R., and Rubin, D. B. (2001). Testing the number of components in a normal mixture. Biometrika 88, 767–778. doi: 10.1093/biomet/88.3.767
McNeish, D., Pena, A., Vander Wyst, K. B., Ayers, S. L., Olson, M. L., and Shaibi, G. Q. (2021). Facilitating growth mixture model convergence in preventive interventions. Prev. Sci. doi: 10.1007/s11121-021-01262-3 [Epub ahead of print].
Min, J. W. (2018). A longitudinal study of cognitive trajectories and its factors for Koreans aged 60 and over: a latent growth mixture model. Int. J. Geriatr. Psychiatry 33, 755–762. doi: 10.1002/gps.4855
Mormino, E. C., and Papp, K. V. (2018). Amyloid accumulation and cognitive decline in clinically normal older individuals: implications for aging and early Alzheimer’s disease. J. Alzheimers Dis. 64, S633–S646. doi: 10.3233/JAD-179928
Muthén, L. K., and Muthén, B. (2019). Mplus User’s Guide (Version 8.3), 8th Edn. Los Angeles, CA: Muthén & Muthén.
Nguena Nguefack, H. L., Pagé, M. G., Katz, J., Choinière, M., Vanasse, A., Dorais, M., et al. (2020). Trajectory modelling techniques useful to epidemiological research: a comparative narrative review of approaches. Clin. Epidemiol. 12, 1205–1222. doi: 10.2147/CLEP.S265287
Patterson, C. (2018). World Alzheimer Report 2018: The State of the Art of Dementia Research: New Frontiers, 2018. Available online at: https://www.alz.co.uk/research/WorldAlzheimerReport2018.pdf (accessed November 1, 2022).
Rusinek, H., De Santi, S., Frid, D., Tsui, W. H., Tarshish, C. Y., Convit, A., et al. (2003). Regional brain atrophy rate predicts future cognitive decline: 6-year longitudinal MR imaging study of normal aging. Radiology 229, 691–696. doi: 10.1148/radiol.2293021299
Schwarz, G. (1978). Estimating the dimension of a model. J. Ann. Stat. 6, 461–464. doi: 10.1007/978-3-319-10470-6_18
Small, B. J., and Bäckman, L. (2007). Longitudinal trajectories of cognitive change in preclinical Alzheimer’s disease: a growth mixture modeling analysis. Cortex 43, 826–834. doi: 10.1016/S0010-9452(08)70682-8
Smith, S. M. (2002). Fast robust automated brain extraction. Hum. Brain Mapp. 17, 143–155. doi: 10.1002/hbm.10062
Tsikitis, V. L., Lu, K. C., Kim, J. S., Billingsley, K. G., Thomas, C. R. Jr., and Herzig, D. O. (2016). Nomogram for predicting overall survival and salvage abdominoperineal resection for patients with anal cancer. Dis. Colon. Rectum. 59, 1–7. doi: 10.1097/DCR.0000000000000507
Wang, M., and Bodner, T. E. (2007). Growth mixture modeling: identifying and predicting unobserved subpopulations with longitudinal data. Organ. Res. Methods 10, 635–656. doi: 10.1177/1094428106289397
Wilson, R. S., Wang, T., Yu, L., Bennett, D. A., and Boyle, P. A. (2020). Normative cognitive decline in old age. Ann. Neurol. 87, 816–829. doi: 10.1002/ana.25711
Keywords: cognitive trajectory, cognitively unimpaired, nomogram, prediction, classification
Citation: Kim YJ, Kim SE, Hahn A, Jang H, Kim JP, Kim HJ, Na DL, Chin J and Seo SW (2023) Classification and prediction of cognitive trajectories of cognitively unimpaired individuals. Front. Aging Neurosci. 15:1122927. doi: 10.3389/fnagi.2023.1122927
Received: 13 December 2022; Accepted: 27 February 2023;
Published: 13 March 2023.
Edited by:
Rong Chen, University of Maryland, Baltimore, United StatesReviewed by:
Chenlu Gao, Brigham and Women’s Hospital and Harvard Medical School, United StatesYa Fang, Xiamen University, China
Copyright © 2023 Kim, Kim, Hahn, Jang, Kim, Kim, Na, Chin and Seo. This is an open-access article distributed under the terms of the Creative Commons Attribution License (CC BY). The use, distribution or reproduction in other forums is permitted, provided the original author(s) and the copyright owner(s) are credited and that the original publication in this journal is cited, in accordance with accepted academic practice. No use, distribution or reproduction is permitted which does not comply with these terms.
*Correspondence: Sang Won Seo, sangwonseo@empas.com; Juhee Chin, juheechin@hanmail.net
†These authors have contributed equally to this work
‡Data used in the preparation of this article were obtained from the Alzheimer’s Disease Neuroimaging Initiative (ADNI) database (adni.loni.usc.edu). As such, the investigators within the ADNI contributed to the design and implementation of ADNI and/or provided data but did not participate in the analyses or writing of this report. A complete listing of ADNI investigators can be found at: http://adni.loni.usc.edu/wp-content/uploads/how_to_apply/ADNI_Acknowledgement_List.pdf