Accurate module induced brain network construction for mild cognitive impairment identification with functional MRI
 Yue Du1,2†
  Guangyu Wang1,2†
  Chengcheng Wang2 Yangyang Zhang2,3 Xiaoming Xi1 Limei Zhang1*
  Mingxia Liu4*
- 1School of Computer Science and Technology, Shandong Jianzhu University, Jinan, Shandong, China
- 2School of Mathematics Science, Liaocheng University, Liaocheng, Shandong, China
- 3School of Computer Science and Cyberspace Security, Hainan University, Haikou, Hainan, China
- 4Department of Radiology and BRIC, University of North Carolina at Chapel Hill, Chapel Hill, NC, United States
Introduction: Functional brain networks (FBNs) estimated from functional magnetic resonance imaging (fMRI) data has become a potentially useful way for computer-aided diagnosis of neurological disorders, such as mild cognitive impairment (MCI), a prodromal stage of Alzheimer's Disease (AD). Currently, Pearson's correlation (PC) is the most widely-used method for constructing FBNs. Despite its popularity and simplicity, the conventional PC-based method usually results in dense networks where regions-of-interest (ROIs) are densely connected. This is not accordance with the biological prior that ROIs may be sparsely connected in the brain. To address this issue, previous studies proposed to employ a threshold or l_1-regularizer to construct sparse FBNs. However, these methods usually ignore rich topology structures, such as modularity that has been proven to be an important property for improving the information processing ability of the brain.
Methods: To this end, in this paper, we propose an accurate module induced PC (AM-PC) model to estimate FBNs with a clear modular structure, by including sparse and low-rank constraints on the Laplacian matrix of the network. Based on the property that zero eigenvalues of graph Laplacian matrix indicate the connected components, the proposed method can reduce the rank of the Laplacian matrix to a pre-defined number and obtain FBNs with an accurate number of modules.
Results: To validate the effectiveness of the proposed method, we use the estimated FBNs to classify subjects with MCI from healthy controls. Experimental results on 143 subjects from Alzheimer's Disease Neuroimaging Initiative (ADNI) with resting-state functional MRIs show that the proposed method achieves better classification performance than previous methods.
1. Introduction
Alzheimer's disease (AD), characterized by intellectual disability and abnormal behavior, is the most common form of dementia (Goedert and Spillantini, 2006). With the progress of AD, it will gradually destroy the memory of patients and even affect their ability of daily living. Even though there is no effective treatment for curing AD, the progress of AD disease be delayed by early intervention (Hampel et al., 2008). Thus, classifying the prodromal stage of AD, namely mild cognitive impairment (MCI), has received considerable attention in the past decades (Rombouts et al., 2005; Desikan et al., 2009; Zhu et al., 2014; Jie et al., 2018; Liu et al., 2018; Vogt et al., 2020).
To classify subjects with MCI, researchers have developed different ways for quantitatively measuring the brain activity and organization. Especially, functional brain networks (FBNs) estimated from resting-state functional MRI (rs-fMRI) data have been increasingly employed to study the transition from MCI to AD (Chen et al., 2021). In mathematics, the FBN can be simulated by a graph G(V, E), where V is the node set containing multiple regions-of-interest (ROIs) in the brain, and E is the edge set containing the “connections” between pairs of ROIs. In practice, with a given order of the nodes, the FBN can be equivalently described by an edge weighting matrix (i.e., adjacency matrix W) (Bullmore and Sporns, 2009; Qiao et al., 2016).
Recent studies have shown that a well-estimated FBN (with W) tends to benefit the MCI identification, which makes FBN estimation become a hot research topic in the field (Zhou et al., 2018a; Jiang et al., 2019; Xue et al., 2020). Among various FBN estimation methods developed in the past decades, Pearson's correlation (PC) is the most popular one due to its simplicity and empirical effectiveness. But PC-based methods always result in dense FBNs, which is not accordance with the biological prior of brains (i.e., ROIs may be sparsely connected in the brain) (Bechtel, 2003; Wen et al., 2019). To address this limitation, a threshold is usually utilized to sparsify the estimated FBN by removing weak connections (with edge weights smaller than the pre-defined threshold). Alternatively, Li et al. (2017) introduced an l1-norm regularizer to the PC model for achieving a sparse FBN.
It has been reported that FBN generally has more topological structures than just sparsity (Meunier et al., 2009; Zhao et al., 2012; Sporns, 2016; Wang et al., 2019a; Wen et al., 2019). For example, one of the most representative structure is modularity that is believed to be extremely important for promoting stability, conserving wiring cost, and enabling complex neuronal dynamics of our brain. As shown in Figure 1, a module in network is a group of nodes with relatively dense interconnections, often corresponding to specialized functional components (Sporns and Betzel, 2016). For FBN, the modular structure can divide the labor of each brain region more clearly, and make our brain work efficiently. To obtain a sparse FBN, some researchers introduced the l1-norm regularizer to the construction of FBN. The l1-norm regularization model may automatically find significant network connections and provide sparse solutions since the weights of insignificant connections are automatically driven to zero (Ryali et al., 2012; Jie et al., 2016; Zheng et al., 2018). Specially, Ryali et al. (2012) combined l1- and l2-norm regularization for estimating sparse partial correlations between brain regions in fMRI data. Jie et al. (2016) first constructed connectivity hyper-networks from rs-fMRI time series by using l1-norm to characterize the interactions among different brain regions and then used the hyper-networks for brain disease diagnosis. Zheng et al. (2018) constructed a multi-feature-based network by employing a linear regression model with a l1-norm penalty to enhance the diagnostic accuracy of AD and MCI and also help discover the underlying neural mechanisms. However, these studies usually ignore modular brain structure, which is an important prior knowledge of the human brain. For instance, the central executive network (CEN) is responsible for high-level cognitive functions such as planning, decision making, and the control of attention and working memory, while the default mode network (DMN) include many brain areas that form an integrated system for self-related mental activity, including autobiographical, self-monitoring, and social functions (Liang et al., 2016).

Figure 1. A functional brain network with multiple modules that have dense within-module connection and sparse between-module connection.
To address this issue, in this paper, we propose a new FBN estimation method based on graph Laplacian matrix decomposition. Due to the property that the zero eigenvalues of graph Laplacian matrix indicate the connected components (Oellermann and Schwenk, 1991), the proposed method can reduce the rank of the Laplacian matrix to a pre-defined number and obtain FBN with an accurate number of modules. To verify the effectiveness of our method, we use the public Alzheimer's Disease Neuroimaging Initiative (ADNI) dataset to classify subjects with MCI from normal controls (NCs) based on the estimated FBNs. The experimental results show that our method can effectively improve the identification accuracy compared with conventional methods on functional brain network estimation.
The rest of this paper is organized as follows. In Section 2, we introduce the preprocessed data, review three related conventional FBN estimation method, present our proposed method to estimate FBNs and FBN-based brain disease classification. Then, we describe the experimental setting. In Section 3, we report the experimental results on classification tasks and visually compare the FBNs estimated by our AM-PC and six competing methods, and also analyse the influence of module number. In Section 4, we discuss the discmininative features identified by our method and compare our method with several state-of-the-art methods on FBN-based MCI identification with rs-fMRI data from ADNI. Then, we present several limitations of this work and possible future research directions. In Section 5, we summarize the paper.
2. Materials and methods
As shown in Figure 2, we develop a FBN-based brain disease classification framework, including three major components: fMRI preprocessing, our proposed accurate module induced PC (AM-PC) method for FBN construction, and FBN-based disease classification. In the following, we first introduce the materials and image preprocessing used in this work, and review several PC-based methods. Then, we present the proposed method for FBN estimation and experimental setting.
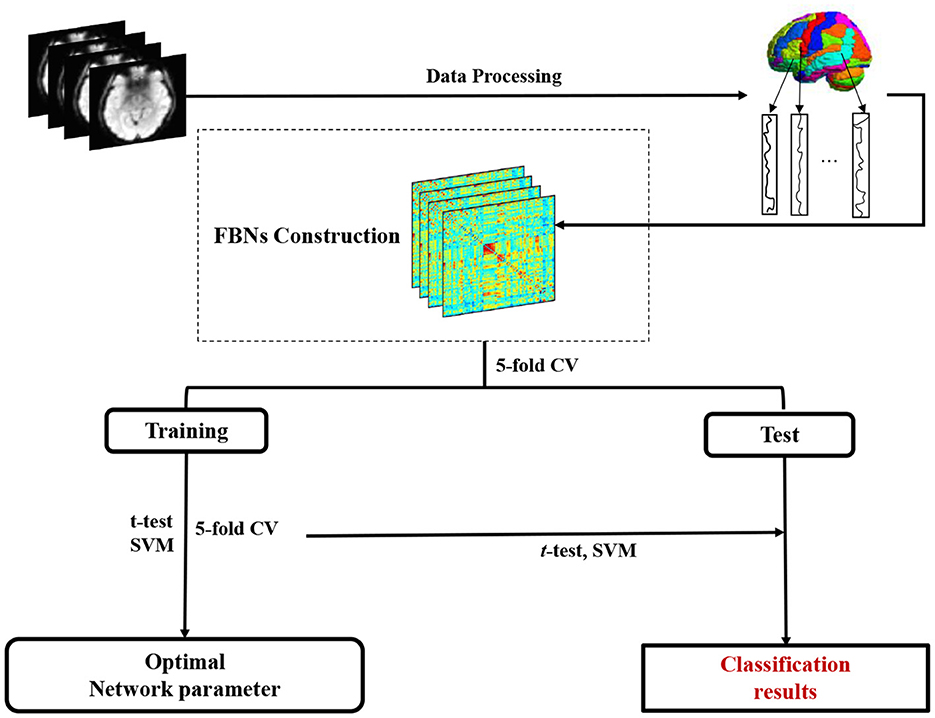
Figure 2. Pipeline of the proposed accurate module induced PC (AM-PC) method for functional brain network (FBN) construction and FBN-based MCI identification with resting-state fMRI data.
2.1. Materials and image preprocessing
A total of 143 participants from the ADNI dataset (Wang et al., 2019b) were used in this work, including 95 MCIs and 48 NCs. Each participant was scanned at one or more visits in this study, and the interval between two visits is at least 6 months, resulting in a total of 299 resting-state fMRI scans. These 299 scans include 154 NC cases and 145 MCI cases. The scanning parameters were listed as follows. The slice thickness is 3.31 mm, TE (echo time) is 30 ms, TR (repetition time) is 2.2 − 3.1 s, the in-plane image resolution is 2.29 − 3.31 mm, and the scanning time for each subject is 7 min (resulting in 140 volumes). Table 1 shows the demographic information of these 299 scans.
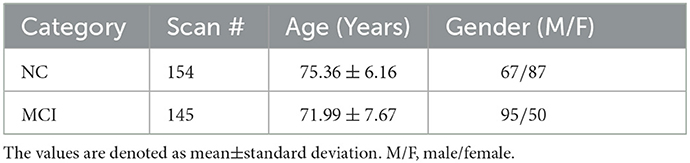
Table 1. Demographic information of the studied 299 rs-fMRI scans from the ADNI database.
To reduce the influence of nuisance signals, the preprocessing pipeline in FSL FEAT is used in this work. Specifically, for each subject, we discard the first 3 volumes in the fMRI time course for signal stabilization. And then the remaining 137 volumes were processed via the standard pipeline. The main steps in preprocessing include slice timing correction, head motion estimation, bandpass filtering, and regression of nuisance covariates (i.e., white matter, cerebrospinal fluid, and motion parameters) by mean regression. Note that subjects were removed if their head motion > 2.0 mm of maximal translation or 2.0o of maximal rotation. After that, we performed skull stripping based on T1-weighted MRI and aligned the skull-stripped fMRIs onto the Montreal Neurological Institute space. Then, we used a Gaussian kernel with full-width-at-half-maximum of 6 mm to spatially smooth the volumes. The subjects with more than 2.5 min of frame-wise displacement (FD > 0.5) were excluded from further analysis. Finally, every brain was divided into 116 ROIs based on the Automated Anatomical Labeling (AAL) template (Tzourio-Mazoyer et al., 2002), and the mean time series (with band-pass filtered 0.015 − 0.15 Hz) of each ROIs were extracted as the input data for FBN estimation.
2.2. Related work
Due to the crucial role in exploring the neurodegenerative diseases, many FBN estimation methods have been proposed in the past decades. In this section, we briefly review several PC-based methods that are closely related to our study.
As pointed out earlier, PC is the simplest and most popular method for FBN estimation (Smith et al., 2013). The edge weight of PC-based method for FBN estimation is defined as follows:
Where is the blood oxygen level-dependent (BOLD) signals associated with the ith ROI, and is a vector containing the mean of the elements in xi.
Without loss of generality, we redefine . Then, Equation (1) can be simplified as , which is exactly the solution of the following optimization problem:
or its matrix form shown as follows:
Where W is the adjacency matrix to be estimate by PC, is the data matrix containing the fMRI time courses, and n is the number of ROIs. We will note shortly that such an optimization view of PC can help us to develop new and more flexible FBN estimation methods.
Despite its popularity, PC aims to measure the full correlation between signals of all ROIs in the brain, thus generating dense networks where all nodes/ROIs are densely connected. This is not consistent with the empirical finding that sparsity has been proven to be the most popular property of FBN (Sporns, 2016). Therefore, in practice, a threshold is generally used to sparsify the originally estimated FBN by removing the edges with weak weights. An alternative to sparsify FBN is the l1-regularized PC (PCSparsity) (Li et al., 2017) whose model is given as follows:
where ||W||1 is the l1-norm of a matrix for encoding the sparsity prior of FBN, and λ is a regularized parameter for controlling the sparsity of W.
Besides sparsity, FBNs usually have more richer structures (Sporns, 2016) such as modularity, and some of these structures may guide us to estimate more reasonable FBNs. Recently, Zhou et al. (2018b) developed an M-FBN method to estimate FBN by further introducing a trace norm regularizer into Equation (4), resulting in the following model:
Where ||W||* is the trace norm of the matrix W, and λ1 and λ2 are regularized parameters for controlling the balance between the three terms in the objective function. With the combination of l1 and trace norms, Equation (5) has been verified to be able to discover modular structures of the estimated FBN. However, since this model is an approximation of the sparse and low-rank matrix, the network estimated by M-FBN could not include a notable modular structure.
2.3. Proposed method for FBN estimation
Several previous Studies (Grone et al., 1990; Zhou et al., 2018b) proposed to jointly minimize the l0-“norm” and the rank of the edge weighting matrix W, since a sparse (via minimizing l0-“norm”) and low-rank (via minimizing the rank) matrix tends to result in modular structures. However, these two regularizers are both non-convex with respect to W, making the optimization problem intractable. In practice, they are generally relaxed to l1-norm ||W||1and trace norm ||W||* respectively. Such relaxation only achieves an approximation of a sparse low-rank matrix, and thus fails to guarantee the modular structure of FBN.
Motivated by the theorem (Heider, 1946) that the multiplicity k of the eigenvalues 0 of a Laplacian matrix is equal to the number of connected components in a graph, we propose a new method to estimate FBNs with an accurate number of modularity. Denote n (n = 116 in this work) as the number of ROIs and k (k = 8 in this work) as the number of modules. Specifically, based on the l1-regularized PC method defined in Equation (4), we propose to constrain the rank of LW as n−k to generate a FBN with an accurate number of modules. Mathematically, the proposed AM-PC model is given as follows:
Due to the nonnegative constraint in Equation (6), the l1-norm can be replaced by the sum of the elements in the matrix. In fact, the nonnegative assumption for edge weights is supported by the structural equilibrium theory (Fan, 1949; Cartwright and Harary, 1956), and can simplify the subsequent analysis for FBNs. With Equation (6), we can explicitly construct an FBN with a total of k modules for each subject.
Given the data matrix X and a matrix A = XTX, we can rewritten Equation (6) as follows:
In general, it is not straightforward to solve (Equation 7) since rank(LW) = n−k is a strict constraint. In what follows, we derive an efficient optimization algorithm to solve this challenging problem.
Denote σi(LW) as the i-th smallest eigenvalue of LW. Accordingly, Equation (7) can be equivalently converted to the following problem:
Where LW is positive semi-definite to guarantee σi(LW)≥0, and a large α enables to meet the constraint of rank(LW) = n−k.
Furthermore, our proposed optimization method is based on the Ky Fan's theorem (Grant and Boyd, 2014) as follows:
By combining Equations (8), (9), we have the problem:
Which can be efficiently solved by the following alternating optimization algorithm.
Step 1: When W is fixed, Equation (10) becomes
Whose the optimal solution is formed by the k eigenvectors corresponding to the k smallest eigenvalues of LW.
Step 2: When F is fixed, Equation (10) becomes
which is equivalent to the following problem:
For simplicity, we denote as fij. Then, by expanding and combining the like terms, Equation (13) can be rewritten as follows:
Which is a quadratic programming problem and can be easily solved by, for example, the CVX toolbox (Grant and Boyd, 2014). We summarize the optimization algorithm to solve Equation (10) in Algorithm 1.
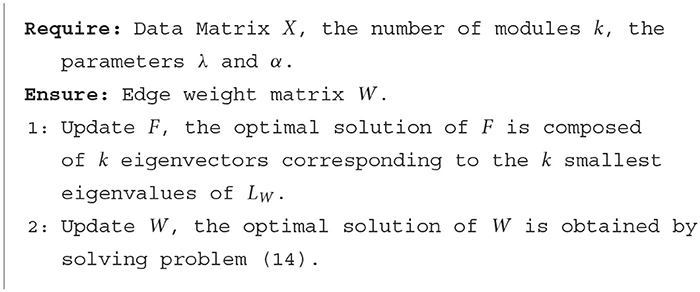
Algorithm 1. Algorithm for solving the proposed model in Equation (10).
2.4. Experimental setting
Based on the learned edge weighting matrix W, we can construct a specific FBN with k modules for each subject. Given FBNs for all subjects, the subsequent task is to classify MCI and NC based on the estimated FBNs. Since the given FBNs are symmetry matrices, the upper and lower triangle matrix features are the same, and for ease of calculation, we take the upper triangle features including (116 × (116 − 1))÷2 = 6, 670 elements. Although the edge weight matrix contains the full information of the network, it typically causes the curse of dimensionality, since the number of feature dimension (Kuo and Sloan, 2005), i.e. 6670, is far greater than the number of subjects.
To address this issue, we propose to employ the t-test algorithm to select the most informative features by a fixed p values (p = 0.05 in this work). As pointed out in Wee et al. (2014), the classifier design has a big influence on the ultimate accuracy. For this reason, we employ a linear support vector (SVM) with the default parameter (i.e., C = 1) as classifier (Chang and Lin, 2011) in this work, considering that it is simple and widely used in neuroimaging-based brain disorder classification.
In the experiments, we use a 5-fold subject-level cross-validation (CV) strategy (Li et al., 2017) to evaluate different methods, to ensure that fMRI scans of the same subject will not appear in both training and testing sets. To reduce the biased introduced by random partition cross validation, the 5-fold CV process was repeated 100 times for all methods. Besides, for the fair comparison, all the competing methods use the same linear SVM (with C = 1) as the classifier.
Since the parameters may significantly affect the structure of the constructed networks and the classification results, we select optimal parameters through grid search via inner 5-fold CV based on only training data. Specifically, we uniformly utilize 11 candidate values [2−5, 2−4, ⋯ , 25] for the regularization parameters (λ, λ1 and λ2) in the four competing methods (i.e., PCSparsity, PCSparsity+, M-PC, and M-PC+). The proposed AM-PC has three parameters, i.e., k, λ and α. The module number k is empirically set as 8 based on the prior knowledge (Wong, 2015). The optimal value of α can be determined by a heuristic approach. That is, we first initialize α with a small value. Then, in each iteration, we compute the number of zero eigenvalues in LW, if it is larger than k, then divide α by 2; if it is smaller than k, then multiply α by 2; otherwise stop the iteration. Thus, in AM-PC, we only need to tue the parameter λ. In our experiment, the elements in the network tend to zero when λ is equal to the number in [20, 21, ⋯ , 25], and the network loses its discriminative capability. Therefore, the optimal value of λ in our AM-PC is selected from [2−11, 2−10, ⋯ , 2−1] via inner 5-fold CV.
3. Results
With the extracted mean signal of each ROI, we estimate FBNs via the proposed AM-PC method and three different methods, including (1) PC with its model defined in Equation (3), (2) PCSparsity (Li et al., 2017) with its model defined in Equation (4), and (3) M-PC (Zhou et al., 2018b) with its model defined in Equation (5). The proposed AM-PC usually selects an ROI with small weights and limited degrees as a separate module. To alleviate this problem, we use the normalized Laplacian matrix LW instead of the original Laplacian matrix. In the proposed AM-PC, the constraint in Equation (6) helps generate a nonnegative FBN for each subject. For a fair comparison, we also compare our AM-PC with three additional methods, including (1) PC+, (2) PCSparsity+, and (3) M-PC+, and these three methods remove the negative edges in networks estimated by PC, PCSparsity, and M-PC, respectively.
3.1. Classification results
In this section, we perform MCI identification (i.e., MCI vs. NC classification) based on the FBNs estimated by seven different methods (including PC, PC+, PCSparsity, PCSparsity+, M-PC, M-PC+, AM-PC). For seven methods, we employ the same t-test algorithm for feature selection and the linear SVM for classification to ensure the fair comparison. Four metrics are used to evaluate the classification performance, including accuracy (ACC), sensitivity (SEN), specificity (SPE) and AUC. Denote TP, TN, FP and FN as true positive, true negative, false positive and false negative, respectively. These four metrics are defied as follows: ACC=, SEN=, SPE=, and AUC is the area under the ROC (receiver operating characteristic) curve.
In Table 2, we report the classification results of MCI vs. NC classification achieved by seven different ways. The term marked by “*” denotes that the result of proposed AM-PC is significantly better than that of all six competing methods (with p < 0.05). It can be seen from this table that our proposed AM-PC method consistently outperforms the six competing methods in terms of four evaluation metrics. And the AM-PC is significantly better (with p < 0.05) than the six methods in terms of ACC, SPE and AUC values. These results imply that the modularity prior introduce by our method plays an important role in modeling the rich topological structure of functional brain networks, thus helping boost the identification performance of subjects with MCI.
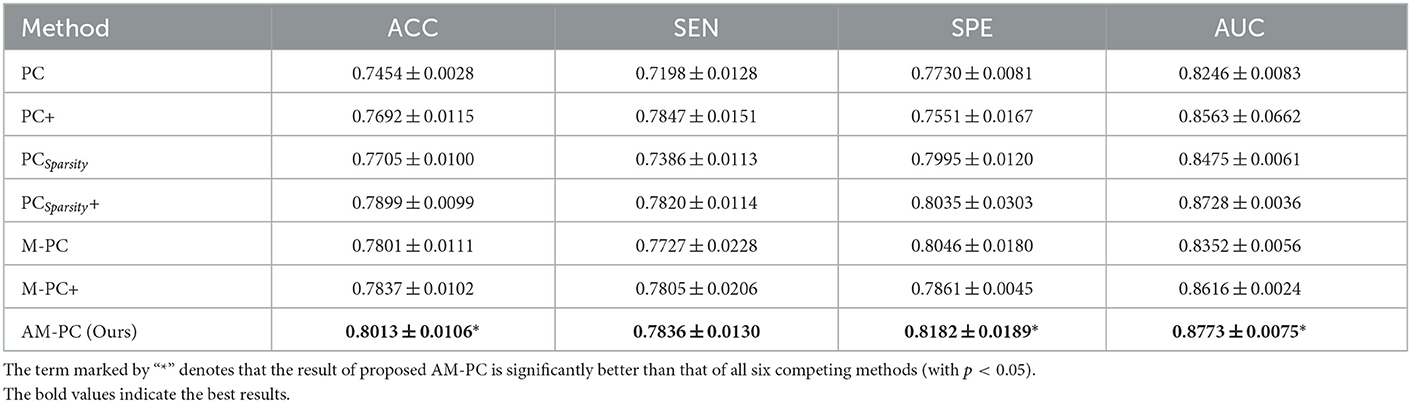
Table 2. Classification performance (mean ± standard deviation) of 7 different methods in MCI vs. NC classification.
3.2. Estimated functional brain networks
We visually compare the FBNs estimated by our AM-PC and six competing methods. In Figures 3A–G, we take a randomly selected subject from ADNI as an example to visualize the FBNs estimated by these seven methods. Here, the corresponding parametric values are λ = 2−2 for PCSparsity and PCSparsity+, , for M-PC and M-PC+, and λ = 2−1 for our AM-PC.
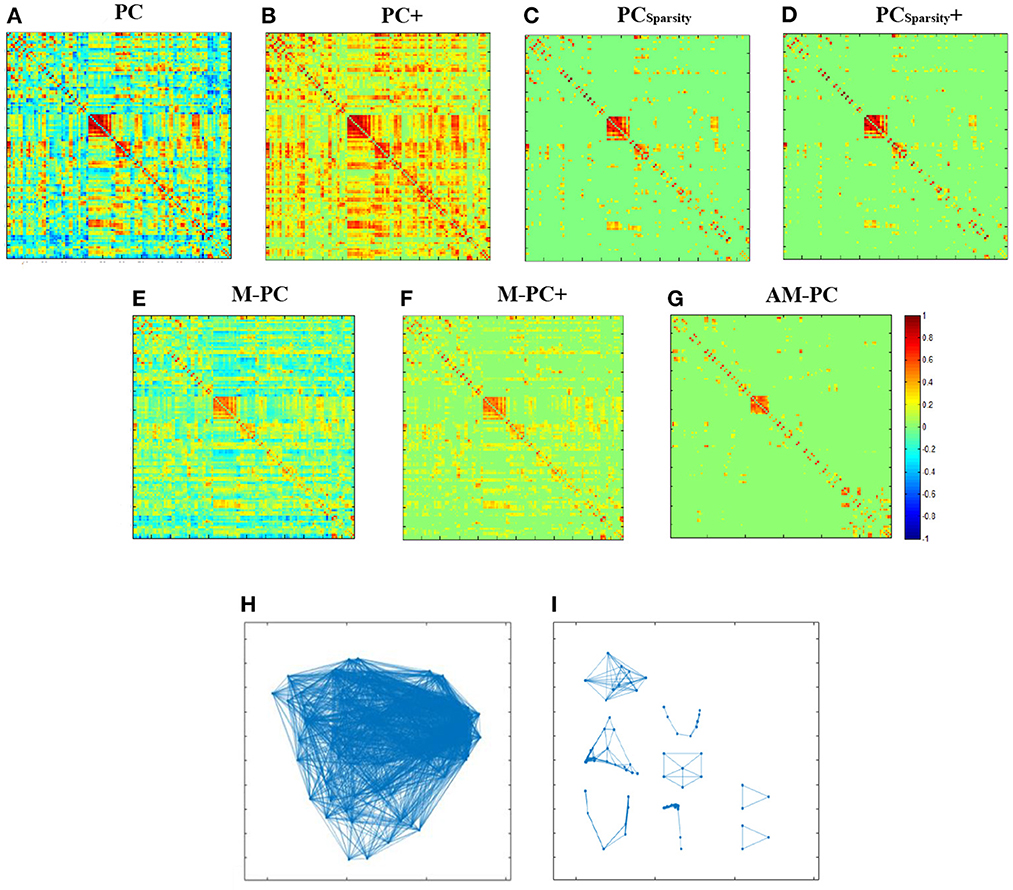
Figure 3. Seven edge weight matrices of the same subject estimated by seven different methods, i.e., (A) PC, (B) PC+, (C) PCSparsity, (D) PCSparsity+, (E) M-PC, (F) M-PC+, and (G) AM-PC. (H, I) show the modules in the networks estimated by M-PC and the proposed AM-PC methods.
It can be seen from Figures 3A–G that the FBNs estimated by PCSparsity, PCSparsity+, M-PC, M-PC+ and AM-PC are sparse. This is due to the introduction of the l1-norm regularizer in these three methods. Besides, the FBN estimated by our proposed AM-PC method shows clearer modular structure than others. The underlying reason could be that AM-PC apply a low-rank constraint to LW, thus yielding more clear modules in the estimated functional brain network.
To show the modular structure of the network constructed by AM-PC more clearly, we use scatter plots to illustrate the networks estimated by M-PC and our AM-PC in Figures 3H, I, respectively. From Figures 3H, I, we can observe that our AM-PC can generate an accurate number (i.e., k = 8) modules in the estimated FBN, compared with the M-PC method that aims to generate FBNs with approximate modules. These results further validate the effectiveness of the proposed method in generating FBNs with clear modular structures.
3.3. Influence of number of modules
As a complex network, FBN include the hierarchical structure (Meunier et al., 2009, 2010), and the number of modules increase with the deeper of the FBN level. Thus, it is a practical problem to select the optimal values of the parameter k in the proposed objective function in Equation (6). Previous studies works (Bertolero et al., 2015; Geerligs et al., 2015; Gallen et al., 2016; Murakami et al., 2018) have shown that the number of modules in the FBN is usually less than 10. To study the influence of the number of modules on the classification performance, we report the four performance metrics (i.e., ACC, SEN, SPE and AUC) achieved by the proposed AM-PC method using different values of k in Figure 4. From Figure 4, we can see that the AM-PC method can achieve overall stable results when 6 ≤ k ≤ 9, and the best AUC value is achieved with k = 8.
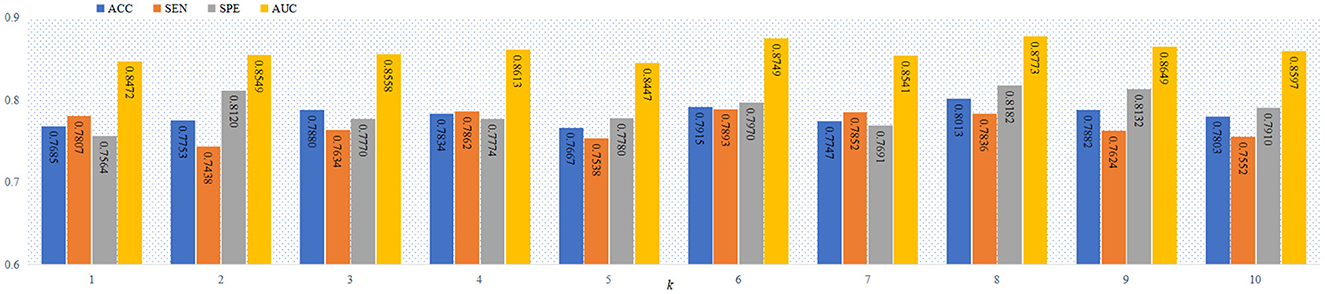
Figure 4. The ACC, SEN, SPE and AUC values of our AM-PC method with different numbers of modules (i.e., k) in the task of MCI vs. NC classification.
4. Discussion
In this section, we visually show the most discriminative features and modular structures identified by our method. We also compare our method with several state-of-the-art methods and list several limitations of the current work as well as possible future research directions.
4.1. Discriminative functional connections
We further show the most discriminative functional connections in FBNs estimated by the proposed AM-PC method. We empirically set k = 8 and use the t-test (with p = 10−6) to select the top 12 most informative connections. The identified discriminative connections are shown in Figure 5, where the discriminating power of a connection between two ROIs is represented by the thickness of an arc. As can be seen from Figure 5, the discriminative brain regions corresponding to these selected connections include several important ROIs, such as right hippocampus, right amygdala, and middle temporal gyrus. Especially, a clear discriminative functional connectivity exists between right temporal pole sup and right amygdala, and such connectivity plays an important role in cognition and emotion (Menon, 2018). The discriminative ROIs identified by our method also include right hippocampus, a brain region that is primarily associated with memory (Disouky et al., 2022). This finding is consistent with previous research (Albert et al., 2011; Kesler, 2014; Zhu et al., 2015), which further validates the effectiveness of our AM-PC method in constructing reliable functional brain networks for MCI identification.
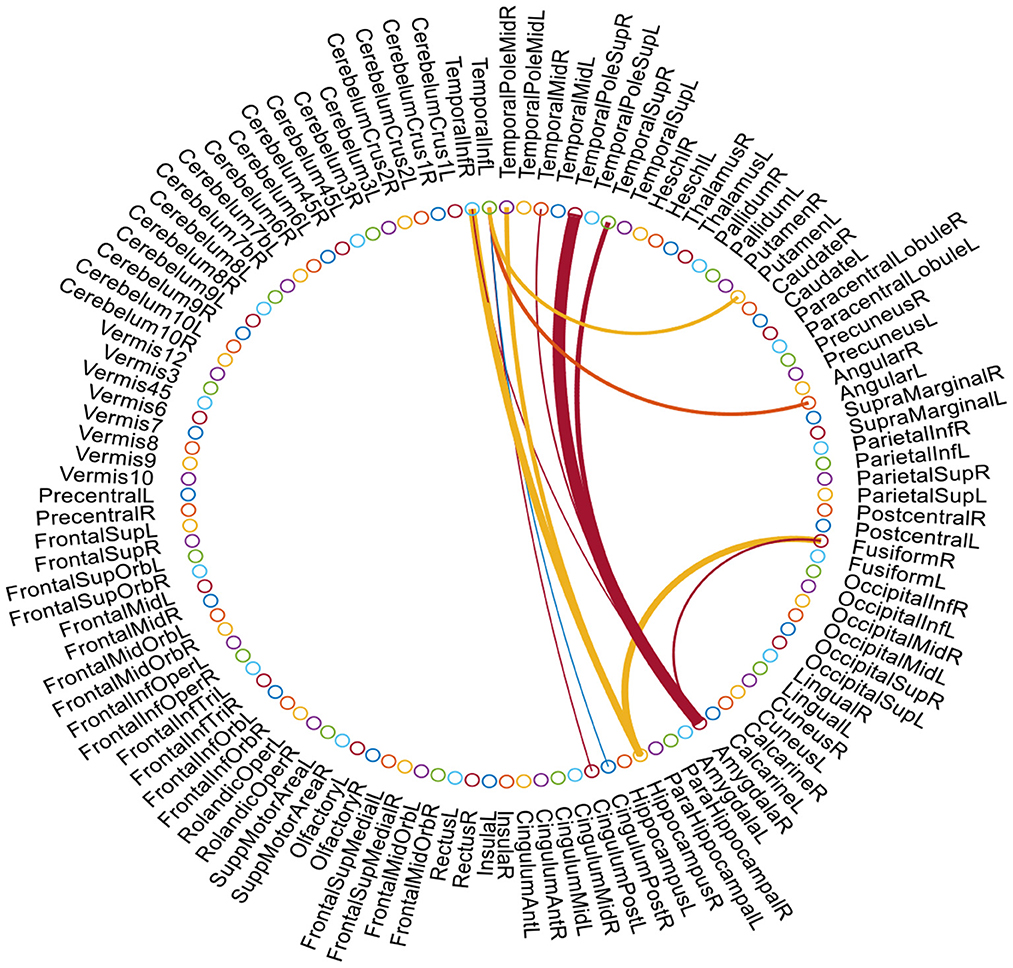
Figure 5. Top 12 discriminative connections and ROIs in our estimated FBNs selected by t-test. The thickness of each arc denotes the discriminative power of the corresponding connection in MCI vs. NC classification.
4.2. Identified modular structure
In Figure 6, we visually show the modular structure of the average functional brain network (i.e., the average FBN of all training subjects), including 8 modules (with α = 2−3). The gray dotted lines represent the 12 most discriminative connections identified by our AM-PC method (see Figure 6). In the following Figure 7, we map Figure 6 on the brain template through BrainNet Viewer (Xia et al., 2013), where each node is a brain region, and each edge is the link between the brain region.
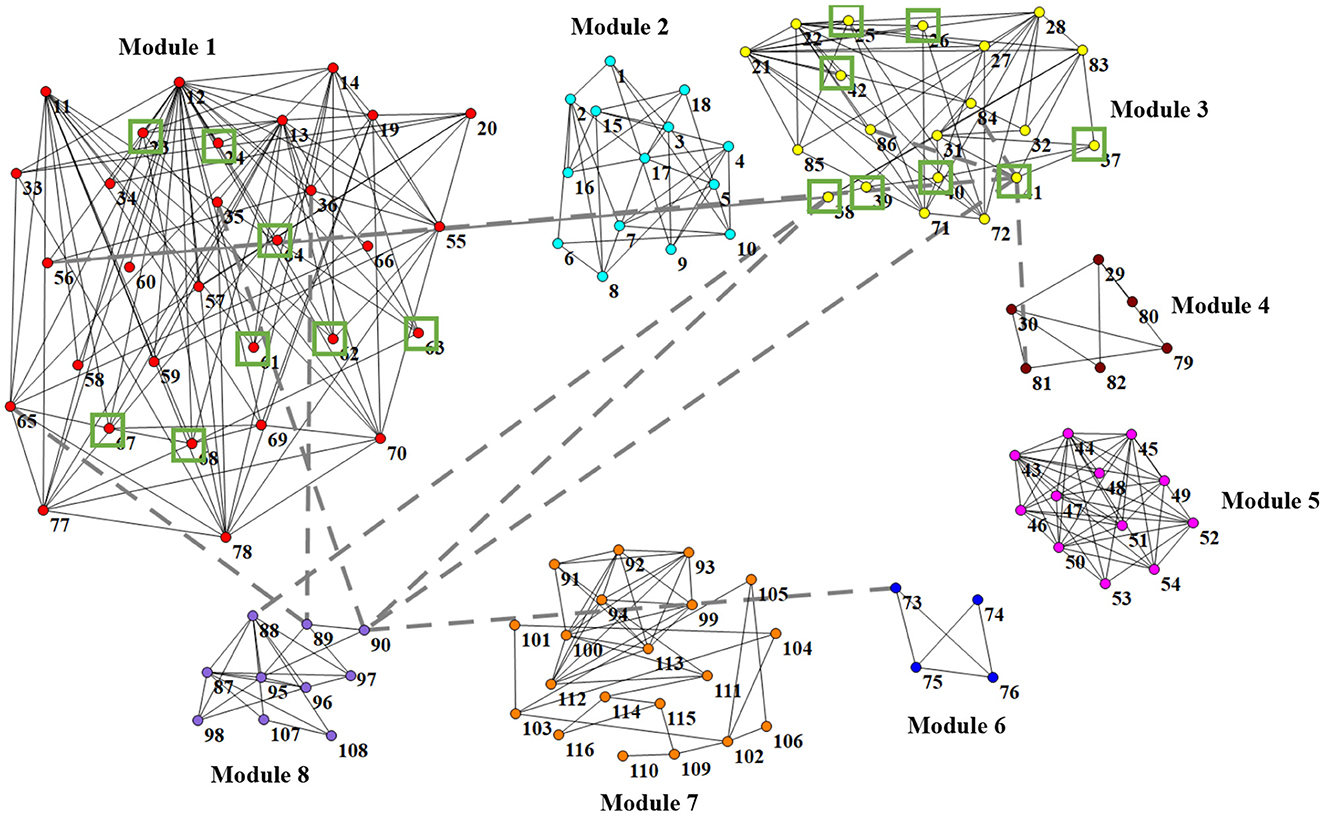
Figure 6. Identified 8 modules of the average network (among training subjects), where nodes with the same color belong to the same module. Gray dotted lines represent the 12 most discriminative connections. Green boxes denote 16 brain regions that are related to MCI (Suk et al., 2015; Yu et al., 2017).
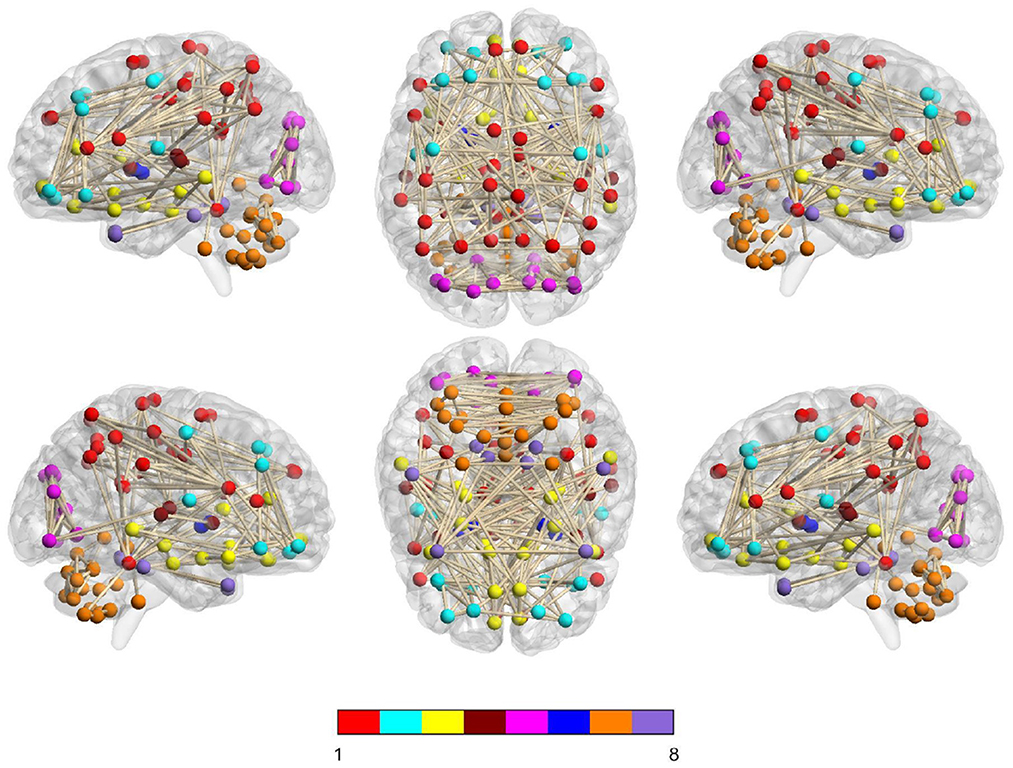
Figure 7. Identified 8 modules of the average network (among training subjects) on the brain template, where nodes with the same color belong to the same module.
From Figures 6, 7, we have the following observations. First, we can clearly see that these eight modules are sparsely connected with each other, while nodes/ROIs within each module are densely connected, which caters to the results in previous papers (Meunier et al., 2010; Bertolero et al., 2018). Second, the ROIs contained in the Module 1 and Module 3 are associated with cognitive functions of the brain, involving the middle temporal gyrus (ROI IDs: 85 and 86), hippocampus (IDs: 37 and 38), parahippocampus (IDs: 39 and 40), precuneus (IDs: 67 and 68), amygdalae (IDs: 41 and 42), supramarginal gyrus (IDs: 63 and 64), inferior parietal lobules (IDs: 61 and 62), superior-medial frontal gyrus (IDs: 23 and 24), and medial orbitofrontal gyrus (IDs: 25 and 26). These regions are believed to be biologically associated with MCI, as reported in previous studies (Yetkin et al., 2006; He et al., 2007; Fair et al., 2008). Besides, we found that most of the 12 most discriminative connections are distributed between Module 1, Module 2 and Module 3. These results may imply that the interruption of the connections between the three modules could be used as potential biomarkers for MCI detection.
4.3. Comparison with state-of-the-arts
We also compare our AM-PC method with several state-of-the-art methods on FBN-based MCI identification with rs-fMRI data from ADNI. In Table 3, we briefly summarize the classification results of several previous studies as well as our method, where the top 2 best results are shown in bold. As can be seen from Table 3, our AM-PC method can achieve the overall comparable results compared with four SOTA methods. Even though the ACC and AUC results reported in Yang et al. (2019) are better than ours, their evaluation was based on a relatively smaller dataset compared with this work.
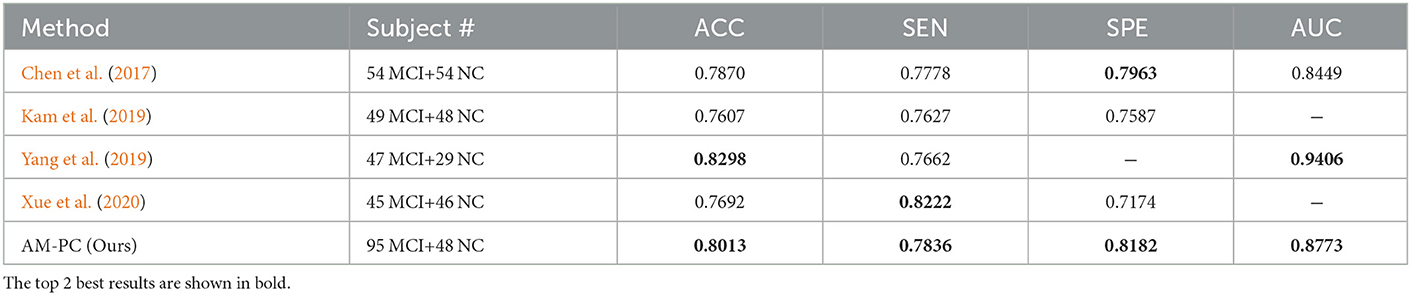
Table 3. Comparison with state-of-the-art methods for FBN-based MCI vs. NC classification with rs-fMRI data from ADNI.
4.4. Limitations and future work
The current work has some limitations. First, in this work, we obtained the modularity of FBNs based on the PC-based networks. In fact, our method can also be combined with other methods (such as sparse representation) to estimate FBNs with modularity (Qiao et al., 2018), which will be our future work. Second, we focus on the within-module connection in this work by introducing an accurate number of modules in the estimated FBNs, without emphasizing between-module connections. In the future, we plan to incorporate both within-module and between-module connections in to the proposed framework for FBN-based brain disease analysis. Third, the small sample size could be an important limitation to the generalizability and replicability of this study. To alleviate this problem, we will utilize transfer learning (Pan and Yang, 2010; Valverde et al., 2021) or meta-learning (Finn et al., 2017; Hospedales et al., 2021) strategy to model the modularity structure of FBN.
5. Conclusion
In this paper, we propose AM-PC method to estimate FBNs for MCI identification. Specifically, we explicitly impose constraints on the rank of the Laplacian matrix and the number of modules of the brain network, aiming to construct sparse FBNs with an accurate number of modules. We also develop an effective optimization algorithm to solve the proposed objective function. Experiments were performed on the ADNI dataset, and the AM-PC achieves the accuracy of 80.13%, sensitivity of 78.13%, specificity of 81.82%, and AUC of 87.73% in MCI identification.
Data availability statement
The original contributions presented in the study are included in the article/supplementary material, further inquiries can be directed to the corresponding author.
Author contributions
YD: conceptualization, methodology, data curation, writing-original draft, writing-review, and editing. GW: methodology, data curation, investigation, writing-review, and editing. CW and YZ: methodology and data curation. XX: writing-review, editing, and supervision. ML and LZ: conceptualization, resources, and supervision. All the authors read and approved the final manuscript.
Funding
YD and LZ were partly supported by the National Natural Science Foundation of China (Nos. 62176112, and 61976110) and the Natural Science Foundation of Shandong Province (No. ZR202102270451).
Conflict of interest
The authors declare that the research was conducted in the absence of any commercial or financial relationships that could be construed as a potential conflict of interest.
Publisher's note
All claims expressed in this article are solely those of the authors and do not necessarily represent those of their affiliated organizations, or those of the publisher, the editors and the reviewers. Any product that may be evaluated in this article, or claim that may be made by its manufacturer, is not guaranteed or endorsed by the publisher.
References
Albert, M. S., DeKosky, S. T., Dickson, D., Dubois, B., Feldman, H. H., Fox, N. C., et al. (2011). The diagnosis of mild cognitive impairment due to Alzheimer's disease: recommendations from the National Institute on Aging-Alzheimer's Association workgroups on diagnostic guidelines for Alzheimer's disease. Alzheimers Dement. 7, 270–279. doi: 10.1016/j.jalz.2011.03.008
Bechtel, W. (2003). “Modules, brain parts, and evolutionary psychology,” in Evolutionary Psychology (Springer), 211–227. doi: 10.1007/978-1-4615-0267-8_10
Bertolero, M. A., Yeo, B., Bassett, D. S., and D'Esposito, M. (2018). A mechanistic model of connector hubs, modularity and cognition. Nat. Hum. Behav. 2, 765–777. doi: 10.1038/s41562-018-0420-6
Bertolero, M. A., Yeo, B. T., and D'Esposito, M. (2015). The modular and integrative functional architecture of the human brain. Proc. Natl. Acad. Sci. U.S.A. 112, E6798–E6807. doi: 10.1073/pnas.1510619112
Bullmore, E., and Sporns, O. (2009). Complex brain networks: graph theoretical analysis of structural and functional systems. Nat. Rev. Neurosci. 10, 186–198. doi: 10.1038/nrn2575
Cartwright, D., and Harary, F. (1956). Structural balance: a generalization of Heider's theory. Psychol. Rev. 63, 277. doi: 10.1037/h0046049
Chang, C.-C., and Lin, C.-J. (2011). LIBSVM: a library for support vector machines. ACM Trans. Intell. Syst. Technol. 2, 1–27. doi: 10.1145/1961189.1961199
Chen, H., Zhang, Y., Zhang, L., Qiao, L., and Shen, D. (2021). Estimating brain functional networks based on adaptively-weighted fMRI signals for MCI identification. Front. Aging Neurosci. 12, 595322. doi: 10.3389/fnagi.2020.595322
Chen, X., Zhang, H., Zhang, L., Shen, C., Lee, S.-W., and Shen, D. (2017). Extraction of dynamic functional connectivity from brain grey matter and white matter for MCI classification. Hum. Brain Mapp. 38, 5019–5034. doi: 10.1002/hbm.23711
Desikan, R. S., Cabral, H. J., Hess, C. P., Dillon, W. P., Glastonbury, C. M., Weiner, M. W., et al. (2009). Automated MRI measures identify individuals with mild cognitive impairment and Alzheimer's disease. Brain 132, 2048–2057. doi: 10.1093/brain/awp123
Disouky, A., Tobin, M. K., Honer, W. G., Kim, N., Dawe, R. J., Bennett, D. A., et al. (2022). Hippocampal neurogenesis in aging and Alzheimer's disease. Biol. Psychiatry 91, S16. doi: 10.1016/j.biopsych.2022.02.059
Fair, D. A., Cohen, A. L., Dosenbach, N. U., Church, J. A., Miezin, F. M., Barch, D. M., et al. (2008). The maturing architecture of the brain's default network. Proc. Natl. Acad. Sci. U.S.A. 105, 4028–4032. doi: 10.1073/pnas.0800376105
Fan, K. (1949). On a theorem of Weyl concerning eigenvalues of linear transformations I. Proc. Natl. Acad. Sci. U.S.A. 35, 652–655. doi: 10.1073/pnas.35.11.652
Finn, C., Abbeel, P., and Levine, S. (2017). “Model-agnostic meta-learning for fast adaptation of deep networks,” in International Conference on Machine Learning (PMLR), 1126–1135. doi: 10.5555/3305381.3305498
Gallen, C. L., Baniqued, P. L., Chapman, S. B., Aslan, S., Keebler, M., Didehbani, N., et al. (2016). Modular brain network organization predicts response to cognitive training in older adults. PLoS ONE 11, e0169015. doi: 10.1371/journal.pone.0169015
Geerligs, L., Renken, R. J., Saliasi, E., Maurits, N. M., and Lorist, M. M. (2015). A brain-wide study of age-related changes in functional connectivity. Cereb. Cortex 25, 1987–1999. doi: 10.1093/cercor/bhu012
Goedert, M., and Spillantini, M. G. (2006). A century of Alzheimer's disease. Science 314, 777–781. doi: 10.1126/science.1132814
Grant, M., and Boyd, S. (2014). CVX: Matlab software for disciplined convex programming, version 2.1. Available online at: http://cvxr.com/cvx/
Grone, R., Merris, R., and Sunder, V. (1990). The laplacian spectrum of a graph. SIAM J. Matrix Anal. Appl. 11, 218–238. doi: 10.1137/0611016
Hampel, H., Bürger, K., Teipel, S. J., Bokde, A. L., Zetterberg, H., and Blennow, K. (2008). Core candidate neurochemical and imaging biomarkers of Alzheimer's disease. Alzheimers Dement. 4, 38–48. doi: 10.1016/j.jalz.2007.08.006
He, Y., Wang, L., Zang, Y., Tian, L., Zhang, X., Li, K., et al. (2007). Regional coherence changes in the early stages of Alzheimer's disease: a combined structural and resting-state functional MRI study. Neuroimage 35, 488–500. doi: 10.1016/j.neuroimage.2006.11.042
Heider, F. (1946). Attitudes and cognitive organization. J. Psychol. 21, 107–112. doi: 10.1080/00223980.1946.9917275
Hospedales, T., Antoniou, A., Micaelli, P., and Storkey, A. (2021). Meta-learning in neural networks: a survey. IEEE Trans. Pattern Anal. Mach. Intell. 44, 5149–5169. doi: 10.1109/TPAMI.2021.3079209
Jiang, X., Zhang, L., Qiao, L., and Shen, D. (2019). Estimating functional connectivity networks via low-rank tensor approximation with applications to MCI identification. IEEE Trans. Biomed. Eng. 67, 1912–1920. doi: 10.1109/TBME.2019.2950712
Jie, B., Liu, M., Zhang, D., and Shen, D. (2018). Sub-network kernels for measuring similarity of brain connectivity networks in disease diagnosis. IEEE Trans. Image Process. 27, 2340–2353. doi: 10.1109/TIP.2018.2799706
Jie, B., Wee, C.-Y., Shen, D., and Zhang, D. (2016). Hyper-connectivity of functional networks for brain disease diagnosis. Med. Image Anal. 32, 84–100. doi: 10.1016/j.media.2016.03.003
Kam, T.-E., Zhang, H., Jiao, Z., and Shen, D. (2019). Deep learning of static and dynamic brain functional networks for early MCI detection. IEEE Trans. Med. Imaging 39, 478–487. doi: 10.1109/TMI.2019.2928790
Kesler, S. R. (2014). Default mode network as a potential biomarker of chemotherapy-related brain injury. Neurobiol. Aging 35, S11-S19. doi: 10.1016/j.neurobiolaging.2014.03.036
Kuo, F. Y., and Sloan, I. H. (2005). Lifting the curse of dimensionality. Notices AMS 52, 1320–1328. Available online at: https://community.ams.org/journals/notices/200511/fea-sloan.pdf
Li, W., Wang, Z., Zhang, L., Qiao, L., and Shen, D. (2017). Remodeling pearson's correlation for functional brain network estimation and autism spectrum disorder identification. Front. Neuroinform. 11, 55. doi: 10.3389/fninf.2017.00055
Liang, X., Zou, Q., He, Y., and Yang, Y. (2016). Topologically reorganized connectivity architecture of default-mode, executive-control, and salience networks across working memory task loads. Cereb. Cortex 26, 1501–1511. doi: 10.1093/cercor/bhu316
Liu, M., Zhang, J., Adeli, E., and Shen, D. (2018). Landmark-based deep multi-instance learning for brain disease diagnosis. Med. Image Anal. 43, 157–168. doi: 10.1016/j.media.2017.10.005
Menon, V. (2018). The triple network model, insight, and large-scale brain organization in autism. Biol. Psychiatry 84, 236–238. doi: 10.1016/j.biopsych.2018.06.012
Meunier, D., Lambiotte, R., and Bullmore, E. T. (2010). Modular and hierarchically modular organization of brain networks. Front. Neurosci. 4, 200. doi: 10.3389/fnins.2010.00200
Meunier, D., Lambiotte, R., Fornito, A., Ersche, K., and Bullmore, E. T. (2009). Hierarchical modularity in human brain functional networks. Front. Neuroinform. 3, 37. doi: 10.3389/neuro.11.037.2009
Murakami, M., Kominami, D., Leibnitz, K., and Murata, M. (2018). Drawing inspiration from human brain networks: Construction of interconnected virtual networks. Sensors 18, 1133. doi: 10.3390/s18041133
Oellermann, O. R., and Schwenk, A. J. (1991). The laplacian spectrum of graphs. Graph. Theory Appl. 2, 871–898.
Pan, S. J., and Yang, Q. (2010). A survey on transfer learning. IEEE Trans. Knowl. Data Eng. 22, 1345–1359. doi: 10.1109/TKDE.2009.191
Qiao, L., Zhang, H., Kim, M., Teng, S., Zhang, L., and Shen, D. (2016). Estimating functional brain networks by incorporating a modularity prior. Neuroimage 141, 399–407. doi: 10.1016/j.neuroimage.2016.07.058
Qiao, L., Zhang, L., Chen, S., and Shen, D. (2018). Data-driven graph construction and graph learning: a review. Neurocomputing 312, 336–351. doi: 10.1016/j.neucom.2018.05.084
Rombouts, S. A., Barkhof, F., Goekoop, R., Stam, C. J., and Scheltens, P. (2005). Altered resting state networks in mild cognitive impairment and mild Alzheimer's disease: an fMRI study. Hum. Brain Mapp. 26, 231–239. doi: 10.1002/hbm.20160
Ryali, S., Chen, T., Supekar, K., and Menon, V. (2012). Estimation of functional connectivity in fMRI data using stability selection-based sparse partial correlation with elastic net penalty. Neuroimage 59, 3852–3861. doi: 10.1016/j.neuroimage.2011.11.054
Smith, S. M., Vidaurre, D., Beckmann, C. F., Glasser, M. F., Jenkinson, M., Miller, K. L., et al. (2013). Functional connectomics from resting-state fMRI. Trends Cogn. Sci. 17, 666–682. doi: 10.1016/j.tics.2013.09.016
Sporns, O., and Betzel, R. F. (2016). Modular brain networks. Annu. Rev. Psychol. 67, 613. doi: 10.1146/annurev-psych-122414-033634
Suk, H.-I., Wee, C.-Y., Lee, S.-W., and Shen, D. (2015). Supervised discriminative group sparse representation for mild cognitive impairment diagnosis. Neuroinformatics 13, 277–295. doi: 10.1007/s12021-014-9241-6
Tzourio-Mazoyer, N., Landeau, B., Papathanassiou, D., Crivello, F., Etard, O., Delcroix, N., et al. (2002). Automated anatomical labeling of activations in SPM using a macroscopic anatomical parcellation of the MNI MRI single-subject brain. Neuroimage 15, 273–289. doi: 10.1006/nimg.2001.0978
Valverde, J. M., Imani, V., Abdollahzadeh, A., De Feo, R., Prakash, M., Ciszek, R., et al. (2021). Transfer learning in magnetic resonance brain imaging: a systematic review. J. Imaging 7, 66. doi: 10.3390/jimaging7040066
Vogt, N. M., Hunt, J. F., Adluru, N., Dean, I. I. I. D. C, Johnson, S. C., et al. (2020). Cortical microstructural alterations in mild cognitive impairment and Alzheimer's disease dementia. Cereb. Cortex 30, 2948–2960. doi: 10.1093/cercor/bhz286
Wang, M., Huang, J., Liu, M., and Zhang, D. (2019a). Functional connectivity network analysis with discriminative hub detection for brain disease identification. Proc. AAAI Conf. Artif. Intell. 33, 1198–1205. doi: 10.1609/aaai.v33i01.33011198
Wang, M., Lian, C., Yao, D., Zhang, D., Liu, M., and Shen, D. (2019b). Spatial-temporal dependency modeling and network hub detection for functional MRI analysis via convolutional-recurrent network. IEEE Trans. Biomed. Eng. 67, 2241–2252. doi: 10.1109/TBME.2019.2957921
Wee, C.-Y., Yap, P.-T., Zhang, D., Wang, L., and Shen, D. (2014). Group-constrained sparse fMRI connectivity modeling for mild cognitive impairment identification. Brain Struct. Funct. 219, 641–656. doi: 10.1007/s00429-013-0524-8
Wen, X., Zhang, H., Li, G., Liu, M., Yin, W., Lin, W., et al. (2019). First-year development of modules and hubs in infant brain functional networks. Neuroimage 185, 222–235. doi: 10.1016/j.neuroimage.2018.10.019
Wong, T.-T. (2015). Performance evaluation of classification algorithms by k-fold and leave-one-out cross validation. Pattern Recognit. 48, 2839–2846. doi: 10.1016/j.patcog.2015.03.009
Xia, M., Wang, J., and He, Y. (2013). Brainnet Viewer: a network visualization tool for human brain connectomics. PLoS ONE 8, e68910. doi: 10.1371/journal.pone.0068910
Xue, Y., Zhang, L., Qiao, L., and Shen, D. (2020). Estimating sparse functional brain networks with spatial constraints for MCI identification. PLoS ONE 15, e0235039. doi: 10.1371/journal.pone.0235039
Yang, P., Zhou, F., Ni, D., Xu, Y., Chen, S., Wang, T., et al. (2019). Fused sparse network learning for longitudinal analysis of mild cognitive impairment. IEEE Trans. Cybern. 51, 233–246. doi: 10.1109/TCYB.2019.2940526
Yetkin, F. Z., Rosenberg, R. N., Weiner, M. F., Purdy, P. D., and Cullum, C. M. (2006). FMRI of working memory in patients with mild cognitive impairment and probable Alzheimer's disease. Eur. Radiol. 16, 193–206. doi: 10.1007/s00330-005-2794-x
Yu, R., Zhang, H., An, L., Chen, X., Wei, Z., and Shen, D. (2017). Connectivity strength-weighted sparse group representation-based brain network construction for MCI classification. Hum. Brain Mapp. 38, 2370–2383. doi: 10.1002/hbm.23524
Zhao, Q.-B., Zhang, X.-F., Sui, D.-N., Zhou, Z.-J., Chen, Q.-C., and Tang, Y.-Y. (2012). The efficiency of a small-world functional brain network. Chin. Phys. Lett. 29, 048702. doi: 10.1088/0256-307X/29/4/048702
Zheng, W., Yao, Z., Xie, Y., Fan, J., and Hu, B. (2018). Identification of Alzheimer's disease and mild cognitive impairment using networks constructed based on multiple morphological brain features. Biol. Psychiatry 3, 887–897. doi: 10.1016/j.bpsc.2018.06.004
Zhou, Y., Qiao, L., Li, W., Zhang, L., and Shen, D. (2018a). Simultaneous estimation of low-and high-order functional connectivity for identifying mild cognitive impairment. Front. Neuroinform. 12, 3. doi: 10.3389/fninf.2018.00003
Zhou, Y., Zhang, L., Teng, S., Qiao, L., and Shen, D. (2018b). Improving sparsity and modularity of high-order functional connectivity networks for MCI and ASD identification. Front. Neurosci. 12, 959. doi: 10.3389/fnins.2018.00959
Zhu, D., Li, K., Terry, D. P., Puente, A. N., Wang, L., Shen, D., et al. (2014). Connectome-scale assessments of structural and functional connectivity in MCI. Hum. Brain Mapp. 35, 2911–2923. doi: 10.1002/hbm.22373
Keywords: functional brain network, modularity, Laplacian matrix, mild cognitive impairment, disease identification
Citation: Du Y, Wang G, Wang C, Zhang Y, Xi X, Zhang L and Liu M (2023) Accurate module induced brain network construction for mild cognitive impairment identification with functional MRI. Front. Aging Neurosci. 15:1101879. doi: 10.3389/fnagi.2023.1101879
Received: 18 November 2022; Accepted: 30 January 2023;
Published: 16 February 2023.
Edited by:
Ana Lloret, University of Valencia, SpainReviewed by:
Qi Zhu, Nanjing University of Aeronautics and Astronautics, ChinaXia-an Bi, Hunan Normal University, China
Weihao Zheng, Lanzhou University, China
Copyright © 2023 Du, Wang, Wang, Zhang, Xi, Zhang and Liu. This is an open-access article distributed under the terms of the Creative Commons Attribution License (CC BY). The use, distribution or reproduction in other forums is permitted, provided the original author(s) and the copyright owner(s) are credited and that the original publication in this journal is cited, in accordance with accepted academic practice. No use, distribution or reproduction is permitted which does not comply with these terms.
*Correspondence: Limei Zhang,  zhanglimei@lcu.edu.cn; Mingxia Liu, mxliu1226@gmail.com
†These authors have contributed equally to this work and share first authorship