Mathematical characterization of population dynamics in breast cancer cells treated with doxorubicin
 Emily Y. Yang
 Grant R. Howard2
  Amy Brock
 Thomas E. Yankeelov
 Guillermo Lorenzo
- 1Oden Institute for Computational Engineering and Sciences, The University of Texas at Austin, Austin, TX, United States
- 2Department of Biomedical Engineering, The University of Texas at Austin, Austin, TX, United States
- 3Livestrong Cancer Institutes, Dell Medical School, The University of Texas at Austin, Austin, TX, United States
- 4Interdisciplinary Life Sciences Program, The University of Texas at Austin, Austin, TX, United States
- 5Department of Diagnostic Medicine, The University of Texas at Austin, Austin, TX, United States
- 6Department of Oncology, The University of Texas at Austin, Austin, TX, United States
- 7Department of Imaging Physics, The University of Texas MD Anderson Cancer Center, Houston, TX, United States
- 8Department of Civil Engineering and Architecture, University of Pavia, Pavia, Italy
The development of chemoresistance remains a significant cause of treatment failure in breast cancer. We posit that a mathematical understanding of chemoresistance could assist in developing successful treatment strategies. Towards that end, we have developed a model that describes the cytotoxic effects of the standard chemotherapeutic drug doxorubicin on the MCF-7 breast cancer cell line. We assume that treatment with doxorubicin induces a compartmentalization of the breast cancer cell population into surviving cells, which continue proliferating after treatment, and irreversibly damaged cells, which gradually transition from proliferating to treatment-induced death. The model is fit to experimental data including variations in drug concentration, inter-treatment interval, and number of doses. Our model recapitulates tumor cell dynamics in all these scenarios (as quantified by the concordance correlation coefficient, CCC > 0.95). In particular, superior tumor control is observed with higher doxorubicin concentrations, shorter inter-treatment intervals, and a higher number of doses (p < 0.05). Longer inter-treatment intervals require adapting the model parameterization after each doxorubicin dose, suggesting the promotion of chemoresistance. Additionally, we propose promising empirical formulas to describe the variation of model parameters as functions of doxorubicin concentration (CCC > 0.78). Thus, we conclude that our mathematical model could deepen our understanding of the cytotoxic effects of doxorubicin and could be used to explore practical drug regimens achieving optimal tumor control.
Introduction
Breast cancer is the most common cancer among women worldwide and the leading cause of cancer death in over 100 countries (Sung et al., 2021). Chemotherapy is a primary component of cancer treatment and options have both advanced and increased considerably in recent years (Anampa et al., 2015). However, the development of chemoresistance, and resulting tumor recurrence, remains a common cause of treatment failure and a primary cause of cancer death (Holohan et al., 2013; Longley and Johnston, 2005). Indeed, for a standard chemotherapy drug such as doxorubicin, breast cancer patients may develop chemoresistance within just 6–10 months (Rivera and Gomez, 2010; O’Shaughnessy, 2005).
From a biological perspective, the development of chemoresistance is governed by many complex mechanisms, such as treatment-induced genetic and epigenetic alterations, altered metabolic states, and adaptive responses of the tumor microenvironment (Easwaran et al., 2014; Zhao, 2016; Dong et al., 2018; Ji et al., 2019). Tumor cells can also possess an intrinsic phenotypic or genetic resistance that can render the therapy ineffective even before acquired chemoresistance develops (Harris et al., 2007; Bernard et al., 2009; Campbell et al., 2018). Moreover, the existence of intratumoral heterogeneity and its role in tumor regrowth have become increasingly recognized, as the presence of even a minor subpopulation of drug-resistant cells can give rise to tumor relapse (Easwaran et al., 2014; Polyak, 2011; Alizadeh et al., 2015; Sun and Yu, 2015). Furthermore, phenotype switching, in which tumor cells swap between varying degrees of drug-resistant and drug-sensitive phenotypes, can enable the establishment of more permanent chemoresistance mechanisms that hinder complete tumor eradication (Easwaran et al., 2014; Meacham and Morrison, 2013; Echeverria et al., 2019; Kumar et al., 2019). Considering the complex biological processes underlying chemoresistance development, we believe that a robust framework is needed to comprehensively integrate the growing knowledge of this phenomenon and guide future research efforts. To this end, experimentally-validated mathematical models of chemoresistance mechanisms could be a potent tool in understanding the dynamics of overall tumor drug response. The description of cancer growth and therapeutic response by leveraging mechanistic mathematical models is a rich field known as mathematical oncology (Yankeelov et al., 2013; Rockne et al., 2019; Lorenzo et al., 2022). This approach has already shown promise in characterizing breast cancer growth and treatment response in both the preclinical and clinical settings (Atuegwu et al., 2013; Pascal et al., 2013; Weis et al., 2015; Zhang et al., 2015; Geng et al., 2017; Palmer and Sorger, 2017; Jarrett et al., 2018; Jarrett et al., 2020a).
There are several mechanistic approaches to mathematically describe chemoresistance (Sun and Hu, 2018; Craig et al., 2019; Craig et al., 2021; Hori et al., 2021), with the original theoretical models dating back more than two decades (Panetta, 1997; Panetta, 1998). The standard strategy consists of defining a multicompartmental tumor cell population including one or multiple species of both drug-resistant and drug-sensitive cells, which evolve and interact over time following a set of ordinary differential equations, or over both space and time according to a set of partial differential equations (Craig et al., 2019; Craig et al., 2021; Hori et al., 2021; Jackson and Byrne, 2000; Greene et al., 2019; Kim et al., 2021; Strobl et al., 2021; Howard et al., 2022). Alternatively, Sun et al. (2016) utilized a stochastic, multiscale model that incorporated heterogeneous population dynamics with drug pharmacokinetics and microenvironment contributions to drug resistance in melanoma patients. Furthermore, Pisco et al. (2013) and Álvarez-Arenas et al. (2019) applied the evolutionary theories of Darwinian selection and Lamarckian induction to guide their modeling of drug resistance in leukemia cells and non-small cell lung carcinoma, respectively. However, despite these promising studies, there is a still a dearth of experimentally-validated mechanistic models of chemoresistance in breast cancer, with which we could test alternative biological hypotheses to ultimately enhance chemotherapeutic strategies for individual patients. For instance, Chapman et al. (2019) developed a model integrating phenotypic switching of cell differentiation states and tumor heterogeneity to characterize therapeutic escape in the triple-negative subtype, but the empirical validation of their model predictions currently remains limited. Additionally, in vitro studies usually label cell lines as homogeneously drug-resistant or drug-sensitive and assume a static drug sensitivity (AbuHammad and Zihlif, 2013; Gottesman, 2002), which overlooks the existence of intratumoral heterogeneity and transient drug resistance. Moreover, preclinical studies often assess tumor cell death at a single time point 24–72 h post-treatment (Martins et al., 2018; Chung et al., 2020; Low et al., 2021). This experimental setting does not enable the characterization of long-term tumor drug responses and, hence, the development of drug-induced chemoresistance.
Here, we present a mechanistic model to describe the dynamics of drug response and chemoresistance development in MCF-7 breast cancer cells treated with doxorubicin, which we fit to time-resolved microscopy measurements of tumor cell number subjected to diverse therapeutic plans over long experimental times (>8 days). Doxorubicin is a cytotoxic anthracycline drug that is extensively used in chemotherapeutic regimens for breast cancer (Jarrett et al., 2020a; Zardavas and Piccart, 2015; Waks and Winer, 2019). As a cytotoxic drug, treatment with doxorubicin primarily induces tumor cell death, but this therapeutic effect may also be preceded by cell cycle arrest (Anampa et al., 2015; Howard et al., 2022; Gewirtz, 1999; Carvalho et al., 2009; McKenna et al., 2017). Our work continues the first efforts of Howard et al. in studying doxorubicin resistance in breast cancer cell populations by leveraging several experimentally-informed mechanistic models (Howard et al., 2022; Howard et al., 2018). While Howard et al. originally proposed multiple models to characterize this phenomenon and selected the best of them for each dataset, we have developed a single model that can be extended for multiple drug doses. To incorporate intratumoral heterogeneity, we assume that the cytotoxic action of doxorubicin treatment induces a compartmentalization of the breast cancer cell population into two subgroups: surviving cells and irreversibly damaged cells, which will ultimately die due to doxorubicin action. We further assume that the surviving cells continue proliferating after exposure to doxorubicin, while the irreversibly damaged cells progressively transition from proliferation to drug-induced death. Hence, the eventual development of chemoresistance will be driven by the surviving cells. Importantly, the model compartmentalization ultimately results from the underlying distribution of diverse drug sensitivity phenotypes in the tumor cell population and its changes after the delivery of each doxorubicin dose (Howard et al., 2022; Pisco et al., 2013; Álvarez-Arenas et al., 2019). To accommodate potentially significant treatment-induced variations in the underlying spectrum of drug resistance phenotypes, we investigate an adaptive parametrization of our model with each doxorubicin dose. Hence, drug sensitivity in the tumor cell population is assumed to be dynamic with time, thereby accounting for tumor cell plasticity (Easwaran et al., 2014; Meacham and Morrison, 2013; Echeverria et al., 2019; Kumar et al., 2019). Additionally, our model is fit to the same time-resolved microscopy experiments used in Howard et al. (2022), in which breast cancer cells were subjected to doxorubicin treatments varying in either drug concentration, inter-treatment interval, or the number of doses. Our results show that our proposed model can fit the data observed in all three scenarios with remarkable accuracy. We have also analyzed the model parameter trends for each experiment and built empirical parameter formulas as functions of doxorubicin concentration, which may provide further insight into the development of chemoresistance.
The remainder of this work is organized as follows. First, given that we utilize the time-resolved microscopy data previously collected by Howard et al. (2022), we briefly outline their acquisition and preprocessing procedures. We also describe the derivation of the model and explain the numerical and statistical methods leveraged in this study. We then present the results from our model fittings for each of the three aforementioned experimental scenarios and analyze the corresponding quality of fit and trends in model parameters. To conclude, we discuss the main implications from our work, its limitations, and future directions.
Methods
Data acquisition and preprocessing
The experimental data leveraged in this study were fully obtained from Howard et al. (2022). In the following, we provide only the salient details of the data acquisition and preprocessing procedures presented in Howard et al. (2022) and directly relevant to our study, to which we added a final outlier assessment.
Cell culture
MCF-7 human breast cancer cells (ATCC HTB-22) were cultured in Minimum Essential Media (Gibco) supplemented with 10% fetal bovine serum (Gibco) and 1% penicillin-streptomycin (Gibco). Cells were maintained at 37°C with 5% CO2. A stable fluorescent cell line expressing constitutive EGFP with a nuclear localization signal (MCF7-EGFPNLS1) was established to aid in the automated cell quantification of the time resolved microscopy measurements (Howard et al., 2022; Howard et al., 2018). Genomic integration of the EGFP expression cassette was accomplished by leveraging the Sleeping Beauty transposon system. The EGFP-NLS sequence was obtained as a gBlock (IDT) and cloned into the optimized Sleeping Beauty transfer vector pSBbi-Neo (which was a gift from Eric Kowarz, Addgene plasmid #60525) (Kowarz et al., 2015). To mediate genomic integration, this two-plasmid system consisting of the transfer vector containing the EGFP-NLS sequence and the pCMV(CAT)T7-SB100 plasmid containing the Sleeping Beauty transposase was co-transfected into the MCF-7 population utilizing Lipofectamine 2000 (mCMV(CAT)T7-SB100 was a gift from Zsuzsanna Izsvak, Addgene plasmid #34879) (Mátés et al., 2009). After gene integration with Sleeping Beauty transposase, EGFP + cells were collected by fluorescence activated cell sorting and maintained in media supplemented with 200 ng/ml G418 (Caisson Labs) in place of penicillin-streptomycin.
Doxorubicin response experiments
Cells were seeded in a 96-well plate at a target density of 2,000 cells/well and grown for approximately 48 h to allow for cell adhesion and recovery from passaging. An IncuCyte S2 Live Cell Analysis System (Essen/Sartorius, Goettingen, Germany) was used to collect fluorescent and phase contrast images every 2–4 h. Images were collected for periods of 21–56 days to ensure that cultures in which cells recover after exposure to doxorubicin were able to display logistic growth. Doxorubicin treatment was prepared by reconstituting doxorubicin hydrochloride (Cayman Chemical 15,007, Ann Arbor, Michigan) in water and mixing it with 100 µl of growth media at 2× the target concentration, which was then added to each well of the plate. The drug-containing media was then replaced with fresh growth media after 24 h. Three experiment types were run, in which either the doxorubicin concentration, the inter-treatment interval, or the number of doses was varied (see Table 1). Each doxorubicin concentration was tested in n = 6 replicates, while each inter-treatment interval and number of doses was tested in n = 12 replicates.
TABLE 1. Experimental conditions. In Experiment 1, one dose of doxorubicin was delivered at concentrations varying from 10 to 300 nM (n = 6). In Experiment 2, two doses of 75 nM doxorubicin were delivered at inter-treatment intervals varying from 0 to 16 days (n = 12). In Experiment 3, one to five doses of 75 nM doxorubicin were delivered at either 2-day or 2-week inter-treatment intervals (n = 12).
Image analysis
Using IncuCyte’s integrated software, the quantification of total tumor cell counts was performed on the fluorescent images using the green fluorescence channel. Individual cells were consistently resolved using standard image analysis techniques of background subtraction, followed by thresholding, edge detection, and minimum area filtering. The phase contrast images were consulted in parallel to aid the validation of image analysis (Howard et al., 2022; Howard et al., 2018).
Data truncation
The tumor cell time courses extracted from some wells did not provide meaningful data throughout the entire time course due to a variety of reasons. These included the cell population growing to confluence and fluctuating with feeding cycles, being disturbed during media replenishment, or growing three-dimensionally resulting in cells overlapping each other and thereby compromising the ability to accurately quantify cell numbers. Thus, for each dataset, the estimated cell number was truncated either just prior to reaching confluence, when the cell number dropped more than 50% due to media handling, or when repeated discontinuities were observed in the time course data.
Data normalization
For smaller discontinuities in which less than 50% of the cells were lost due to media handling, the data was normalized by dividing the cell number at time points before the discontinuity by a constant
in which
Outlier removal
For datasets that possessed outliers, the rmoutliers function from MATLAB R2020b (The Mathworks, Natick, MA) was used to remove data points using median filtering. A visual inspection of the resulting data confirmed that this method removed evident outliers from the original series, while maintaining the natural fluctuations in tumor cell counts (see Supplementary Figures S1–S5).
Mathematical model
We present a mathematical model to describe the response of MCF-7 breast cancer cells to the cytotoxic action of doxorubicin in the three experimental scenarios listed in Table 1. We begin by describing the biological mechanisms captured by the model assuming a single dose of doxorubicin (Experiment 1, Table 1). Then, we show how the model can be generalized to multiple doses (Experiments 2 and 3, Table 1), and can also be modified to vary specific parameters with each dose. Figure 1 illustrates the main tumor cell dynamics described by our model after each dose of doxorubicin, which are further detailed in the following paragraphs. The reader can refer to Supplementary Table S1 for a consolidated list of model parameter definitions and their units.
FIGURE 1. Generalized model of tumor cell response to multiple doses of doxorubicin treatment. We start with a population of untreated tumor cells and let them grow for approximately 48 h. At time
Single-dose model
We start with a population of tumor cells (
where
Let
such that the total tumor cell number
Note that Eqs 4–6 ensure the continuity in the tumor cell count before and after the treatment with doxorubicin, as observed in the corresponding experimental data (see Supplementary Figure S2).
We assume that the surviving cells also follow logistic growth with a different rate and carrying capacity:
where
where
In Eqs 7, 8, we introduce a treated tumor cell carrying capacity
Multiple-dose model
Let us now consider a treatment schedule consisting of
Thus, after the delivery of the
such that the total number of tumor cells during and after treatment with multiple doses of doxorubicin is given by
where
In this multiple-dose model, we assume that the surviving cells continue to follow logistic growth after each of the consecutive doxorubicin doses, as described by Eq. 7. Additionally, each of the
Finally, we further investigate two versions of the multiple-dose model: 1) the general formulation outlined above in which we vary
Numerical methods
Model fitting
We fit the single-dose model to each individual time course of total tumor cell counts from each replicate from Experiment 1 (n = 60; Table 1), and we fit the multiple-dose model to each individual time course of total tumor cell counts from each replicate from Experiments 2 and 3 (n = 108 and 120, respectively; Table 1). Model fitting was carried out with a nonlinear least-squares method, via the MATLAB (R2020b) function lsqnonlin. We leveraged a trust-region reflective algorithm with function, step, and optimality tolerances of 10–6, while the maximum number of function evaluations and iterations was set to 20,000. The parameter bounds and initial guesses were guided by the results from Howard et al. (2022), and are summarized in Supplementary Tables S2, S8, S12, S16, S17. The ordinary differential equations in our models were solved using a Runge-Kutta method as provided by ode45 in MATLAB (R2020b). Supplementary Appendix B in the Supplementary Information provides further details about the model fitting approach used in this study.
Empirical parameter formulas
We constructed empirical formulas for the single-dose model parameters as a function of doxorubicin concentration based on the model fittings to the datasets from Experiment 1 (Table 1). To this end, we also applied a nonlinear least-squares method using a trust-region reflective algorithm provided by lsqnonlin in MATLAB (R2020b), as described in the previous section. The initial guess and bounds for the empirical parameters in these formulas were chosen according to the range of the single-dose model parameter values obtained from the fittings to the datasets from Experiment 1 (Table 1). The medians of the distributions of these fitted model parameters at each doxorubicin concentration were used as the observed values for the empirical parameter formula fits. The choice of the of the empirical formula for each parameter was based on the observed trend of the fitted parameter values obtained with the single-dose model as a function of increasing doxorubicin concentration (e.g., an exponentially decaying trend was represented with an exponential function; see the Results section and Supplementary Tables S6, S7 for further details).
Statistical analysis
To assess our model’s quality of fit to the time course data, we calculated the coefficient of determination (
To assess the validity of the proposed empirical formulas using the single-dose model fittings, we ran a simulation test in which we qualitatively compared the model outcomes based on these formulas with the corresponding experimental observations at each drug concentration. To this end, Latin hypercube sampling based on lhsdesign in MATLAB (R2020b) was used to define 200 parameter combinations assuming uniform distributions over the 95% confidence intervals of the fitted empirical parameter formulas at each doxorubicin concentration, as calculated by nlpredci in MATLAB (R2020b).
Results
Fitting the single-dose model to experiment 1 data: Varying doxorubicin concentrations
Figure 2 shows representative model fits for the observed growth of MCF-7 cell populations treated with only one dose of doxorubicin at concentrations ranging from 10 to 300 nM (Experiment 1, Table 1). Model fits for all replicates at each drug concentration (n = 6) can be found in Supplementary Figure S2. We report the median and range of all the fitted model parameters for each doxorubicin concentration in Supplementary Table S3, while Figure 3 shows the boxplots of the fitted parameter distributions for each doxorubicin concentration. The median and range of the quality of fit metrics for the single-dose model fits to Experiment 1 data (n = 60) were: NRMSE (3.33 [0.80, 12.20]),
FIGURE 2. Representative fits of the single-dose model for varying concentrations of doxorubicin. Data and model fittings are shown for a representative replicate treated with 10–300 nM doxorubicin concentrations (Experiment 1, Table 1). Experimental data are shown in gray circles. The number of total cells, surviving cells, and irreversibly damaged cells obtained with the fitted single-dose model are shown in black, red, and blue solid lines, respectively. The time of doxorubicin delivery (Dox) is represented with a vertical grey dashed line. As doxorubicin concentration is increased, we observe a decrease in the growth rate of surviving cell subpopulation and a faster transition from growth to treatment-induced death in irreversibly damaged cell subpopulation. These drug-induced effects ultimately translate into a longer delay (or even suppression) of total tumor cell population growth post-treatment and lower total tumor cell count for higher doxorubicin concentrations, indicating superior tumor control overall. The median and range of the quality of fit metrics across all replicates in Experiment 1 (n = 60, Table 1) are NRMSE: 3.33 [0.80, 12.20],
FIGURE 3. Empirical parameter formulas for varying doxorubicin concentrations. The proposed empirical formulas indicated at the top of each panel (A–E) were fit to the median of the corresponding parameter distributions obtained from fitting the single-dose model to the varying concentration datasets from Experiment 1 (Table 1).
Figure 3 shows the fitted empirical formulas for the fraction of surviving cells (
Once the parameter formulas had been established, we wanted to qualitatively assess the range of tumor cell population dynamics that our formulas could reproduce. For each doxorubicin concentration, we sampled the 95% confidence intervals of the fitted empirical parameter formulas (dashed purple lines in Figure 3) using Latin hypercube sampling to obtain 200 parameter combinations, with which we ran corresponding model simulations. Figure 4 presents the median and range of the model simulations plotted against the median and range of the experimental data measured at each time point for each doxorubicin concentration tested in Experiment 1 (Table 1). We observe that the proposed empirical parameter formulas (Figure 3) are able to predict a wide range of model solutions and that the simulations are able to capture the overall tumor cell population dynamics observed in the datasets from Experiment 1 (Table 1).
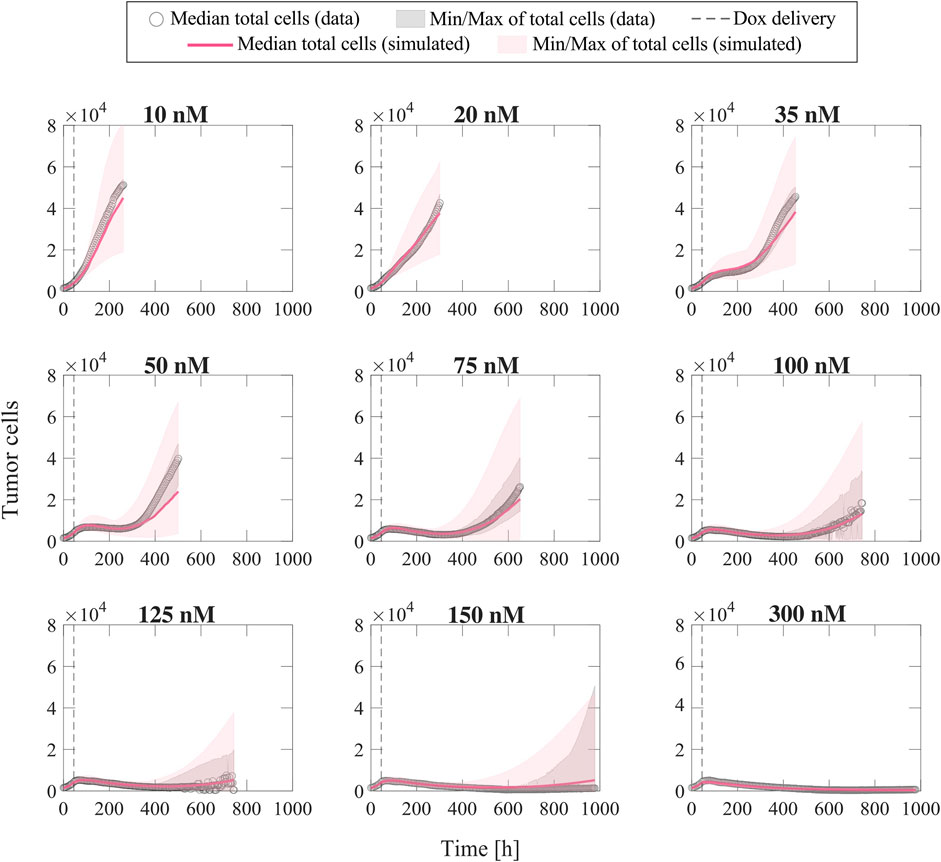
FIGURE 4. Comparison of simulated tumor cell population growth based on empirical parameter formulas with respect to experimental data for varying doxorubicin concentrations. We sampled the 95% confidence intervals for the fitted empirical parameter formulas in Figure 3 using Latin hypercube sampling to obtain 200 parameter combinations for each doxorubicin concentration, with which we carried out corresponding simulations with the single-dose model. The median and range of the model simulations are plotted with the median and range of the experimental data from Experiment 1 (Table 1) at each time point for comparison. The median of the experimental data is shown with gray circles, and the range of the experimental data is represented with gray shaded regions. The median of the model simulations is plotted as a pink solid line, and the range of the simulations is shown as pink shaded regions. The time of doxorubicin delivery is represented with a vertical grey dashed line. We observe that our fitted parameter formulas from Figure 3 can reproduce a wide range of tumor cell population dynamics, including those observed in the varying concentration datasets (Experiment 1, Table 1).
Fitting the multiple-dose model to experiment 2 data: Varying inter-treatment intervals
To fit the experimental data for varying inter-treatment intervals (Experiment 2, Table 1), we initially used the two versions of the multiple-dose model; i.e., with all parameters held constant or varying
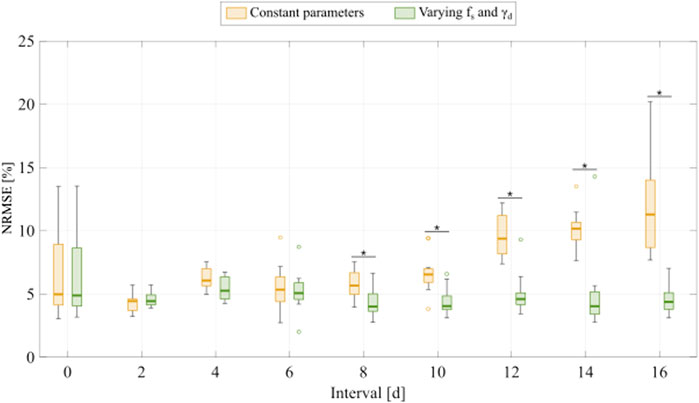
FIGURE 5. Comparison of fitting the experimental data for varying inter-treatment intervals with the multiple-dose model with constant versus varying parameters. For each inter-treatment interval tested in Experiment 2 (Table 1), we compared the normalized root mean squared error (NRMSE) calculated from the fittings using the multiple-dose model with constant parameters (yellow boxplots) with the NRMSE calculated from the fittings using the multiple-dose model with varying
Figure 6 shows representative model fits for the observed growth of MCF-7 cell populations treated with two doses of 75 nM doxorubicin delivered at inter-treatment intervals ranging from 0 to 16 days (Experiment 2, Table 1). Model fits for all the replicates at each inter-treatment interval (n = 12) can be found in Supplementary Figure S3. Additionally, Supplementary Table S9 summarizes the median and range of the fitted model parameters for each inter-treatment interval. The median and range of the quality of fit metrics across all replicates in Experiment 2 (n = 108) were: NRMSE (4.64 [2.74, 14.3]),
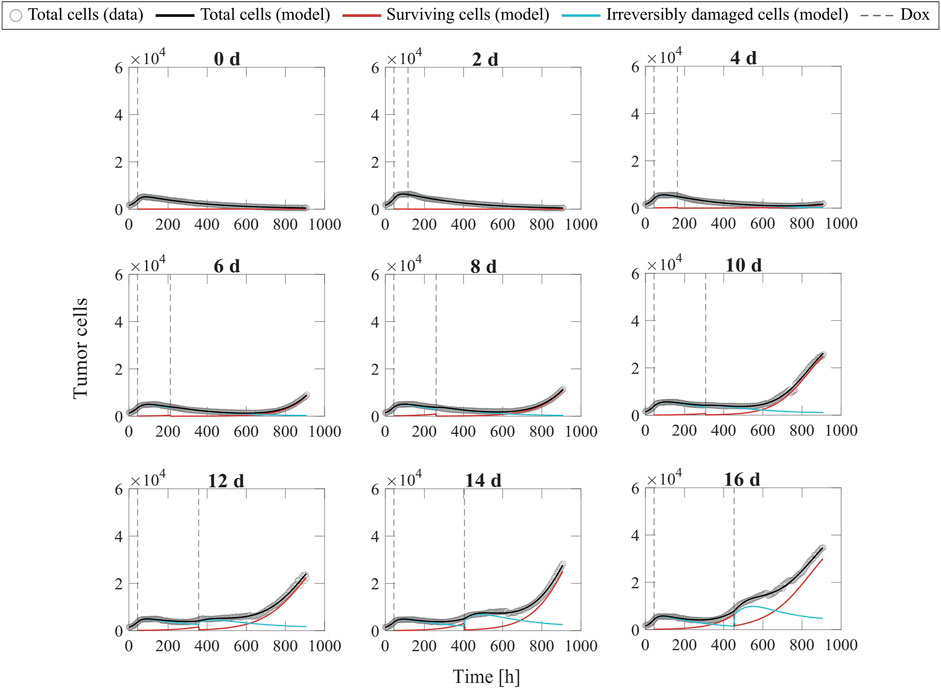
FIGURE 6. Representative fits of the multiple-dose model for varying inter-treatment intervals. Data and model fittings are shown for a representative replicate exposed to two doses of 75 nM doxorubicin delivered at inter-treatment intervals ranging from 0 to 16 days (Experiment 2, Table 1). Experimental data are shown in gray circles. The number of total cells, surviving cells, and irreversibly damaged cells obtained with the fitted multiple-dose model are shown in black, red, and blue solid lines, respectively. The times of doxorubicin (Dox) delivery are represented with vertical grey dashed lines. For the 0-day case, a single line represents a continuous treatment with no interval between the doses. For inter-treatment intervals of 0–6 days, the multiple-dose model with constant parameters was used for data fitting. For inter-treatment intervals of 8–16 days, we used the multiple-dose model with varying
Additionally, Figure 7 shows the distributions of the fitted
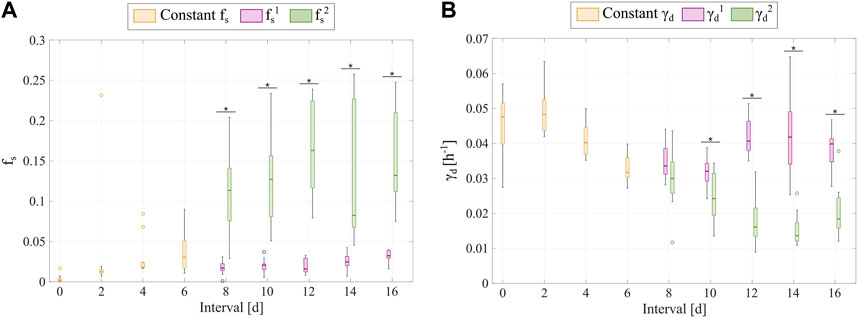
FIGURE 7. Comparison of the
Fitting the multiple-dose model to experiment 3 data: Varying number of doses
Figure 8 shows representative model fits for the observed growth of MCF-7 cell populations treated with 1–5 doses of 75 nM doxorubicin delivered at either 2-day or 2-week inter-treatment intervals (Experiment 3, Table 1). The datasets from the cells treated with a 2-day inter-treatment interval were fitted with the multiple-dose model with constant parameters, while the datasets from the cells treated with a 2-week inter-treatment interval were fitted with the multiple-dose model with varying
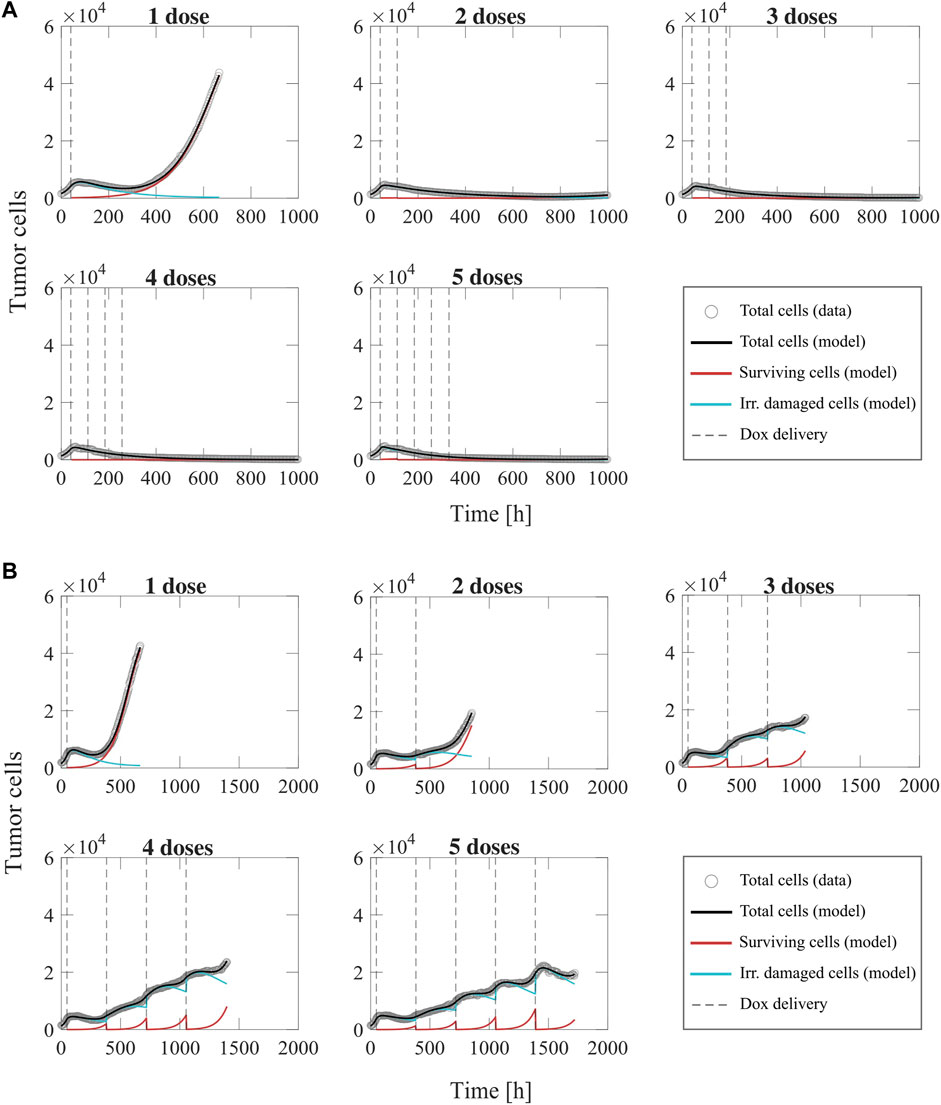
FIGURE 8. Representative fits of the multiple-dose model for a varying number of doxorubicin doses. Data and model results are shown for a representative replicate treated with 1–5 doses of 75 nM doxorubicin delivered at either 2-day or 2-week inter-treatment intervals (Experiment 3, Table 1). Experimental data are shown in gray circles. The number of total cells, surviving cells, and irreversibly damaged cells obtained with the fitted multiple-dose model are shown in black, red, and blue solid lines, respectively. The times at which doxorubicin (Dox) is delivered are represented with vertical grey dashed lines. Panel (A) shows fittings for 1 to 5 doxorubicin doses delivered at 2-day inter-treatment intervals obtained with the model with constant parameters. The median and range of the quality of fit metrics across all replicates for this Experiment 3 subgroup (n = 60, Table 1) are NRMSE: 12.2 [2.72, 19.1],
The model fittings plotted in Figure 8 and Supplementary Figures S4, S5 show that increasing the number of doses contributed to improved tumor control for the two inter-treatment intervals investigated in this work. In general, for the cells treated every 2 days, we observed significantly lower final total tumor cell counts as the number of doses was increased (
We further investigated tumor cell dynamics for the Experiment 3 data with 2-week inter-treatment intervals by analyzing the evolving distributions of parameters
FIGURE 9. Distributions of
Discussion
We have presented a mathematical framework to describe the therapeutic response of MCF-7 breast cancer cells to treatment with doxorubicin and the development of chemoresistance in the in vitro setting. Our mathematical models rely on a compartmentalization of the tumor cell population after the delivery of each drug dose into either surviving cells or irreversibly damaged cells, the latter of which ultimately die due to the cytotoxic action of doxorubicin (Anampa et al., 2015; Howard et al., 2022; Gewirtz, 1999; Carvalho et al., 2009; McKenna et al., 2017). With this dichotomy, we aim to capture the underlying diverse spectrum of drug sensitivities in the tumor cell population, as well as its changes after the delivery of subsequent doxorubicin doses considering different inter-treatment interval lengths (Howard et al., 2022; Pisco et al., 2013; Álvarez-Arenas et al., 2019). We presented a single-dose model that can be extended to a multiple-dose model, in which parameterization can vary with each dose. We fitted our models to various time-resolved microscopy datasets, which enabled us to evaluate tumor cell population dynamics with our models in three experimental scenarios that varied either the doxorubicin concentration, the inter-treatment interval, or the number of doses (see Table 1). In all three cases, our models recapitulated the experimental observations, achieving a remarkable quality of fit.
In Experiment 1 (Table 1), we evaluated the effect of a single dose of doxorubicin on MCF-7 breast cancer cell population growth and we found that tumor control was significantly improved with increased drug concentration (
We used the parameter distributions obtained from our single-dose model fits to the varying drug concentration datasets to empirically fit various parameter formulas as functions of doxorubicin concentration, as shown in Figure 3. The model simulations generated from our proposed empirical parameter formulas were able to capture a spectrum of model solutions that encompass the dynamics observed in our data from Experiment 1 (see Figure 4). We observed clear exponentially decaying trends for the fraction of surviving cells (
Experiment 2 involved the delivery of two doses of doxorubicin to each replicate of MCF-7 breast cancer cells at varying-inter-treatment intervals ranging from 0 to 16 days (Table 1). We fit two versions of our multiple-dose model to these datasets: either with constant parameters or with
In Experiment 3, we treated MCF-7 breast cancer cells with multiple doses of doxorubicin at either 2-day or 2-week inter-treatment intervals (Table 1). We observed significantly improved tumor control with an increased number of doses delivered at a 2-day inter-treatment interval (
Although our work presents promising insights into the mechanisms of chemoresistance, this study does have its limitations. First, we used a limited number of replicates within the scenarios explored in each experiment (n = 6 or 12, see Table 1). Since we do not observe uniform tumor cell populations dynamics across all replicates within each scenario, we would like to re-assess the observations in this study over a larger experimental setup, for example involving a higher number of replicates exposed to more diverse combinations of drug concentration, inter-treatment interval, and number of drug doses. This would enable us to investigate whether these observations are from doxorubicin effects altering tumor cell dynamics or whether the experimental conditions influence the development of a representative distribution of drug-resistant and drug-sensitive cells (e.g., ∼2,000 seeded cells/well might potentially limit the emergence of a resistant subpopulation, which may skew the observed response to treatment). Second, we also acknowledge the general limitations of extrapolating from in vitro systems to tumors in patients (Katt et al., 2016), as cell lines do not capture the unique, heterogeneous nature of each patient’s tumor. To address this limitation, we plan to evaluate our models on clinically-relevant breast cancer cells other than MCF-7 cells (ER + breast cancer), such as the BT-474 (ER + HER2+ breast cancer) and MD-MBA-231 (triple-negative breast cancer) considered by Howard et al. (2022). Third, our cells were grown in monolayers, which are not representative of the three-dimensional tumor geometry in vivo. However, our mathematical models could be made readily applicable to tumor cell spheroid data. In particular, our models could be extended to a set of partial differential equations, accounting for tumor cell mobility and spatially-resolved parameters and variables, which would allow for a spatiotemporal description of spheroid growth in both in vitro and in vivo settings (Jarrett et al., 2020a; Kazerouni et al., 2020). Indeed, these extended models could incorporate other spatially-varying mechanisms beyond tumor cell dynamics, such as drug diffusion, mechanics, and angiogenesis, which have also been recognized as key components of chemoresistance and drug action (Lankelma et al., 1999; Mascheroni et al., 2017; Yonucu et al., 2017; Jarrett et al., 2020b; Kazerouni et al., 2020). Fourth, given that our model requires a moderate number of parameters that may increase with the number of delivered doses of doxorubicin, their estimation from specific experimental data may exhibit a certain degree of uncertainty (see Supplementary Appendix C). Thus, future studies should investigate whether and how the levels of uncertainty obtained for the parameters of our models affect the description of the therapeutic action of doxorubicin on tumor cells, for example, by leveraging a robust Bayesian framework (Lorenzo et al., 2022). Fifth, we only analyzed a constant versus an adaptive parameterization for the surviving fraction (
In future studies, we intend to explore a refinement of our model to account for the mechanisms underlying the trends observed in the empirical parameter formulas from this work, which will help us further understand doxorubicin effects. Additionally, we plan to extend the construction of these empirical formulas over the three-dimensional space spanned by the dosage, the inter-treatment interval, and the number of doses by leveraging a larger collection of replicate datasets exhibiting variations across those three treatment regimen variables. This experimental campaign would expand Experiments 2 and 3 in our study beyond a fixed drug concentration of 75 nM per dose, and an inter-treatment interval of 2 days or 2 weeks in Experiment 3 (see Table 1). We hypothesize that nonlinear dependencies will govern the relationship between the three regimen variables and the model parameters, thereby enabling the capture of a diverse spectrum of therapeutic responses to doxorubicin that we already observed in Experiments 2 and 3 (see Supplementary Figures S3–S5). Hence, the resulting three-dimensional empirical formulas could allow for predicting the outcome of any doxorubicin treatment regimen a priori (i.e., before running the corresponding experiment) by just selecting the treatment schedule (i.e., dosage, inter-treatment interval, and number of doses), but this would require previous validation by leveraging a different collection of experimental datasets than the one used to construct the three-dimensional empirical formulas. Further experimentally informed studies with our mechanistic models could also contribute to identifying the optimal timing and frequency for doxorubicin delivery in preclinical scenarios. Indeed, we would like to explore optimal control theory (Jarrett et al., 2020b; Colli et al., 2021) in vitro through heterogeneous multiclonal cultures to identify optimal treatment combinations of doxorubicin concentration, treatment interval, and number of doses.
High-throughput, time-resolved microscopy in vitro systems enable the collection of vast amounts of time-resolved data on the dynamics of tumor cell populations across multiple, diverse scenarios. We (and others) (Zhang et al., 2015; Strobl et al., 2021; Howard et al., 2022; Pisco et al., 2013; Álvarez-Arenas et al., 2019; McKenna et al., 2017; Kazerouni et al., 2020) posit that these time-resolved datasets can be integrated in mathematical models of tumor cell population dynamics to systematically investigate the effects of drugs on tumor cells across a much broader variety of regimens than are possible to test in vivo. Then, our ultimate goal is to exploit the knowledge gained from a model constructed and validated in a data-rich in vitro preclinical environment (e.g., where hundreds of data points are available for each replicate) to refine mathematical models and their predictions of therapeutic response in a data-poor in vivo clinical environment (i.e., where less than five data points may be available for each patient) (Lorenzo et al., 2022; Weis et al., 2015; Jarrett et al., 2018; Jarrett et al., 2020a). In particular, we think that the mechanistic insights provided by the models and empirical formulas proposed in this study could be leveraged to identify the minimal dose range required to effectively inhibit breast cancer growth in vivo and achieve optimal tumor control, both of which are of great clinical interest (Carvalho et al., 2009; Jarrett et al., 2020b; Harahap et al., 2020; Chan et al., 1999). Thus, we believe that the complex dynamics underlying the dose-dependent effect of doxorubicin deserve further research coupling extensive experiments with mechanistic modeling.
Conclusion
We have developed a biologically-based, mathematical model of MCF-7 breast cancer cell response to the cytotoxic action of doxorubicin accounting for the development of chemoresistance, which significantly extends the experimentally-informed mechanistic models by Howard et al. (2022). To this end, we proposed a modeling framework that can accommodate multiple doxorubicin doses as well as an adaptive parameterization with each drug dose. We show that model fittings to longitudinal, time-resolved microscopy data of MCF-7 breast cancer cells could remarkably recapitulate the observed tumor cell population dynamics for all experimental scenarios varying in either drug concentration, inter-treatment interval, or number of doses. We also propose empirical formulas that describe model parameters as functions of doxorubicin concentration, which could contribute to refining our mechanistic model and further our understanding of doxorubicin action. We report significantly improved tumor control with higher doxorubicin concentrations, shorter inter-treatment intervals, and a higher number of doses. We also observe that longer inter-treatment intervals potentially promote chemoresistance, which manifests as higher surviving fractions and delayed transitions to treatment-induced death in irreversibly damaged subpopulations. Our findings show promise in furthering our understanding of doxorubicin action and chemoresistance progression, while also representing a step towards systematically exploring optimal treatment regimens in vitro.
Data availability statement
Publicly available datasets were analyzed in this study. This data can be found here: https://doi.org/10.5281/zenodo.6973776.
Author contributions
Conceptualization: EYY, GL, and TEY. Methodology: EYY, GL, GRH, AB, and TEY. Software: EYY and GL. Validation: EYY and GL. Formal analysis: EYY, GL, and TEY. Investigation: EYY, GL, GRH, AB, and TEY. Resources: GRH, AB, and TEY. Data curation: EYY, GRH, and AB. Writing-original draft: EYY, GL, and TEY. Writing-review and editing: EYY, GL, GRH, AB, and TEY. Visualization: EYY, and GL. Supervision: GL and TEY. Project Administration: GL. Funding acquisition: TEY.
Funding
GL was partially supported by a Peter O’Donnell Jr. Postdoctoral Fellowship from the Oden Institute for Computational Engineering and Sciences at The University of Texas at Austin and acknowledges funding from the European Union’s Horizon 2020 research and innovation program under the Marie Skłodowska-Curie grant agreement No. 838786. We thank the National Institutes of Health for funding through NCI R01CA240589, U01CA174706, R01CA186193, U24CA226110, and U01CA253540. We thank the Cancer Prevention and Research Institute of Texas for support through CPRIT RR160005; TY is a CPRIT Scholar in Cancer Research.
Conflict of interest
The authors declare that the research was conducted in the absence of any commercial or financial relationships that could be construed as a potential conflict of interest.
Publisher’s note
All claims expressed in this article are solely those of the authors and do not necessarily represent those of their affiliated organizations, or those of the publisher, the editors and the reviewers. Any product that may be evaluated in this article, or claim that may be made by its manufacturer, is not guaranteed or endorsed by the publisher.
Supplementary material
The Supplementary Material for this article can be found online at: https://www.frontiersin.org/articles/10.3389/fmolb.2022.972146/full#supplementary-material
References
AbuHammad, S., and Zihlif, M. (2013). Gene expression alterations in doxorubicin resistant MCF7 breast cancer cell line. Genomics 101, 213–220. doi:10.1016/j.ygeno.2012.11.009
Alizadeh, A. A., Aranda, V., Bardelli, A., Blanpain, C., Bock, C., Borowski, C., et al. (2015). Toward understanding and exploiting tumor heterogeneity. Nat. Med. 21, 846–853. doi:10.1038/nm.3915
Al’Khafaji, A. M., Deatherage, D., and Brock, A. (2018). Control of lineage-specific gene expression by functionalized gRNA barcodes. ACS Synth. Biol. 7, 2468–2474. doi:10.1021/acssynbio.8b00105
Álvarez-Arenas, A., Podolski-Renic, A., Belmonte-Beitia, J., Pesic, M., and Calvo, G. F. (2019). Interplay of darwinian selection, lamarckian induction and microvesicle transfer on drug resistance in cancer. Sci. Rep. 9, 9332. doi:10.1038/s41598-019-45863-z
Anampa, J., Makower, D., and Sparano, J. A. (2015). Progress in adjuvant chemotherapy for breast cancer: An overview. BMC Med., 195. doi:10.1186/s12916-015-0439-8
Atuegwu, N. C., Arlinghaus, L. R., Li, X., Chakravarthy, A. B., Abramson, V. G., Sanders, M. E., et al. (2013). Parameterizing the logistic model of tumor growth by DW-MRI and DCE-MRI data to predict treatment response and changes in breast cancer cellularity during neoadjuvant chemotherapy. Transl. Oncol. 6, 256–264. doi:10.1593/tlo.13130
Bernard, P. S., Mullins, M., Cheang, M. C. U., Leung, S., Voduc, D., Vickery, T., et al. (2009). Supervised risk predictor of breast cancer based on intrinsic subtypes. J. Clin. Oncol. 27, 1160–1167. doi:10.1200/JCO.2008.18.1370
Campbell, K. J., Dhayade, S., Ferrari, N., Sims, A. H., Johnson, E., Mason, S. M., et al. (2018). MCL-1 is a prognostic indicator and drug target in breast cancer. Cell Death Dis. 9, 19–14. doi:10.1038/s41419-017-0035-2
Carvalho, C., Santos, R. X., Cardoso, S., Correia, S., Oliveira, P. J., Santos, M. S., et al. (2009). Doxorubicin: The good, the bad and the ugly effect. Curr. Med. Chem. 16, 3267–3285. doi:10.2174/092986709788803312
Chan, S., Friedrichs, K., Noel, D., PinTer, T., Van Belle, S., Vorobiof, D., et al. (1999). Prospective randomized trial of docetaxel versus doxorubicin in patients with metastatic breast cancer. J. Clin. Oncol. 17, 2341–2354. doi:10.1200/JCO.1999.17.8.2341
Chapman, M. P., Risom, T., Aswani, A. J., Langer, E. M., Sears, R. C., and Tomlin, C. J. (2019). Modeling differentiation-state transitions linked to therapeutic escape in triple-negative breast cancer. PLoS Comput. Biol. 15, e1006840. doi:10.1371/journal.pcbi.1006840
Chung, L. Y., Tang, S. J., Wu, Y. C., Yang, K. C., Huang, H. J., Sun, G. H., et al. (2020). Platinum-based combination chemotherapy triggers cancer cell death through induction of BNIP3 and ROS, but not autophagy. J. Cell. Mol. Med. 24, 1993–2003. doi:10.1111/jcmm.14898
Citron, M. L., Berry, D. A., Cirrincione, C., Hudis, C., Winer, E. P., Gradishar, W. J., et al. (2003). Randomized trial of dose-dense versus conventionally scheduled and sequential versus concurrent combination chemotherapy as postoperative adjuvant treatment of node-positive primary breast cancer: First report of intergroup trial C9741/cancer and leukemia group B trial 9741. J. Clin. Oncol. 21, 1431–1439. doi:10.1200/JCO.2003.09.081
Colli, P., Gomez, H., Lorenzo, G., Marinoschi, G., Reali, A., and Rocca, E. (2021). Optimal control of cytotoxic and antiangiogenic therapies on prostate cancer growth. Math. Models Methods Appl. Sci. 31, 1419–1468. doi:10.1142/S0218202521500299
Craig, M., Jenner, A. L., Namgung, B., Lee, L. P., and Goldman, A. (2021). Engineering in medicine to address the challenge of cancer drug resistance: From micro-and nanotechnologies to computational and mathematical modeling. Chem. Rev. 121, 3352–3389. doi:10.1021/acs.chemrev.0c00356
Craig, M., Kaveh, K., Woosley, A., Brown, A. S., Goldman, D., Eton, E., et al. (2019). Cooperative adaptation to therapy (CAT) confers resistance in heterogeneous non-small cell lung cancer. PLoS Comput. Biol. 15, e1007278. doi:10.1371/journal.pcbi.1007278
Czeczuga-Semeniuk, E., Wołczyński, S., Dabrowska, M., Dziecioł, J., and Anchim, T. (2004). The effect of doxorubicin and retinoids on proliferation, necrosis and apoptosis in MCF-7 breast cancer cells. Folia histochem. Cytobiol. 42, 221–227.
De Souza, R., Zahedi, P., Badame, R. M., Allen, C., and Piquette-Miller, M. (2011). Chemotherapy dosing schedule influences drug resistance development in ovarian cancer. Mol. Cancer Ther. 10, 1289–1299. doi:10.1158/1535-7163.MCT-11-0058
Dong, H., Wang, W., Mo, S., Chen, R., Zou, K., Han, J., et al. (2018). SP1-induced lncRNA AGAP2-AS1 expression promotes chemoresistance of breast cancer by epigenetic regulation of MyD88. J. Exp. Clin. Cancer Res. 37, 202–215. doi:10.1186/s13046-018-0875-3
Easwaran, H., Tsai, H. C., and Baylin, S. B. (2014). Cancer epigenetics: Tumor heterogeneity, plasticity of stem-like states, and drug resistance. Mol. Cell 54, 716–727. doi:10.1016/j.molcel.2014.05.015
Echeverria, G. V., Ge, Z., Seth, S., Zhang, X., Jeter-Jones, S., Zhou, X., et al. (2019). Resistance to neoadjuvant chemotherapy in triple-negative breast cancer mediated by a reversible drug-tolerant state. Sci. Transl. Med. 11, eaav0936. doi:10.1126/scitranslmed.aav0936
El-Kareh, A. W., and Secomb, T. W. (2005). Two-mechanism peak concentration model for cellular pharmacodynamics of doxorubicin. Neoplasia 7, 705–713. doi:10.1593/neo.05118
Foukakis, T., von Minckwitz, G., Bengtsson, N. O., Brandberg, Y., Wallberg, B., Fornander, T., et al. (2016). Effect of tailored dose-dense chemotherapy vs standard 3-weekly adjuvant chemotherapy on recurrence-free survival amongwomen with high-risk early breast cancer: A randomized clinical trial. JAMA 316, 1888–1896. doi:10.1001/jama.2016.15865
Geng, C., Paganetti, H., and Grassberger, C. (2017). Prediction of treatment response for combined chemo- and radiation therapy for non-small cell lung cancer patients using a bio-mathematical model. Sci. Rep. 7, 13542. doi:10.1038/s41598-017-13646-z
Gewirtz, D. A. (1999). A critical evaluation of the mechanisms of action proposed for the antitumor effects of the anthracycline antibiotics adriamycin and daunorubicin. Biochem. Pharmacol. 57, 727–741. doi:10.1016/s0006-2952(98)00307-4
Girifalco, L. A., and Weizer, V. G. (1959). Application of the Morse potential function to cubic metals. Phys. Rev. 114, 687–690. doi:10.1103/physrev.114.687
Gottesman, M. M. (2002). Mechanisms of cancer drug resistance. Annu. Rev. Med., 53 615–627. doi:10.1146/annurev.med.53.082901.103929
Greene, J. M., Gevertz, J. L., and Sontag, E. D. (2019). Mathematical approach to differentiate spontaneous and induced evolution to drug resistance during cancer treatment. JCO Clin. Cancer Inf. 3, 1–20. doi:10.1200/cci.18.00087
Harahap, Y., Ardiningsih, P., Winarti, A. C., and Purwanto, D. J. (2020). Analysis of the doxorubicin and doxorubicinol in the plasma of breast cancer patients for monitoring the toxicity of doxorubicin. Drug Des. devel. Ther. 14, 3469–3475. doi:10.2147/DDDT.S251144
Harris, L. N., You, F., Schnitt, S. J., Witkiewicz, A., Lu, X., Sgroi, D., et al. (2007). Predictors of resistance to preoperative trastuzumab and vinorelbine for HER2-positive early breast cancer. Clin. Cancer Res. 13, 1198–1207. doi:10.1158/1078-0432.CCR-06-1304
Holohan, C., Van Schaeybroeck, S., Longley, D. B., and Johnston, P. G. (2013). Cancer drug resistance: An evolving paradigm. Nat. Rev. Cancer 13, 714–726. doi:10.1038/nrc3599
Hori, S. S., Tong, L., Swaminathan, S., Liebersbach, M., Wang, J., Gambhir, S. S., et al. (2021). A mathematical model of tumor regression and recurrence after therapeutic oncogene inactivation. Sci. Rep. 11, 1341. doi:10.1038/s41598-020-78947-2
Howard, G. R., Johnson, K. E., Rodriguez Ayala, A., Yankeelov, T. E., and Brock, A. (2018). A multi-state model of chemoresistance to characterize phenotypic dynamics in breast cancer. Sci. Rep. 8, 12058. doi:10.1038/s41598-018-30467-w
Howard, G. R., Jost, T. A., Yankeelov, T. E., and Brock, A. (2022). Quantification of long-term doxorubicin response dynamics in breast cancer cell lines to direct treatment schedules. PLoS Comput. Biol. 18, e1009104. doi:10.1371/journal.pcbi.1009104
Jackson, T. L., and Byrne, H. M. (2000). A mathematical model to study the effects of drug resistance and vasculature on the response of solid tumors to chemotherapy. Math. Biosci. 164, 17–38. doi:10.1016/s0025-5564(99)00062-0
Jarrett, A. M., Faghihi, D., Ii, D. A. H., Lima, E. A. B. F., Virostko, J., Biros, G., et al. (2020). Optimal control theory for personalized therapeutic regimens in oncology: Background, history, challenges, and opportunities. J. Clin. Med. 9, 1314. doi:10.3390/jcm9051314
Jarrett, A. M., Hormuth, D. A., Barnes, S. L., Feng, X., Huang, W., and Yankeelov, T. E. (2018). Incorporating drug delivery into an imaging-driven, mechanics-coupled reaction diffusion model for predicting the response of breast cancer to neoadjuvant chemotherapy: Theory and preliminary clinical results. Phys. Med. Biol. 63, 105015. doi:10.1088/1361-6560/aac040
Jarrett, A. M., Hormuth, D. A., Wu, C., Kazerouni, A. S., Ekrut, D. A., Virostko, J., et al. (2020). Evaluating patient-specific neoadjuvant regimens for breast cancer via a mathematical model constrained by quantitative magnetic resonance imaging data. Neoplasia 22, 820–830. doi:10.1016/j.neo.2020.10.011
Ji, X., Lu, Y., Tian, H., Meng, X., Wei, M., and Cho, W. C. (2019). Chemoresistance mechanisms of breast cancer and their countermeasures. Biomed. Pharmacother. 114, 108800. doi:10.1016/j.biopha.2019.108800
Katt, M. E., Placone, A. L., Wong, A. D., Xu, Z. S., and Searson, P. C. (2016). In vitro tumor models: Advantages, disadvantages, variables, and selecting the right platform. Front. Bioeng. Biotechnol. 4, 12. doi:10.3389/fbioe.2016.00012
Kazerouni, A. S., Gadde, M., Gardner, A., Hormuth, D. A., Jarrett, A. M., Johnson, K. E., et al. (2020). Integrating quantitative assays with biologically based mathematical modeling for predictive oncology. iScience 23, 101807. doi:10.1016/j.isci.2020.101807
Kim, E., Brown, J. S., Eroglu, Z., and Anderson, A. R. A. (2021). Adaptive therapy for metastatic melanoma: Predictions from patient calibrated mathematical models. Cancers (Basel) 13, 823. doi:10.3390/cancers13040823
Kowarz, E., Löscher, D., and Marschalek, R. (2015). Optimized Sleeping Beauty transposons rapidly generate stable transgenic cell lines. Biotechnol. J. 10, 647–653. doi:10.1002/biot.201400821
Kumar, N., Cramer, G. M., Dahaj, S. A. Z., Sundaram, B., Celli, J. P., and Kulkarni, R. V. (2019). Stochastic modeling of phenotypic switching and chemoresistance in cancer cell populations. Sci. Rep. 9, 10845. doi:10.1038/s41598-019-46926-x
Lankelma, J., Dekker, H., Luque, F. R., Luykx, S., HoeKman, K., van der Valk, P., et al. (1999). Doxorubicin gradients in human breast cancer. Clin. Cancer Res. 5, 1703–1707.
Lin, L. I.-K. (1989). A concordance correlation coefficient to evaluate reproducibility. Biometrics 45, 255. doi:10.2307/2532051
Longley, D. B., and Johnston, P. G. (2005). Molecular mechanisms of drug resistance. J. Pathology, 205 275–292.
Lorenzo, G., Hormuth II, D. A, Jarrett, A. M., Lima, E. A. B. F., Subramanian, S., Biros, G., et al. (2022). “Quantitative in vivo imaging to enable tumor forecasting and treatment optimization” in Cancer, Complexity, Computation Editors I. Balaz, and A. Adamatzky (Springer), 55–97.
Low, H. B., Wong, Z. L., Wu, B., Kong, L. R., Png, C. W., Cho, Y. L., et al. (2021). DUSP16 promotes cancer chemoresistance through regulation of mitochondria-mediated cell death. Nat. Commun. 12, 2284. doi:10.1038/s41467-021-22638-7
Lyman, G. H. (2009). Impact of chemotherapy dose intensity on cancer patient outcomes. J. Natl. Compr. Canc. Netw. 7, 99–108. doi:10.6004/jnccn.2009.0009
Martins, I., Raza, S. Q., Voisin, L., Dakhli, H., Allouch, A., Law, F., et al. (2018). Anticancer chemotherapy and radiotherapy trigger both non-cell-autonomous and cell-autonomous death. Cell Death Dis. 9, 716–718. doi:10.1038/s41419-018-0747-y
Mascheroni, P., Boso, D., Preziosi, L., and Schrefler, B. A. (2017). Evaluating the influence of mechanical stress on anticancer treatments through a multiphase porous media model. J. Theor. Biol. 421, 179–188. doi:10.1016/j.jtbi.2017.03.027
Mátés, L., Chuah, M. K. L., Belay, E., Jerchow, B., Manoj, N., Acosta-Sanchez, A., et al. (2009). Molecular evolution of a novel hyperactive Sleeping Beauty transposase enables robust stable gene transfer in vertebrates. Nat. Genet. 41, 753–761. doi:10.1038/ng.343
McKenna, M. T., Weis, J. A., Barnes, S. L., Tyson, D. R., Miga, M. I., Quaranta, V., et al. (2017). A predictive mathematical modeling approach for the study of doxorubicin treatment in triple negative breast cancer. Sci. Rep. 7, 5725. doi:10.1038/s41598-017-05902-z
Meacham, C. E., and Morrison, S. J. (2013). Tumour heterogeneity and cancer cell plasticity. Nature, 501 328–337. doi:10.1038/nature12624
Neale, M. H., Lamont, A., Hindley, A., Kurbacher, C. M., and Cree, I. A. (2000). The ex vivo effect of high concentrations of doxorubicin on recurrent ovarian carcinoma. Anticancer. Drugs 11, 865–871. doi:10.1097/00001813-200011000-00011
O’Shaughnessy, J. (2005). Extending survival with chemotherapy in metastatic breast cancer. Oncol. 10, 20–29. doi:10.1634/theoncologist.10-90003-20
Palmer, A. C., and Sorger, P. K. (2017). Combination cancer therapy can confer benefit via patient-to-patient variability without drug additivity or synergy. Cell 171, 1678–1691. doi:10.1016/j.cell.2017.11.009.e13
Panetta, J. C. A. (1997). A logistic model of periodic chemotherapy with drug resistance. Appl. Math. Lett. 10, 123–127. doi:10.1016/s0893-9659(96)00123-1
Panetta, J. C. (1998). A mathematical model of drug resistance: Heterogeneous tumors. Math. Biosci. 147, 41–61. doi:10.1016/s0025-5564(97)00080-1
Pascal, J., Bearer, E. L., Wang, Z., Koay, E. J., Curley, S. A., and Cristini, V. (2013). Mechanistic patient-specific predictive correlation of tumor drug response with microenvironment and perfusion measurements. Proc. Natl. Acad. Sci. U. S. A. 110, 14266–14271. doi:10.1073/pnas.1300619110
Pisco, A. O., Brock, A., Zhou, J., Moor, A., Mojtahedi, M., Jackson, D., et al. (2013). Non-Darwinian dynamics in therapy-induced cancer drug resistance. Nat. Commun. 4, 2467. doi:10.1038/ncomms3467
Polyak, K. (2011). Heterogeneity in breast cancer. J. Clin. Invest. 121, 3786–3788. doi:10.1172/JCI60534
Ponnusamy, L., Mahalingaiah, P. K. S., and Singh, K. P. (2017). Treatment schedule and estrogen receptor-status influence acquisition of doxorubicin resistance in breast cancer cells. Eur. J. Pharm. Sci. 104, 424–433. doi:10.1016/j.ejps.2017.04.020
Richards, M. A., HoPwood, P., Ramirez, A. J., Twelves, C. J., Ferguson, J., Gregory, W. M., et al. (1992). Doxorubicin in advanced breast cancer: Influence of schedule on response, survival and quality of life. Eur. J. Cancer 28, 1023–1028. doi:10.1016/0959-8049(92)90447-a
Rivera, E., and Gomez, H. (2010). Chemotherapy resistance in metastatic breast cancer: The evolving role of ixabepilone. Breast Cancer Res. 12 S2, S2. doi:10.1186/bcr2573
Rockne, R. C., Hawkins-Daarud, A., Swanson, K. R., Sluka, J. P., Glazier, J. A., Macklin, P., et al. (2019). The 2019 mathematical oncology roadmap. Phys. Biol. 16, 041005. doi:10.1088/1478-3975/ab1a09
Strobl, M. A. R., West, J., Viossat, Y., Damaghi, M., Robertson-Tessi, M., Brown, J. S., et al. (2021). Turnover modulates the need for a cost of resistance in adaptive therapy. Cancer Res. 81, 1135–1147. doi:10.1158/0008-5472.CAN-20-0806
Sun, X., Bao, J., and Shao, Y. (2016). Mathematical modeling of therapy-induced cancer drug resistance: Connecting cancer mechanisms to population survival rates. Sci. Rep. 6, 22498. doi:10.1038/srep22498
Sun, X., and Hu, B. (2018). Mathematical modeling and computational prediction of cancer drug resistance. Brief. Bioinform. 19, 1382–1399. doi:10.1093/bib/bbx065
Sun, X. X., and Yu, Q. (2015). Intra-tumor heterogeneity of cancer cells and its implications for cancer treatment. Acta Pharmacol. Sin. 36, 1219–1227. doi:10.1038/aps.2015.92
Sung, H., Ferlay, J., Siegel, R. L., Laversanne, M., Soerjomataram, I., Jemal, A., et al. (2021). Global cancer statistics 2020: GLOBOCAN estimates of incidence and mortality worldwide for 36 cancers in 185 countries. Ca. Cancer J. Clin. 71, 209–249. doi:10.3322/caac.21660
Untch, M., Mobus, V., Kuhn, W., Muck, B. R., Thomssen, C., Bauerfeind, I., et al. (2009). Intensive dose-dense compared with conventionally scheduled preoperative chemotherapy for high-risk primary breast cancer. J. Clin. Oncol. 27, 2938–2945. doi:10.1200/JCO.2008.20.3133
Waks, A. G., and Winer, E. P. (2019). Breast cancer treatment: A review. JAMA, 321 288–300. doi:10.1001/jama.2018.19323
Weis, J. A., Miga, M. I., Arlinghaus, L. R., Li, X., Abramson, V., Chakravarthy, A. B., et al. (2015). Predicting the response of breast cancer to neoadjuvant therapy using a mechanically coupled reaction-diffusion model. Cancer Res. 75, 4697–4707. doi:10.1158/0008-5472.CAN-14-2945
Yankeelov, T. E., Atuegwu, N., Hormuth, D., Weis, J. A., Barnes, S. L., Miga, M. I., et al. (2013). Clinically relevant modeling of tumor growth and treatment response. Sci. Transl. Med. 5, 187ps9. doi:10.1126/scitranslmed.3005686
Yonucu, S., Yιlmaz, D., Phipps, C., Unlu, M. B., and Kohandel, M. (2017). Quantifying the effects of antiangiogenic and chemotherapy drug combinations on drug delivery and treatment efficacy. PLoS Comput. Biol. 13, e1005724. doi:10.1371/journal.pcbi.1005724
Zardavas, D., and Piccart, M. (2015). Neoadjuvant therapy for breast cancer. Annu. Rev. Med. 66, 31–48. doi:10.1146/annurev-med-051413-024741
Zhang, N., Wang, H., Fang, Y., Wang, J., Zheng, X., and Liu, X. S. (2015). Predicting anticancer drug responses using a dual-layer integrated cell line-drug network model. PLoS Comput. Biol. 11, e1004498. doi:10.1371/journal.pcbi.1004498
Zhao, J. (2016). Cancer stem cells and chemoresistance: The smartest survives the raid. Pharmacol. Ther., 160 145–158.
Keywords: mathematical oncology, mathematical modeling, population dynamics, chemotherapy, drug resistance, breast cancer, time-resolved microscopy
Citation: Yang EY, Howard GR, Brock A, Yankeelov TE and Lorenzo G (2022) Mathematical characterization of population dynamics in breast cancer cells treated with doxorubicin. Front. Mol. Biosci. 9:972146. doi: 10.3389/fmolb.2022.972146
Received: 17 June 2022; Accepted: 17 August 2022;
Published: 12 September 2022.
Edited by:
George Bebis, University of Nevada, Reno, United StatesReviewed by:
Mohit Kumar Jolly, Indian Institute of Science (IISc), IndiaAritro Nath, City of Hope National Medical Center, United States
Copyright © 2022 Yang, Howard, Brock, Yankeelov and Lorenzo. This is an open-access article distributed under the terms of the Creative Commons Attribution License (CC BY). The use, distribution or reproduction in other forums is permitted, provided the original author(s) and the copyright owner(s) are credited and that the original publication in this journal is cited, in accordance with accepted academic practice. No use, distribution or reproduction is permitted which does not comply with these terms.
*Correspondence: Guillermo Lorenzo, guillermo.lorenzo@utexas.edu, guillermo.lorenzo@unipv.it