A Novel Defined Risk Signature of the Ferroptosis-Related Genes for Predicting the Prognosis of Ovarian Cancer
 Ying Ye
 Qinjin Dai
 Shuhong Li
 Jie He
 Hongbo Qi
- 1The Department of Obstetrics, The First Affiliated Hospital of Chongqing Medical University, Chongqing, China
- 2State Key Laboratory of Maternal and Fetal Medicine of Chongqing Municipality, Chongqing Medical University, Chongqing, China
- 3Guangzhou Women and Children's Medical Center, Guangzhou Medical University, Guangzhou, Guangdong, China
- 4The Department of Oncology, The First Affiliated Hospital of Chongqing Medical University, Chongqing, China
Ferroptosis is an iron-dependent, regulated form of cell death, and the process is complex, consisting of a variety of metabolites and biological molecules. Ovarian cancer (OC) is a highly malignant gynecologic tumor with a poor survival rate. However, the predictive role of ferroptosis-related genes in ovarian cancer prognosis remains unknown. In this study, we demonstrated that the 57 ferroptosis-related genes were expressed differently between ovarian cancer and normal ovarian tissue, and based on these genes, all OC cases can be well divided into 2 subgroups by applying consensus clustering. We utilized the least absolute shrinkage and selection operator (LASSO) cox regression model to develop a multigene risk signature from the TCGA cohort and then validated it in an OC cohort from the GEO database. A 5-gene signature was built and reveals a favorable predictive efficacy in both TCGA and GEO cohort (P < 0.001 and P = 0.03). The GO and KEGG analysis revealed that the differentially expressed genes (DEGs) between the low- and high-risk subgroup divided by our risk model were associated with tumor immunity, and lower immune status in the high-risk group was discovered. In conclusion, ferroptosis-related genes are vital factors predicting the prognosis of OC and could be a novel potential treatment target.
Introduction
Ovarian cancer (OC) is the most lethal malignancy among gynecological tumors and causes ~150,000 women to death every year (Lheureux et al., 2019). Due to the lack of typical clinical symptoms in the early phases, 75% of OC patients are diagnosed at advanced stages, and more than 70% of patients experience recurrence after treatment (Matulonis et al., 2016). The therapeutic drugs against OC were quickly progressed in the past 20 years, however, the overall survival (OS) was still poorly increased in most countries (Lee et al., 2018). As the current treatment measures are not promising, identifying reliable prognostic biomarkers is important to prolong the survival time of OC patients. In clinical practice, CA-125 and Human epididymis protein 4 (HE4) were the most commonly used predictive markers (Piatek et al., 2020; Salminen et al., 2020). Besides, recent studies indicated that some microRNAs (miRNAs) and long non-coding RNAs (lncRNAs) were also associated with the prognosis of OC (Nam et al., 2008; Qiu et al., 2014). However, as the molecular mechanisms affecting the prognosis of ovarian cancer are complex, single gene/factor prediction models are often with low accuracy. In contrast, multiple-gene-based models often showed better efficacies in predicting the prognosis of various tumors.
Ferroptosis is an iron-dependent, non-apoptotic form of the regulated cell death process that is regulated by a variety of genes (Chen et al., 2021). It presented unique morphological characteristics, such as reduced mitochondrial volume, increased mitochondrial membrane density, and reduced or absent mitochondrial cristae, but with intact cell membranes, normal nucleus size, and no chromatin condensation (Dixon et al., 2012). Biochemical features of ferroptosis are characterized by elevated levels of iron ions, production of large amounts of reactive oxygen species decreased activity of glutathione peroxidase 4 (GPx4), and accumulation of lipid metabolites (Yang and Stockwell, 2016). The occurrence of ferroptosis is closely related to cysteine metabolism, lipid metabolism, and iron cycle: inhibition of cysteine production and reduced glutathione are key components of iron death; polyunsaturated fatty acids are prone to lipid peroxidation that directly induces iron death; iron ion uptake, elimination, storage, and content can influence the sensitivity of cells to iron death (Xie et al., 2016; Conrad et al., 2018). Ferroptosis is associated with a variety of diseases, including neurological disorders, ischemia/reperfusion injury, kidney damage, and blood disorders (Li et al., 2020b). Many studies suggested that ferroptosis is closely linked to the regulation of growth in a variety of tumor cells, including OC. Iron metabolism is potentially related to ovarian cancer cell growth and metastasis. Compared to normal ovarian tissues, OC tissues always showed decreased ferroportin (FPN), increased transferrin receptor-1 (TFR1), and transferrin (TF), and resulted in elevated iron levels (Basuli et al., 2017). In in vitro, the proliferation of OC cells was observed to be inhibited by increased iron content, while in animal models, the increasing iron concentration showed inhibition of tumor growth and decreased intraperitoneal dissemination (Basuli et al., 2017). This suggests that disrupting iron metabolism is a potential target for killing OC cells.
Combined with the existing findings, we know ferroptosis plays important role in the development of tumors and anti-tumor procedures, however, its specific functions in ovarian cancer have not been fully elucidated. Therefore, exploring the relationships between ferroptosis and OC is essential to our understanding of the mechanisms of tumor development, and constructing a predictive model based on ferroptosis-related genes is of great clinical significance for prolonging the survival time of OC patients. Moreover, current chemotherapy regimens for ovarian cancer are still dominated by platinum and paclitaxel drugs, but the prognosis for patients with advanced ovarian cancer remains bleak. Accordingly, an in-depth investigation of the ferroptosis pathway and ovarian cancer will provide strategies for developing novel targeted regimens.
For this purpose, we performed a study combining the GTEx and the TCGA databases to make a comprehensive understanding of the expression levels of the ferroptosis-related genes between normal ovarian and OC tissues. We further screened the genes which were closely connected to the survival rate of OC patients and constructed a risk signature based on 5 ferroptosis-related genes. By employing an external GEO cohort, we validated the model's accuracy and reliability. Moreover, combined with clinical features, we found the gene signature was an independent predictive factor for OC patients. Overall, our study successfully conducted a ferroptosis-related risk model and can potentially be applied for clinical treatment and diagnosis.
Materials and Methods
Data Resources
The mRNA expression profiles and clinical information of 379 OC patients were downloaded from The Cancer Genome Atlas (TCGA) (https://portal.gdc.cancer.gov/). Eighty eight normal ovarian samples with RNA sequencing data were got from the Genotype-Tissue Expression (GTEx) database (https://xenabrowser.net/). Besides, the external validation data of 415 OC patients (with RNA-seq and clinical data) was obtained from the Gene Expression Omnibus (GEO) database (https://www.ncbi.nlm.nih.gov/geo/; GSE13876). The expression data in each database was firstly normalized to fragment per kilobase million (FPKM) values. Before further comparison, the “scale” function in the “limma” R package (version 4.0.3) was applied to normalize data among databases. We gathered 62 ferroptosis-related genes from prior studies and were presented in Supplementary table 1 (Dixon et al., 2012; Stockwell et al., 2017; Zheng and Conrad, 2020).
Identification of Differentially Expressed Ferroptosis-Related Genes
Firstly, we combined the TCGA (379 OC tissues) and the GTEx (88 normal ovarian tissues) database to identify the differentially expressed genes (DEGs, with false discovery rate (FDR) < 0.05 and |log2 FC|≥ 0) from 62 ferroptosis regulators. The heatmap reflecting the expression levels of each DEG between normal and tumor tissues was performed by the “heatmap” R package. To better know the connections among DEGs, a protein-protein interactions (PPI) analysis was conducted by using the Search Tool for the Retrieval of Interacting Genes (STRING) online tool (http://string-db.org/). To explore the connections between the expression of these ferroptosis-related DEGs and OC subtypes, we employed the consensus clustering analysis (utilizing the “limma” R package) to realize the tumor classification in the TCGA cohort. The principal component analysis (PCA) conducted by the “ggplot2” R package was utilized to verify the accuracy of classifications. The Kaplan–Meier survival curve analysis was utilized to compare the survival possibility among tumor subtypes. Moreover, the clinicopathologic characters (tumor grade and age) were also compared in different subtypes.
Construction and Validation of a Ferroptosis-Related Gene Signature
We next screened out the survival-related genes using univariate cox analysis for further developing a risk signature with the least absolute shrinkage and selection operator (LASSO) cox regression model (By employing the “glmnet” and “survival” R packages). The risk score was calculated by the formula: Risk scores= (X: coefficient of each gene, Y: expression of each gene). Based on the median score, OC patients from the TCGA database were divided into low- and high-risk subgroups. The OS time was compared between the two groups using the Kaplan–Meier survival curve analysis and the ROC curve was used for evaluating the sensitivity and specificity of the gene signature. To validate our model, we obtained the data from a cohort (GEO database, GSE13876). The risk score of each patient in the GEO cohort was calculated by the same formula applied in the TCGA cohort. According to the risk score, patients in the GEO cohort were also divided into low- and high-risk subgroups, and the OS was then compared between the two risk subgroups.
Functional Enrichment Analysis
In the TCGA cohort, 379 OC patients were classified into 2 risk groups according to the risk scores based on the ferroptosis signature. The differentially expressed genes between the 2 groups were then screened out by the "limma” package using the criteria: FDR <0.05 and |log2FC| ≥ 1. We then applied the “limma” and the “clusterProfiler” packages to perform the Gene Ontology (GO) analysis and Kyoto Encyclopedia of Genes and Genomes (KEGG) pathway enrichment analysis. As for the GO and KEGG results that the diverse genes were connected with the aggregation of immune cells, thus we applied the single-sample gene set enrichment analysis (ssGSEA) to assess the infiltration scores of immune cells and the activity of immune-related functions. The molecular markers of each immune cell and pathway were presented in Supplementary Table 2. The workflow diagram is shown in Figure 1.
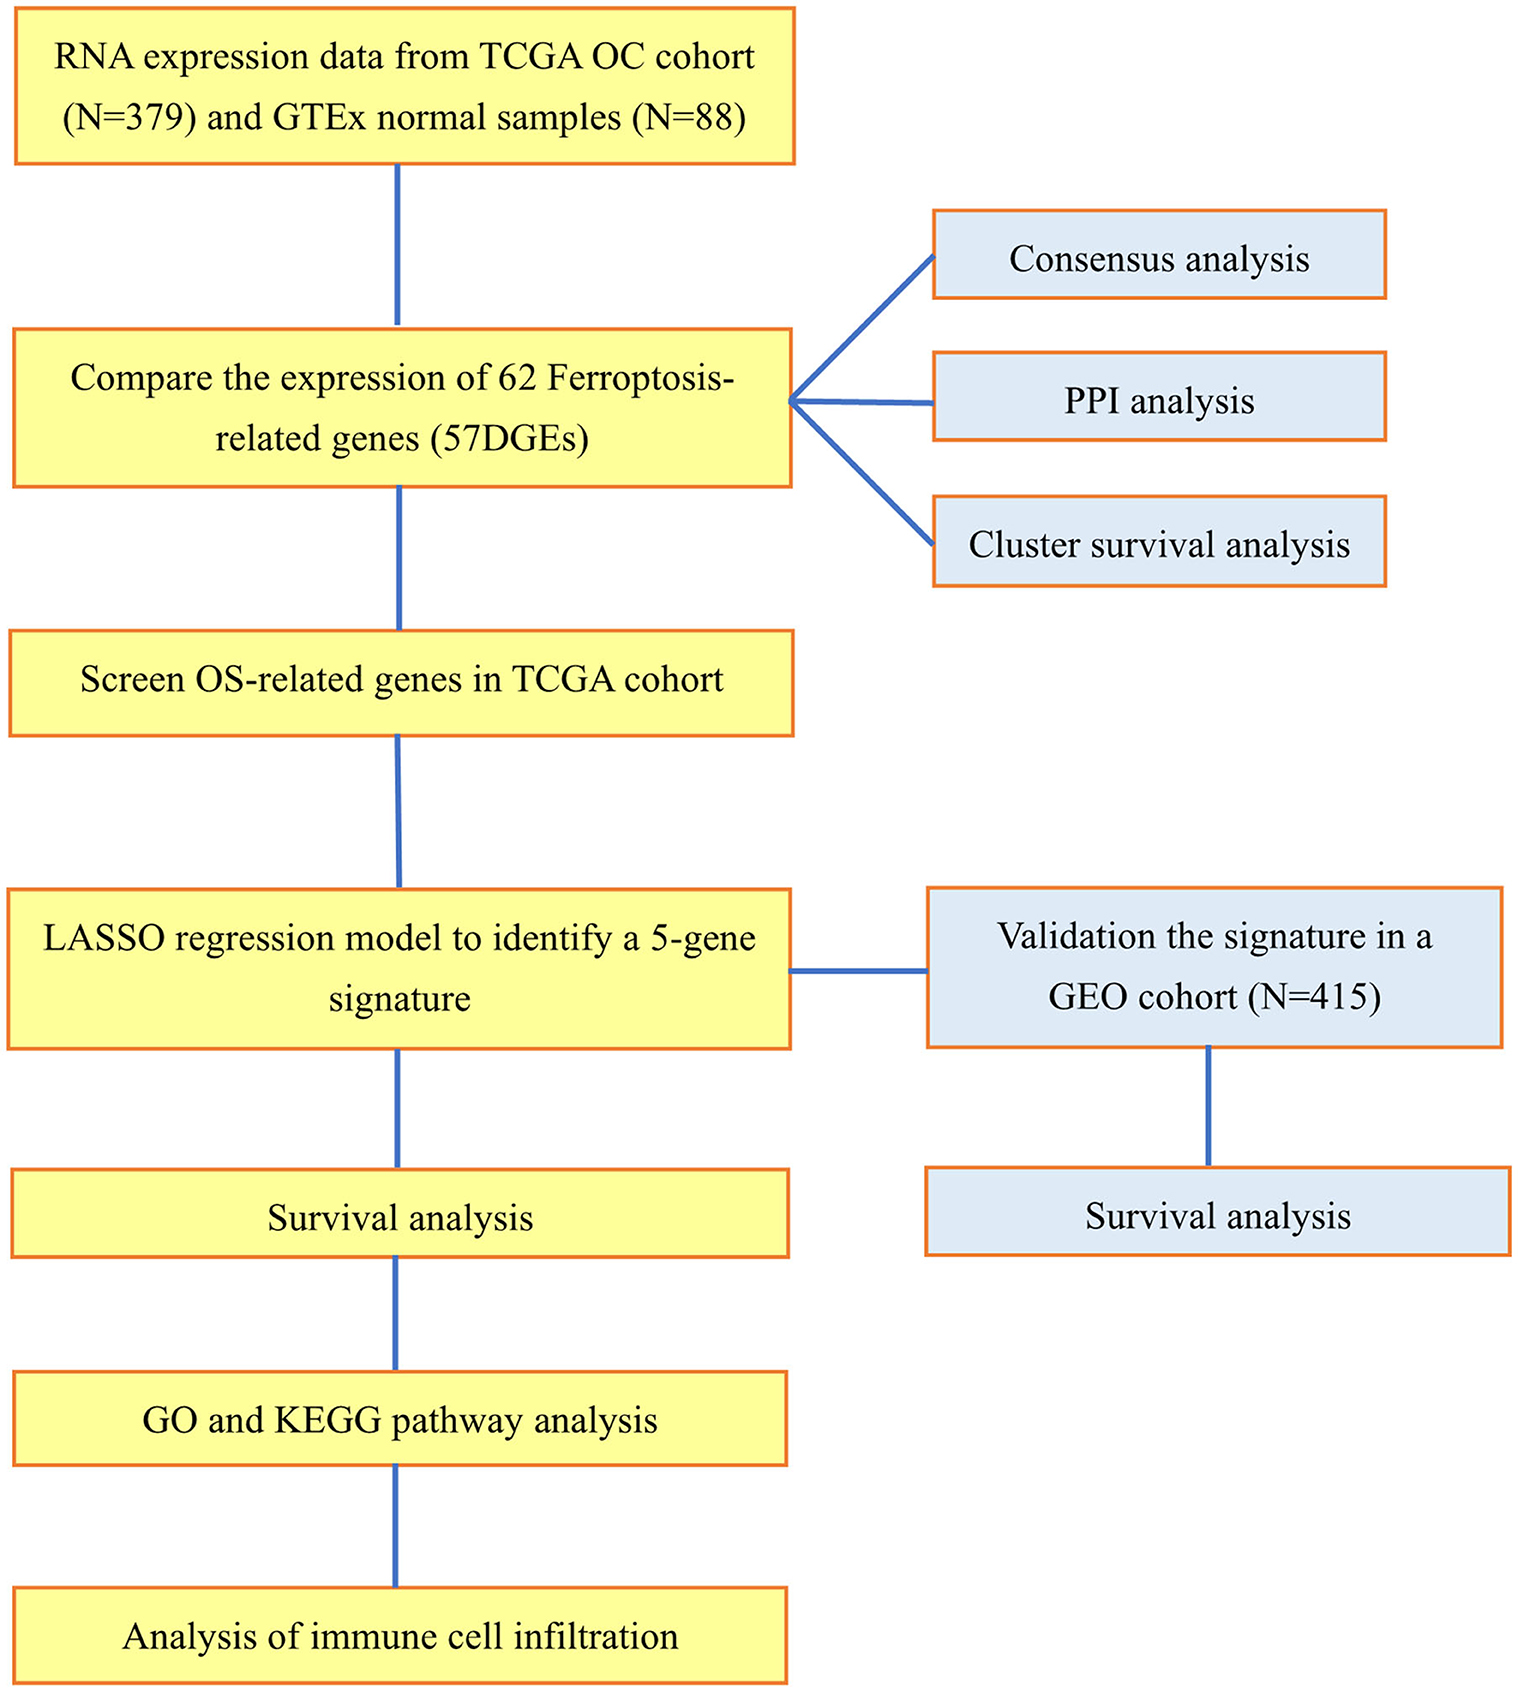
Figure 1. Workflow diagraph of data collection and analysis.
Statistical Analysis
The t-test was used to contrast the expression levels of genes between normal ovarian and OC tissues, while the Pearson chi-square test was employed to compare the categorical variables. The Kaplan-Meier curve with a two-sided log-rank test was applied to compare the OS of patients between subgroups. Univariate and multivariate Cox regression analyses were conducted to figure out the independent factors related to survival rate. The Mann-Whitney test was used to compare the scores of infiltrating immune cells and the activities of immune-related pathways between low- and high-risk groups. All statistical analyses were executed utilizing R v4.0.2.
Results
Tumor Classification Based on the Differential Expression of Ferroptosis-Related Genes
The RNA-seq data of 88 normal ovarian tissues from the GTEx database and 379 OC tissues from the TCGA cohort were merged and normalized to make further comparisons. The expression levels of 62 ferroptosis-related genes which were extracted from prior review articles were compared. In the pooled dataset, we identified 57 genes were with significantly different expressions (P < 0.05). Among them, 26 were down-regulated while the other 31 were up-regulated in tumor samples and the heatmaps for these DEGs were presented in Supplementary Figure 1. A PPI analysis was performed to show the relationships among the 57 DEGs, and the minimum required interaction score was set at 0.70 (Figure 2A).
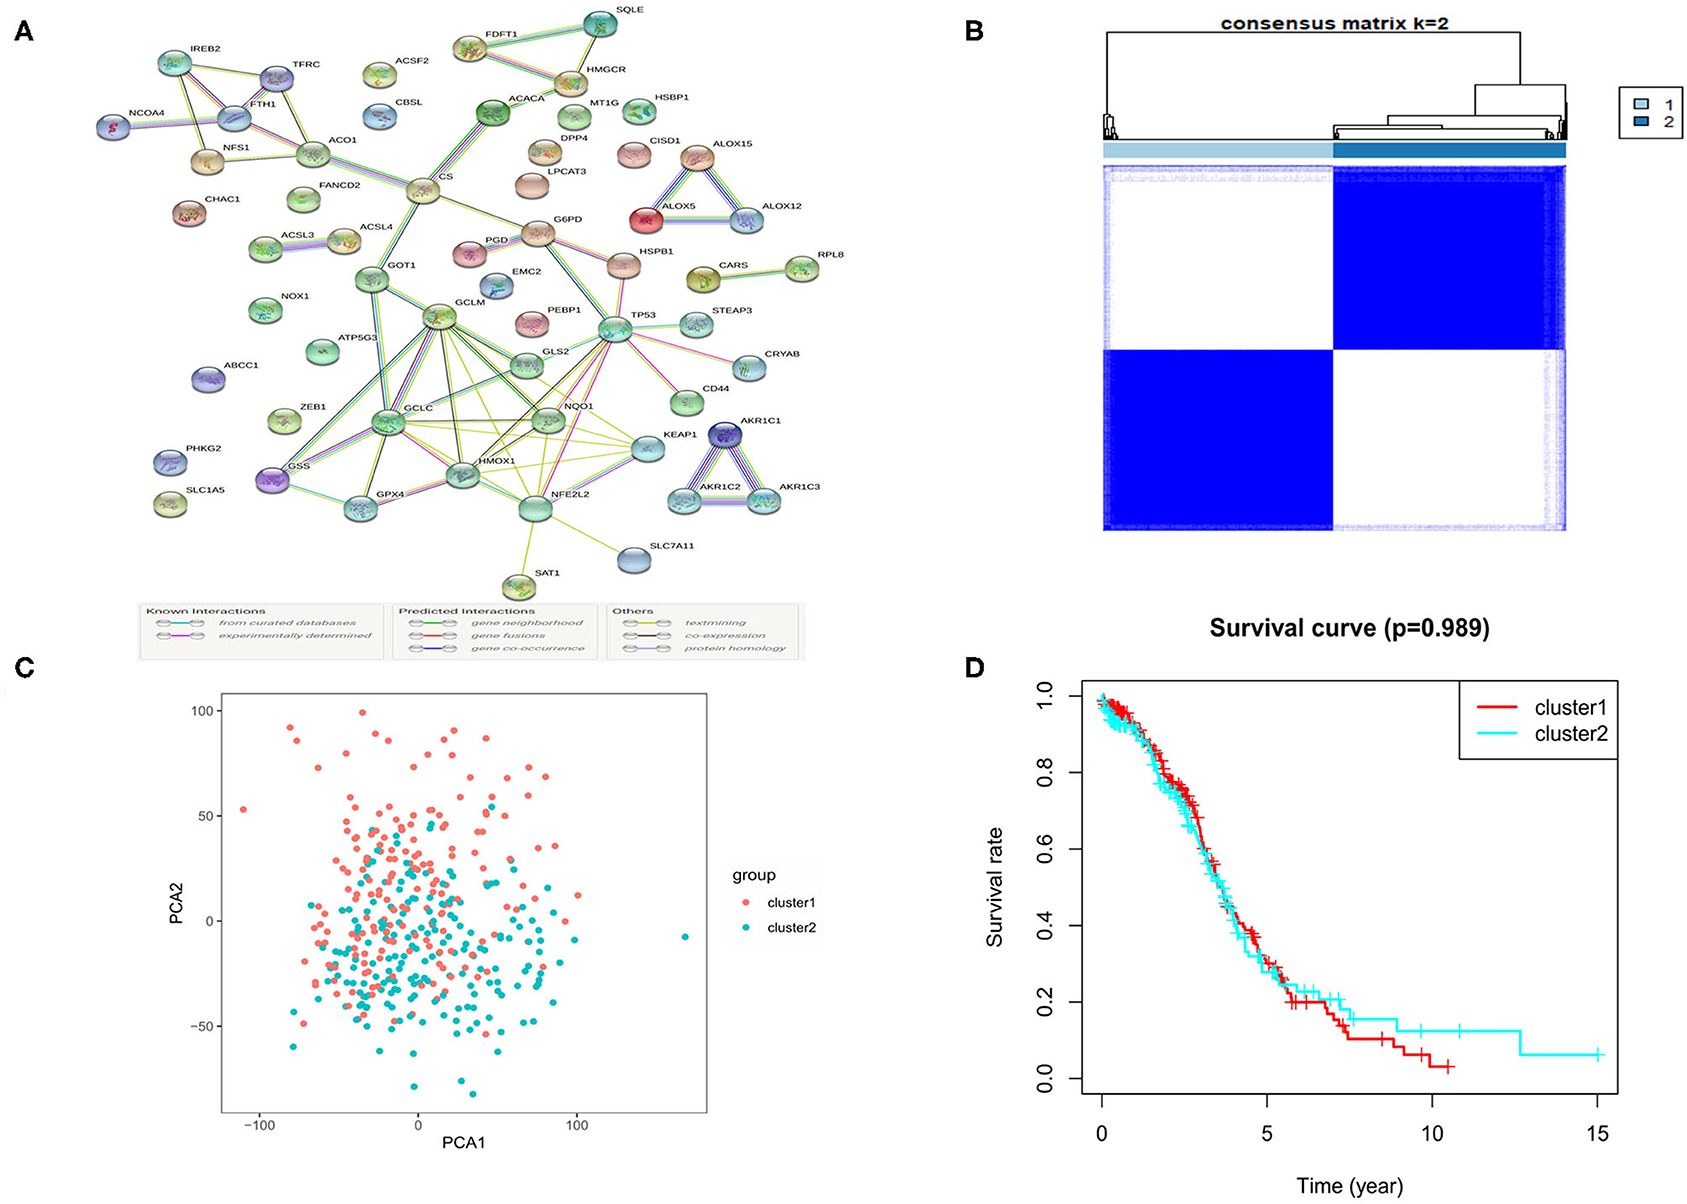
Figure 2. The Consensus clustering for 379 OC samples based on the DEGs. (A) PPI network showing the interactions of DEGs. (B) Consensus clustering matrix for k = 2. (C) PCA plot for the consensus clustering matrix. (D) Kaplan-Meier OS curves for the OC patients in the 2 clusters.
To further evaluate the relationship between the expression profile of ferroptosis regulators and the OC subtypes, the consensus clustering analysis was performed to make tumor classifications for the 379 OC samples. We increased the clustering variable (k) from 2 to 10 and found that when k = 2, it presented a high intra-group and a low inter-group correlation, indicating that it is suitable to divide OC patients into two subtypes (cluster 1 and 2) according to the 57 ferroptosis-related DEGs (Figure 2B). A principal component analysis (PCA) based on the whole transcriptome profiles of the 2 clusters was then conducted, and an obvious separation of the clusters was observed, demonstrating a satisfactory classification of the tumor (Figure 2C). The overall survival (OS) rate was compared between the 2 clusters, but no obvious difference was found (P = 0.989, Figure 2D). We further compared the clinical features (tumor grade, age, and survival status) between the 2 clusters, but found few differences (Supplementary Figure 2).
Development of a Risk Signature in the TCGA Cohort
We applied univariate Cox regression analysis to evaluate the correlations between the 57 ferroptosis-related DEGs and the OS time in the TCGA cohort. Five possible survival-related genes were screened out (with P < 0.1). The forest plot of the 5 genes (SLC7A11, ACACA, FTH1, ALOX12, CD44) was shown in Figure 3A. A correlation network based on the expression profiles of the 5 genes was performed to show the relationships among them (red: positive correlations; blue: negative correlations, Figure 3B). LASSO cox regression model was then used to set up a prognostic model from the 5 genes. Finally, all of the 5 genes and their coefficients were retained, according to the penalty parameter (λ) decided by the minimum criteria (Supplementary Figure 3). The risk score was calculated for each case, and referred to the median risk score, 187 patients were classified as the low-risk group, while the other 187 were at high risk (5 cases without clinical information or with 0 days of survival time were excluded) (Figure 3C). The formula of risk score was: risk score = (0.445*ALOX12 exp) + (-0.218*SLC7A11 exp) + (-0.090*FTH1 exp) + (0.285*ACACA exp) + (-0.153*CD44 exp). The PCA and t-distributed stochastic neighbor embedding (t-SNE) analysis implied the patients with different risks were well separated in two directions (Figures 3D,E). We detected a notable difference in survival probability between the two risk subgroups (Figure 3F, P < 0.001). In Figure 3G, we made a visualization that patients in the high-risk group had a higher rate of death and a lower survival time than those in the low-risk group. The time-dependent receiver operating characteristic (ROC) curve was used for evaluating the predictive role of risk scores on OS and the area under the curve (AUC) was 0.716 for 1 year, 0.688 for 2 years, and 0.677 for 3 years (Figure 3H). By applying the multi-indicator ROC curve analysis, we further evaluated the predictive efficacy of the risk score and the clinical features, and the results indicated that the predictive accuracy of our risk model was superior to age and tumor grade (AUC: 0.720 for the risk model, 0.705 for age and 0.550 for tumor grade; Figure 3I).
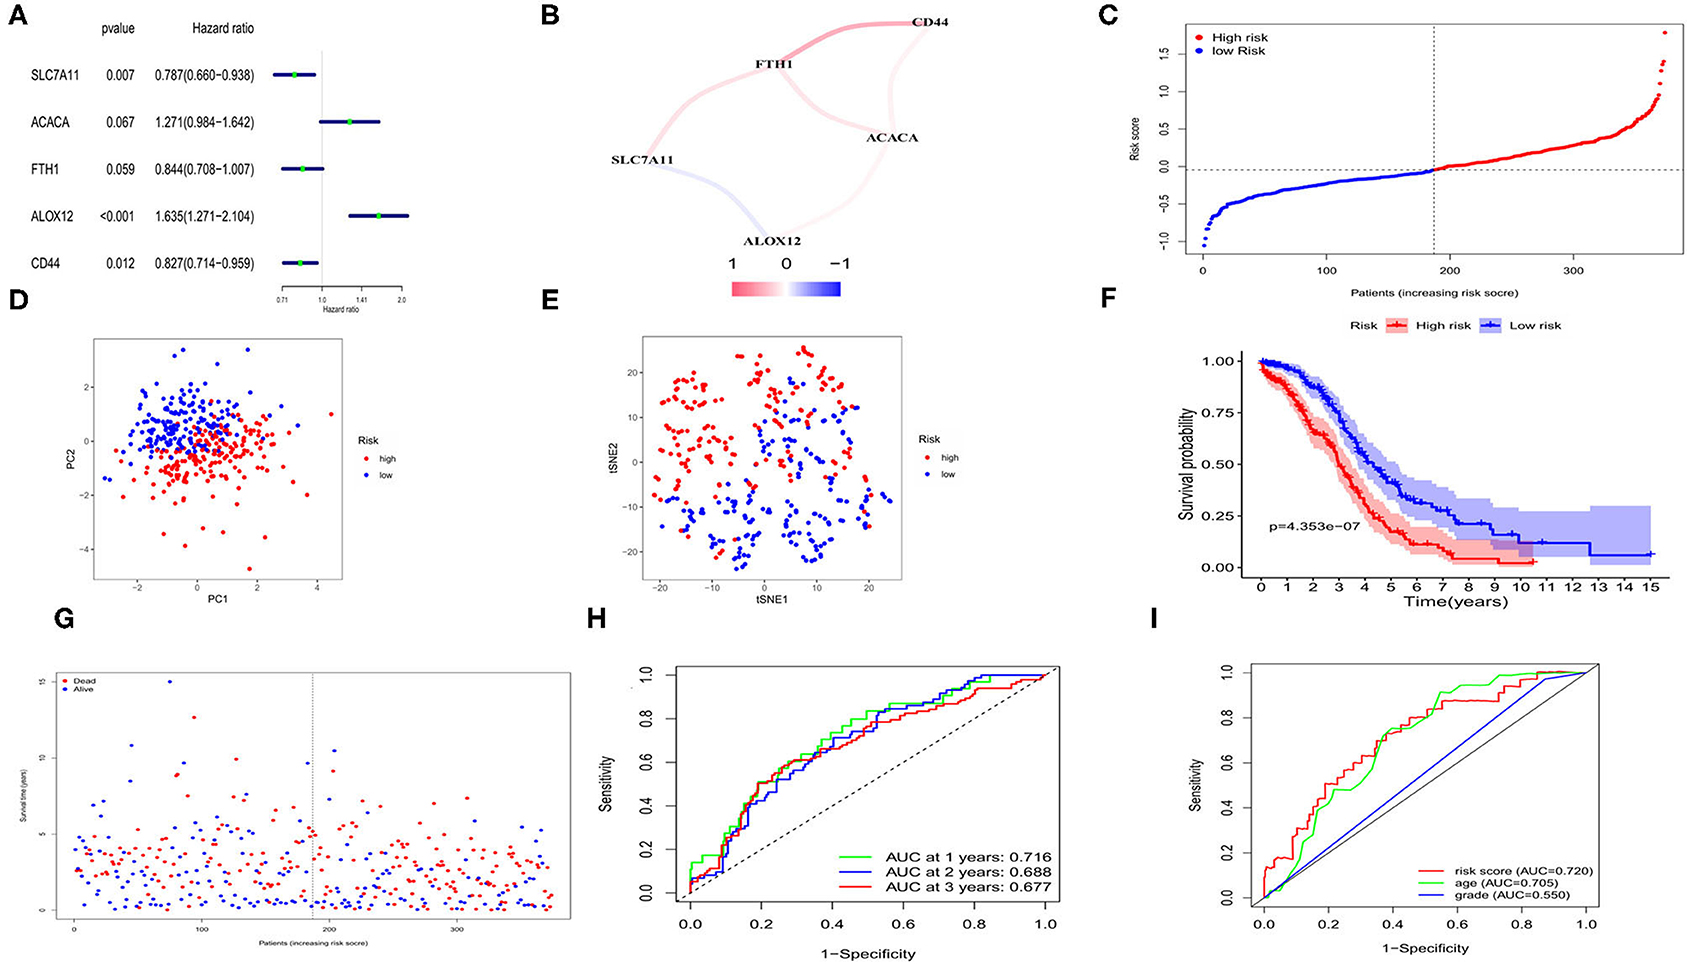
Figure 3. Construction of risk signature for OCs in TCGA cohort. (A) Screen out of the OS-related genes with univariate cox regression analysis. (B) The correlation network of the OS-related genes. (C) Risk score for OCs. (D) PCA plot for OCs. (E) t-SNE analysis for OCs. (F) Kaplan-Meier curves for the OS of patients in the high- and low-risk group based on risk score. (G) Survival status for each patient. (H) ROC curves demonstrated the predictive efficiency. (I) Multi-indicator ROC curves for risk score, age and tumor grade.
Validation of the Risk Signature in a GEO OC Cohort
Four hundred and fifteen OC cases with completed clinical data from the GEO database (GSE13876) were treated as the external validation set. The five survival-related genes were extracted from the expression profiling array, and before validation, the expression data of each gene from both the TCGA and the GEO databases was normalized by the “SCALE” function to avoid deviations caused by different sequencing platforms. The risk score of each case in the GEO cohort was calculated by the same formula used in the TCGA cohort. Regarding the median risk score in the TCGA cohort as the standard for the risk setting in the GEO cohort, 183 cases were allocated in the low-risk group while the other 232 were at high risk (Figure 4A). The PCA and t-SNE analysis also presented well separations between the two subgroups (Figures 4B,C). We also found that the high-risk subgroup had a significantly lower survival possibility than the low-risk group (P = 0.03, Figure 4D). Similarly, the survival status graph also indicated a higher possibility of earlier death in the high-risk group (Figure 4E). The time-ROC curve also revealed a passably predictive role of our model in the GEO cohort (Figure 4F).
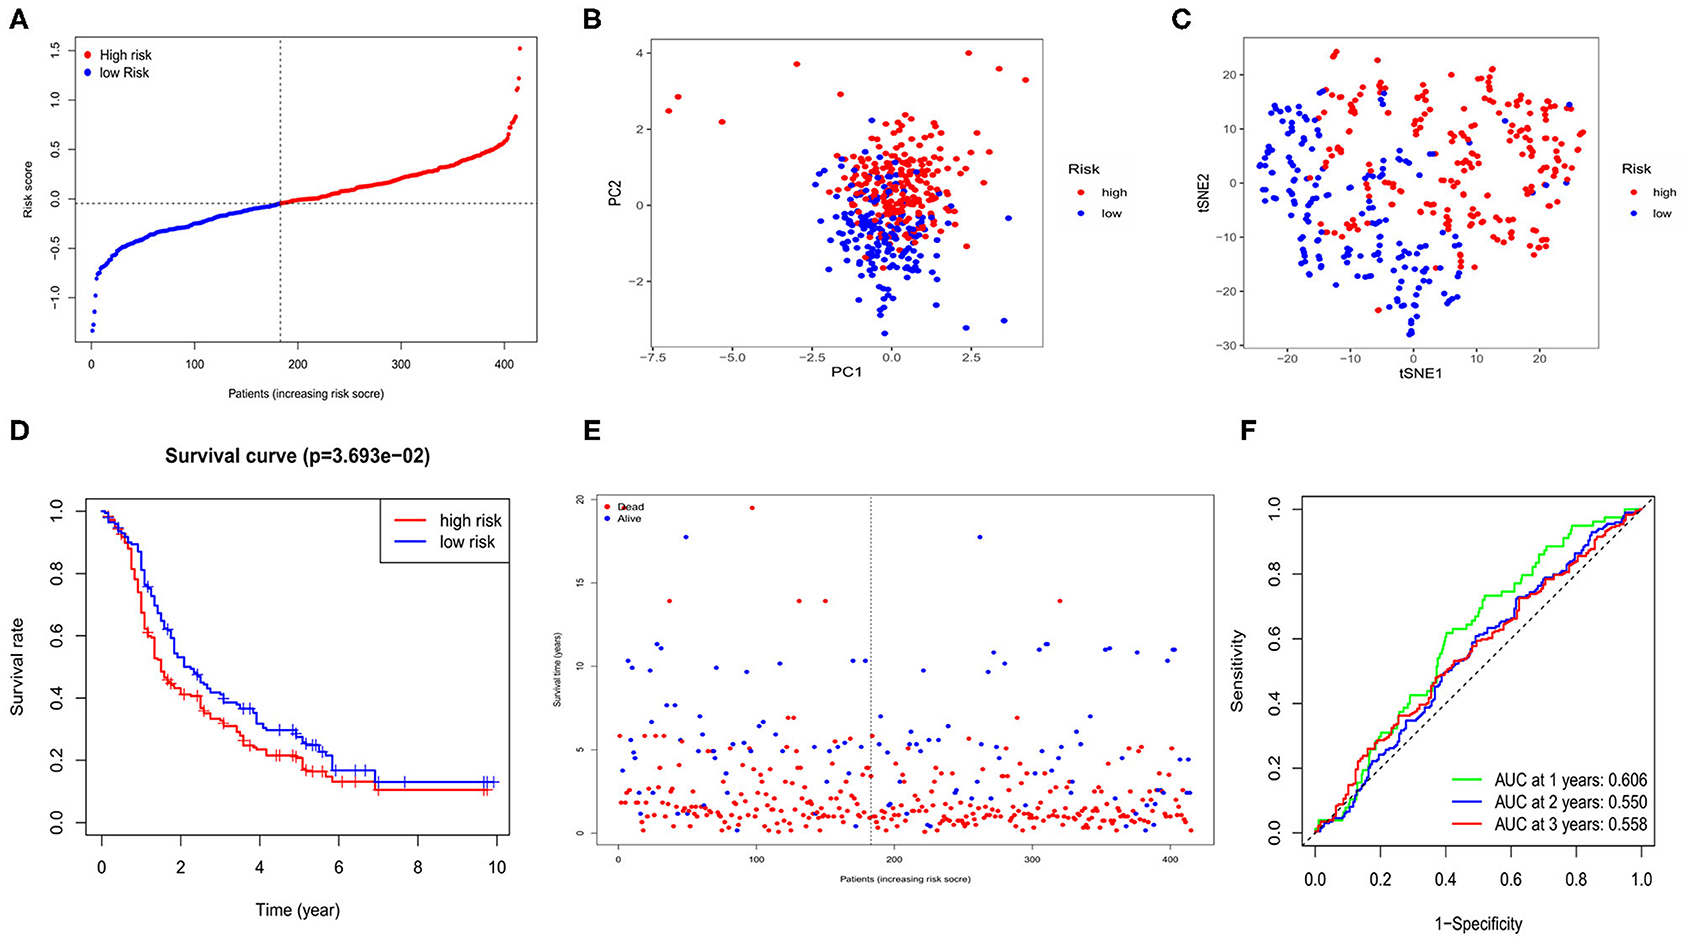
Figure 4. Validation of risk signature for OCs in GEO cohort. (A) Risk score for OCs. (B) PCA plot for OCs. (C) t-SNE analysis for OCs. (D) Kaplan-Meier curves for the OS of patients in GEO cohort. (E) The distributions of survival status. (F) Time-dependent ROC curves for OCs in GEO cohort.
Independent Prognostic Value of the 5-Gene Signature
Here, we performed a heatmap to directly show the relationships between the 5 genes and clinical features TCGA cohort (Figure 5A). Among them, 2 genes (ALOX12 and ACACA) were down-regulated, while SLC7A11, FTH1, and CD44 were up-regulated in the low-risk subgroup. Moreover, univariate and multivariate analyses were applied to explore whether the risk score could be an independent risk factor in both the TCGA and GEO cohorts. As shown in Figures 5B,C, the risk score was a reliable independent risk factor connected with OS (P < 0.001, HR:2.991, 95% CI:2.047-4.369) in TCGA cases. In the GEO cohort (lacking the tumor stage information), we also found that our risk model could be an independent risk factor of the OS (P = 0.025, HR:1.422, 95% CI:1.046-1.933, Figures 5D,E).
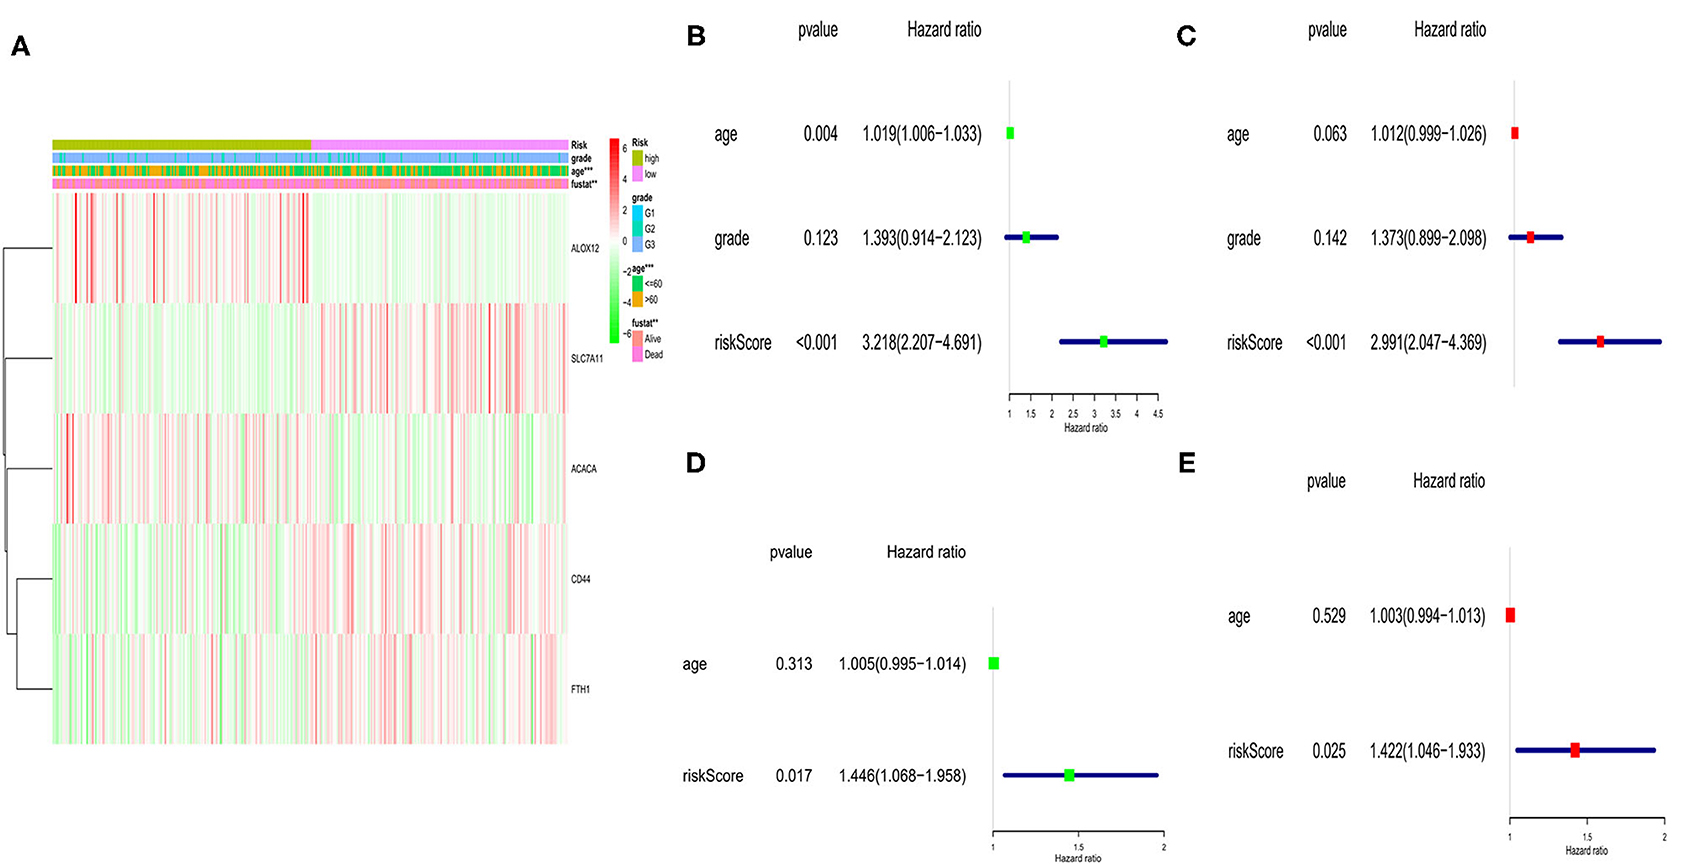
Figure 5. Univariate and multivariate Cox regression analyses of OS in TCGA and GEO cohort. (A) Heatmap and clinicopathologic features of the 5 ferroptosis-related genes. (B) Univariate analysis for TCGA cohort. (C) Multivariate analysis for TCGA cohort. (D) Univariate analysis for GEO cohort. (E) Multivariate analysis for GEO cohort.
The Exploration of Differential Gene Functions Based on the Risk Model
According to the risk model, 374 OC patients were equally divided into low- and high-risk groups. The DEGs between the 2 groups were then screened out by using the criteria: FDR <0.05 and |log2FC| ≥ 1. To estimate the function of these DEGs, GO and KEGG pathway analyses were performed. As we could see, both GO (Figures 6A,B) and KEGG (Figures 6C,D) indicated that these DEGs were highly correlated with immune cell aggregation and immune response.
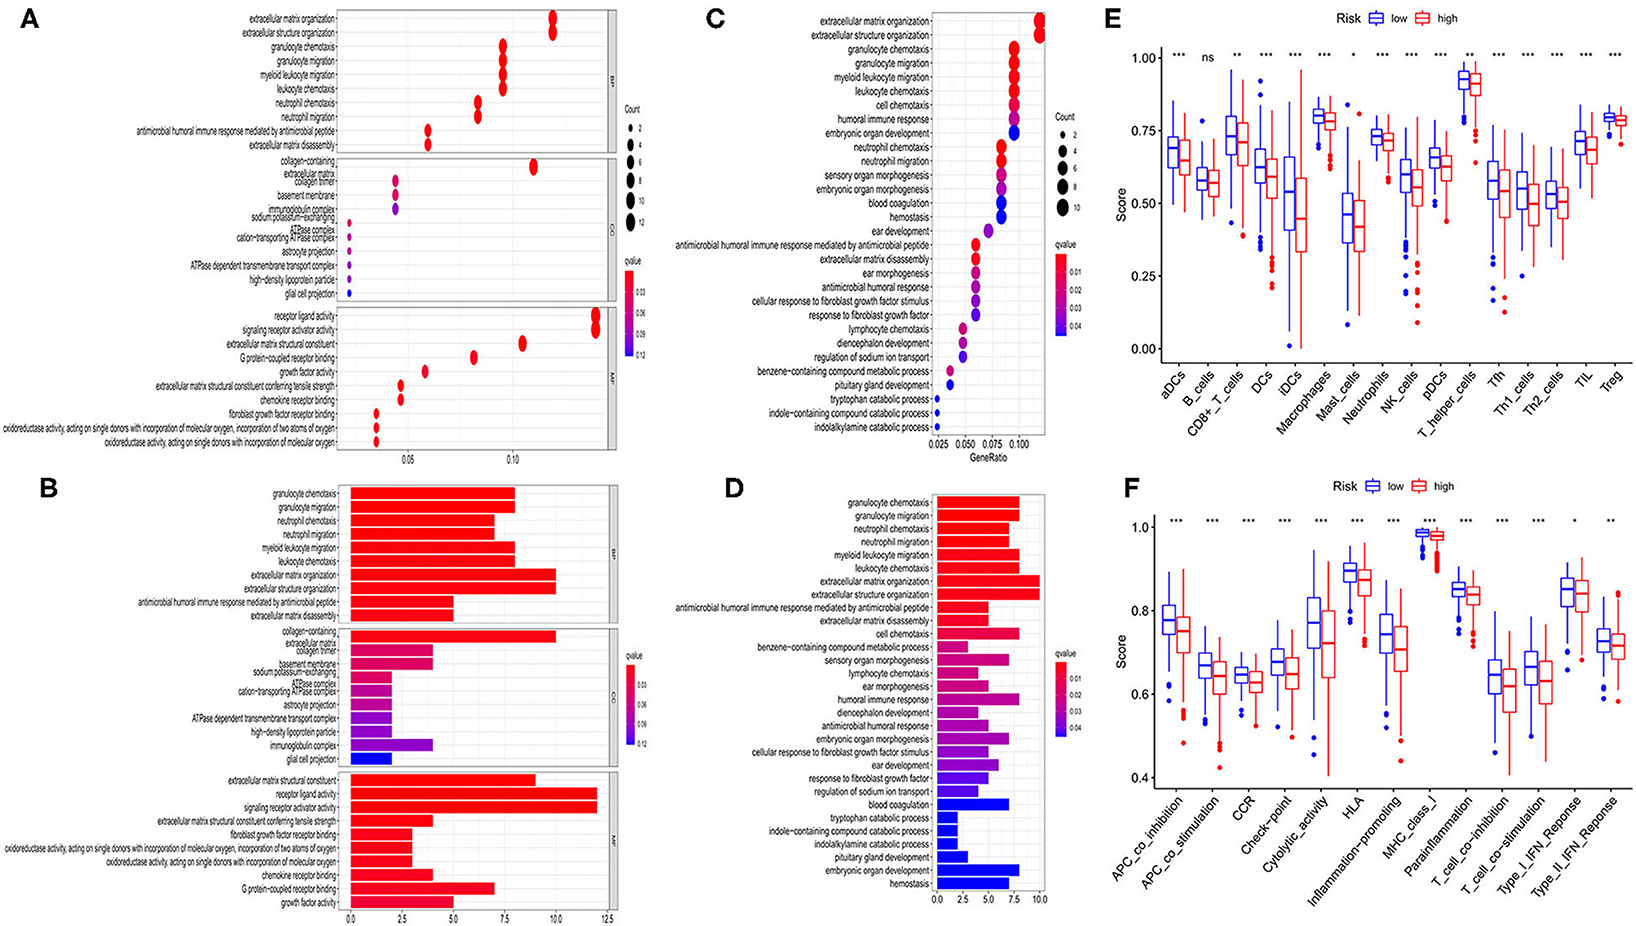
Figure 6. Functional analysis based on the DEGs between the two-risk group in TCGA cohort. (A,B) Bubble and barplot graph for GO enrichment. (C,D) Bubble and barplot graph for KEGG pathways. (E) Comparison of the infiltration of 16 immune cells between low- and high-risk group. (F) Comparison of the immune functions between low- and high-risk group.
To further evaluate the relationship between risk group and immune cell infiltrations, we used ssGSEA to evaluate the immune cell features and the related pathways. As shown in Figure 6E, the high-risk group was found to be with a universally lower immune cells infiltration, particularly in antigen-presenting cells (aDCs, DCs, iDCs, and pDCs), macrophages, neutrophils, NK cells, T helper cells (Tfh, Th1, Th2), TIL, and Treg cell (all P < 0.001). Moreover, the functions of antigen presentation, immune activation, and immune surveillance were at lower levels in the high-risk group (Figure 6F). These results indicated that these ferroptosis-related genes may have strong correlations with the immune state of OC.
Discussion
Overall, in this study, we demonstrated that the ferroptosis regulators were strongly connected with ovarian cancer. Firstly, we identified 57 DEGs between normal and tumor tissues, and based on these DEGs, OC could be well distinguished into 2 subtypes. We further combined the OS data and applied the LASSO regression model to set up a risk model, which was then proved to have a favorable predictive effect of prognosis in both TCGA and GEO cohorts. Functional analyses indicated the enrichment of the immune-related pathways, and then we found the lower immune-activation in high-risk OC cases.
In the past few decades, clinical features such as age, TNM stages, and some serum markers are commonly used to predict the prognosis of OC patients. However, due to individual differences, these single factors are not accurate enough and are less able to improve treatment options. With the rapid progression of gene sequencing technology, lots of genes' mRNA levels were found as predictive biomarkers in malignancies. However, a single gene is usually with low predictive effects as its expression level could be regulated by various signaling pathways. Applying the key regulators that function in the same signaling pathway to construct multi-gene-based models is essential to improve the predictive accuracy and could help to explore new targeted therapeutic methods. Recently, ferroptosis have been proved to be closely related to the development, chemoresistance, and occurrence of OC by large numbers of studies (Worley et al., 2019; Huang et al., 2020; Liu et al., 2020), however, the connections to the prognosis of OC patients were still unknown. Our studies presented a 5-ferroptosis-related signature (ALOX12, ACACA, SLC7A11, FTH1, and CD44) and found it could well predict the prognosis of OC patients. Moreover, the gene signature was proved to be better in predicting OS than age or tumor grade.
Among the 5 genes in the risk signature, ALOX12 is known as a lipoxygenase, mainly to metabolize arachidonic acid to 12S-hydroperoxy eicosatetraenoic acid (12(S)-HpETE) (Zheng et al., 2020). In the procedures of ferroptosis, excessive accumulation of lipid peroxides leads to cell death, and these lipid peroxides can be induced by lipoxygenase production (Bayir et al., 2020). It has been reported that inactivation of ALOX12 attenuated p53-mediated ferroptosis and abolished p53-dependent inhibition of tumor growth, indicating that ALOX12 plays a key role in p53-mediated iron death (Chu et al., 2019). There's still no evidence whether ALOX12 can affect the survival time of OC patients, but in other tumors, such as breast cancer(Huang et al., 2019) and colon cancer(Holzner et al., 2018), down-regulation of ALOX12 could inhibit the invasive ability and enhance the chemosensitivity of tumor cells. We can infer that ALOX12 may be associated with poor outcomes of OC patients, and we did find a higher expression of ALOX12 in the high-risk group in this study.
SLC7A11, a crucial member participated in Xc- system, which is a cystine-glutamate reverse transporter process. Multiple cells rely on the Xc- system for cystine uptake, and this is a rate-limiting step in the synthesis of cysteine (Koppula et al., 2020). Blocking SLC7A11 can lead to a decrease in intracellular cysteine, inhibit the lipid repair function of GPX4, and finally strengthen ferroptosis by affecting the redox state of the cell (Goji et al., 2017). Yin et al. (2019) found that lower expression of SLC7A11 was associated with a shorter OS time of OC patients, and this conclusion was in accordance with ours that SLC7A11 expressed in a lower level in the high-risk group. In addition, current studies indicated that SLC7A11 mediates the chemosensitivity and chemoresistance of tumors and can be a potential target for improving chemotherapeutic responses (Huang et al., 2005).
Acetyl coenzyme A carboxylase (ACACA) is a biotin carboxylase that catalyzes the ATP-dependent condensation of acetyl coenzyme A and carbonates to form malonyl coenzyme and this reaction governs the rate of the first stage of fatty acid synthesis (Brownsey et al., 2006). When cells are stimulated by iron death, AMPK is activated, which in turn phosphorylates and inhibits the activity of the AMPK downstream substrate acetyl coenzyme A carboxylase 1, as well as inhibits fatty acid synthesis, thereby slowing the accumulation of lipid oxides and the onset of iron death (Li et al., 2020a). ACACA was proved to be a poor prognostic biomarker in various cancers (Chajès et al., 2006; Fang et al., 2014), and we also found it high-expressed in the high-risk group.
CD44 is an extremely widely distributed cell surface transmembrane glycoprotein that is mainly involved in heterogeneous adhesion (Chen et al., 2018). The newest research indicated that CD44 played important roles that could stabilize SLC7A11 by increasing the recruitment of OTUB1 and promotes the interaction of SLC7A11 with OTUB1, thereby inhibiting the ferroptosis in tumor cells (Liu et al., 2019). A meta-analysis manifested that high expression of CD44 was correlated with chemoresistance and shorter disease-free survival (DFS) time, but not affect OS in OC patients (Zhao et al., 2016). We found CD44 was abundant in the low-risk subgroup and the specific role of CD44 still needs further exploration.
FTH1 (Ferritin heavy polypeptide 1) is a ubiquitous intracellular protein that stores iron. In the ferroptosis procedure, FTH1 was a negative regulator in many cell lines (Chen et al., 2020; Tian et al., 2020). It has been reported that NCOA4 could bind to FTH1, resulting in FTH1 degradation, over-releasing iron ions, and ultimately leading to the development of ferroptosis (Zhang et al., 2018). Lobello et al. (2016) found that lower FTH1 predicted a shorter survival time in OC patients, and knockout of FTH1 would enhance the viability and aggression in SKOV3 cells. In the high-risk group in our study, FTH1 was also at a lower expression.
In summary, ALOX12 and ACACA were known as the promoters of ferroptosis, while SLC7A11, CD44, and FTH1 have the opposite function. Based on the expression profiles of these genes, we can infer that the process of ferroptosis is more active in the high-risk OC group. However, the current view indicated that promoting the course of ferroptosis will be always connected to cancer cell death thus prolongs the survival duration of patients. We all know that cell death is often accompanied by inflammatory responses, and so does in ferroptosis. In tissues with ferroptosis, immunofluorescence staining by F4/80 showed significant activation of macrophages (Shah et al., 2018). However, our subsequent results showed that the immune cells including macrophages were significantly at a lower level in the high-risk group and we guess that the inverse in our study may be caused by the low sensitivity to ferroptosis of OCs in the high-risk group. Besides, both ALOX12 and ACACA take part in the procedure of fat metabolism, and their expressions were observed to be significantly elevated in the high-risk group, indicating the active lipid metabolism may affect the sensitivity of OC cells to ferroptosis. But the exact mechanisms of how these five genes interact to affect iron metabolism and ferroptosis resistance is unclear, further studies are needed.
We also employed the GO and KEGG analysis and found these DEGs between the two- risk subgroups were strongly connected to immunity. However, the relationships between ferroptosis and tumor immunity have not been elucidated for years. Recently, a study manifested that IFN-γ released from CD8+ T cells could down-regulate the expression of cystine transport proteins on the tumor cell surface, thereby enhancing lipid peroxidation and iron death of tumor cells (Wang et al., 2019). That's to say, the tumor cell's sensitivity to ferroptosis is parallel to immune functions so that low immune cell infiltrations in the high-risk group indicated that less ferroptosis occurred. Besides, tumor cells undergoing ferroptosis will release arachidonic acid thereby act as immune activators to stimulate antitumor immunity (Friedmann Angeli et al., 2019), and according to this, we can also speculate that ferroptosis were inactive in the high-risk group. High-risk OCs were accompanied by the impairment of various immunities, therefore, exploring the specific mechanisms between ferroptosis and immunity is essential for improving the survival rate of OC patients.
Conclusion
In summary, our study indicated that ferroptosis is correlated to the development and the progress of OC, since most of the ferroptosis-related genes were expressed differently between normal and OC tissues. We constructed and validated a gene signature associated with ferroptosis that can accurately predict the prognosis of OC patients. Moreover, we found the DEGs between the low- and high-risk subgroup divided by our risk model were associated with tumor immunity. Our study provides novel markers for evaluating OC prognosis and uncovers significant proofs for future research on the mechanisms between ferroptosis-related genes and the immunity of ovarian cancer.
Data Availability Statement
The original contributions presented in the study are included in the article/Supplementary Material, further inquiries can be directed to the corresponding author/s.
Author Contributions
HQ and YY made contributions to the conception of this study. YY and QD analyzed the data and wrote the manuscript. SL and JH helped with the analysis of the data and revised the manuscript. All authors contributed to the article and approved the submitted version.
Funding
This study was supported by The National Natural Science Foundation of China (81520108013, 81771613).
Conflict of Interest
The authors declare that the research was conducted in the absence of any commercial or financial relationships that could be construed as a potential conflict of interest.
Acknowledgments
We would like to acknowledge the TCGA, GTEx and the GEO (GSE13876) network for providing data.
Supplementary Material
The Supplementary Material for this article can be found online at: https://www.frontiersin.org/articles/10.3389/fmolb.2021.645845/full#supplementary-material
Supplementary Figure 1. Heatmap of the DEGs between 88 normal and 379 OC tissues.
Supplementary Figure 2. Heatmap and clinicopathologic characters of the 2 clusters classified by these ferroptosis-related DEGs (tumor grade: G1, High differentiated; G2, Moderate differentiated; G3, Poor differentiated).
Supplementary Figure 3. (A) LASSO regression of the 5 OS-related regulators. (B) Cross-validation for tuning the parameter selection in the LASSO regression.
Abbreviations
OC, ovarian cancer; LASSO, least absolute shrinkage and selection operator; TCGA, The Cancer Genome Atlas database; GEO, Gene Expression Omnibus; GTEx, Genotype-Tissue Expression; GO, Gene Ontology; KEGG, Kyoto Encyclopedia of Genes and Genomes; DEGs, differentially expressed genes; PCA, Principal Component Analysis; t-SNE, t-distributed stochastic neighbor embedding; ssGSEA, single-sample gene set enrichment analysis.
References
Basuli, D., Tesfay, L., Deng, Z., Paul, B., Yamamoto, Y., Ning, G., et al. (2017). Iron addiction: a novel therapeutic target in ovarian cancer. Oncogene 36, 4089–4099. doi: 10.1038/onc.2017.11
Bayir, H., Anthonymuthu, T., Tyurina, Y., Patel, S., Amoscato, A., Lamade, A., et al. (2020). Achieving life through death: redox biology of lipid peroxidation in ferroptosis. Cell Chem Biol 27, 387–408. doi: 10.1016/j.chembiol.2020.03.014
Brownsey, R., Boone, A., Elliott, J., Kulpa, J., and Lee, W. (2006). Regulation of acetyl-CoA carboxylase. Biochem Soc Trans 34, 223–227. doi: 10.1042/BST0340223
Chajès, V., Cambot, M., Moreau, K., Lenoir, G., and Joulin, V. (2006). Acetyl-CoA carboxylase alpha is essential to breast cancer cell survival. Cancer Res 66, 5287–5294. doi: 10.1158/0008-5472.CAN-05-1489
Chen, C., Zhao, S., Karnad, A., and Freeman, J. (2018). The biology and role of CD44 in cancer progression: therapeutic implications. J Hematol Oncol 11, 64. doi: 10.1186/s13045-018-0605-5
Chen, P., Li, X., Zhang, R., Liu, S., Xiang, Y., Zhang, M., et al. (2020). Combinative treatment of β-elemene and cetuximab is sensitive to KRAS mutant colorectal cancer cells by inducing ferroptosis and inhibiting epithelial-mesenchymal transformation. Theranostics 10, 5107–5119. doi: 10.7150/thno.44705
Chen, X., Comish, P., Tang, D., and Kang, R. (2021). Characteristics and biomarkers of ferroptosis. Front Cell Dev Biol 9, 637162. doi: 10.3389/fcell.2021.637162
Chu, B., Kon, N., Chen, D., Li, T., Liu, T., Jiang, L., et al. (2019). ALOX12 is required for p53-mediated tumour suppression through a distinct ferroptosis pathway. Nat Cell Biol 21, 579–591. doi: 10.1038/s41556-019-0305-6
Conrad, M., Kagan, V. E., Bayir, H., Pagnussat, G. C., Head, B., Traber, M. G., et al. (2018). Regulation of lipid peroxidation and ferroptosis in diverse species. Genes Dev 32, 602–619. doi: 10.1101/gad.314674.118
Dixon, S. J., Lemberg, K. M., Lamprecht, M. R., Skouta, R., Zaitsev, E. M., Gleason, C. E., et al. (2012). Ferroptosis: an iron-dependent form of nonapoptotic cell death. Cell 149, 1060–1072. doi: 10.1016/j.cell.2012.03.042
Fang, W., Cui, H., Yu, D., Chen, Y., Wang, J., and Yu, G. (2014). Increased expression of phospho-acetyl-CoA carboxylase protein is an independent prognostic factor for human gastric cancer without lymph node metastasis. Med Oncol 31, 15. doi: 10.1007/s12032-014-0015-7
Friedmann Angeli, J., Krysko, D., and Conrad, M. (2019). Ferroptosis at the crossroads of cancer-acquired drug resistance and immune evasion. Nat Rev Cancer 19, 405–414. doi: 10.1038/s41568-019-0149-1
Goji, T., Takahara, K., Negishi, M., and Katoh, H. (2017). Cystine uptake through the cystine/glutamate antiporter xCT triggers glioblastoma cell death under glucose deprivation. J Biol Chem 292, 19721–19732. doi: 10.1074/jbc.M117.814392
Holzner, S., Brenner, S., Atanasov, A., Senfter, D., Stadler, S., Nguyen, C., et al. (2018). Intravasation of SW620 colon cancer cell spheroids through the blood endothelial barrier is inhibited by clinical drugs and flavonoids in vitro. Food Chem Toxicol 111, 114–124. doi: 10.1016/j.fct.2017.11.015
Huang, Y., Dai, Z., Barbacioru, C., and Sadée, W. (2005). Cystine-glutamate transporter SLC7A11 in cancer chemosensitivity and chemoresistance. Cancer Res 65, 7446–7454. doi: 10.1158/0008-5472.CAN-04-4267
Huang, Y., Huang, J., Huang, Y., Gan, L., Long, L., Pu, A., et al. (2020). TFRC promotes epithelial ovarian cancer cell proliferation and metastasis via up-regulation of AXIN2 expression. Am J Can Res 10, 131–147.
Huang, Z., Xia, L., Zhou, X., Wei, C., and Mo, Q. (2019). ALOX12 inhibition sensitizes breast cancer to chemotherapy via AMPK activation and inhibition of lipid synthesis. Biochem Biophys Res Commun 514, 24–30. doi: 10.1016/j.bbrc.2019.04.101
Koppula, P., Zhuang, L., and Gan, B. (2020). Cystine transporter SLC7A11/xCT in cancer: ferroptosis, nutrient dependency, cancer therapy. Protein Cell. doi: 10.1007/s13238-020-00789-5
Lee, J. Y., Kim, S., Kim, Y. T., Lim, M. C., Lee, B., Jung, K. W., et al. (2018). Changes in ovarian cancer survival during the 20 years before the era of targeted therapy. BMC Cancer 18:601. doi: 10.1186/s12885-018-4498-z
Lheureux, S., Gourley, C., Vergote, I., and Oza, A. M. (2019). Epithelial ovarian cancer. Lancet 393, 1240–1253. doi: 10.1016/S0140-6736(18)32552-2
Li, C., Dong, X., Du, W., Shi, X., Chen, K., Zhang, W., et al. (2020a). LKB1-AMPK axis negatively regulates ferroptosis by inhibiting fatty acid synthesis. Signal Transd Target Ther 5, 187. doi: 10.1038/s41392-020-00297-2
Li, J., Cao, F., Yin, H. L., Huang, Z. J., Lin, Z. T., Mao, N., et al. (2020b). Ferroptosis: past, present and future. Cell Death Dis 11, 88. doi: 10.1038/s41419-020-2298-2
Liu, N., Lin, X., and Huang, C. (2020). Activation of the reverse transsulfuration pathway through NRF2/CBS confers erastin-induced ferroptosis resistance. Br J Can 122, 279–292. doi: 10.1038/s41416-019-0660-x
Liu, T., Jiang, L., Tavana, O., and Gu, W. (2019). The deubiquitylase OTUB1 mediates ferroptosis via stabilization of SLC7A11. Cancer Res 79, 1913–1924. doi: 10.1158/0008-5472.CAN-18-3037
Lobello, N., Biamonte, F., Pisanu, M., Faniello, M., Jakopin, Ž, Chiarella, E., et al. (2016). Ferritin heavy chain is a negative regulator of ovarian cancer stem cell expansion and epithelial to mesenchymal transition. Oncotarget 7, 62019–62033. doi: 10.18632/oncotarget.11495
Matulonis, U. A., Sood, A. K., Fallowfield, L., Howitt, B. E., Sehouli, J., and Karlan, B. Y. (2016). Ovarian cancer. Nat Rev Dis Primers 2, 16061. doi: 10.1038/nrdp.2016.61
Nam, E. J., Yoon, H., Kim, S. W., Kim, H., Kim, Y. T., Kim, J. H., et al. (2008). MicroRNA expression profiles in serous ovarian carcinoma. Clin Cancer Res 14, 2690–2695. doi: 10.1158/1078-0432.CCR-07-1731
Piatek, S., Panek, G., Lewandowski, Z., Bidzinski, M., Piatek, D., Kosinski, P., et al. (2020). Rising serum CA-125 levels within the normal range is strongly associated recurrence risk and survival of ovarian cancer. J Ovar Res 13, 102. doi: 10.1186/s13048-020-00681-0
Qiu, J. J., Lin, Y. Y., Ye, L. C., Ding, J. X., Feng, W. W., Jin, H. Y., et al. (2014). Overexpression of long non-coding RNA HOTAIR predicts poor patient prognosis and promotes tumor metastasis in epithelial ovarian cancer. Gynecol Oncol 134, 121–128. doi: 10.1016/j.ygyno.2014.03.556
Salminen, L., Gidwani, K., Grènman, S., Carpén, O., Hietanen, S., Pettersson, K., et al. (2020). HE4 in the evaluation of tumor load and prognostic stratification of high grade serous ovarian carcinoma. Acta Oncologica 59, 1461–1468. doi: 10.1080/0284186X.2020.1827157
Shah, R., Shchepinov, M., and Pratt, D. (2018). Resolving the role of lipoxygenases in the initiation and execution of ferroptosis. ACS Central Sci 4, 387–396. doi: 10.1021/acscentsci.7b00589
Stockwell, B. R., Friedmann Angeli, J. P., Bayir, H., Bush, A. I., Conrad, M., Dixon, S. J., et al. (2017). Ferroptosis: a regulated cell death nexus linking metabolism, redox biology, and disease. Cell 171, 273–285. doi: 10.1016/j.cell.2017.09.021
Tian, Y., Lu, J., Hao, X., Li, H., Zhang, G., Liu, X., et al. (2020). FTH1 inhibits ferroptosis through ferritinophagy in the 6-OHDA model of Parkinson's disease. Neurotherapeutics. doi: 10.1007/s13311-020-00929-z
Wang, W., Green, M., Choi, J., Gijón, M., Kennedy, P., Johnson, J., et al. (2019). CD8 T cells regulate tumour ferroptosis during cancer immunotherapy. Nature 569, 270–274.
Worley, B., Kim, Y., Mardini, J., Zaman, R., Leon, K., Vallur, P., et al. (2019). GPx3 supports ovarian cancer progression by manipulating the extracellular redox environment. Redox biology 25, 101051. doi: 10.1016/j.redox.2018.11.009
Xie, Y., Hou, W., Song, X., Yu, Y., Huang, J., Sun, X., et al. (2016). Ferroptosis: process and function. Cell Death Differ 23, 369–379. doi: 10.1038/cdd.2015.158
Yang, W. S., and Stockwell, B. R. (2016). Ferroptosis: death by lipid peroxidation. Trends Cell Biol 26, 165–176. doi: 10.1016/j.tcb.2015.10.014
Yin, F., Yi, S., Wei, L., Zhao, B., Li, J., Cai, X., et al. (2019). Microarray-based identification of genes associated with prognosis and drug resistance in ovarian cancer. J Cell Biochem 120, 6057–6070. doi: 10.1002/jcb.27892
Zhang, Z., Yao, Z., Wang, L., Ding, H., Shao, J., Chen, A., et al. (2018). Activation of ferritinophagy is required for the RNA-binding protein ELAVL1/HuR to regulate ferroptosis in hepatic stellate cells. Autophagy 14, 2083–2103. doi: 10.1080/15548627.2018.1503146
Zhao, L., Gu, C., Huang, K., Zhang, Z., Ye, M., Fan, W., et al. (2016). The prognostic value and clinicopathological significance of CD44 expression in ovarian cancer: a meta-analysis. Arch Gynecol Obst 294, 1019–1029. doi: 10.1007/s00404-016-4137-3
Zheng, J., and Conrad, M. (2020). The metabolic underpinnings of ferroptosis. Cell Metab. doi: 10.1016/j.cmet.2020.10.011
Keywords: ovarian cancer, ferroptosis, risk signature, overall survival, immune cell infiltration
Citation: Ye Y, Dai Q, Li S, He J and Qi H (2021) A Novel Defined Risk Signature of the Ferroptosis-Related Genes for Predicting the Prognosis of Ovarian Cancer. Front. Mol. Biosci. 8:645845. doi: 10.3389/fmolb.2021.645845
Received: 24 December 2020; Accepted: 09 March 2021;
Published: 01 April 2021.
Edited by:
Mahendra Pratap Kashyap, University of Alabama at Birmingham, United StatesReviewed by:
Salva Mena-Mollá, University of Valencia, SpainSanjay Rathod, University of Pittsburgh, United States
Copyright © 2021 Ye, Dai, Li, He and Qi. This is an open-access article distributed under the terms of the Creative Commons Attribution License (CC BY). The use, distribution or reproduction in other forums is permitted, provided the original author(s) and the copyright owner(s) are credited and that the original publication in this journal is cited, in accordance with accepted academic practice. No use, distribution or reproduction is permitted which does not comply with these terms.
*Correspondence: Hongbo Qi, qihongbocy@gmail.com
†These authors have contributed equally to this work and share first authorship