Identification of HOXA1 as a Novel Biomarker in Prognosis of Head and Neck Squamous Cell Carcinoma
 Hui Li
 Xiaomin Wang
 Mingjie Zhang
 - Department of Otolaryngology, The First Affiliated Hospital of Bengbu Medical College, Bengbu, China
Hox genes, a highly conserved homolog in most animals, play vital functions in cell development and organ formation. In recent years, researchers have discovered that it can act as a tumor regulator, and its members can participate in tumorigenesis by regulating receptor signaling, cell differentiation, apoptosis, migration, EMT, and angiogenesis. Hox genes and which major members play a vital role in the progress of head and neck squamous cell carcinoma (HNSCC) is still unclear. After analyzing the expression differences and prognostic value of all Hox genes through the TCGA-HNSC database, we use histochemistry stains in 52 pairs of HNSCC slices to verify the expression level of the key member-HOXA1. In correlation analysis, we found that high HOXA1 expression is related to poor pathological grade (p = 0.0077), advanced T stage (p = 0.021) and perineural invasion (PNI) (p = 0.0019). Furthermore, we used Cox univariate and multivariate regression analysis to confirm the independent predictive power of HOXA1 expression. To explore the underlying mechanisms behind HOXA1, we ran GSVA and GSEA and found fourteen mutual signaling pathways, including neuroprotein secretion and transport, tumor-associated signaling pathways, cell adhere junction and metabolic reprogramming. Finally, we found that the high expression of HOXA1 is significantly related to the decrease of CD8+ T cell infiltration and the decline of DNA methylation level. Our findings demonstrated that HOXA1, as a notable member of the HOX family, maybe an independent prognostic indicator in HNSCC.
Introduction
Head and neck cancer was one of the most common malignant upper respiratory tract tumors globally, of which squamous cell carcinoma (HNSCC) accounts for about 90% (Bray et al., 2018). Although the continuous improvement of treatment such as surgery, radiotherapy, chemotherapy, targeted therapy and immunotherapy, the 5-year survival rate of HNSCC is still stagnant (Cancer Genome Atlas Network, 2015). Senile patients are mainly those who are habitually ingesting alcohol and tobacco, while HPV infection has led to an increase in young patients recently, especially oropharyngeal squamous cell carcinoma (Chaturvedi et al., 2011). Among them, patients with HPV-negative suffer from irreversible damage due to long-term smoking and drinking, who are more tolerant of the treatments with a worse prognosis.
Hox genes is a subgroup of the homeobox transcription factor family, which aggregates in 4 types of chromosomal loci (A-D), with 39 genes in humans. Hox gens plays its main function by encoding transcription factors or directly targeting downstream genes as monomers or homodimers (Alexander et al., 2009). Members of Hox genes can participate in cell development, organ formation and even carcinogenesis by regulating receptor signaling, cell differentiation, apoptosis, migration, epithelial-mesenchymal transition (EMT) and angiogenesis (Cho et al., 2012). Hox genes is tissue-specific and may play a key role in developmental regulation in one tissue type (Economides and Capecchi, 2003), while in another tissue, it is an accomplice of tumor malignant biological behavior (Wang et al., 2007). Previous studies have found that many Hox genes are abnormally expressed in hematological malignancies and various solid tumors. There are inadequate studies on the involvement of Hox genes in the occurrence and development of HNSCC. Therefore, studying the role of Hox genes in HNSCC is of great significance.
In this study, we used the method of bioinformatics mining database of TCGA-HNSC combined with immunohistochemical (IHC) verification to find a novel prognostic biomarker, HOXA1 (Homeobox A1) in Hox genes. HOXA1 is the first Hox gene to be discovered that can be upregulated during carcinogenesis by gastrin (Hofsli et al., 2005). In breast cancer, HOXA1 has been identified as a breast epithelial oncogene whose forced expression is sufficient to induce the transformation of immortalized human mammalian epithelial cells into aggressive cancer cells (Zhang et al., 2006; Mohankumar et al., 2008). In previous reports, the abnormal expression of HOXA1 is related to the prognosis of breast cancer, lung cancer, liver cancer, prostate cancer, oral cancer, gastric cancer and melanoma (Shah and Sukumar, 2010). We evaluated the abnormal expression of HOXA1 in HNSCC and confirmed its independent predictive power. At the same time, we analyzed the correlation between the expression level and clinicopathological characteristics. According to the expression level, we ran gene set variation analysis (GSVA) and gene set enrichment analysis (GSEA) to further analyze the biological pathways of HNSCC pathogenesis related to the expression of HOXA1. Finally, results of TIMER, CIBERSORT and MEXPRESS analysis indicated that HOXA1 was correlated with CD8+ T cell infiltration and DNA methylation level.
Materials and Methods
HOX Genes Expression Datasets and Relevant Clinicopathological Features
HNSCC dataset (528 cases) contain RNA-Seq (HTSeq) and clinicopathological characteristics from the cancer genome atlas (TCGA-HNSC) were downloaded (https://cancergenome.nih.gov/). Screened out 499 cases, including the expression of 39 Hox genes and corresponding clinicopathological features are used in the subsequent analysis. R Package “survminer” were used to calculate the cutoff value of Hox genes. The 499 cases were divided into a high-expression group (n = 396) and a low-expression group (n = 103) according to the cutoff value of HOXA1 expression (overall survival, OS: 1.0525, disease-free survival, DFS: 2.9749). Clinical features of HNSCC patients had been shown in Table 1.
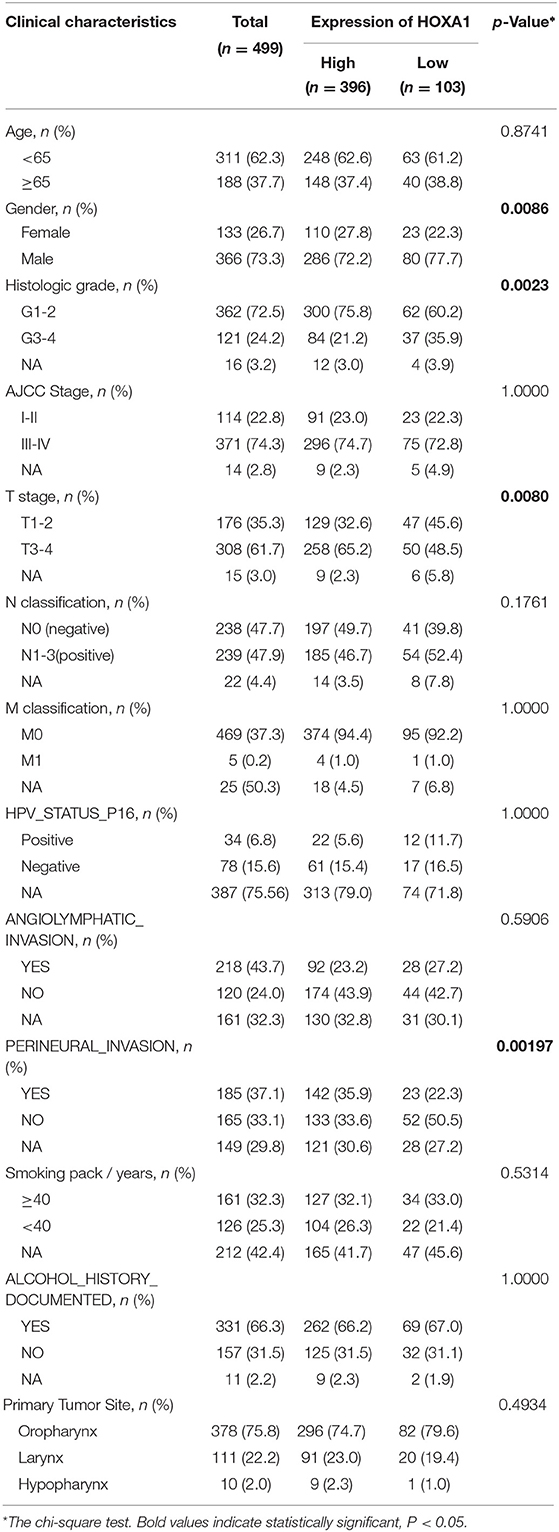
Table 1. Clinical features of TCGA-HNSC patients (n = 499).
Differentially Expressed Genes and Clinical Pathological Parameters Analysis
First, the R package “limma” was used to analyze the differential expression of 39 Hox genes between tumor and normal samples in 499 patients and differentially expressed genes (DEGs) with |log2 fold change (FC)| > 1 and adjusted P-values < 0.05 were selected for subsequent analysis. The prognostic genes with the predictive ability of OS and DFS were screened out by the analysis of the Kaplan–Meier survival curve and the log-rank test (P < 0.05). The correlation analysis between the expression of HOXA1 and clinicopathological characteristics were evaluated by the R package “combn.” Furthermore, Cox univariate and multivariate regression analysis were performed on the individual clinical variables [age (years ≥65/ <65), gender (male/female), grade (G1&2/G3&4), AJCC Stage (I&II/III&IV), T stage (T1–2/T3–4), N classification (N0/N1–3), M classification (M0/M1), HPV_STATUS_P16 (positive/negative), angiolymphatic invasion (Yes/No), perineural invasion (Yes/No), smoking (packs/year ≥40/ <40), alcohol history documented (Yes/No) and primary tumor site (Oropharynx/ Larynx/Hypopharynx)]with the HOXA1 expression value and high or low-expression level. Hazard ratios (HRs) and 95% confidence intervals (CIs) were calculated using the R package “coxph.” The chi-square test was used to assess the statistical significance of expression value between the two groups.
Analysis of Immune Infiltration and DNA Methylation
The fraction of twenty-two immune cell types of each TCGA-HNSC sample was yielded through R package “CIBERSORT” by estimating relevant subsets of RNA profiles (https://cibersort.stanford.edu/) (Supplementary Material 1). Only samples with P < 0.05 were conceived to perform the further analysis of comparing differential the tumor-infiltrating immune cells (TICs) level between the high and low-HOXA1 level group. In addition, another immune infiltration data is derived from TIMER (Tumor Immune Estimation Resource, https://cistrome.shinyapps.io/timer/) and DNA methylation data came from MEXPRESS database (https://mexpress.be/).
Gene Set Variation Analysis (GSVA) and Gene Set Enrichment Analysis (GSEA)
The R package “GSVA” was used to evaluate the signaling pathways (5529 gene sets) and Gene Ontology (GO) terms (10,192 gene sets) in the TCGA-HNSC database (Hänzelmann et al., 2013). Then, the R package “limma” was used to analyze the significant differential gene sets between the two groups. Besides, 499 HNSCC cases were divided according to the median expression value of HOXA1. GSEA was then performed to detect the gene sets that were enriched in the gene rank for identifying potential the pathways most associated with HOXA1. The annotated gene sets of c2.cp.kegg. v7.1. symbols in the Molecular Signatures Database (MSigDB) was selected in GSEA version 4.1.0 (https://www.gsea-msigdb.org/gsea/msigdb/index.jsp). We performed 1,000 times of permutations and filtered the results by normalized enrichment scores (NES), nominal p-value and false discovery rate (FDR) q-value (Subramanian et al., 2005).
Tissue Specimen Collection and Immunohistochemistry (IHC)
The study was approved by the Clinical Research Ethics Committee of The First Affiliated Hospital of Bengbu Medical College. Written informed consent was obtained from all-volunteer patients. In all, 52 pairs of HNSCC paraffin sections were collected from The First Affiliated Hospital of Bengbu Medical College (Supplementary Material 2). In the progress of antigen retrieval, the sections were placed in 10 mM citrate buffer solution (pH = 6.0) and boiling in a pressure cooker for 15 min. After cooling to 37°C, 3% H2O2 was added and incubated for 10 min to deplete the activity of endogenous peroxidase. After blocking by Goat serum, the sections were stained with an anti-HOXA1 polyclonal antibody (1:100, Thermo Fisher Scientific, catalog # PA5-36164, RRID AB_2553401) for a night at 4°C-refrigerator. After soaking and rinsing thoroughly with PBS three times, the sections were stained with secondary antibodies. Finally, the positive expression of the HOXA1 protein was observed by a microscope after adding substrate and hematoxylin staining. The expression density was scored by two experienced pathologists, following the single-blind trial technique. HOXA1 protein staining was assessed by the sum of the percentage of positive nuclear cells: − (0–25%), + (26–50%), ++ (51–100%). At last, we evaluated HOXA1 expression into two levels, low (− to +) and high (++). Fifty-two pairs of IHC pictures were taken for each slide, and images (200 ×) were analyzed using software ImageJ (US National Institute of Health, Bethesda, Maryland, USA, https://imagej.nih.gov/).
Statistical Analysis
Statistical analyses were conducted with software R (v3.6.0) and GraphPad Prism 7 (GraphPad Software, California, USA). Differences among variables were analyzed with two-tailed Student's t-test and chi-square test. All significance tests were carried out at the 0.05 level.
Results
Differentially Expression and Prognostic Value of HOX Genes in HNSCC
The analysis flow chart of this article is shown in Figure 1. Most Hox genes (30/39, Supplementary Material 3) have significant differences in expression between 499 tumor samples and 43 tumor-adjacent normal samples (Figure 2A). Among DEGs, only HOXA1 have predictive ability both in OS and DFS (Supplementary Figure 1), and worse clinical outcomes in patients with high expression of HOXA1 (Figures 2B–E).
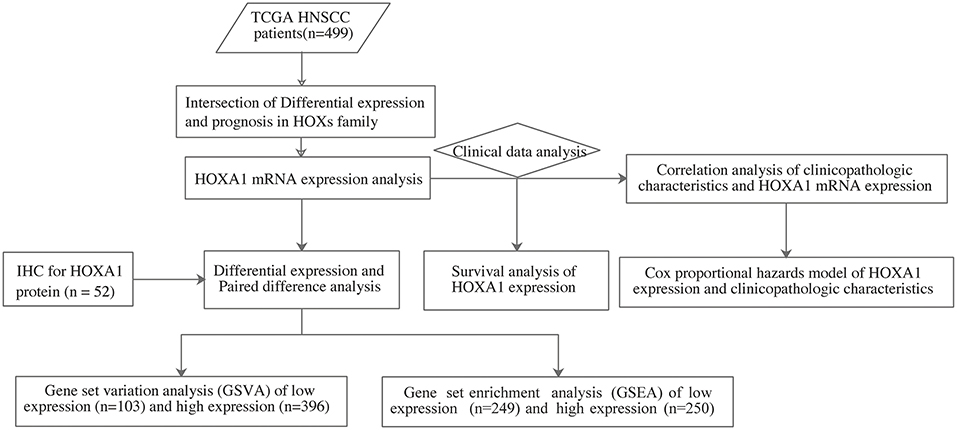
Figure 1. The flow chart showing the scheme of our study on HOXA1 as an independent prognostic indicator for HNSCC.
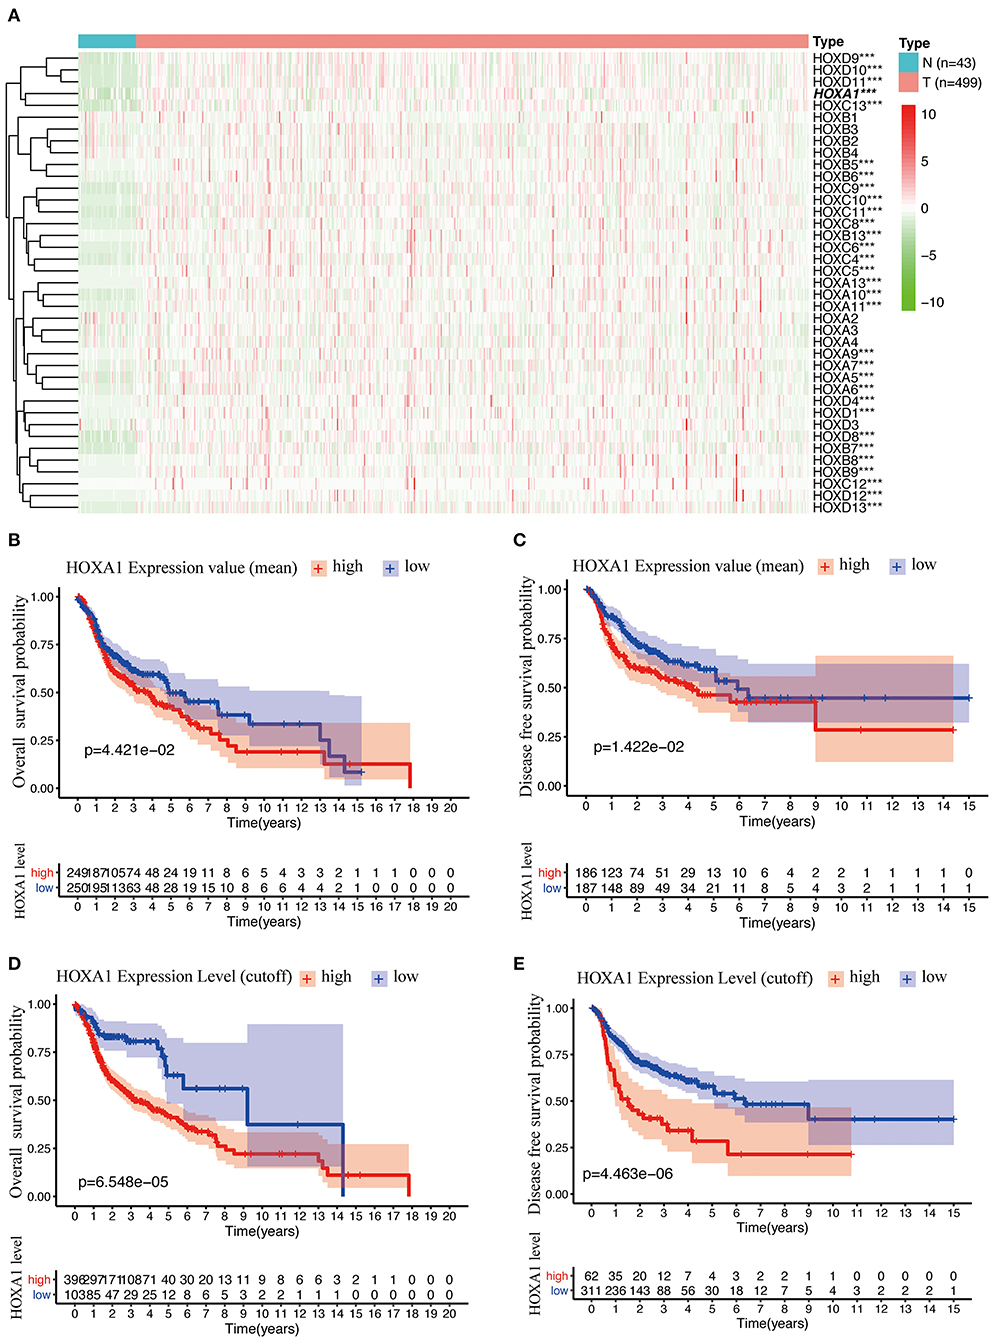
Figure 2. Differentially Expression and Prognostic Value OF HOX Genes in HNSCC. (A) Heatmap of HOX genes family included 30 differentially expressed genes (DEGs) in 499 tumor tissues compared with 43 para-carcinoma tissues based on TCGA-HNSC DATA. (B) Kaplan-Meier curve analysis of overall survival of TCGA-HNSC patients in high- and low-HOXA1 expression (mean value) groups (p = 4.421e−02). (C) Kaplan-Meier curve analysis of disease-free survival of TCGA-HNSC patients in high- and low-HOXA1 expression (mean value) groups (p = 1.422e−02). (D) Kaplan-Meier curve analysis of overall survival of TCGA-HNSC patients in high- and low-HOXA1 level (cut-off value) groups (p = 6.548e−05). (E) Kaplan-Meier curve analysis of disease-free survival of TCGA-HNSC patients in high- and low-HOXA1 level (cut-off value) groups (p = 4.463e−06). ***P < 0.001.
HOXA1 Is Upregulated in HNSCC
In TCGA-HNSC, HOXA1 expression in tumor tissues was significantly higher than adjacent tissues (p = 1.241e-10) (Figure 3A), the differential analysis of HOXA1 expression in 43 paired samples got the same result (p = 9.984e−09) (Figure 3B). We performed IHC in 52 pairs of HNSCC paraffin sections for further verification (Figures 3E–G). HOXA1 protein immunostaining was mainly found in the cell nucleus but widely distributed in cancer nest. Among them, HOXA1 protein was detected in 45 cases (86.5%, + to ++) of tumor samples, while HOXA1 protein was detected in only ten sections (19.2%, + to ++) of adjacent pieces. There were 38 cases with low positive staining (− to +) and 14 patients with high positive staining (++) among the tumor samples. Our results also showed that HNSCC samples have a higher mean percentage of HOXA1-positive area (Figure 3C) and HOXA1-positive cells (Figure 3D) than paracancerous samples (P < 0.0001). The numeric dimension of the areas (mean ± SD, median) used for the IHC evaluation were shown in Table 2.
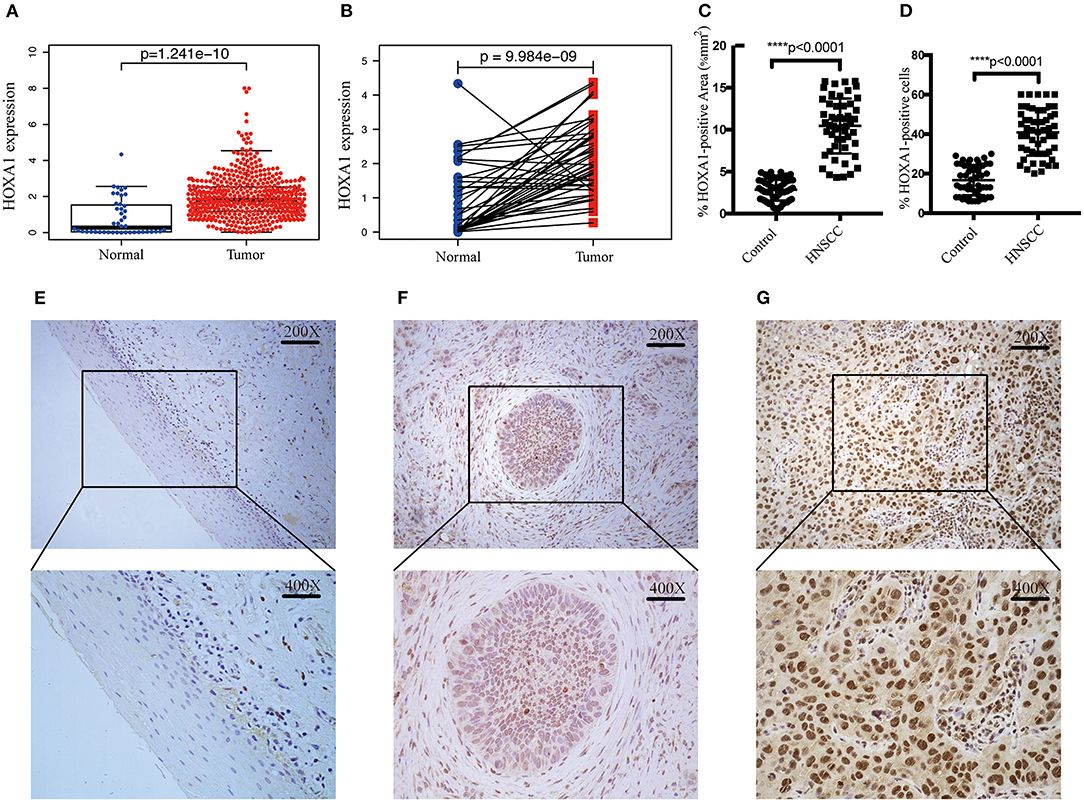
Figure 3. Transcriptional expression and protein level of HOXA1 is significantly high in HNSCC patients. (A) Higher HOXA1 mRNA expression in 499 tumor tissues compared with 43 para-carcinoma tissues based on TCGA-HNSC DATA (p = 1.241e−10). (B) Paired difference analysis of HOXA1 mRNA expression based on TCGA-HNSC DATA (p = 9.984e−09). (C) The percentage of HOXA1-positive area was significantly higher in HNSCC sections than in para-carcinoma sections (P < 0.0001). (D) The percentage of HOXA1-positive cells was significantly higher in HNSCC sections than in para-carcinoma sections (P < 0.0001). (E–G) Representative immunohistochemical staining for HOXA1 protein in 52 matched HNSCC tissues and para-carcinoma tissues. (E) Negative expression of HOXA1 in para-carcinoma tissues (−). (F) Low expression of HOXA1 protein in HNSCC specimens (− to +). (G) High expression of HOXA1 protein in primary HNSCC specimens (++). Original magnification: x200 (top), x400 (bottom).
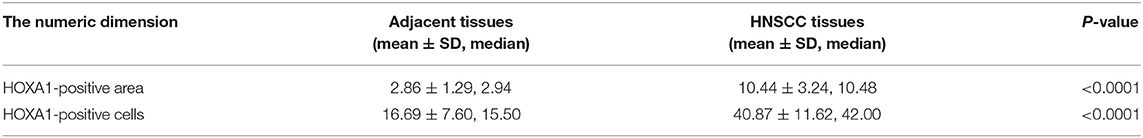
Table 2. The numeric dimension of the areas (mean ± SD, median) used for the IHC evaluation.
Association of HOXA1 Expression With Clinicopathological Features
The expression of HOXA1 was highly statistically significant correlated with pathology grade (G1&2 vs. G3&4, p = 0.0077), local invasion (T1–2 vs. 3–4, p = 0.023), perineural invasion (No vs. Yes, p = 0.0019) and HPV infection (positive vs. negative, p = 0.001) (Figures 4A–L). The expression of HOXA1 in oropharyngeal cancer was significantly lower than that in laryngeal cancer (p = 0.021), and there was no significant difference between the other two tumor locations (Figure 5A). We conducted further survival analysis in three tumor locations and found that the expression of HOXA1 only has prognostic value in oropharyngeal cancer (P < 0.05), while no significant predictive value in hypopharyngeal and laryngeal cancer (p > 0.05) in TCGA-HNSC patients (Figures 5B–D).
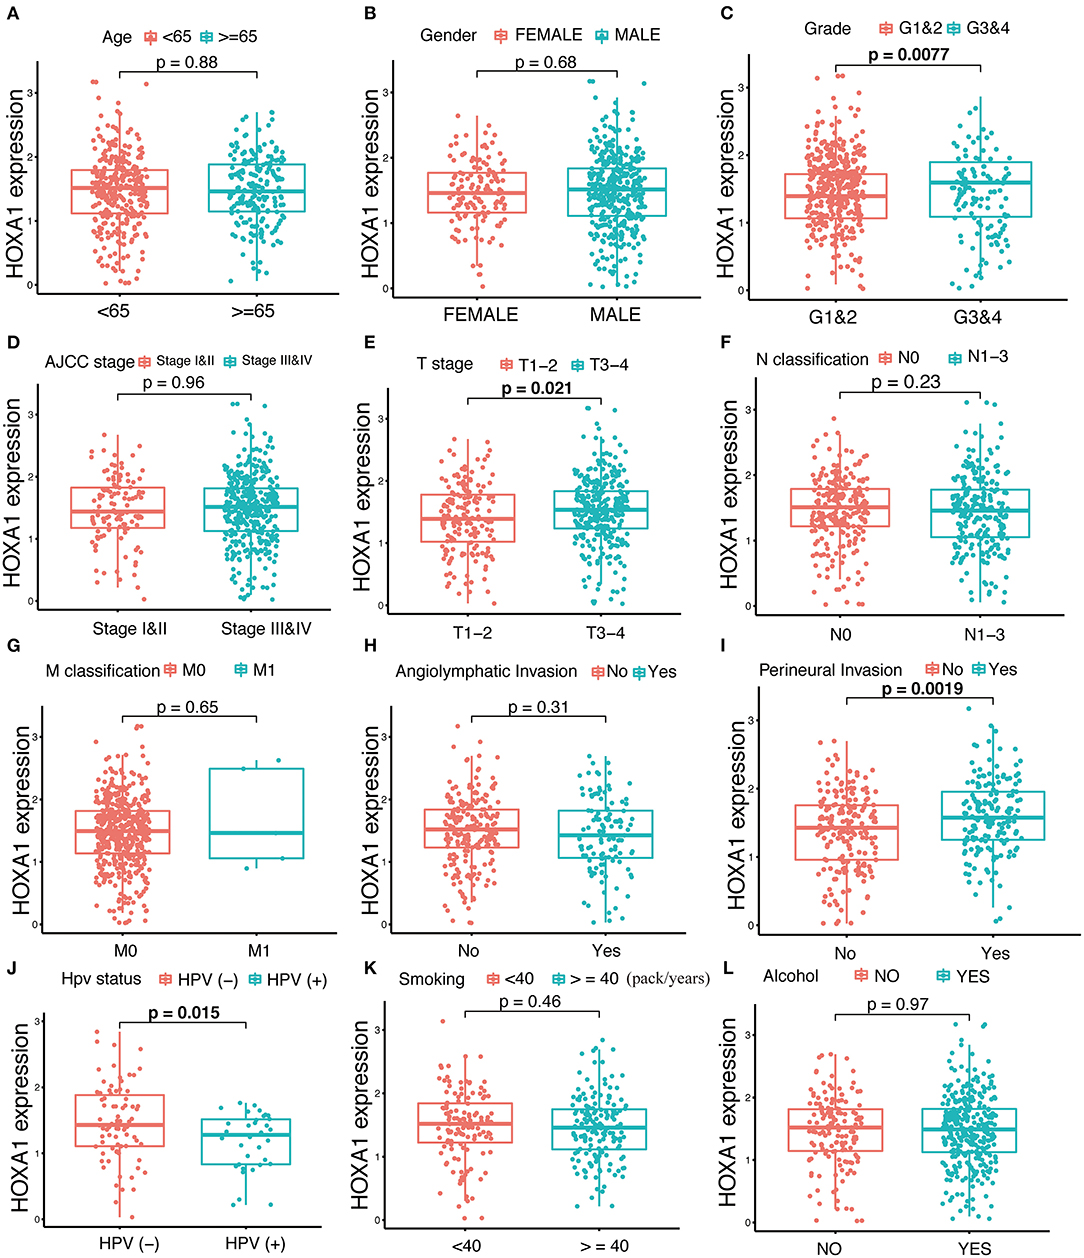
Figure 4. Correlation analysis between transcriptional expression of HOXA1 and clinicopathologic parameters in TCGA-HNSC patients. (A–L) HOXA1 was significantly correlated with Grade (G1and2 and G3and4, p = 0.0077), T stage (T1–2 and T3–4, p = 0.021), Perineural Invasion (No and Yes, p = 0.0019) and HPV Status (negative and positive, p = 0.015), while not significantly correlated with Age (<65 and ≥65 years, p = 0.88), N classification (N0 and N1-3, p = 0.23), M classification (M0 and M1, p = 0.65), Angiolymphatic Invasion (No and Yes, p = 0.31), Smoking (<40 and ≥40 packs/year, p = 0.46) or Alcohol (No and Yes, p = 0.97).
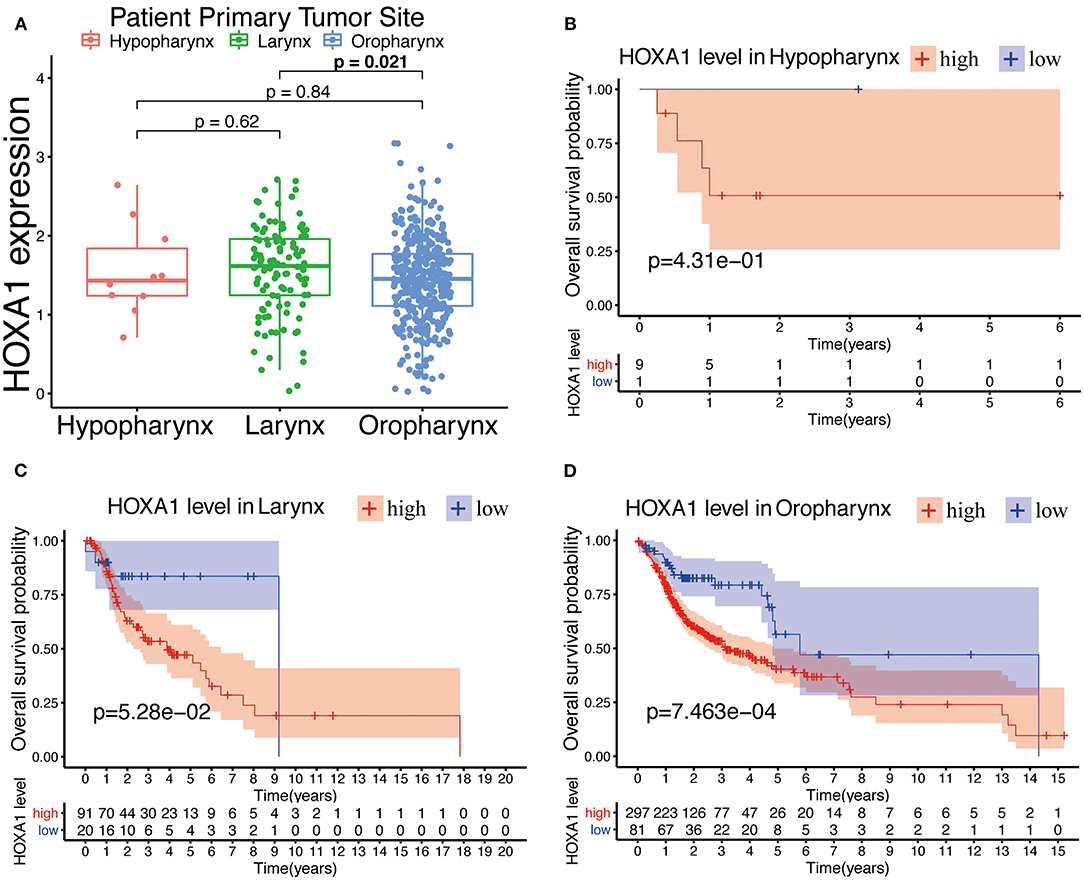
Figure 5. Prognostic performance of HOXA1 expression level for overall survival of different tumor site in HNSCC. (A) HOXA1 was significantly correlated with Primary Tumor Site (Larynx and Oropharynx, p = 0.021), while not significantly correlated with Primary Tumor Site (Hypopharynx and Larynx, p = 0.62 or Hypopharynx and Oropharynx, p = 0.84). Kaplan–Meier curve of the OS in the (B) Hypopharynx, (C) Larynx and (D) Oropharynx cohort stratified by the expression level of HOXA1.
Independent Predictive Power of HOXA1 Expression Value and Expression Level
In Cox univariate regression analysis, the HRs of high-expression vs. low-expression of HOXA1 and expression value of HOXA1 for overall survival (OS) was 2.316 (P < 0.001, CI: 1.515–3.540) and 1.236 (P < 0.001, CI: 1.115–1.369), respectively (Figure 6A). In further multivariate Cox regression analysis, the expression level and expression value of HOXA1 still have a good predictive ability for OS [expression level (HR = 1.927, p = 0.010, CI: 1.173–3.166) and expression value (HR = 1.144, p = 0.047, CI: 1.002–1.307)] (Figure 6B). The results of the above analysis indicated HOXA1 was an independent prognostic factor, and the expression level of HOXA1 seem better.
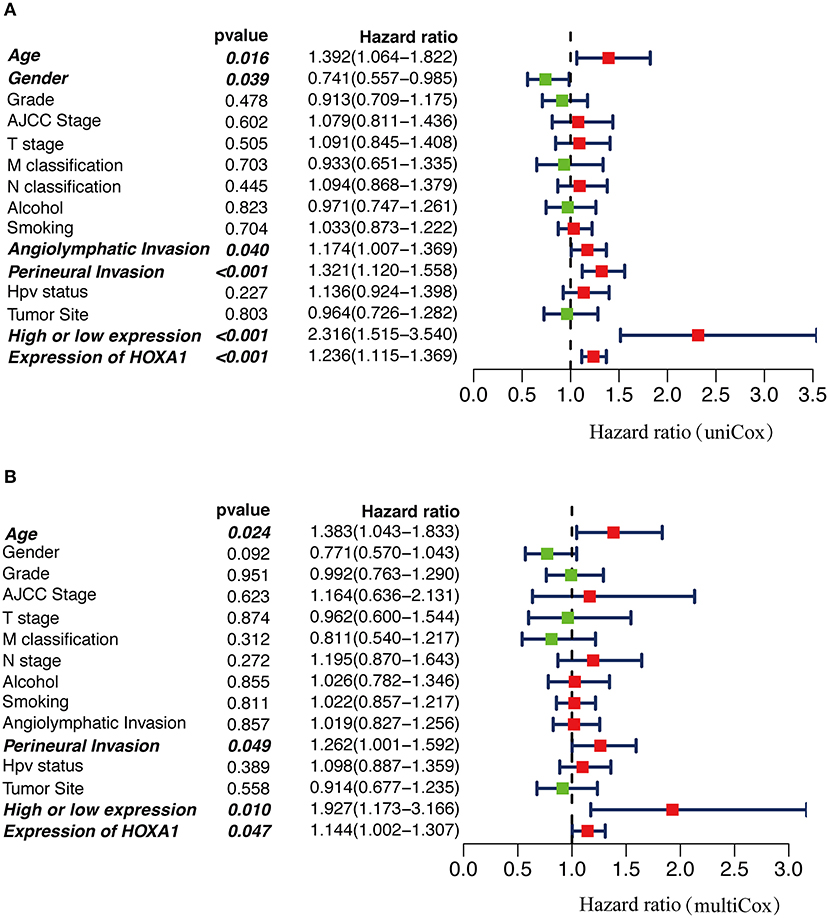
Figure 6. The Cox regression analysis for estimating the clinical value of HOXA1 expression value/expression level. (A) The univariate and (B) multivariate Cox regression analysis of age, gender, grade, AJCC stage, T stage, M classification, N classification, Smoking, Alcohol, Angiolymphatic Invasion, Perineural Invasion, HPV Status, Primary Tumor Site and HOXA1 expression value/expression level in TCGA-HNSC patients. Bold values indicate statistically significant, P < 0.05.
GSVA and GSEA Reveal HOXA1-Related Pathways and Molecular Functions
To explore the potential carcinogenic function of HOXA1, we used both GSVA and GSEA both approaches. After scoring 499 patients by the GSVA, the significant differences in signaling pathways and GO functions associated with the expression level of HOXA1 were obtained, as shown in Figures 7A,B. Besides, we ran GSEA to figure out the significant differential signaling pathways related to the expression value of HOXA1 (Table 3), including neuroprotein secretion and transport, the tumor-associated signaling pathway, cell adhere junction and metabolic reprogramming (Figures 8A–D). After the intersection of the results of GSVA and GSEA, 14 mutual pathways mainly focusing on the following four aspects: neurotrophin, vesicular transport, protein export; Ubiquitin mediated proteolysis, Glycan biosynthesis; gap junction, adherens junction, focal adhesion, regulation of actin cytoskeleton; Pathways in cancer including WNT/ERBB/ NOTCH/TGF-beta.
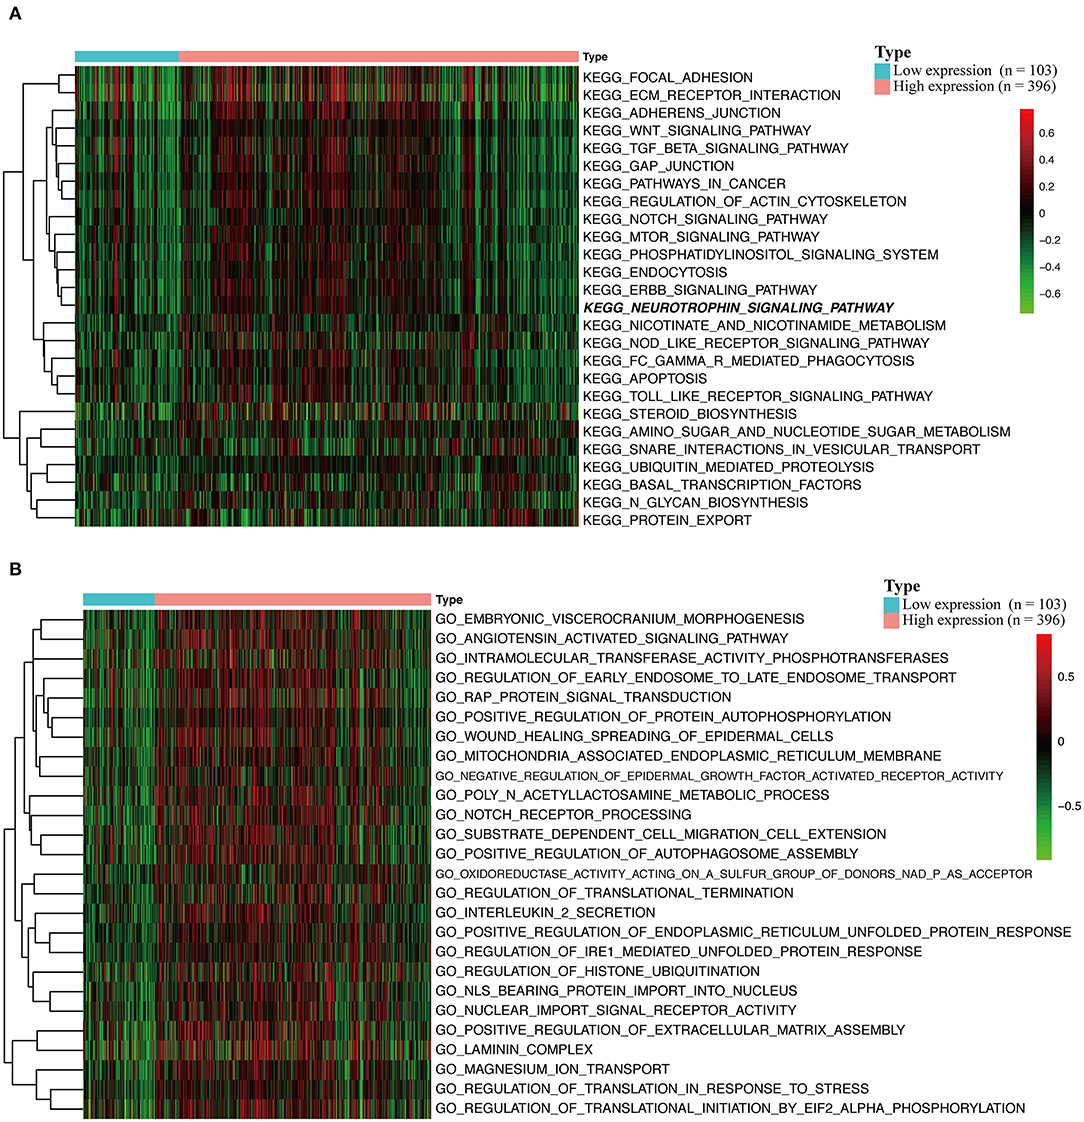
Figure 7. Gene set variation analysis (GSVA) of HOXA1 in TCGA-HNSC dataset. (A) GSVA-derived clustering heatmaps of differentially expressed pathways for high and low expression level of HOXA1. (B) GSVA-derived clustering heatmaps of differentially expressed Gene Ontology for high and low expression level of HOXA1.
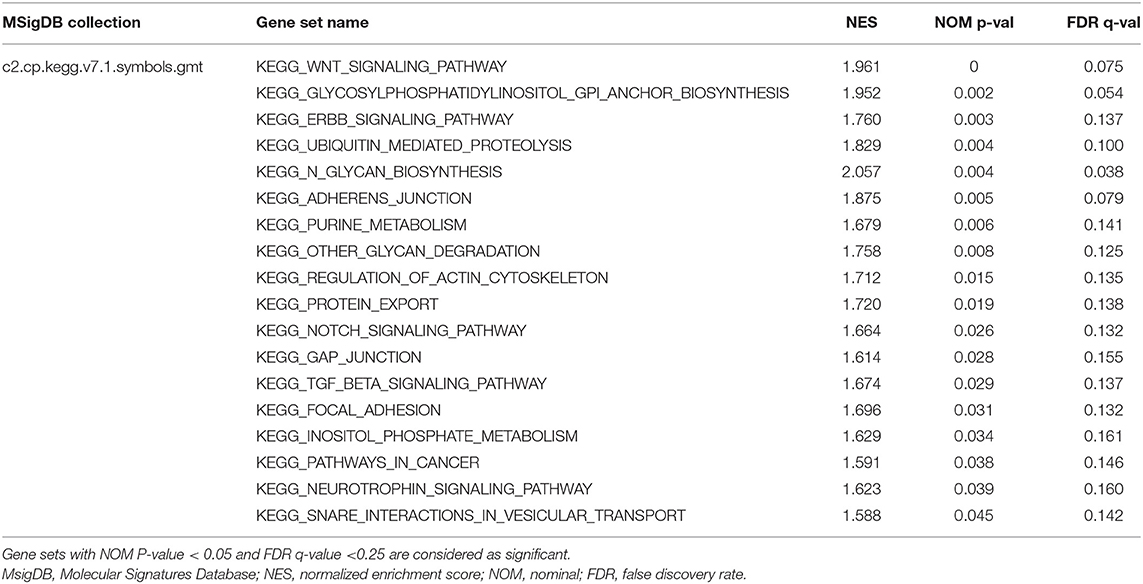
Table 3. Gene sets enriched related with expression of HOXA1.
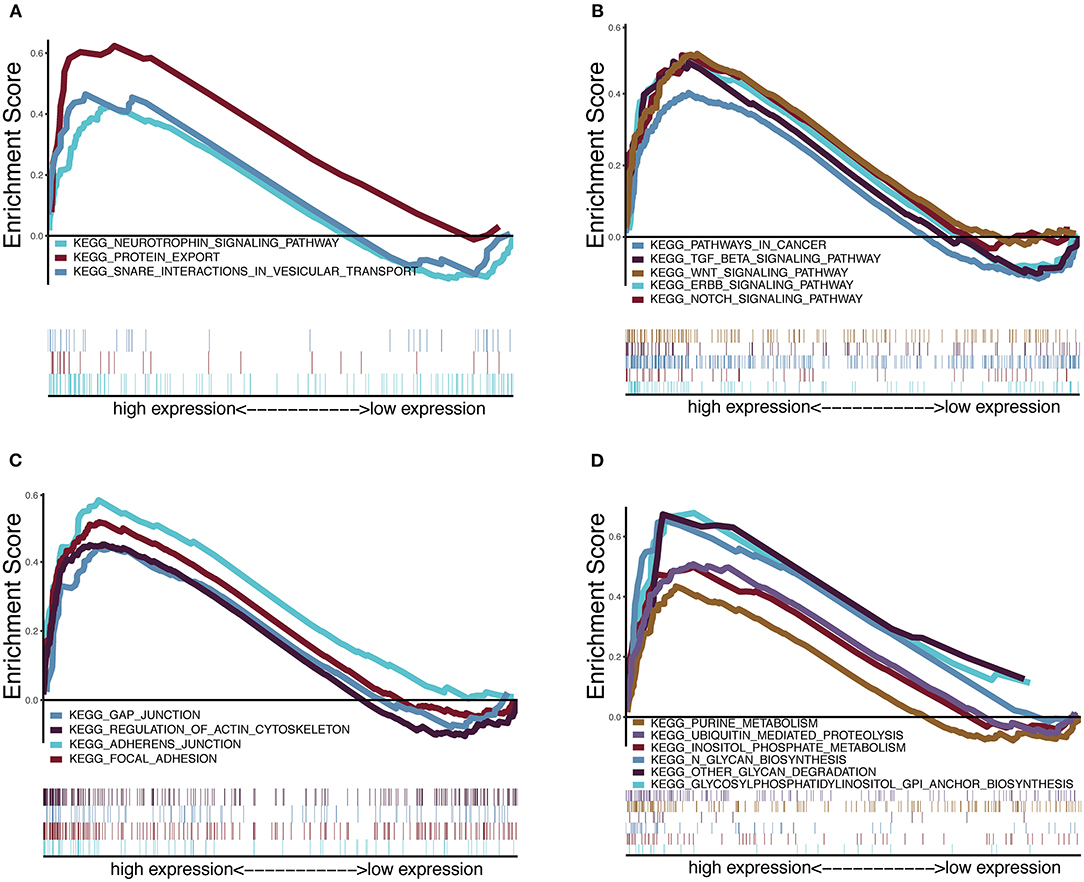
Figure 8. Enrichment plots from multiple-GSEA correlated with high expression value of HOXA1. (A) Neuroprotein secretion and transport: Neurotrophin signaling pathway, Protein export and Snare interactions in vesicular transport. (B) Tumor-associated Signaling Pathway: Pathways in cancer, Wnt signaling pathway, ERBB signaling pathway, Notch signaling pathway and TGF-BETA signaling pathway. (C) Cell adhesion and junction: Adheres junction, Regulation of actin cytoskeleton, Gap junction and Focal adhesion (D) Metabolic reprogramming: Glycosylphosphatidylinositol Gpi anchor biosynthesis, Ubiquitin proteolysis, Glycan biosynthesis, Purine metabolism, Glycan degradation and Inositol phosphate metabolism.
Immune Infiltration and DNA Methylation Correlating With HOXA1 Expression
More and more studies have found that some oncogenes significantly affect the tumor immune microenvironment, including infiltration of B cell, CD8+ T cell, CD4+ T cell, Macrophage, Neutrophil, Dendritic cell, etc. The HOXA1 expression in the TIMER database is associated with a decrease of B cell / CD8+T cell infiltration and an increase of CD4+ T cell infiltration in total HNSCC patients, a reduction of B cell and CD8+T cell infiltration in HPV(+) HNSCC patients, and a decrease of CD8+T cell infiltration and an increase of CD4+ T cell infiltration in HPV(−) HNSCC patients (Figures 9A–C). From the results of immune infiltration in total and HPV subtype HNSCC patients, it is found that the high expression of HOXA1 significantly leads to the reduction of CD8+ T cell infiltration. Besides, we performed the CIBERSORT analysis to screen the differential TICs of the high and low-HOXA1 expression groups and found that the results were similar to the TIMER analysis results. The CIBERSORT analysis results showed that the proportion of M0 macrophages was positively correlated with HOXA1 expression level, and the ratio of CD8+T cells, naïve B cells, CD4 memory activated T cells and follicular helper T cells were negatively associated with the level of HOXA1 expression (Figure 9D).
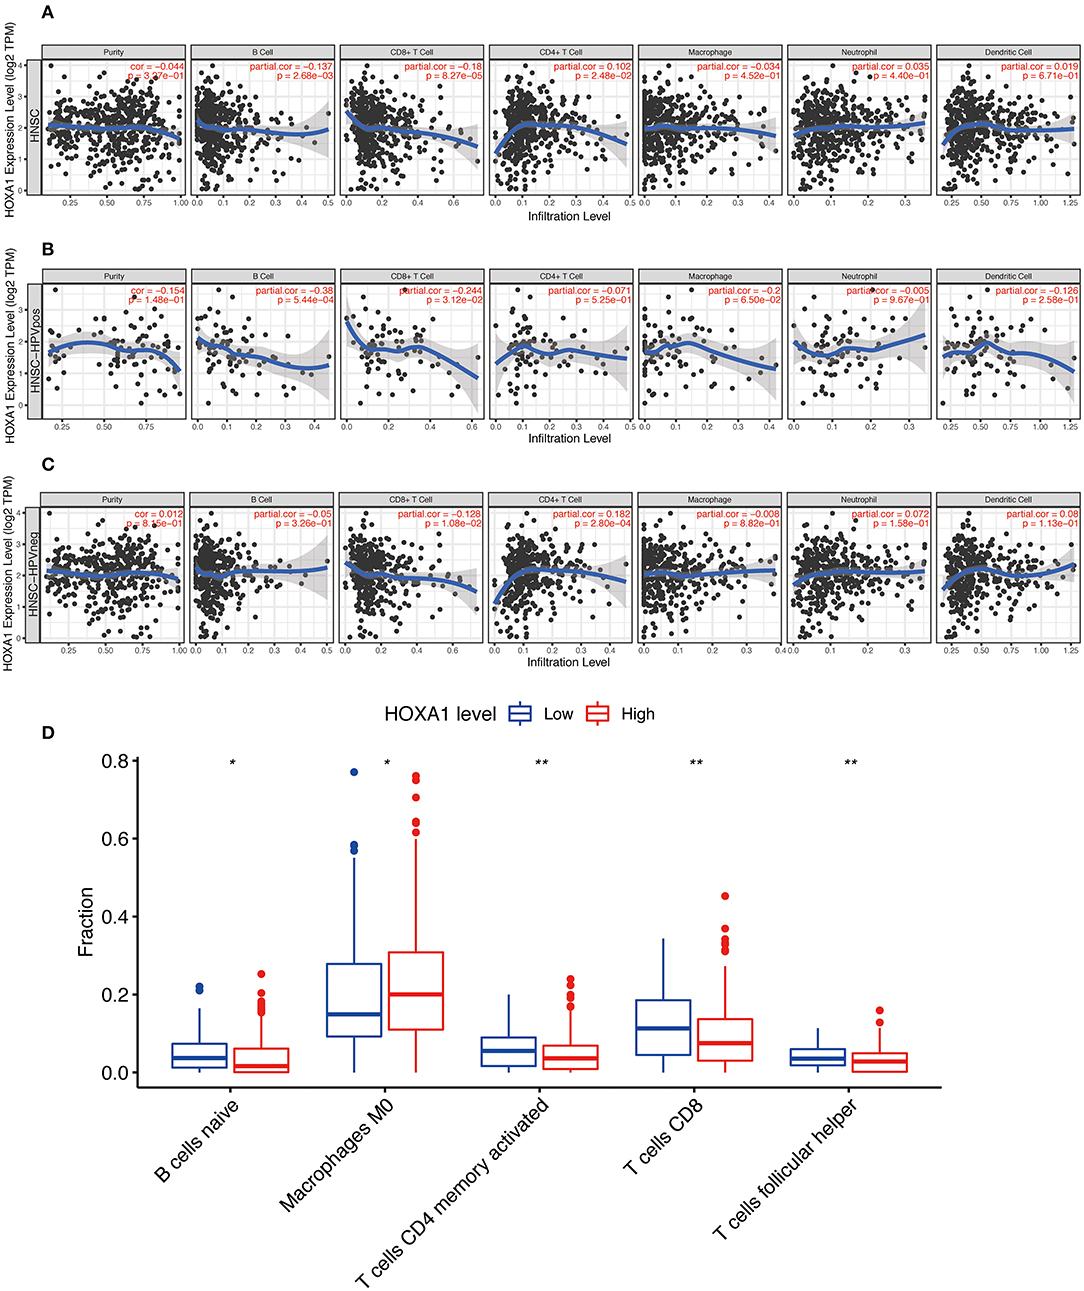
Figure 9. Immune Infiltration Correlating with HOXA1 Expression in TCGA-HNSC dataset. Association of HOXA1 expression with immune infiltration in (A) all HNSCC patients, (B) HNSCC-HPVPOS patients and (C) HNSCC-HPVneg patients based on TIMER database. (D) The association of statistically significant immune cells infiltration and the HOXA1 expression in CIBERSORT analysis. Note: *P < 0.05, **P < 0.01.
The correlation analysis between DNA methylation level and HOXA1 expression showed that high HOXA1 expression with less promoter methylation in tumor samples (Pearson correlation coefficients ranging from −0.166 to −0.528 for promoter region probes) in the MEXPRESS database (Figure 10). We also found that the probes such as cg03116258, cg07450037 and cd12686016 of the seventh chromosome had the strongest correlation in DNA methylation of HOXA1, which was worthy of further exploration and research.
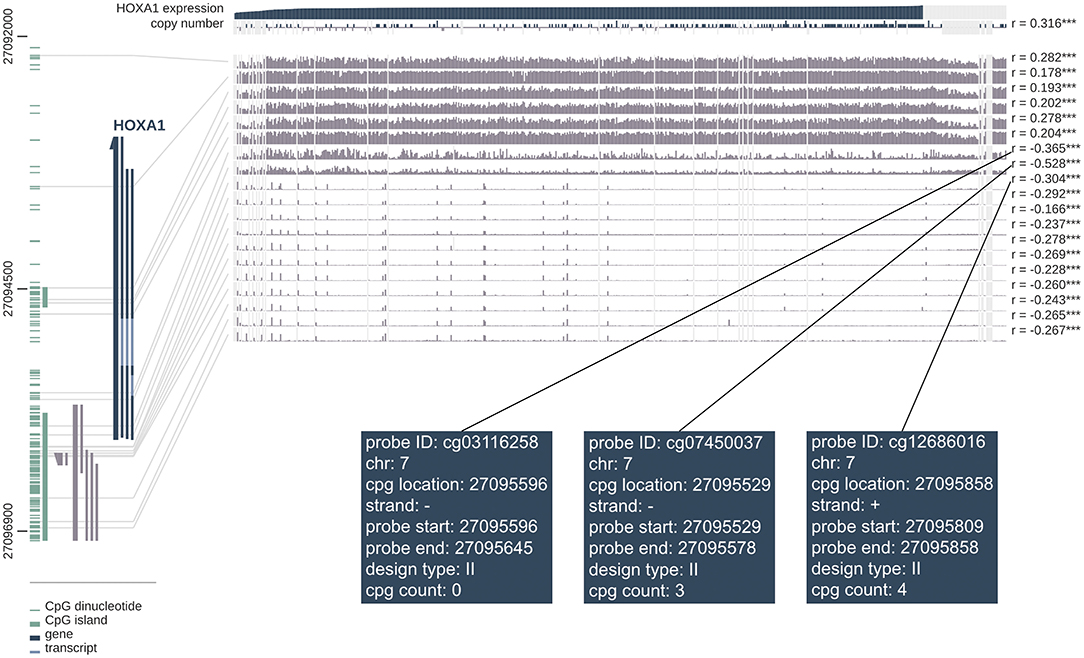
Figure 10. MEXPRESS visualization of the TCGA data for HOXA1 in HNSCC. This figure shows the complex interplay between gene expression, copy number, DNA methylation and probes ID for HOXA1 in HNSCC. Pearson's correlation coefficients and P-values from Wilcoxon rank-sum test for methylation sites and HOXA1 expression are shown on the right side. The gray lines stand for Infinium 450 k probes and their heights represent the beta value for this probe. Dark gray and green lines at the bottom left indicate the HOXA1 and CpG islands.
Discussion
There are only sporadic reports in the literature on the role of HOX genes in HNSCC. Jinyun Li et al. used bioinformatics to analyze the HOXA genes' role in laryngeal squamous cell carcinoma (LSCC), in which HOXA10, HOXA11 and HOXA13 expression and clinical characteristics (M stage and gender) are independent prognostic biomarkers for the prognosis of LSCC patients (Li et al., 2020). The expression of HOXA members in LSCC is negatively correlated with the level of methylation. HOXA7, HOXA10 and HOXA13, which are highly expressed in LSCC tissues, have a weak positive correlation with tumor purity. However, there is no significant correlation between the TICs and HOXA members. Studies in oral squamous cell carcinoma (OSCC) showed that HOXA genes are more enriched than normal mucosal tissues. High expression of HOXA1 can promote OSCC proliferation and maybe an independent prognostic indicator for patients (Bitu et al., 2012). Both AMOT-p80 and miR-146a, identified as HOXD10 targets in HNSCC, can represent therapeutic targets for specific tumor stages (Hakami et al., 2014). High expression of HOXD10 promotes tumor proliferation and migration, while low expression of HOXD10 can promote tumor invasion and metastasis by regulating AMOT-p80. In this paper, we showed the expression profile of 39 members of the HOX genes in HNSCC, as well as the most important independent prognostic indicator and potential biological role of HOXA1 in HNSCC, providing novel insights for further research on HOXA1 as a potential target of HNSCC.
The expression of HOXA1 is tissue-specific (Fagerberg et al., 2014) (https://www.proteinatlas.org), and as tumor modulators, it may cover a wide range of functionality in types of tumor dependent on the cellular context (Shah and Sukumar, 2010). HOXA1 played a role of an oncogene in breast carcinoma (Liu et al., 2019), lung carcinoma (Abe et al., 2006), oral squamous cell carcinoma (Bitu et al., 2012), hepatocellular carcinoma (Zha et al., 2012), melanoma (Wardwell-Ozgo et al., 2014), gastric cancer (Yuan et al., 2016), leukemia (Chen et al., 2019) and retinoblastoma (RB) (Lyv et al., 2020). Inversely, it is shown as anti-oncogenes in pancreatic carcinoma (Ohuchida et al., 2012) and small cell lung cancer (SCLC) (Xiao et al., 2014). Nilay et al. pointed out that the abnormal expression of Hox genes triggers oncogenesis or tumor suppression, which may be caused by her mechanism of action (Shah and Sukumar, 2010). On the level of expression, Hox genes are associated with oncogenesis when expressed at an increased level in tumor tissues not normally seen in that tissue type. In the results of our HNSCC IHC, the expression of HOXA1, which is mainly located in the cell nucleus, is extremely low in adjacent normal tissues while it is widely distributed in cancer nest. Thus, it can be seen that the abnormal up-regulation of HOXA1 in HNSCC, especially in the nucleus, indicates that HOXA1 mainly plays a role in oncogenesis.
E-cadherin activated Rac signaling pathway through the transcription target of HOXA1 (Zhang et al., 2006), which can promote breast cancer cell survival by upregulating cyclinD1, c-Myc, and BCL-2 (Mohankumar et al., 2007, 2008). HOXA1 also takes effect independent of transcriptional regulation (Taminiau et al., 2016). In proteomics research, it is found that HOXA1 also participates in cell signal transduction as a functional protein, such as pathways of focal adhesion, receptor tyrosine kinase function, TGF/BMP and TNF/NF-kB (Lambert et al., 2012). In breast cancer, HOXA1 transforms immortalized human breast epithelial cells stimulated by p44/42 MAPK pathway, signal transducer and activator of transcription 3 (STAT3) and STAT5B into an invasive malignant phenotype. WNT, TGF-beta and FGF pathways may synergistically affect HOXA1 expression, and WNT7A directly maintains expression of HOXA1, making for lung cancer recurrence (Calvo et al., 2000). HOXA1 dedifferentiates melanoma cells into a highly aggressive cell state accompanied by TGF activation (Wardwell-Ozgo et al., 2014). Down-regulation of HOXA1 can increase the expression of E-cadherin while reducing the expression of Snail and MMP-3, which can inhibit ERK1/2 and AKT to suppress the growth, migration, invasion and metastasis of prostate cancer (Wang et al., 2015).
The methylation of DNA is inversely proportional to transcription activity, which also affects the genome's stability. Yeon et al. evaluated the methylation status of 15 genes of promoter CpG island, including HOXA1, that are involved in breast cancer progression (Park et al., 2012). The expression level of HOXA1 in subtypes of breast cancers are related to the disordered epigenetic activity, in which the methylation frequency of Luminal B is the highest (< 0.001). Meanwhile, HOXA1 hypermethylation is related to the absence of HER2 neu expression and proliferation of breast cancer cells (P < 0.05) (Pilato et al., 2013). Through the MEXPRESS database, we found that more HOXA1 expression in HNSCC samples with less promoter methylation, which possibly foreshadowing the lower DNA methylation level of oncogenes, may lead to the occurrence of tumors.
In addition to DNA methylation, many non-coding RNAs (ncRNAs) as another way of apparent epigenesis have been found to participate in the control of gene expression and activation of pathways, which in turn participates in the development of cancer and other diseases. Many studies have shown that circRNAs, lncRNAs and miRNAs play a key role in tumorigenesis, invasion, metastasis and drug resistance through the function of competitive RNA (ceRNA). Here we summarize Non-coding genes act as regulators of HOXA1 in cancers (Table 4).
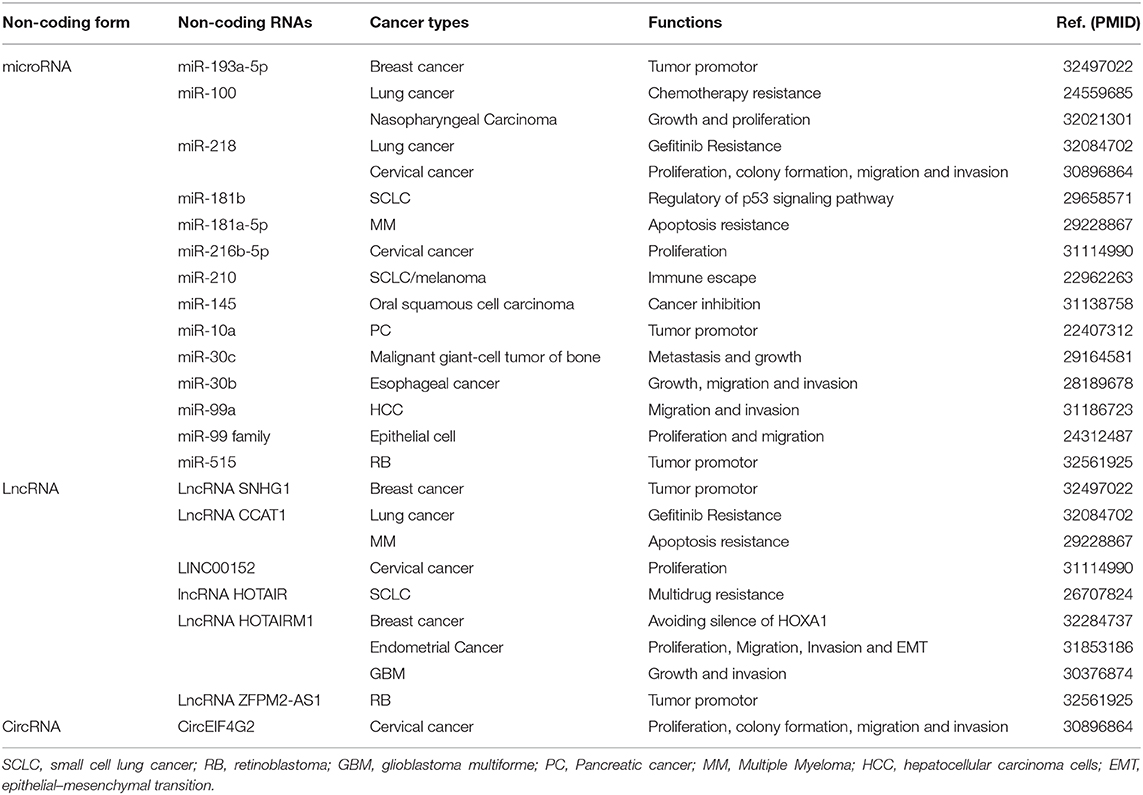
Table 4. Non-coding genes act as regulators of HOXA1 in cancers.
Tumor immunity research is in full swing, and we are still full of unknowns on how the abnormal expression of HOXA1 affects immune function. In the study of endometrial cancer, high expression of HOXA1 in Myeloid-derived suppressor cells (MDSCs) promotes tumor progression and hinders anti-tumor immune response (Li et al., 2019). Tumors adapt to hypoxic stress and create an immunosuppressive microenvironment suitable for survival (Keith et al., 2011). Studies have found that in hypoxic areas of SCLC and melanoma, miR-210 regulates the expression of HOXA1 and inhibits the anti-tumor effect of cytotoxic T lymphocyte (Noman et al., 2012). Regarding the results of TIMER and CIBERSORT analysis, we suspected that the high expression of HOXA1 in HNSCC might reduce CD8+ T cell infiltration, leading to an immunosuppressive environment not conducive to patient's survival outcomes.
Previous studies of pancreatic cancer and glioma showed that the close interaction between tumors and neurons is not conducive to the clinical prognosis. The density of newborn nerve cells in the tumor microenvironment is often associated with tumor growth and highly invasive biological behaviors (Magnon et al., 2013; Venkataramani et al., 2019). The latest study by Moran Amit et al. found that the loss of TP53 in HNSCC can promote tumor growth by affecting neuronal remodeling (Amit et al., 2020). So far, we have found that the function of p53 in SCLC and osteosarcoma is related to the regulation of HOXA1 (Zhao et al., 2015; Zhang et al., 2018). In mouse development studies, it was found that at embryonic stage (D7-9), HOXA1 expression precisely regulates the development of neural crest precursor cells, which are essential for tumor microenvironment remodeling (Gavalas et al., 2001). In this paper, we found that high HOXA1 expression is related to PNI by mining TCGA-HNSC data. According to the analysis of GSVA and GESA, we speculated that HNSCC might act on neurons by secreting exosomes containing neurotrophic proteins. However, this result lacked evidence concerning that no cases that meet PNI were found after careful screening of the paraffin blocks by pathologists. Whether HNSCC hijacks surrounding neurons to promote tumor growth through the regulation of HOXs is still worth exploring.
In summary, HOXA1 may mainly exert tumor regulation functions through the following four mechanisms: spatiotemporal expression disorder (high expression in cancer tissues, especially in the cell nucleus), abnormal protein-signaling pathways (neuronal protein secretion), mediation of immunosuppression (inhibition of CD8+ T cell infiltration) and aberrant epigenetic activity (high expression of HOXA1 leads to a decrease in DNA methylation level). Our study demonstrated that HOXA1 is highly expressed in HNSCC, which may be an independent prognostic factor in TCGA-HNSC patients, especially for oropharyngeal cancer patients. At present, HOXA1 small interfering RNA (siRNA) nanoparticles have achieved initial success in mouse models of breast cancer and are effective (75%) to reduce the incidence of tumors (Brock et al., 2014). More random cohort studies and mechanism experiments will help confirm the regulatory effects of HOXA1 on HNSCC.
Data Availability Statement
Publicly available datasets were analyzed in this study. This data can be found here: https://portal.gdc.cancer.gov/repository.
Ethics Statement
The studies involving human participants were reviewed and approved by Clinical Research Ethics Committee of The First Affiliated Hospital of Bengbu Medical College. The patients/participants provided their written informed consent to participate in this study.
Author Contributions
The project was proposed by HL and SM. HL provided paraffin tissue sections and wrote the manuscript. MW assisted in editing the manuscript. JZ downloaded and mined the relevant data of TCGA. XW and MZ did immunohistochemistry and assisted in organizing data. All authors contributed to the article and approved the submitted version.
Funding
This work was funded by the Anhui Provincial Key Research and Development Project (202004j07020007), Anhui Provincial Natural Science Foundation (1608085MH236), Key Project of Natural Science of Bengbu Medical College (BYKY2019086ZD), and Science Research Project of Bengbu Medical College (BYKF1855).
Conflict of Interest
The authors declare that the research was conducted in the absence of any commercial or financial relationships that could be construed as a potential conflict of interest.
Acknowledgments
Thanks to Zhaoyi Lu (Department of Otolaryngology-Head and Neck Surgery, Xiangya Hospital, Central South University) for suggestions on the manuscript.
Supplementary Material
The Supplementary Material for this article can be found online at: https://www.frontiersin.org/articles/10.3389/fmolb.2020.602068/full#supplementary-material
Supplementary Figure 1. Kaplan-Meier survival analysis of (A) overall survival and (B) disease free survival) according to the expression of all HOX genes in TCGA-HNSC patients. The log-rank test was used to calculate the p-value.
Supplementary Material 1. CIBERSORT results of the fraction of twenty-two immune cell types of each TCGA-HNSC sample.
Supplementary Material 2. Clinicopathological characteristics of 52 HNSCC patients collected from The First Affiliated Hospital of Bengbu Medical College.
Supplementary Material 3. Results of differential expression analysis in all HOX genes.
References
Abe, M., Hamada, J.-I., Takahashi, O., Takahashi, Y., Tada, M., Miyamoto, M., et al. (2006). Disordered expression of HOX genes in human non-small cell lung cancer. Oncol. Rep. 15, 797–802. doi: 10.3892/or.15.4.797
Alexander, T., Nolte, C., and Krumlauf, R. (2009). Hox genes and segmentation of the hindbrain and axial skeleton. Annu. Rev. Cell Dev. Biol. 25, 431–456. doi: 10.1146/annurev.cellbio.042308.113423
Amit, M., Takahashi, H., Dragomir, M. P., Lindemann, A., Gleber-Netto, F. O., Pickering, C. R., et al. (2020). Loss of p53 drives neuron reprogramming in head and neck cancer. Nature 578, 449–454. doi: 10.1038/s41586-020-1996-3
Bitu, C. C., Destro MFd, S. S., Carrera, M., da Silva, S. D., Graner, E., Kowalski, L. P., et al. (2012). HOXA1 is overexpressed in oral squamous cell carcinomas and its expression is correlated with poor prognosis. BMC Cancer 12:146. doi: 10.1186/1471-2407-12-146
Bray, F., Ferlay, J., Soerjomataram, I., Siegel, R. L., Torre, L. A., and Jemal, A. (2018). Global cancer statistics 2018: GLOBOCAN estimates of incidence and mortality worldwide for 36 cancers in 185 countries. CA Cancer J. Clin. 68, 394–424. doi: 10.3322/caac.21492
Brock, A., Krause, S., Li, H., Kowalski, M., Goldberg, M. S., Collins, J. J., et al. (2014). Silencing HoxA1 by intraductal injection of siRNA lipidoid nanoparticles prevents mammary tumor progression in mice. Sci. Transl. Med. 6:217ra2. doi: 10.1126/scitranslmed.3007048
Calvo, R., West, J., Franklin, W., Erickson, P., Bemis, L., Li, E., et al. (2000). Altered HOX and WNT7A expression in human lung cancer. Proc. Natl. Acad. Sci. U.S.A. 97, 12776–12781. doi: 10.1073/pnas.97.23.12776
Cancer Genome Atlas Network (2015). Comprehensive genomic characterization of head and neck squamous cell carcinomas. Nature 517, 576–582. doi: 10.1038/nature14129
Chaturvedi, A. K., Engels, E. A., Pfeiffer, R. M., Hernandez, B. Y., Xiao, W., Kim, E., et al. (2011). Human papillomavirus and rising oropharyngeal cancer incidence in the United States. J. Clin. Oncol. 29, 4294–4301. doi: 10.1200/JCO.2011.36.4596
Chen, S.-L., Qin, Z.-Y., Hu, F., Wang, Y., Dai, Y.-J., and Liang, Y. (2019). The role of the gene family in acute myeloid leukemia. Genes 10:621. doi: 10.3390/genes10080621
Cho, H.-S., Toyokawa, G., Daigo, Y., Hayami, S., Masuda, K., Ikawa, N., et al. (2012). The JmjC domain-containing histone demethylase KDM3A is a positive regulator of the G1/S transition in cancer cells via transcriptional regulation of the HOXA1 gene. Int. J. Cancer 131, E179–E189. doi: 10.1002/ijc.26501
Economides, K. D., and Capecchi, M. R. (2003). Hoxb13 is required for normal differentiation and secretory function of the ventral prostate. Development 130, 2061–2069. doi: 10.1242/dev.00432
Fagerberg, L., Hallström, B. M., Oksvold, P., Kampf, C., Djureinovic, D., Odeberg, J., et al. (2014). Analysis of the human tissue-specific expression by genome-wide integration of transcriptomics and antibody-based proteomics. Mol. Cell. Proteomics MCP 13, 397–406. doi: 10.1074/mcp.M113.035600
Gavalas, A., Trainor, P., Ariza-McNaughton, L., and Krumlauf, R. (2001). Synergy between Hoxa1 and Hoxb1: the relationship between arch patterning and the generation of cranial neural crest. Development 128, 3017–3027.
Hakami, F., Darda, L., Stafford, P., Woll, P., Lambert, D. W., and Hunter, K. D. (2014). The roles of HOXD10 in the development and progression of head and neck squamous cell carcinoma (HNSCC). Br. J. Cancer 111, 807–816. doi: 10.1038/bjc.2014.372
Hänzelmann, S., Castelo, R., and Guinney, J. (2013). GSVA: gene set variation analysis for microarray and RNA-seq data. BMC Bioinformatics 14:7. doi: 10.1186/1471-2105-14-7
Hofsli, E., Thommesen, L., Yadetie, F., Langaas, M., Kusnierczyk, W., Falkmer, U., et al. (2005). Identification of novel growth factor-responsive genes in neuroendocrine gastrointestinal tumour cells. Br. J. Cancer 92, 1506–1516. doi: 10.1038/sj.bjc.6602535
Keith, B., Johnson, R. S., and Simon, M. C. (2011). HIF1α and HIF2α: sibling rivalry in hypoxic tumour growth and progression. Nat. Rev. Cancer 12, 9–22. doi: 10.1038/nrc3183
Lambert, B., Vandeputte, J., Remacle, S., Bergiers, I., Simonis, N., Twizere, J.-C., et al. (2012). Protein interactions of the transcription factor Hoxa1. BMC Dev. Biol. 12:29. doi: 10.1186/1471-213X-12-29
Li, J., Ye, M., and Zhou, C. (2020). Expression profile and prognostic values of family members in laryngeal squamous cell cancer. Front. Oncol. 10:368. doi: 10.3389/fonc.2020.00368
Li, X., Pang, L., Yang, Z., Liu, J., Li, W., and Wang, D. (2019). LncRNA HOTAIRM1/HOXA1 axis promotes cell proliferation, migration and invasion in endometrial cancer. Onco. Targets. Ther. 12, 10997–11015. doi: 10.2147/OTT.S222334
Liu, J., Liu, J., and Lu, X. (2019). HOXA1 upregulation is associated with poor prognosis and tumor progression in breast cancer. Exp. Ther. Med. 17, 1896–1902. doi: 10.3892/etm.2018.7145
Lyv, X., Wu, F., Zhang, H., Lu, J., Wang, L., and Ma, Y. (2020). Long noncoding RNA ZFPM2-AS1 knockdown restrains the development of retinoblastoma by modulating the microRNA-515/HOXA1/Wnt/β-catenin axis. Invest. Ophthalmol. Vis. Sci. 61:41. doi: 10.1167/iovs.61.6.41
Magnon, C., Hall, S. J., Lin, J., Xue, X., Gerber, L., Freedland, S. J., et al. (2013). Autonomic nerve development contributes to prostate cancer progression. Science 341:1236361. doi: 10.1126/science.1236361
Mohankumar, K. M., Perry, J. K., Kannan, N., Kohno, K., Gluckman, P. D., Emerald, B. S., et al. (2008). Transcriptional activation of signal transducer and activator of transcription (STAT) 3 and STAT5B partially mediate homeobox A1-stimulated oncogenic transformation of the immortalized human mammary epithelial cell. Endocrinology 149, 2219–2229. doi: 10.1210/en.2007-1320
Mohankumar, K. M., Xu, X. Q., Zhu, T., Kannan, N., Miller, L. D., Liu, E. T., et al. (2007). HOXA1-stimulated oncogenicity is mediated by selective upregulation of components of the p44/42 MAP kinase pathway in human mammary carcinoma cells. Oncogene 26, 3998–4008. doi: 10.1038/sj.onc.1210180
Noman, M. Z., Buart, S., Romero, P., Ketari, S., Janji, B., Mari, B., et al. (2012). Hypoxia-inducible miR-210 regulates the susceptibility of tumor cells to lysis by cytotoxic T cells. Cancer Res. 72, 4629–4641. doi: 10.1158/0008-5472.CAN-12-1383
Ohuchida, K., Mizumoto, K., Lin, C., Yamaguchi, H., Ohtsuka, T., Sato, N., et al. (2012). MicroRNA-10a is overexpressed in human pancreatic cancer and involved in its invasiveness partially via suppression of the HOXA1 gene. Ann. Surg. Oncol. 19, 2394–2402. doi: 10.1245/s10434-012-2252-3
Park, S. Y., Kwon, H. J., Choi, Y., Lee, H. E., Kim, S.-W., Kim, J. H., et al. (2012). Distinct patterns of promoter CpG island methylation of breast cancer subtypes are associated with stem cell phenotypes. Modern Pathol. 25, 185–196. doi: 10.1038/modpathol.2011.160
Pilato, B., Pinto, R., De Summa, S., Lambo, R., Paradiso, A., and Tommasi, S. (2013). HOX gene methylation status analysis in patients with hereditary breast cancer. J. Hum. Genet. 58, 51–53. doi: 10.1038/jhg.2012.118
Shah, N., and Sukumar, S. (2010). The Hox genes and their roles in oncogenesis. Nat. Rev. Cancer 10, 361–371. doi: 10.1038/nrc2826
Subramanian, A., Tamayo, P., Mootha, V. K., Mukherjee, S., Ebert, B. L., Gillette, M. A., et al. (2005). Gene set enrichment analysis: a knowledge-based approach for interpreting genome-wide expression profiles. Proc. Natl. Acad. Sci. U.S.A. 102, 15545–15550. doi: 10.1073/pnas.0506580102
Taminiau, A., Draime, A., Tys, J., Lambert, B., Vandeputte, J., Nguyen, N., et al. (2016). HOXA1 binds RBCK1/HOIL-1 and TRAF2 and modulates the TNF/NF-κB pathway in a transcription-independent manner. Nucleic Acids Res. 44, 7331–7349. doi: 10.1093/nar/gkw606
Venkataramani, V., Tanev, D. I., Strahle, C., Studier-Fischer, A., Fankhauser, L., Kessler, T., et al. (2019). Glutamatergic synaptic input to glioma cells drives brain tumour progression. Nature 573, 532–538. doi: 10.1038/s41586-019-1564-x
Wang, H., Liu, G., Shen, D., Ye, H., Huang, J., Jiao, L., et al. (2015). HOXA1 enhances the cell proliferation, invasion and metastasis of prostate cancer cells. Oncol. Rep. 34, 1203–1210. doi: 10.3892/or.2015.4085
Wang, Z., Dahiya, S., Provencher, H., Muir, B., Carney, E., Coser, K., et al. (2007). The prognostic biomarkers HOXB13, IL17BR, and CHDH are regulated by estrogen in breast cancer. Clin. Cancer Res. 13, 6327–6334. doi: 10.1158/1078-0432.CCR-07-0310
Wardwell-Ozgo, J., Dogruluk, T., Gifford, A., Zhang, Y., Heffernan, T. P., van Doorn, R., et al. (2014). HOXA1 drives melanoma tumor growth and metastasis and elicits an invasion gene expression signature that prognosticates clinical outcome. Oncogene 33, 1017–1026. doi: 10.1038/onc.2013.30
Xiao, F., Bai, Y., Chen, Z., Li, Y., Luo, L., Huang, J., et al. (2014). Downregulation of HOXA1 gene affects small cell lung cancer cell survival and chemoresistance under the regulation of miR-100. Eur. J. Cancer 50, 1541–1554. doi: 10.1016/j.ejca.2014.01.024
Yuan, C., Zhu, X., Han, Y., Song, C., Liu, C., Lu, S., et al. (2016). Elevated HOXA1 expression correlates with accelerated tumor cell proliferation and poor prognosis in gastric cancer partly via cyclin D1. J. Exp. Clin. Cancer Res. 35:15. doi: 10.1186/s13046-016-0294-2
Zha, T.-Z., Hu, B.-S., Yu, H.-F., Tan, Y.-F., Zhang, Y., and Zhang, K. (2012). Overexpression of HOXA1 correlates with poor prognosis in patients with hepatocellular carcinoma. Tumour Biol. 33, 2125–2134. doi: 10.1007/s13277-012-0472-6
Zhang, X., Emerald, B. S., Mukhina, S., Mohankumar, K. M., Kraemer, A., Yap, A. S., et al. (2006). HOXA1 is required for E-cadherin-dependent anchorage-independent survival of human mammary carcinoma cells. J. Biol. Chem. 281, 6471–6481. doi: 10.1074/jbc.M512666200
Zhang, Y., Li, X.-J., He, R.-Q., Wang, X., Zhang, T.-T., Qin, Y., et al. (2018). Upregulation of HOXA1 promotes tumorigenesis and development of non-small cell lung cancer: a comprehensive investigation based on reverse transcription-quantitative polymerase chain reaction and bioinformatics analysis. Int. J. Oncol. 53, 73–86. doi: 10.3892/ijo.2018.4372
Keywords: hox genes, homeobox A1, head and neck squamous cell carcinoma, perineural invasion, prognosis, biomarker, tumor
Citation: Li H, Wang X, Zhang M, Wang M, Zhang J and Ma S (2021) Identification of HOXA1 as a Novel Biomarker in Prognosis of Head and Neck Squamous Cell Carcinoma. Front. Mol. Biosci. 7:602068. doi: 10.3389/fmolb.2020.602068
Received: 02 September 2020; Accepted: 12 November 2020;
Published: 08 March 2021.
Edited by:
Satyendra Chandra Tripathi, All India Institute of Medical Sciences Nagpur, IndiaReviewed by:
José Manuel Lopes, Universidade Do Porto, PortugalAjay Dixit, University of Minnesota Twin Cities, United States
Bin Zhao, Xiamen University, China
Copyright © 2021 Li, Wang, Zhang, Wang, Zhang and Ma. This is an open-access article distributed under the terms of the Creative Commons Attribution License (CC BY). The use, distribution or reproduction in other forums is permitted, provided the original author(s) and the copyright owner(s) are credited and that the original publication in this journal is cited, in accordance with accepted academic practice. No use, distribution or reproduction is permitted which does not comply with these terms.
*Correspondence: Shiyin Ma, mashiyinent@sina.com