 Orphélie Lootens1,2,3*
 Marthe De Boevre1,3*
 Elke Gasthuys2
 Jan Van Bocxlaer2
 An Vermeulen2†
 Sarah De Saeger1,3,4†
- 1Department of Bioanalysis, Centre of Excellence in Mycotoxicology and Public Health, Ghent University, Ghent, Belgium
- 2Department of Bioanalysis, Laboratory of Medical Biochemistry and Clinical Analysis, Ghent University, Ghent, Belgium
- 3MYTOX-SOUTH®, International Thematic Network, Ghent, Belgium
- 4Department of Biotechnology and Food Technology, University of Johannesburg, Johannesburg, Gauteng, South Africa
Mycotoxins, fungal secondary metabolites, are ubiquitously present in food commodities. Acute exposure to high levels or chronic exposure to low levels has an impact on the human body. The phase I metabolism in the human liver, performed by cytochrome P450 (CYP450) enzymes, is accountable for more than 80% of the overall metabolism of exogenous and endogenous compounds. Mycotoxins are (partially) metabolized by CYP450 enzymes. In this study, in vitro research was performed on CYP450 probes and aflatoxin B1 (AFB1), a carcinogenic mycotoxin, to obtain pharmacokinetic data on AFB1, required for further experimental work. The CYP450 probes of choice were a CYP3A4 substrate, midazolam (MDZ) and a CYP1A2 substrate, phenacetin (PH) since these are the main metabolizing phase I enzymes of AFB1. Linearity experiments were performed on the three substrates indicating that linear conditions were achieved at a microsomal protein concentration and incubation time of 0.25 mg/ml and 5 min, 0.50 mg/ml and 20 min and 0.25 mg/ml and 5 min for MDZ, PH and AFB1, respectively. The Km was determined in human liver microsomes and was estimated at 2.15 μM for MDZ, 40.0 μM for PH and 40.9 μM for AFB1. The associated Vmax values were 956 pmol/(mg.min) (MDZ), 856 pmol/(mg.min) (PH) and 11,536 pmol/(mg.min) (AFB1). Recombinant CYP systems were used to determine CYP450-specific Michaelis–Menten values for AFB1, leading to a CYP3A4 Km of 49.6 μM and an intersystem extrapolation factor (ISEF) corrected Vmax of 43.6 pmol/min/pmol P450 and a CYP1A2 Km of 58.2 μM and an ISEF corrected Vmax of 283 pmol/min/pmol P450. An activity adjustment factor (AAF) was calculated to account for differences between microsome batches and was used as a correction factor in the determination of the human in vivo hepatic clearance for MDZ, PH and AFB1. The hepatic blood clearance corrected for the AAF CLH,B,MDZ,AAF, CLH,B,PH,AAF CLH,B,AFB1,AAF(CYP3A4) and CLH,B,AFB1,AAF(CYP1A2) were determined in HLM at 44.1 L/h, 21.7 L/h, 40.0 L/h and 38.5 L/h. Finally, inhibition assays in HLM showed that 45% of the AFB1 metabolism was performed by CYP3A4/3A5 enzymes and 49% by CYP1A2 enzymes.
Introduction
Mycotoxins are secondary metabolites produced by fungi. Mycotoxin contamination is a global food safety issue leading to major public health concerns. Mycotoxins are observed on food crops such as maize, wheat, sorghum and peanuts (Eskola et al., 2019). They are produced by fungi as a self-protection mechanism during stressful conditions, and can be toxic to humans and animals, causing illness, or even death (Bennett and Klich, 2003; Kamala et al., 2018; Pleadin et al., 2019). Fungi are able to produce multiple mycotoxins, which leads to the co-existence of a great number of metabolites leading to agonistic or even synergistic effects, causing (co)-morbidities and pathologies (Sobral et al., 2018). Aflatoxin B1 (AFB1) is a human carcinogenic mycotoxin produced by Aspergillus flavus and Aspergillus parasiticus. Cancer, hepatotoxicity and immunosuppression are linked to AFB1 (IARC, 2002; Rotimi et al., 2019; Claeys et al., 2020). The exposure to these food contaminants is often chronic and substantial, depending on the region of the world. High levels of contamination occur in regions where no strict regulations for mycotoxins are applied or where awareness is lacking, e.g., on the African continent (Kebede et al., 2020). Repeated exposure to multiple mycotoxins not only has an impact on public health in general, but could more specifically also lead to interactions with other xenobiotic substances – such as medicinal drugs – in the body by altering their pharmacokinetics (PK) and/or pharmacodynamics (PD). In order to get insight in these food contaminants and their interactions with medicinal drugs, knowledge of their PK is required.
Metabolism occurs in different parts of the human body, though mainly by hepatic enzymes, and is divided in phase I (oxidation, hydrolysis and reduction), predominantly through the action of cytochrome P450 (CYP450) enzymes (Zhou et al., 2009), and phase II (conjugation) reactions (Jancova et al., 2010). Considering all enzymes, the CYP450 complex is an important group involved in phase I metabolism, mainly found in liver and gut. It is the most relevant enzyme family to consider in view of its predominant role in drug metabolism since it is involved in approximately 80% of all drug metabolism processes, as well as in the metabolism of endogenic compounds (Hannemann et al., 2007). Aflatoxins (AFs) are metabolized via CYP450 to different metabolites such as aflatoxin M1 (AFM1), aflatoxin Q1 (AFQ1), aflatoxin-exo-8,9-epoxide and aflatoxin-endo-8,9-epoxide (AFBO) (Ivanova et al., 2019). CYP1A2, CYP3A4, CYP2A13 and CYP3A5 are involved in AFB1’s metabolism (Gallagher et al., 1996; Bbosa et al., 2013). Having insight into ‘what the body does to the compound’ is important to have an idea on potential interactions and is also necessary to understand what effects the compound will have in the body. Different types of metabolic interactions are possible, potentially leading to higher or lower effects of the co-administered drugs. The measurement of enzyme activities and the determination of how the metabolic rate changes in the presence of enzyme inhibitors or inducers is important in drug development, additionally to detect possible interactions. Insight in these parameters is not only crucial for drug compounds but also for other compounds such as food contaminants. Drug–drug interactions are imperative when bringing new compounds to the market, but it is also crucial to check for interactions with other substances such as food-contaminants to which one is exposed on a daily basis. In addition, variability in expression and activity of CYP450 enzymes is known to occur in humans and animals, mostly due to genetic polymorphisms (Tracy et al., 2016). But also, factors such as age, gender, ethnicity and health status can have an impact on CYP450 enzyme expression and activity (Yang et al., 2010). Clearly, covering these interplaying effects requires in-depth starting knowledge of in vitro data.
This is the first detailed report of PK parameters of AFB1 studied via in vitro research in human liver microsomes (HLMs) and recombinant systems (rhCYPs) using liquid chromatography tandem mass spectrometry (LC–MS/MS). Furthermore, the PK parameters of CYP450 probe substrates were determined to avoid interlaboratory differences and to confirm the applied in vitro methods by comparing our results to literature data.
Materials and methods
Linearity experiments and Km, Vmax determination
Chemicals and reagents
Dipotassium hydrogen phosphate, potassium dihydrogen phosphate, and KCl were purchased from VWR (Oud-Heverlee, Belgium). Acetonitrile (ACN) was purchased from Biosolve B.V. (Valkenswaard, The Netherlands), and formic acid (FA) from Merck (Darmstadt, Germany). Trifuoroacetic acid (TFA) was purchased from Fluka Chemicals (Buchs, Switzerland). Ethyl acetate was purchased from Acros (New Jersey, United States). Water was from a Ultrapure water system (Sartorius, Goettingen, Germany). LC–MS grade methanol and glacial acetic acid were purchased from Biosolve B.V. (Valkenswaard, The Netherlands). Ammonium acetate was from Merck (Darmstadt, Germany). Midazolam (MDZ) was purchased from Roche (Mannheim, Germany). Phenacetin (PH) and chlorpropamide (CHL) were purchased from Sigma Aldrich (St. Louis, MO, United States). Nicotinamide adenine dinucleotide phosphate tetrasodium (NADPH.4Na) was purchased from Gentaur (Kampenhout, Belgium) and stored at −20°C. The stock solutions of the probe substrates, the metabolites and the internal standard were prepared separately in methanol (MeOH) at a concentration of 1 mg/ml and stored at −20°C. HLMs (Corning® UltraPool™ HLM 150, Mixed Gender, 0.5 ml), for experimental use, were purchased from Corning (Woburn, United States), information on the preparation of the HLM can be found in the product description sheet. The HLM were stored at −80°C. AFB1 and zearalanone (ZAN) were purchased from Fermentek (Jerusalem, Israel). Supersomes human CYP3A4 + oxidoreductase (1,000 pmoL/mL) were purchased from Corning (Woburn, United States) and human CYP1A2 low reductase (LR) EasyCYP bactosomes (1,000 pmoL/mL) were purchased from Tebu-Bio (Boechout, Belgium) and stored at −80°C. Ketoconazole (CYP3A4 inhibitor) and α-naphthoflavone (CYP1A2 inhibitor) were purchased from Sigma Aldrich (St. Louis, MO, United States) and stored at 4°C. All chemicals and reagents were of analytical grade. SimCYP (Certara©) was used for the prediction of certain PK parameters.
Preparation of standard and work solutions (linearity experiments)
Stock solutions of MDZ, PH, AFB1, ZAN and CHL at a concentration of 1 mg/ml were prepared in MeOH and stored at −20°C (AFB1 at 4°C). Work solutions of MDZ, PH and AFB1 were made in Ultrapure water at a concentration of 5 μM, 20 μM and 5 μM, respectively. MDZ was used as a CYP3A4 probe substrate, PH as a CYP1A2 probe substrate to include the two main metabolizing CYP450 enzymes in the metabolism of AFB1 (Gallagher et al., 1996; Bbosa et al., 2013). Phosphate buffer of 0.2 M and pH of 7.4 was made and frozen at −20°C in 60 ml tubes. NADPH.4Na was freshly made every experimental day at a concentration of 5 mM in phosphate buffer (pH 7.4). A 1.15% KCl solution was made in HPLC grade water and stored at 4°C. HLM (20 mg/ml in 250 mM sucrose) were diluted in 1.15% KCl to achieve a final protein concentration of 0.1; 0.25; 0.5; 0.75 and 1 mg/ml in the samples. The stop reagent was made with 300 μl FA, 5,500 μl ACN and Ultrapure water and contained the internal standards (IS; 0.072 μM of CHL and 0.12 μg/ml of ZAN).
Microsomal incubation and sample clean-up (linearity experiments)
Samples were prepared partially based on Schelstraete et al. (2019a,b). Centrifugal Eppendorf cups were filled with 50 μl substrate solution (i.e., 5 μM for MDZ and AFB1 and 20 μM for PH), 50 μl 1.15% KCl and 50 μl 0.2 M phosphate buffer. Next, 50 μl of a freshly prepared NADPH.4Na solution was added. After an incubation of 3 min, 50 μl of diluted HLM was added and they were placed back on the thermoshaker TS-100 (Biosan, Geraardsbergen, Belgium) with a rotation speed of 300 rpm and at a temperature of 37°C. After the indicated time (i.e., 5, 10, 20, 30 and 45 min), 25 μl of an ice cold stop reagent with IS, i.e., CHL for CYP probes and ZAN for AFB1, was added. For protein precipitation, 125 μl of TFA was added. Samples were centrifuged at 16,000×g for 20 min at 4°C. The centrifugal filters were discarded and the supernatant was added to 1 ml of a 0.2 M phosphate buffer. Next, 7 ml of ethyl acetate was added in order to perform a liquid–liquid extraction (LLE). Samples were extracted during 20 min on an Agitelec shaker at room temperature. For phase separation, samples were centrifuged at 2,000× g for 10 min. Subsequently, the organic phase was transferred in glass tubes and evaporated under a gentle nitrogen stream at 40°C (±5°C) using a Turbovap (Biotage, Charlotte, United States). After evaporation, samples were kept at −20°C until further analysis. Upon analysis, 250 μl of a 60/40 mobile phase A (MP A; H2O/MeOH/acetic acid (94/5/1, v/v/v) + 5 mM ammonium acetate)/mobile phase B (MP B; H2O/MeOH/acetic acid (2/97/1, v/v/v) + 5 mM ammonium acetate) mixture was added. After thorough vortexing and centrifuging for 10 min at 1,000× g, the samples were transferred to an autosampler vial. An aliquot of 5 μl was injected into the ultrahigh performance liquid chromatography (UPLC) - XEVO TQ-S (LC–MS/MS) equipment using an in-house developed and validated method.
LC–MS/MS (linearity experiments)
A Waters Acquity class I UPLC system coupled to a XEVO TQ-S tandem quadrupole mass spectrometer (MS) from Waters (Milford, MA, United States) was used for the detection and quantification. A Charged Surface Hybrid (CSH) C18 column (1.7 μm 2.1 × 100 mm) with Guard column was used for chromatographic separation. The column temperature was set at 30°C; the sample temperature at 10°C. The MP was used at a flow rate of 0.250 ml/min following a gradient program (Table 1). The total duration for a single run was 12 min. The MS was operated in the electrospray positive mode (ESI+) with multiple reaction monitoring (MRM). The MRM parameters for the CYP probes and for AFB1, respectively, are given in Table 2. Source temperature and desolvation temperature were set at 130°C and 200°C. The cone gas flow was set at 150 L/h, the desolvation gas flow at 550 L/h. Data was processed using Masslynx® and Targetlynx® software from Micromass (Manchester, United Kingdom). Data analysis was performed by transferring Targetlynx® data to Microsoft Excel and Sigmaplot version 14.5. For AFB1, substrate depletion was measured. Nonlinear regression on sigmoidal plots where the initial depletion rate (kdep) was plotted against AFB1 concentrations on a linear-log plot, was performed using Excel Solver (Youdim and Dodia, 2010).
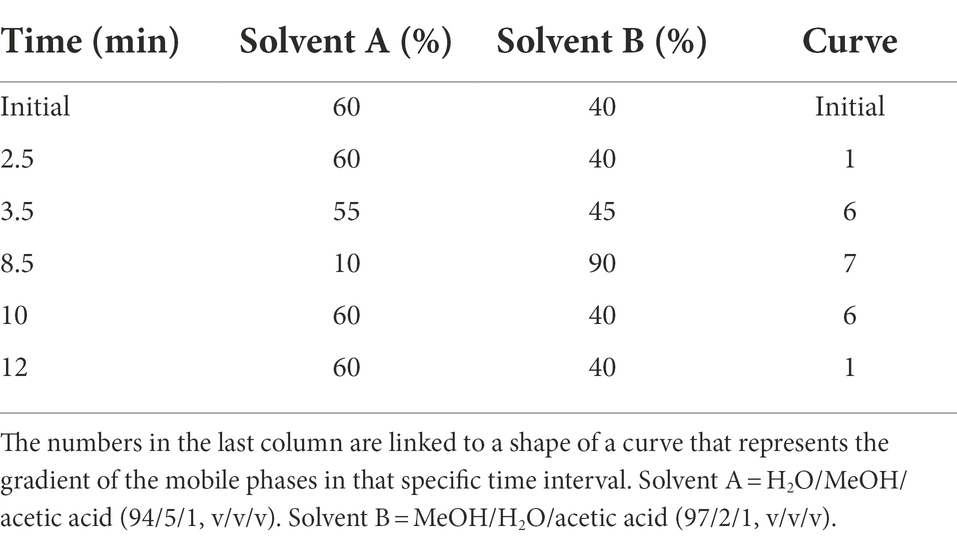
Table 1. Gradient program used for the liquid chromatography–tandem mass spectrometry (LC–MS/MS) at a constant flow rate of 0.25 ml/min.
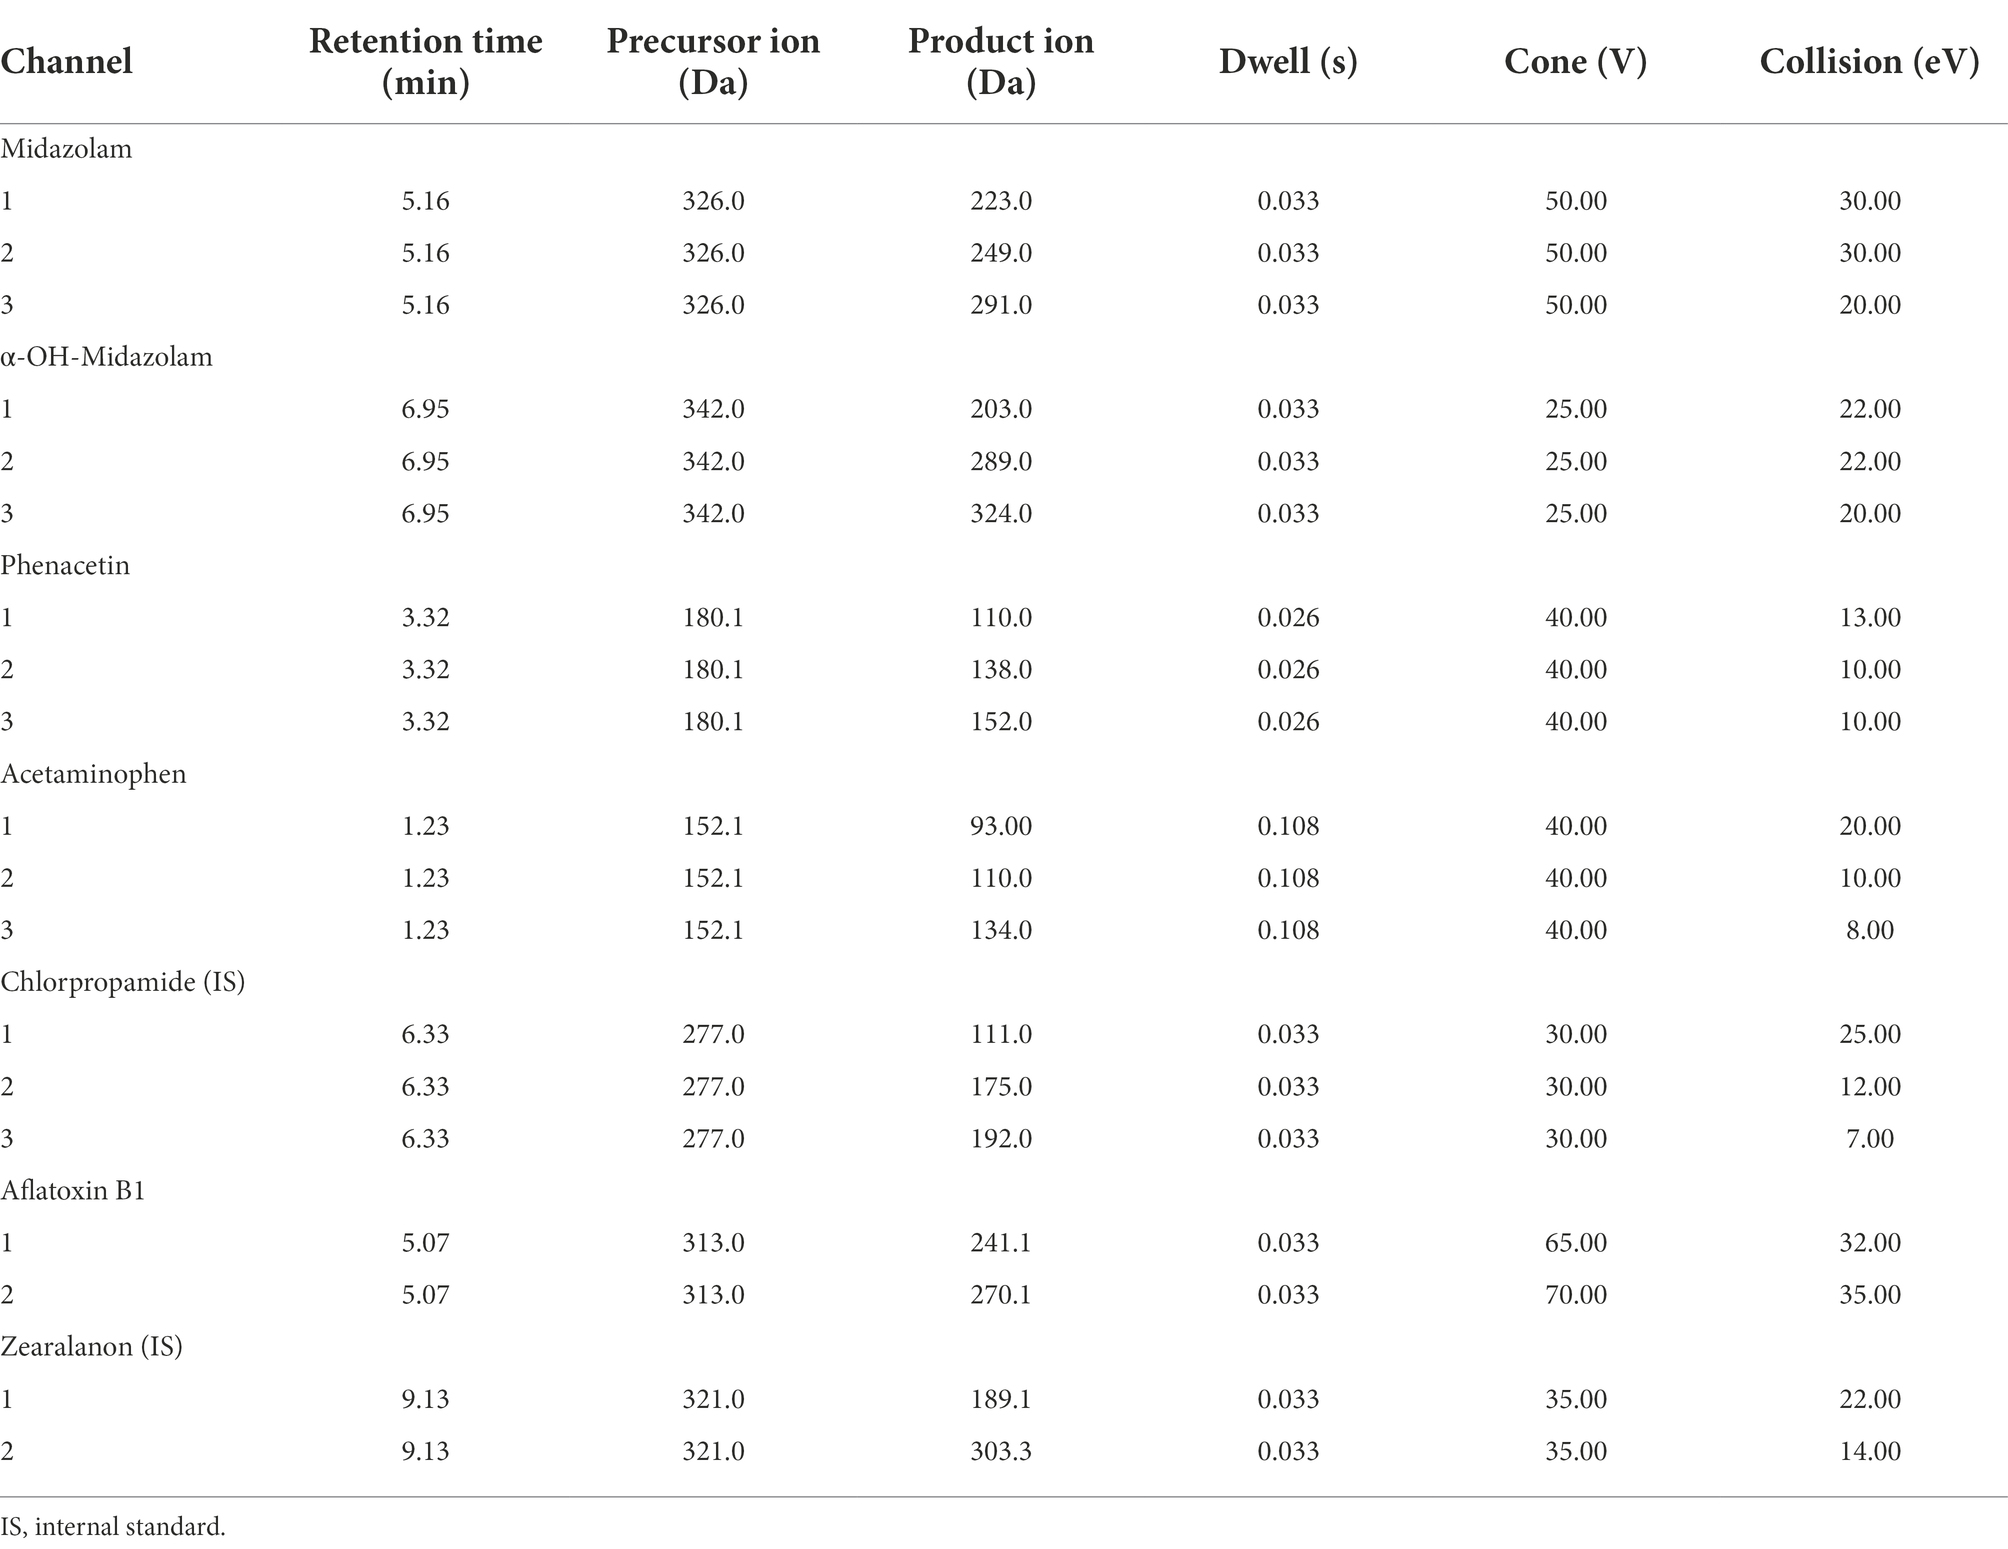
Table 2. Multiple reaction monitoring transitions and mass spectrometry settings for the CYP probes, aflatoxin B1 (AFB1) and internal standards used.
Preparation of standard and work solutions Km – Vmax-experiments in HLM and rhCYPs
The same stock solutions of MDZ, PH, CHL, AFB1 and ZAN were used at a concentration of 1 mg/ml in MeOH and stored at −20°C (apart from AFB1, which was stored at 4°C). Probe work solutions of MDZ were made in Ultrapure water to achieve sample concentrations in a range from 0.1 μM to 100 μM. For PH, sample concentrations ranged from 1 μM to 200 μM. Substrate work solutions of AFB1 were made to achieve sample concentrations from 0.5 μM to 50 μM, for the HLM experiments. For rhCYP an extra AFB1 sample concentration of 100 μM was implemented. HLM (20 mg/ml in 250 mM sucrose) were diluted in 1.15% KCl to achieve a final protein concentration of 0.25 and 0.5 mg/ml in the samples, as based on previous linearity experiments. The stop reagents were those described in 2.1.2.
Sample preparation and clean-up Km – Vmax-experiments in HLM and rhCYPs
Samples were treated as described in Section “Microsomal incubation and sample clean-up (linearity experiments),” but the HLM protein concentrations were 0.25 mg/ml for MDZ and 0.5 mg/ml for PH and AFB1. For CYP3A4 rhCYP experiments, 50 μl of diluted supersomes at 150 pmol/ml were used instead of HLM, achieving a final concentration of 30 pmol/ml. For CYP1A2 rhCYP experiments, 50 μl of diluted EasyCYP LR bactosomes at 50 pmol/ml were used, achieving a final concentration of 10 pmol/ml. The incubation time was 5 min for MDZ and AFB1 and 20 min for PH.
LC–MS/MS Km – Vmax-experiments in HLM and rhCYPs
The same equipment, settings and procedures were used as explained in Section “LC–MS/MS (linearity experiments).” Data analysis was performed by transferring Targetlynx® data to Microsoft® Excel. Metabolite formation velocity versus substrate concentration figures were plotted with error bars, Sigmaplot version 14.5 was used for determining the Michaelis–Menten constant (Km) and maximum velocity (Vmax) by performing nonlinear regression on the figures. For AFB1 substrate depletion was measured. Nonlinear regression on sigmoidal plots, where the initial depletion rate (kdep) was plotted against AFB1 concentrations on a linear-log plot, was performed using Excel Solver (Youdim and Dodia, 2010).
Applied formulas
The obtained Km and Vmax values of the CYP probes and AFB1 from HLM are used to calculate the intrinsic in vitro clearance (CLint, in vitro; Equation 1) and the in vivo intrinsic hepatic clearance rate (CLH,int; Equation 2) with the use of a microsomal protein per gram liver (MPPGL) of 40 mg/g and a liver weight (LW) of 1,650 g (Kazmi, 2015).
The free microsomal fraction (fu,mic) for AFB1 was estimated with the use of Equation 3 for neutral compounds.
The unbound in vivo intrinsic hepatic clearance rate (CLH,u,int) is calculated by dividing the CLH,int by the free microsomal fraction (fu,mic) as shown by Equation 4.
Next, the activity adjustment factor (AAF; T’jollyn et al., 2017) was calculated using the PK values of the probe substrates MDZ in the case of CYP3A4 and PH in the case of CYP1A2. For the estimation of the fu,mic Equation 5 was used where fu,2 equals fu,mic. The AAF (Equation 6) is obtained by dividing unbound in vivo CLint for a specific CYP450 enzyme (CLint,u,in vivo,CYP) by the unbound HLM CLint for a specific CYP450 enzyme (CLint,u,HLM,CYP).
The CLH,u,int is multiplied by the AAF, leading to an AAF corrected CLH,u,int (CLH,u,int,AAF). The obtained Km and Vmax values of the CYP probes from rhCYPs were used to calculate intersystem extrapolation factors (ISEFs) for both Vmax and CLint (Equations 7 and 8).
CLH,u,int,AAF values of AFB1 from rhCYP experiments were multiplied with the CLint ISEF, resulting in an ISEF corrected CLH,u,int,AAF (CLH,u,int,AAF,ISEF). The extrapolation to the whole liver hepatic blood clearance from HLM experiments is shown in Equation 9, assuming a human hepatic blood flow of 90 L/h (QH). Equation 10 presents the extrapolation to the whole liver hepatic blood clearance from rhCYP experiments. The hepatic blood clearance (CLH,B) was multiplied by the blood/plasma ratio (B:P) to obtain the whole liver hepatic plasma clearance, CLH,P.
Inhibition assay AFB1
Preparation of standard and work solutions inhibition assay AFB1
A 1 mg/ml solution in MeOH was prepared of ketoconazole, a selective CYP3A4 inhibitor, and α-naphthoflavone, a selective CYP1A2 inhibitor, used in inhibition assays as mentioned in guidelines from the European Medicines Agency and the Food and Drug Administration (Sai et al., 2000; EMA, 2012; Food and Drug Administration, 2020).
The same stock solutions of AFB1 and ZAN were used at a concentration of 1 mg/ml in MeOH (previously described) and stored at −20°C.
A substrate solution of AFB1 was made in Ultrapure water to obtain a final sample concentration of 5 μM. The ketoconazole stock solution was diluted with MeOH leading to a 50 μM solution. The α-naphthoflavone stock solution was diluted with MeOH to a 250 μM solution. Phosphate buffer of 0.2 M and a pH of 7.4 was made and frozen at −20°C in 60 ml tubes. NADPH.4Na was freshly prepared every experimental day at a concentration of 5 mM in phosphate buffer (pH 7.4). A 1.15% KCl solution was made in Ultrapure water and stored at 4°C. The HLM (20 mg/ml in 250 mM sucrose) were diluted in 1.15% KCl to achieve a final protein concentration of 0.5 mg/ml in the samples. The stop reagent is the same as described in Section “Chemicals and reagents.”
Sample preparation, clean-up and LC–MS/MS inhibition assays AFB1
Samples were prepared based on an in-house validated method (Schelstraete et al., 2019a,b). Briefly, centrifugal Eppendorf cups were filled with 50 μl of 5 mm NADPH.4Na, 50 μl 1.15% KCl and 50 μl 0.2 M phosphate buffer and put on a thermoshaker TS-100 (Biosan, Geraardsbergen, Belgium) with a rotation speed of 300 rpm and a temperature of 37°C. Next, 50 μl of a 2.5 mg/ml HLM suspension was added leading to a final concentration of 0.5 mg/ml in the sample. Next, 5 μl of an inhibitor in methanol was added, i.e., 50 μM of ketoconazole (CYP3A4 inhibitor) leading to a final concentration of 1 μM in the sample and 250 μM of α-naphthoflavone (CYP1A2 inhibitor) leading to a final concentration of 5 μM. The inhibitors were added in small volumes to minimize solvent effects (2%). After adding the inhibitor, the samples were equilibrated for 5 min. AFB1 was added in a volume of 50 μl and a concentration of 25 μM leading to a sample concentration of 5 μM. After incubating for 10 min, 25 μl of stop reagent with IS was added. Control samples were ran without inhibitors at a protein concentration of 0.5 mg/ml and incubation time of 10 minutes to be able to determine the inhibited fraction. Next, the cups were vortexed and put on ice. They were then stored at −20°C. The next day, a sample clean-up was performed. The sample clean up and sample preparation are similar as described previously in 2.1.3. An aliquot of 5 μl was injected into the LC–MS/MS using an in-house developed and validated method. The same equipment, settings and procedures were used as depicted in section “LC–MS/MS (linearity experiments).” Data analysis was performed by transferring Targetlynx data to Microsoft Excel.
Results
Determination of optimal incubation conditions, Km and Vmax for CYP probes and AFB1
Linearity experiments were performed in HLM to obtain data on the ideal incubation time and microsomal protein concentration for further determination of the Km and Vmax. The obtained results are shown in Figures 1A–C. A microsomal protein concentration of 0.25 mg/ml and an incubation time of 5 min were chosen for MDZ (Figure 1A, black arrow). For PH, the protein concentration was 0.5 mg/ml with a 20 min incubation time (Figure 1B, black arrow), while for AFB1, a microsomal protein concentration of 0.5 mg/ml and an incubation time of 5 min were chosen (Figure 1C, black arrow).
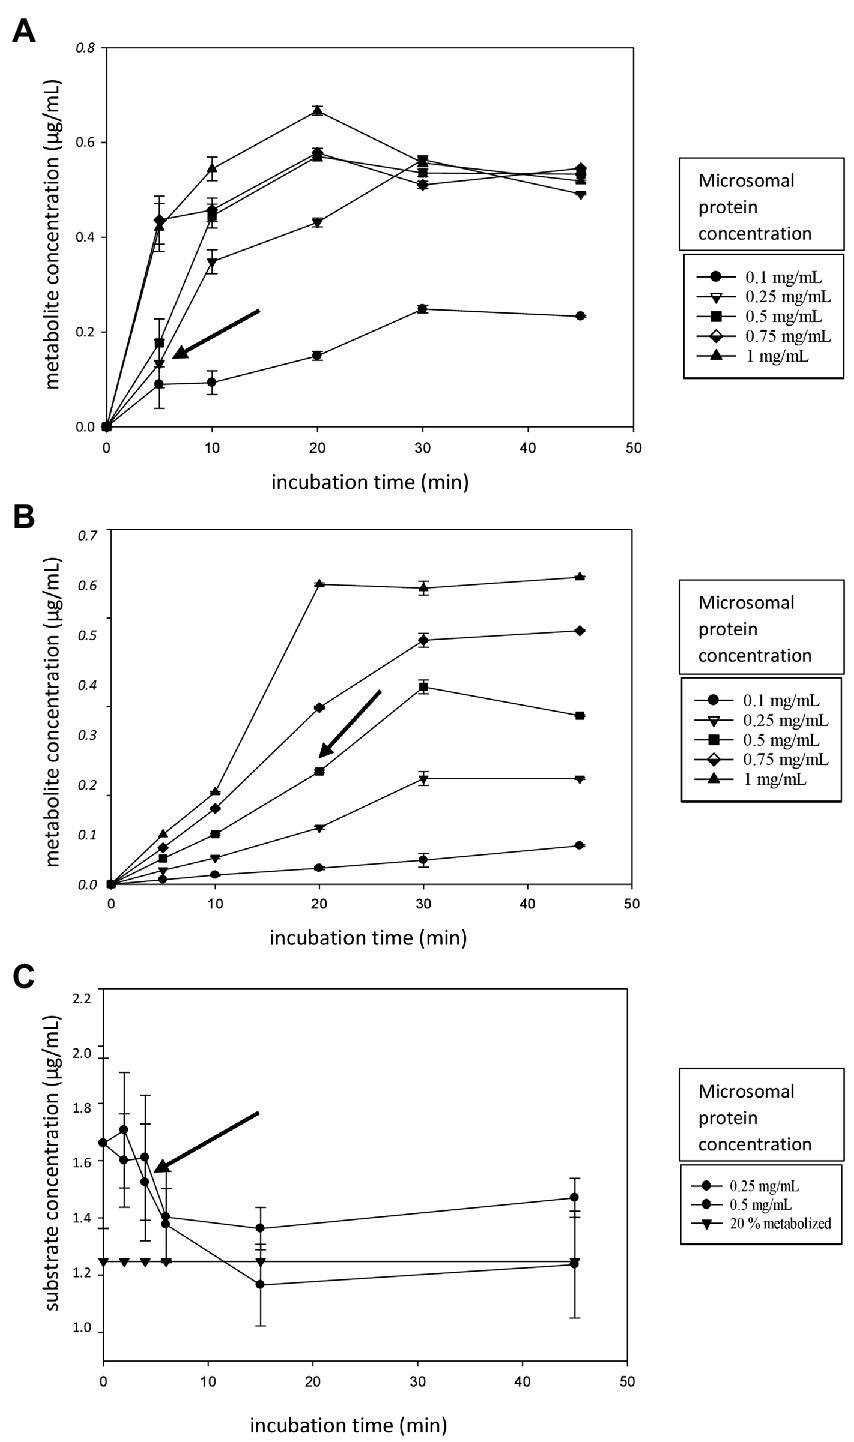
Figure 1. (A–C) Linearity experiment figures. (A) The metabolite formation of alpha-hydroxy-midazolam (α-OH-MDZ, A) and acetaminophen (B) over time (0–45 min) for different microsomal protein concentrations (0.10–1.0 mg/ml). (C) The AFB1 depletion over time (0–45 min) for different microsomal protein concentrations (0.25–0.50 mg/ml). The horizontal curve (black triangles) represents the 20% metabolite formation threshold. Incubations were performed in triplicate, error bars are displayed. The black arrow indicates the chosen microsomal protein concentration and incubation time.
Using the results of the linearity experiments, Km and Vmax experiments were performed in HLM. First, metabolite formation velocity versus substrate concentration Figures were plotted, followed by nonlinear regression to estimate the Vmax and associated Km values (Figures 2A–D). For AFB1, where substrate depletion was analyzed, kdep was determined for different substrate concentrations and was plotted against AFB1 substrate concentrations on a log-scale (Figure 2E; Youdim and Dodia, 2010). The Km and Vmax values obtained in HLM for AFB1 are summarized in Table 3.
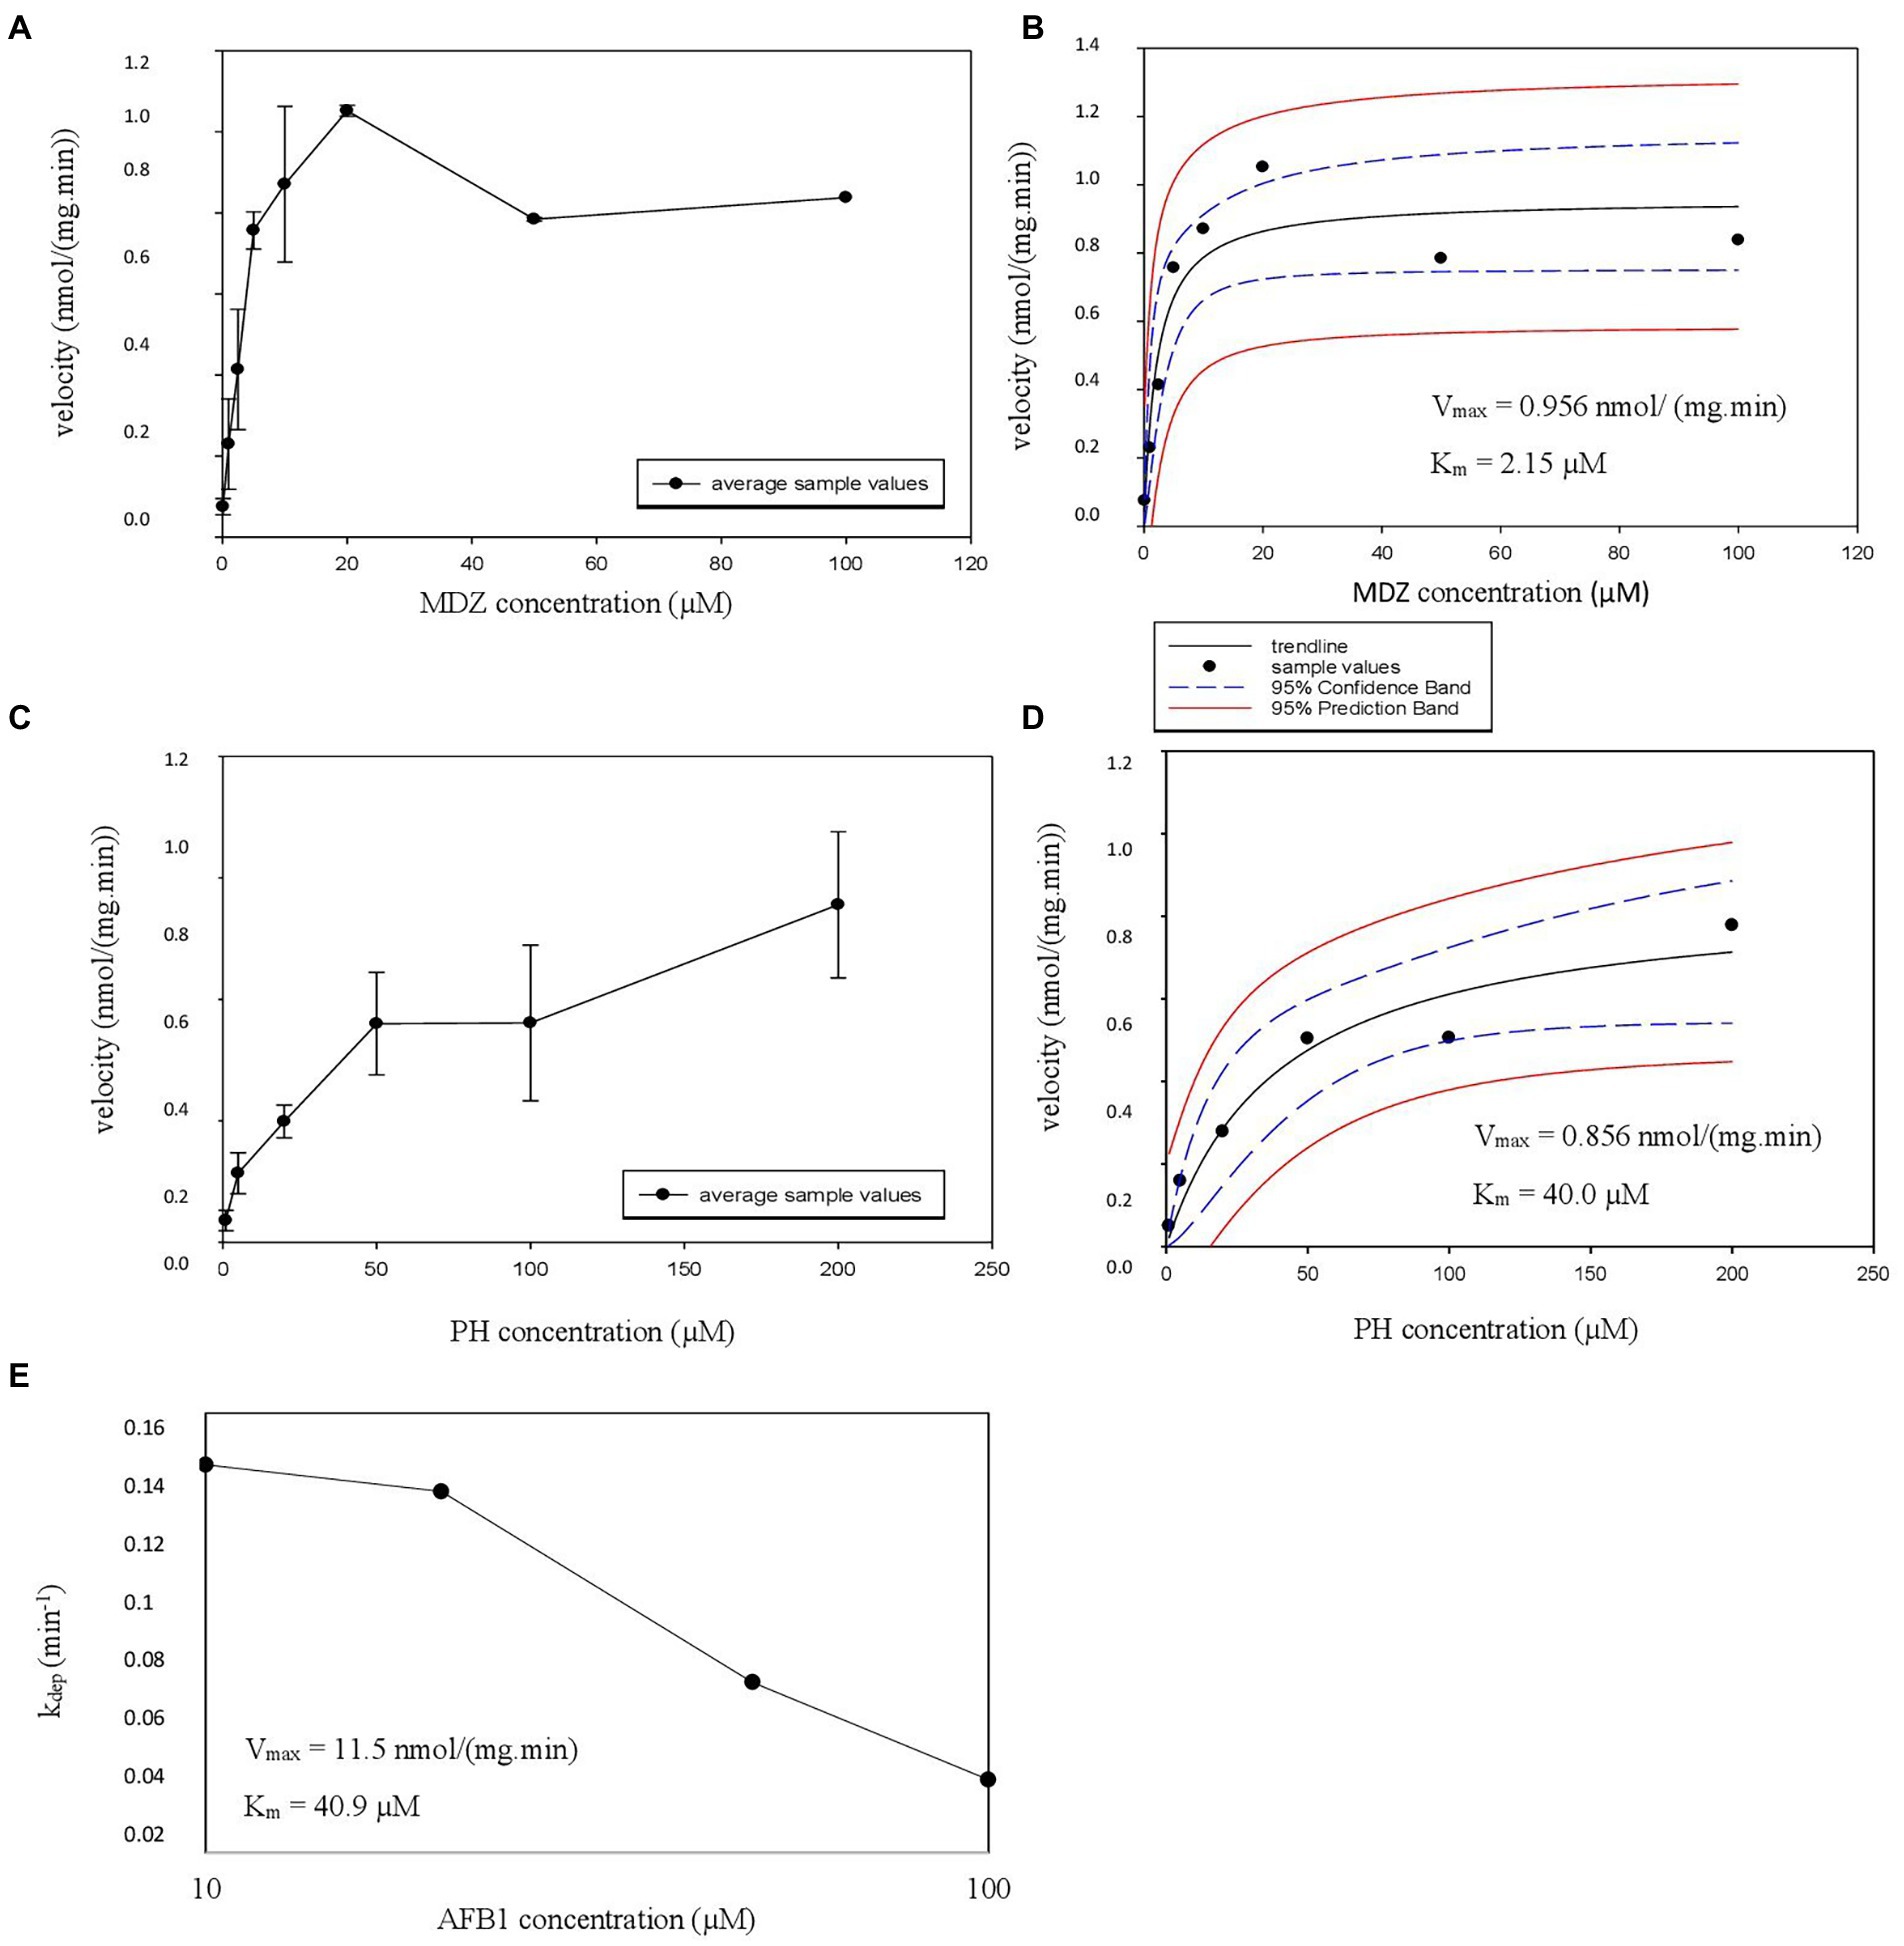
Figure 2. (A–E) Michaelis Menten constant (Km), estimated maximum velocity (Vmax) HLM experiment graphs. (A,C) The velocity as a function of the added CYP probe concentration is illustrated with error bars. The formation of hydroxy-midazolam (OH-MDZ) and acetaminophen (AC) is given from top to bottom. (B,D) The nonlinear regression Michaelis–Menten curves are given with the estimated Vmax and Km values, also from top to bottom in the same order, 95% confidence band and 95% prediction band are presented as well. (E) Represents the parent depletion of AFB1 where kdep is represented on the y-axis and aflatoxin B1 (AFB1) concentration on the x-axis with the estimated Vmax and Km values.
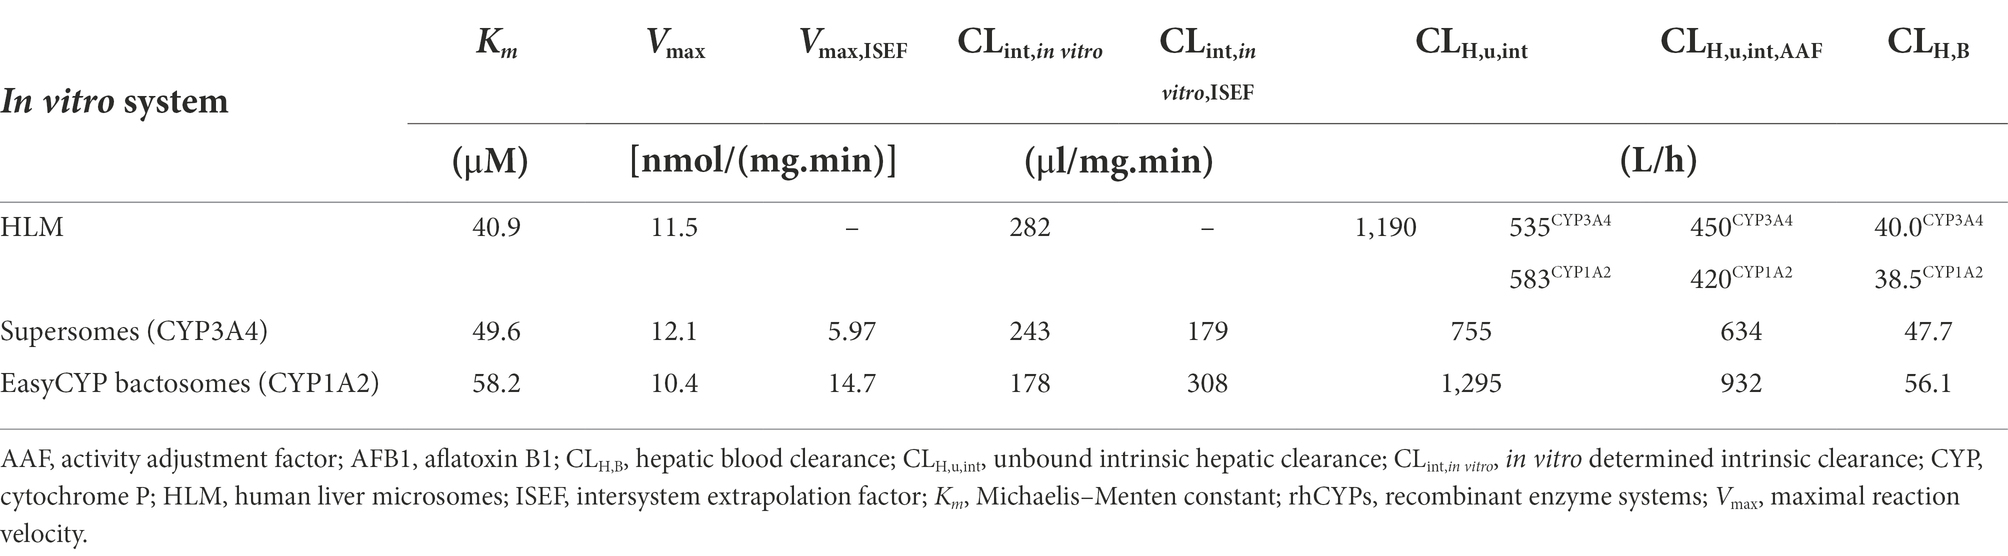
Table 3. Overview of the Km, Vmax, ISEF corrected Vmax, CLint,in vitro, ISEF corrected CLint,in vitro, CLH,u,int, AAF corrected CLH,u,int and CLH,B for all experiments concerning AFB1 both in HLM and in rhCYPs.
The CLint,in vitro,HLM (Equation 1) for CYP3A4 (midazolam 1′ hydroxylation), CYP1A2 (phenacetin O-dealkylation) and AFB1 (overall metabolism) were 445 μl/(min.mg), 21.4 μl/(min.mg), and 282 μl/(min.mg), respectively. An MPPGL and LW of 40 mg/g and 1,650 g (Equation 2) were used (Table 4) to calculate a hepatic intrinsic clearance as described in literature allowing direct comparison between literature results and the obtained experimental results. The obtained CLH,u,int (Equation 4) were 1,941 L/h (MDZ), 84.70 L/h (PH), and 1,190 L/h (AFB1). The CLH,u,int values need to be extrapolated to the whole liver hepatic clearance in vivo, taking into account the AAF (Equation 6), free fraction in blood (fu,B), the hepatic blood flow (QH) and in case of rhCYP systems, the ISEF (Equation 8). The formulas used for the extrapolation to the whole liver hepatic clearance are shown in Equation 9 for HLM experiments and in Equation 10 for rhCYP experiments. For AFB1, an fu,B of 0.16 was reported by Gilbert-Sandoval et al., 2020; the fu,mic (0.9399) was estimated with Equation 3 for neutral compounds using SimCYP. The resulting CLH,B are listed in Table 5.
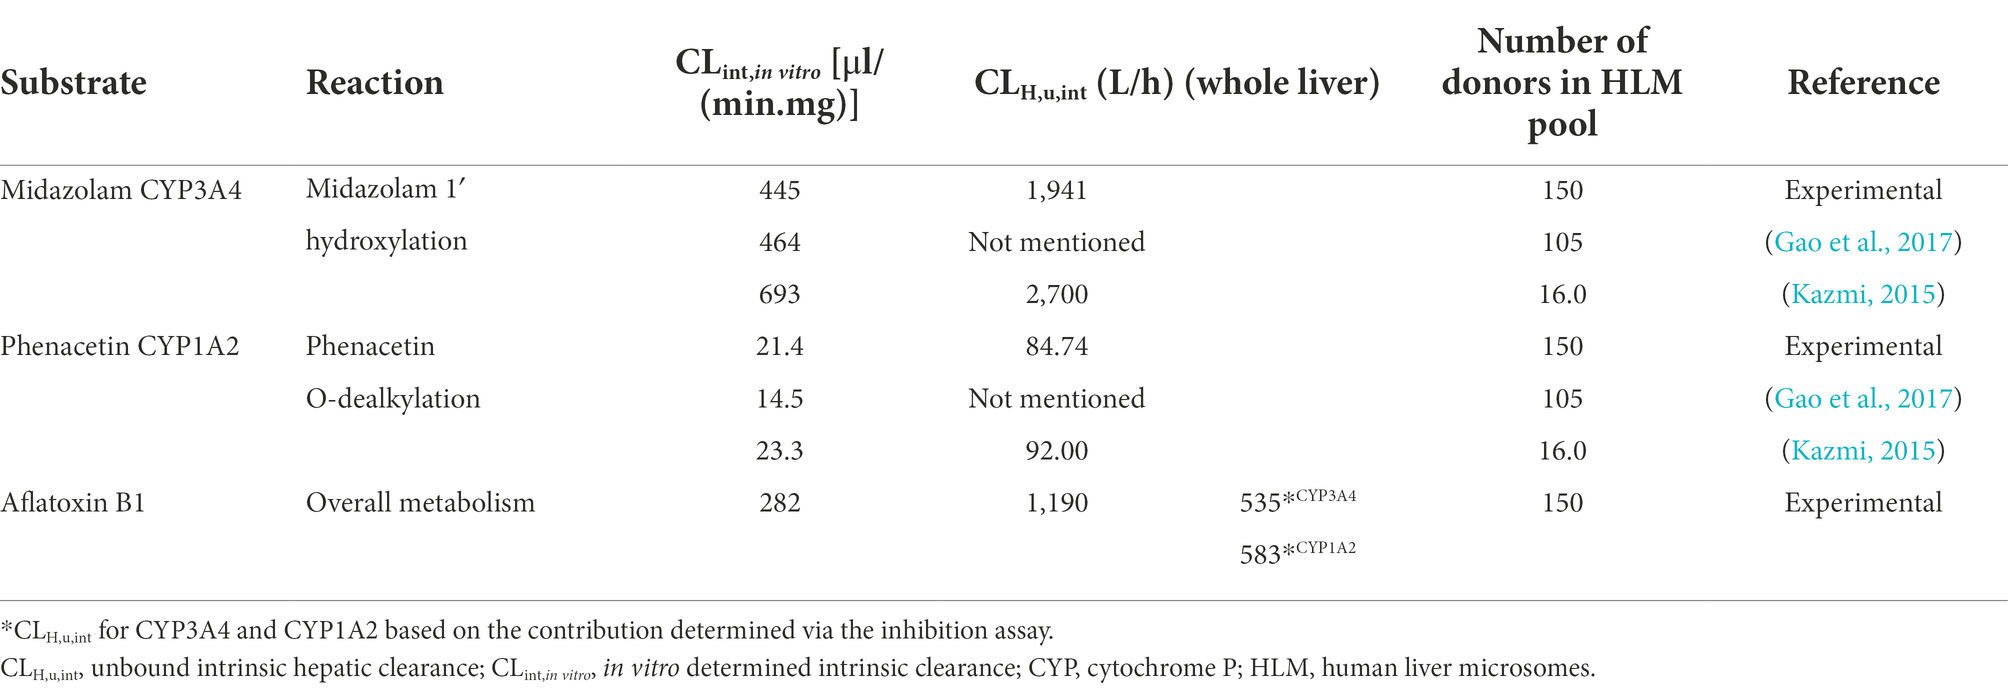
Table 4. Overview of intrinsic in vitro clearance and intrinsic in vivo clearance for certain CYP probes and AFB1.
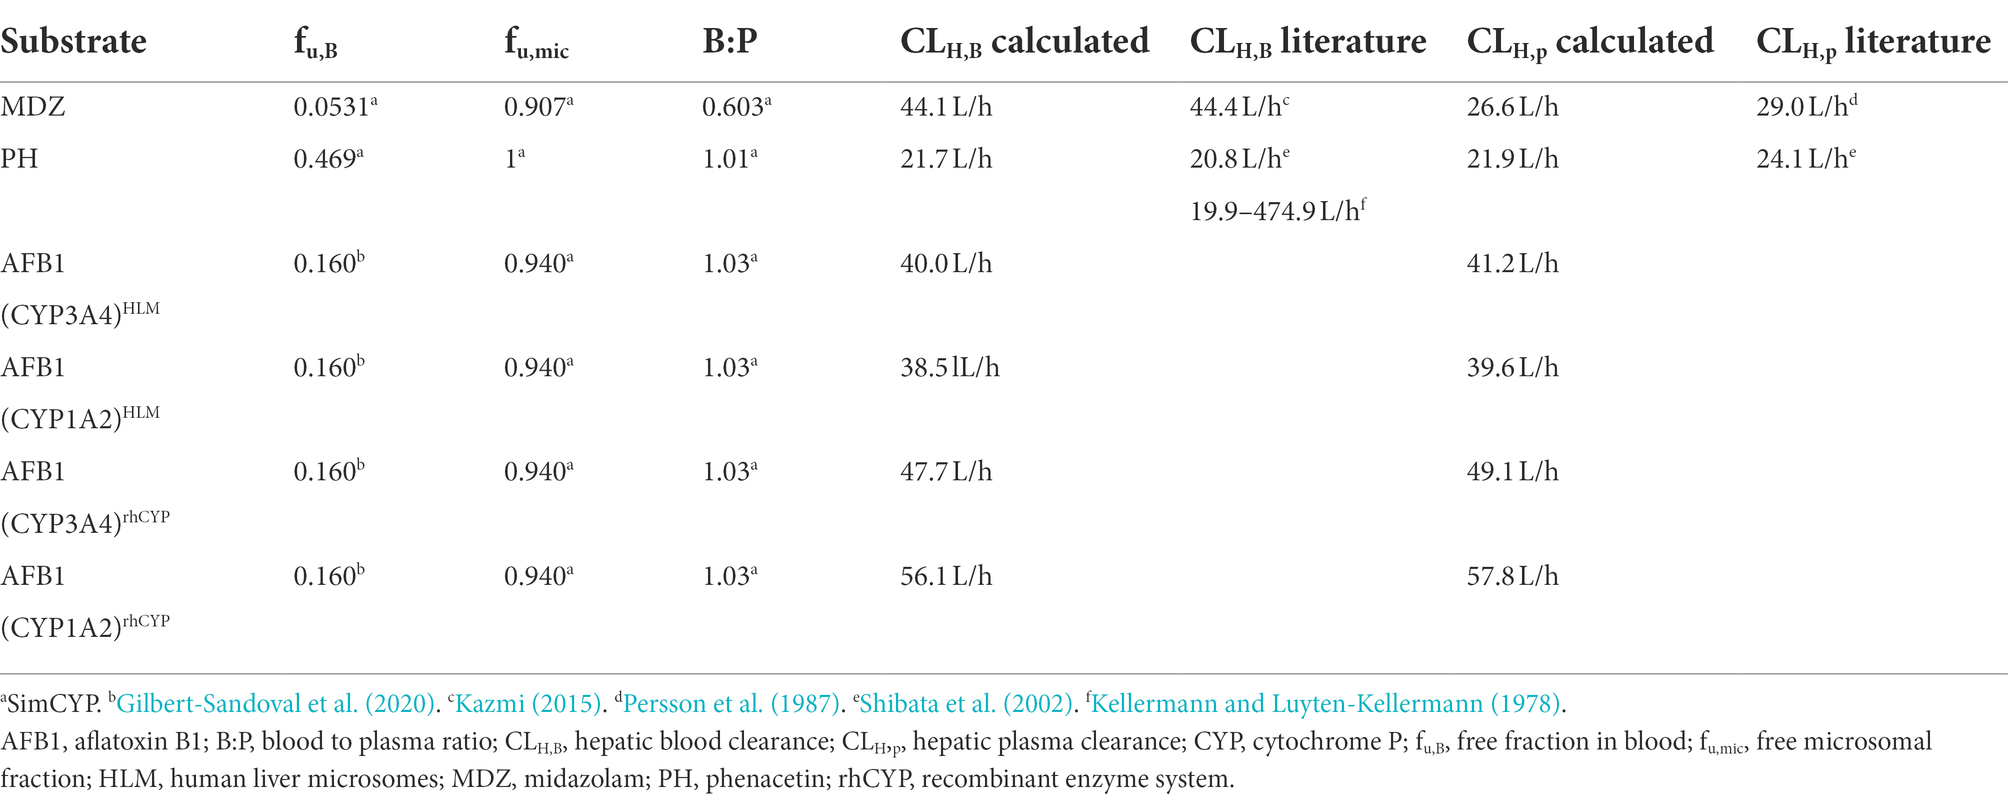
Table 5. Overview of the calculated hepatic clearance and the in vivo hepatic clearance retrieved from literature.
Next, Km and Vmax experiments were performed in recombinant enzyme systems. CYP3A4 supersomes were employed for MDZ and AFB1 and EasyCYP LR CYP1A2 bactosomes for PH and AFB1. Metabolite formation velocity versus substrate concentration Figures were plotted, again followed by nonlinear regression to estimate the Vmax and associated Km values for MDZ (Figures 3A,B) and PH (Figures 3C,D). For AFB1, where substrate depletion was analyzed, kdep was determined for different substrate concentrations in supersomes and bactosomes which was plotted against AFB1 substrate concentrations on a log-scale (Figures 3E,F). By dividing the theoretical maximal kdep by the protein concentration, the CLint was achieved from which the Vmax could be determined (Youdim and Dodia, 2010). The Km and Vmax values obtained in rhCYPs for AFB1 are summarized in Table 3.
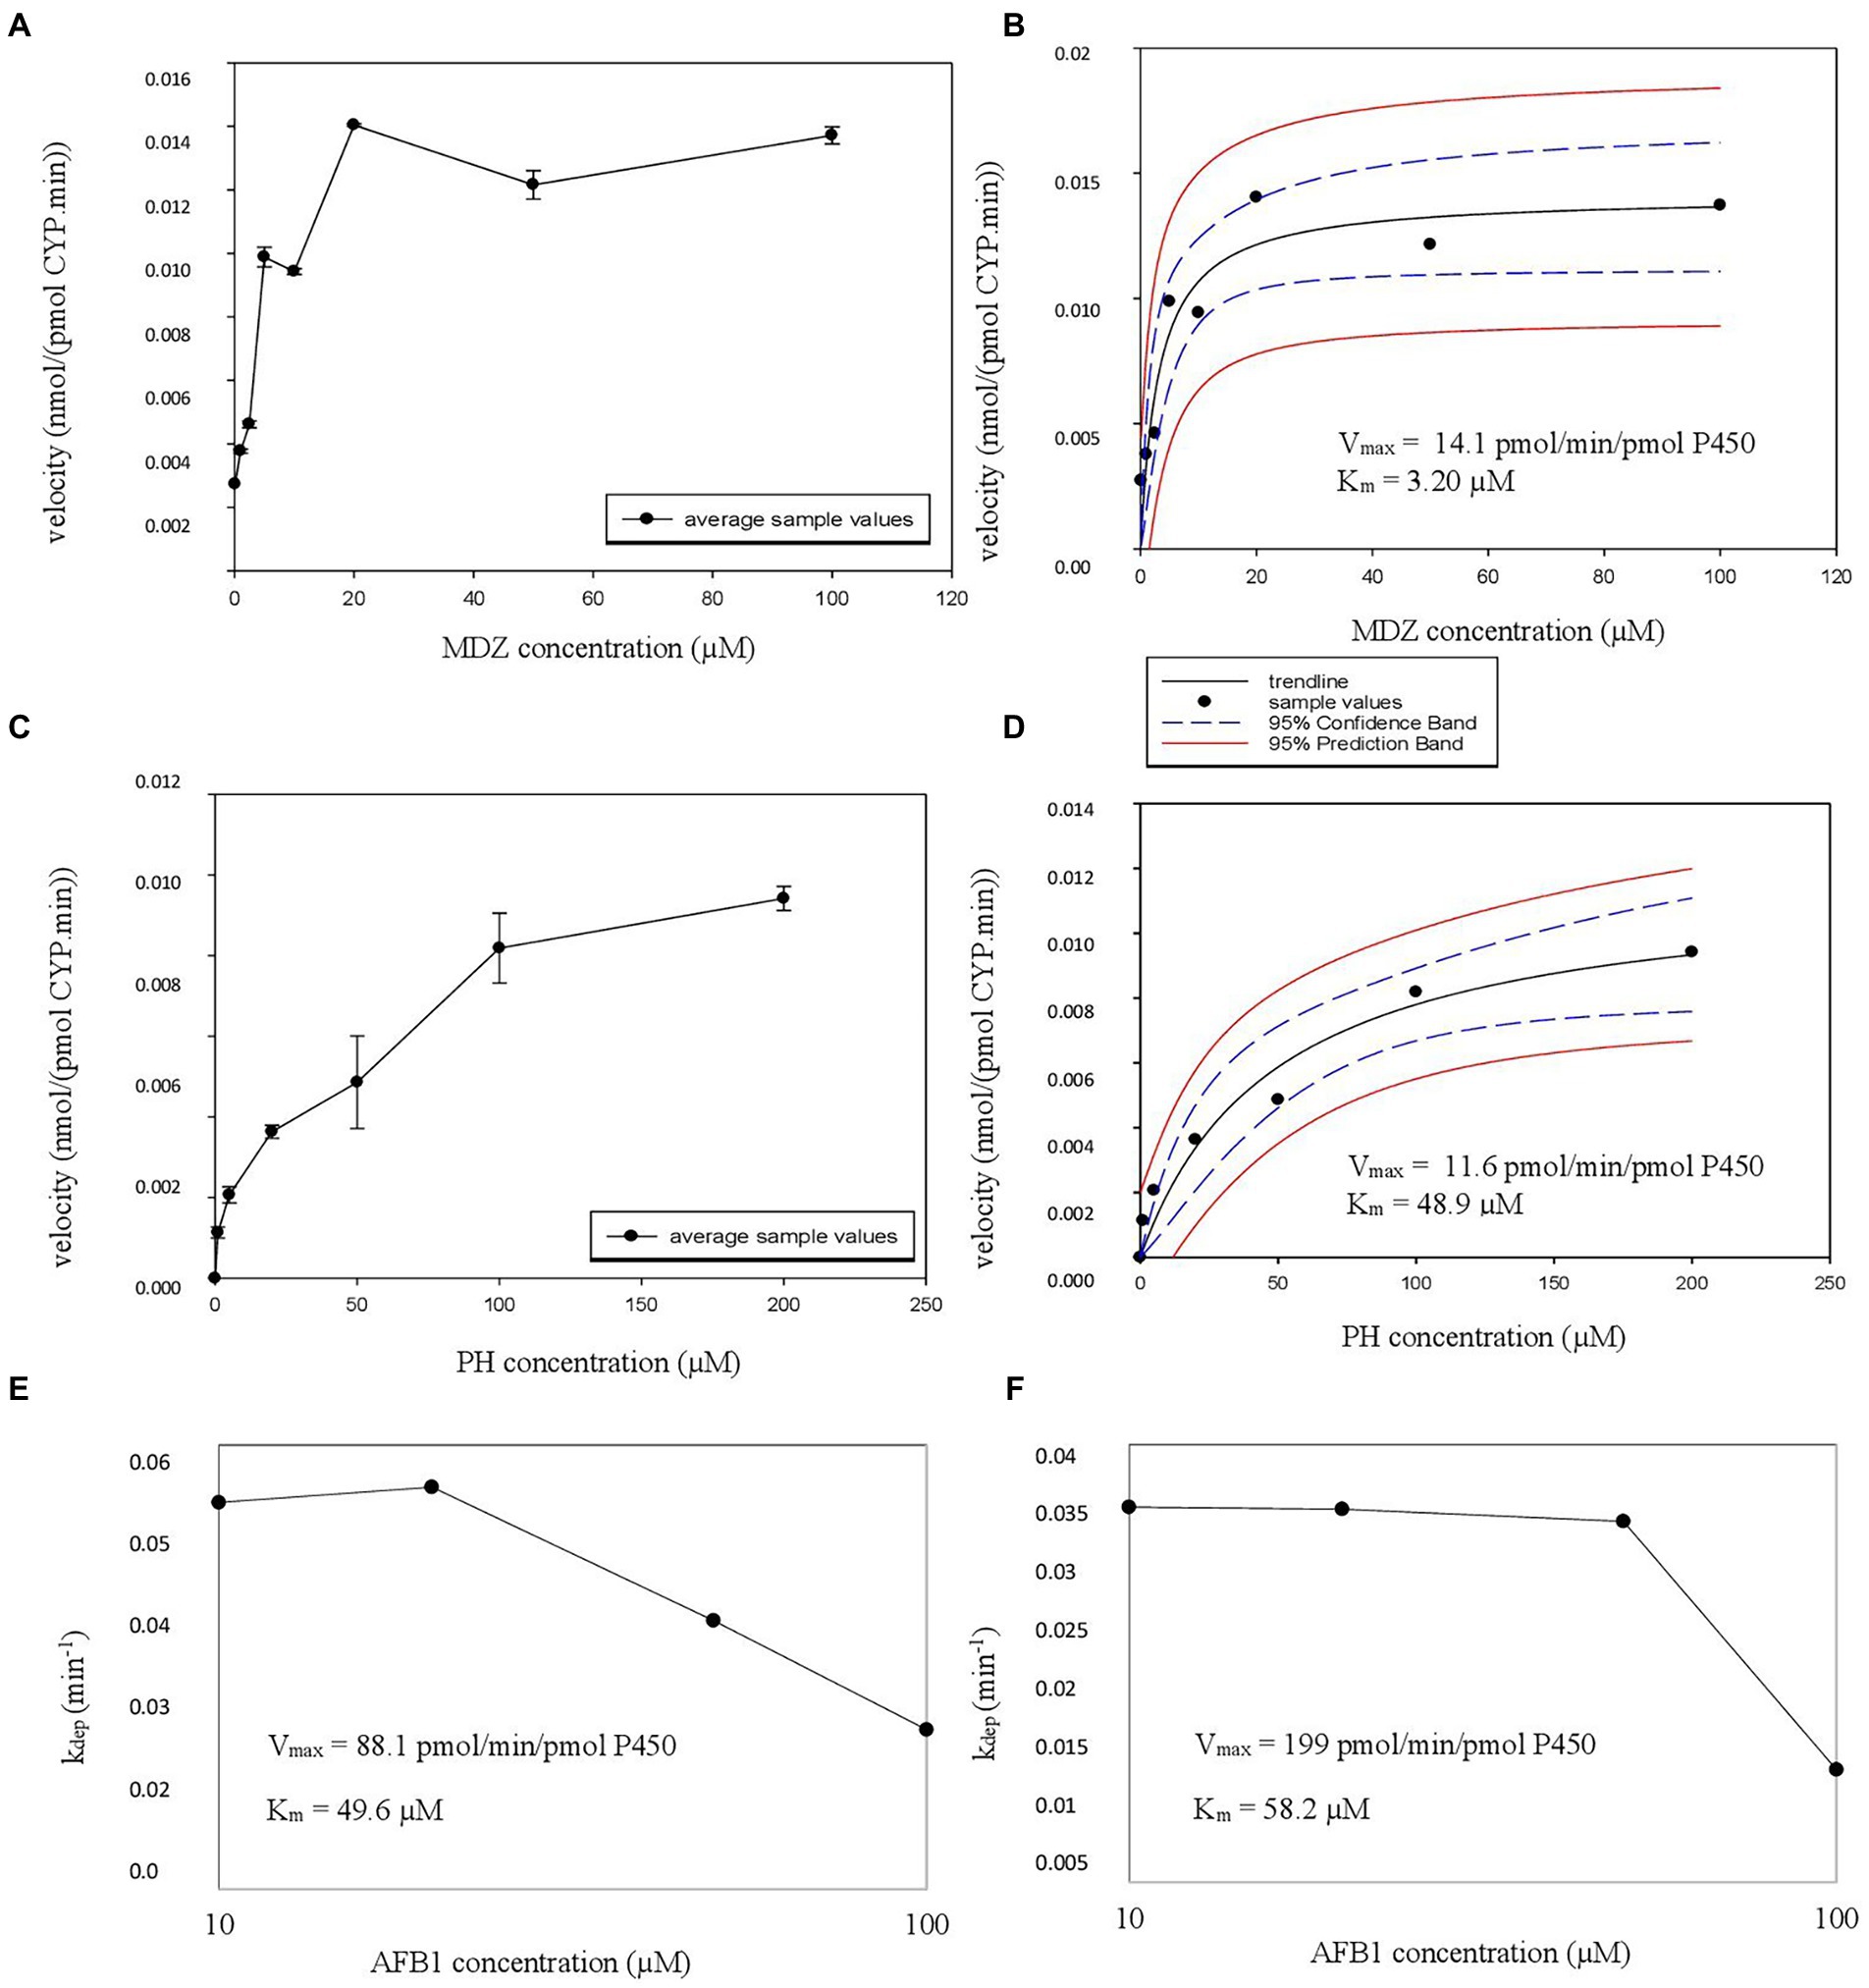
Figure 3. (A–E) Michaelis Menten constant (Km), estimated maximum velocity (Vmax) experiment rhCYP CYP3A4 graphs. (A,C) The velocity in nmol/(pmol CYP.min) in function of the added substrate concentration in μM is illustrated with error bars. The formation of alpha-hydroxy-midazolam (α-OH-MDZ) is given at the top, formation of aflatoxin B1 (AFB1) CYP3A4 metabolites is given at the bottom. (B,D) The nonlinear regression Michaelis–Menten curves are given with the Vmax and Km values, top for midazolam (MDZ) and bottom for AFB1. (E,F) The substrate depletion is represented by the depletion rate (kdep) and is plotted against AFB1 concentration in μM for CYP3A4 supersomes (E) and for CYP1A2 bactosomes (F).
The obtained rhCYP Km and Vmax values of the CYP3A4 probe MDZ, were used to calculate the ISEF for both Vmax and CLint (Equations 7 and 8). The CYP3A4 abundance of 137 pmol/mg protein was used as provided by SimCYP. A Vmax ISEF of 0.495 and a CLint ISEF of 0.737 were obtained. When using the data of AFB1 obtained in rhCYP experiments for extrapolation to HLM values, using the determined ISEFs, a Vmax,ISEF of 43.6 pmol/min/pmol P450 and a CLint,ISEF of 179 μl/(mg min) were obtained. Next, the AAF was calculated using the HLM values of the probe substrate MDZ for CYP3A4 and PH for CYP1A2. The in vivo CLint was determined with the information obtained from Gertz et al. (2010), where the total hepatic clearance of MDZ was given. With the use of SimCYP, it was calculated that 88% of the MDZ metabolism is performed by CYP3A4. For CYP1A2, the information obtained from Koganti et al. (2005) was used, where SimCYP predicted a 74% contribution, which was applied to the overall in vivo CLint from literature. Furthermore, an MPPGL of 40 mg/g and a LW of 1,650 g were taken into account for the determination of CLint,u,in vivo,CYP. The fu,mic for MDZ is 0.83 with a microsomal protein concentration of 0.50 mg/ml. With the use of Equation 5, an fu,mic of 0.907 was achieved for a microsomal protein concentration of 0.25 mg/ml. An AAF of 0.84 was obtained with Equation 6, implying that the in vivo activity of CYP3A4 is 1.19-fold lower than the in vitro CYP3A4 activity. Using Equation 10 on the CLH,int,u to calculate the CLH,B of AFB1 for CYP3A4, as determined in supersomes, a value of 47.7 L/h was acquired which is 1.19 times the CLH,B of AFB1 for CYP3A4 of 40.0 L/h determined in HLM (Table 3). Applying the CYP3A4 AAF to the experimentally determined CLH,int,u, a CLH,B for MDZ of 44.1 L/h was achieved which is close to the in vivo human hepatic blood clearance of 44.4 L/h reported by Kazmi (2015; Table 5). The obtained rhCYP Km and Vmax values of the CYP probe PH were used to calculate the ISEF for both Vmax and CLint (Equation 7 and 8). The CYP1A2 abundance of 52 pmol/mg protein was used as provided by SimCYP. A Vmax ISEF of 1.42 and a CLint ISEF of 1.73 were obtained. A Vmax,ISEF of 14.7 pmol/min/pmol P450 and a CLint,ISEF of 308 μl/(mg.min) were obtained for AFB1 using the rhCYP experimental data. For CYP1A2, an AAF of 0.72 was calculated, implying that the in vivo activity of CYP1A2 is 1.39-fold lower than the in vitro CYP1A2 activity. When using the AAF for CYP1A2 to the obtained values of AFB1 in HLM and in rhCYPs, hepatic blood clearances of 38.5 L/h and 56.1 L/h were obtained, respectively (Table 3). Applying the CYP1A2 AAF to the experimentally determined CLH,int,u, a CLH,B for PH of 21.7 L/h was achieved which is close to the in vivo human hepatic blood clearance of 20.8 L/h reported by Shibata et al. (2002) and lies within the range reported by Kellermann and Luyten-Kellermann (1978; Table 5).
AFB1 inhibition assays
For the inhibition assays in HLM with AFB1, CYP3A4/3A5 enzymes were inhibited by ketoconazole and CYP1A2 by α-naphthoflavone. A first-order rate constant, incubation volume, amount of microsomal protein, an MPPGL of 40 mg/g and a LW of 1,650 g were used to determine the CLint,u. Based on the ratio of the difference in CLint,u, both without and with inhibitor, and the CLint,u without inhibitor, a CYP3A4/5 contribution of 45% and a CYP1A2 contribution of 49% were obtained. Both contributions sum up to a total of 94%.
Discussion
Optimal incubation conditions of CYP probes and AFB1 and AFB1 inhibition assays
For AFB1, additional timepoints were chosen at the beginning of the reaction since ideal incubation times are often below 20 min (Di et al., 2004). In addition, only protein levels of 0.25 mg/ml and 0.5 mg/ml were tested for AFB1 linearity determination. It was not feasible to monitor all AFB1 metabolites since not all reference standards were commercially available for the development of a LC–MS/MS method. Therefore, we opted to monitor the depletion of AFB1, instead. However, this approach is less accurate than following metabolite formation. The reduction of the parent compound is quantified by analyzing the parent compound before and after incubation. Only a fraction of the parent compound is metabolized, therefore, the difference in the absolute peak areas of the parent compound will be less accurate than directly monitoring the metabolites. Since two peak areas are quantified (before and after) instead of one (metabolite) and only a small part is metabolized, the error on the disappearance of the parent compound will be higher. Nevertheless, this is the current go-to method if not all metabolites are available as analytical standards. Since parent compound depletion was monitored in case of AFB1, the Km was determined using the depletion rate constants as described by Youdim and Dodia (2010). The ideal microsomal protein concentration and incubation times for Km and Vmax determination were determined for MDZ, PH and AFB1. From these experiments, it can be concluded that incubation times are often below 20 min and microsomal protein concentrations are approximately 0.25–0.5 mg/ml to maintain linear conditions.
When choosing optimal conditions (microsomal protein concentration and incubation time), two criteria must be fulfilled, i.e., not more than 20% of the initial amount of substrate compound can be metabolized, assuring the maintenance of initial rate conditions, and saturation may not be reached, since optimal conditions require that experiments are performed in the linear range (with enzyme concentration and time; Ruikar and Rajput, 2012; Wang et al., 2014).
Inhibition assays showed that CYP3A4/3A5 is involved in 45% of the overall AFB1 hepatic metabolism, 49% is attributed to CYP1A2 and the other 6.0% can be ascribed to other enzymes, expectedly CYP2A13 (He et al., 2006). These results agree with Gallagher et al. (1996), where CYP1A2 was indicated as main metabolizing CYP450 enzyme of AFB1. Gallagher et al. (1996) stated a 95% contribution of CYP1A2 in case of low exposure (0.133 μM) to AFB1, supporting that CYP1A2 is the predominant enzyme in AFB1 metabolism. Data from experiments with higher AFB1 levels (25–500 μM) report a CYP1A2 contribution of only 1–5% whilst CYP3A4 is attributed to 79–95% and CYP3A5 and CYP3A7 to 4–15% and 5–7%, respectively (Kamdem et al., 2006). The difference in CYP1A2 and CYP3A4 contribution for different AFB1 exposures could be assigned to different CYP450 isoenzyme kinetics. Kamdem et al. (2006) stated that CYP3A4 bioactivation follows Hill kinetics whereas CYP1A2 bioactivation follows Michaelis–Menten kinetics. Hill kinetics follow a deviation on the hyperbolic shape of the Michaelis–Menten kinetics (where the coefficient n equals 1). In case of Hill kinetics, a positive or negative kinetic cooperativity is observed were n > 1 or n < 1, respectively (Emelyanova, 2018). In general, one can state that in vivo AFB1 exposure is considered as low-dose AFB1 intake (World Health Organization, 2018) and will be metabolized predominantly by CYP1A2, following Michaelis–Menten kinetics. In case of higher in vivo exposure, CYP3A4 has the predominant role, following Hill kinetics. It is important to have insight in the involved enzymes in the metabolism of a compound in order to understand what happens in the human body. Furthermore, it is crucial to predict possible interactions with other substances that are metabolized by the same enzymes or that have an inducing or inhibiting effect on the concerning enzymes. Interaction at the level of CYP450 enzymes might lead to a higher toxicity or less effectiveness, in case of therapeutic drug substances.
Km Vmax determination of CYP probes and AFB1
Pharmacokinetic parameters were performed on CYP probe substrates to verify the validity of the used experimental design and to determine ISEFs and AAFs. For MDZ, a Km of 2.15 μM was found with a Vmax of 956 pmol/(mg.min), which is acceptable considering earlier reported values for MDZ [Km range: 1.9–9.0 μM; Vmax range: 190.0–4,380 pmol/(mg.min); Von Moltke et al., 1996; Hickman et al., 1998; Yuan et al., 2002; Bian et al., 2015; Kazmi, 2015; Nguyen et al., 2016; Gao et al., 2017]. For PH, a Km of 40.0 μM was observed with a Vmax of 856 pmol/(mg.min), which is consistent with earlier reported values for PH [Km range: 10–62 μM; Vmax range: 241–2,173 pmol/(mg.min); Boobis et al., 1981; Gillam and Reilly, 1988; Yuan et al., 2002; Gao et al., 2014, 2017; Erickson et al., 2015; Kazmi, 2015].
For the Km and Vmax determination of AFB1, two approaches were applied: one with the use of HLM, where an overall Km and Vmax were determined, and another one where rhCYPs were used to determine CYP-specific Km and Vmax, with CYP3A4 and CYP1A2 as main metabolizing enzymes for AFB1 (He et al., 2006; Kamdem et al., 2006; Bbosa et al., 2013). For AFB1, the overall Km and Vmax in HLM are 40.9 μM and 11,536 pmol/(mg.min). A paper by Gallagher et al. (1994) reported Km values of 41 μM for the AFBO formation via CYP1A2, 29 μM for the AFM1 formation via CYP1A2, 133 μM for the AFBO formation via CYP3A4 and 139 μM for the AFM1 formation via CYP3A4. The liver microsomes from 3 male subjects (age range 21–46 years old) were used in these experiments (Gallagher et al., 1994). Data from Kamdem et al. (2006) reported Km values from 13 HLM donors following AFBO or AFQ1 formation ranging from 90–1,720 μM with associated Vmax values ranging from 236–11,281 pmol/(mg.min). The performed supersome experiments resulted in a Km value of 49.6 μM and a Vmax value of 88.1 pmol/min/pmol P450 for CYP3A4 metabolism; the performed CYP1A2 bactosome experiments resulted in a Km value of 58.2 μM and a Vmax value of 199 pmol/min/pmol P450. Since limited information has thus far been presented on the PK parameters of mycotoxins, especially not on the overall Km and Vmax of AFB1, more in-depth comparison with literature data proved impossible. Reported Km and Vmax determinations cover a large range of values and are dependent on a variety of parameters such as the applied HLM and type of HLM donors (ethnicity, pathologies etc.). Furthermore, it is important to take into account the HLM pool size and to perform experiments on probe substrates, so environmental laboratory parameters do not have an influence. The determined Vmax from the current experiments lies within the ranges reported earlier for AFB1 metabolization. The determined Km cannot be compared since an overall Km via HLM, a Km based on CYP3A4 metabolism and a Km based on CYP1A2 metabolism using rhCYPs were determined. Firstly, the earlier reported Km values are for a specific metabolite formation whereas this study looked at the overall metabolism via HLM or the metabolism by a specific CYP450 enzyme. CYP1A2 forms both AFBO and AFM1, whereas CYP3A4 is involved in AFBO and AFQ1 formation. Secondly, the current experiment used an HLM pool of 150 donors consisting of both male and female subjects whereas, in Gallagher et al. (1994) the number of microsome donors was only 3, and in the Kamdem et al. (2006) it was only 13. Thirdly, Kamdem et al. (2006) reported a substantial interindividual difference in enzyme expression, which had an enormous impact on AFB1 activation to AFBO and deactivation into other metabolites (lower or higher metabolism). Therefore, it is very important to pool large amounts of donors to avoid major impact of interindividual variability. The Km values from Kamdem et al. (2006) and Gallagher et al. (1994) do not really correspond, also not with the currently reported Km data. The former published data lack a representative HLM pool, therefore it can be stated that the results of this paper show a representative Km and Vmax value for AFB1 in HLM. This info can be used for further co-incubation experiments where a concentration below the Km value (preferably 1/10th of the Km so that the substrate concentration does not have an impact on the CLint,in vitro) is needed. Based on the experimental Km values, the respective concentrations would likely be set at 0.2 μM, 4 μM and 5 μM for MDZ, PH and AFB1, respectively.
The calculated CLint,in vitro for CYP3A4 (midazolam 1′ hydroxylation), CYP1A2 (phenacetin O-dealkylation) and the overall metabolism of AFB1 from HLM experiments are 445 μl/(mg.min), 21.4 μl/(mg.min) and 282 μl/(mg.min), respectively. Using fu,B and fu,mic values found in literature, an MPPGL of 40 mg/g, a LW of 1,650 g and experimentally determined AAFs and CYP-contributions, a CLH,B of 44.1 L/h (MDZ), 21.7 L/h (PH), 40.0 L/h (AFB1 CYP3A4) and 38.5 L/h (AFB1 CYP1A2) were obtained. Compared to literature, these values were within 1.00 and 1.04-fold for MDZ (Kazmi, 2015) and PH (Shibata et al., 2002).
The CLint, in vitro values from rhCYP experiments on AFB1 were used for the extrapolation to in vivo CLH,B. A Vmax ISEF of 0.495 and a CLint ISEF of 0.737 were obtained for CYP3A4 supersomes. The correlated recombinant system Km was 49.6 μM and Vmax was 88.1 pmol/min/pmol P450 for AFB1, while for MDZ a Km of 3.20 μM and Vmax of 14.1 pmol/min/pmol P450 were obtained. After applying the determined ISEFs and AAF, the obtained CLH,B for AFB1 by using rhCYPs (supersomes) was 47.7 L/h which is 1.19-fold higher than the value from HLM experiments (40.0 L/h) following the CYP3A4 pathway. A Vmax ISEF of 1.42 and a CLint ISEF of 1.73 were obtained from CYP1A2 bactosomes. The correlated recombinant Km was 58.2 μM and Vmax was 199 pmol/min/pmol P450 for AFB1, while for PH a Km of 48.9 μM and Vmax of 11.6 pmol/min/pmol P450 were obtained. After applying the determined ISEFs and AAF, the obtained CLH,B for AFB1 by using rhCYPs (EasyCYP bactosomes) was 56.1 L/h which is 1.46-fold higher than the CYP1A2 value from HLM experiments (38.5 L/h). It can therefore be concluded that both HLM and rhCYPs are useful in vitro systems to determine PK parameters. In case of unavailability of analytical standards, CYP450-specific systems such as supersomes or bactosomes are deployed, if ISEFs are determined as well, to solve the problem of not being able to follow a specific metabolite formation. By determining the PK parameters of a known compound such as MDZ and PH, the ISEFs can be determined, necessary for extrapolation from in vitro to in vivo and also to compensate for interindividual CYP abundance variation. These experiments showed that the supersomes (CYP3A4) had a result which was closer to the result of the HLM, compared to the easyCYP LR bactosomes (CYP1A2). This might be attributable to the use of different rhCYPs, but since a correction was made using both ISEFs and AAFs, the difference of various rhCYP systems should be negligible. Further research should be performed in order to further conclude on the performance of the different rhCYP systems.
Using the AAF, the blood CLH,MDZ was determined at 44.1 L/h, which is close to the in vivo CLH value reported in literature of 44.4 L/h (Kazmi, 2015). The hepatic in vivo blood clearance of AFB1 via CYP3A4 determined by HLM and rhCYP in vitro systems, are 40.0 L/h and 47.7 L/h, respectively, taking into account the AAF of CYP3A4 (Table 3). There is a difference between the determined HLM and rhCYP hepatic in vivo blood clearance. This might be attributable to the determination of the overall clearance and the application of CYP450-contributions from the inhibition assay in case of HLM clearance whereas in the case of supersomes, only the clearance due to CYP3A4 was determined. The blood CLH,PH was determined at 21.7 L/h, which is in line with the in vivo CLH,B reported in literature of 20.8 L/h for PH (Shibata et al., 2002) and which also lies within the reported range of 19.9–474.9 L/h (Kellermann and Luyten-Kellermann, 1978). The broad in vivo CLH,B range of PH in literature can be explained by the large interindividual variation in the first pass effect. The in vivo hepatic blood clearance of AFB1 via CYP1A2 determined using HLM and rhCYP, are 38.5 L/h and 56.1 L/h, respectively, taking into account the AAF of CYP1A2 (Table 3).
The implementation of AAFs results in a value closer to the in vivo conditions since it accounts for batch differences between in vitro systems, for experimental discrepancies and differences between in vitro and in vivo data. Since the implementation led to a more accurate estimation of the in vivo hepatic clearance of the probe substrates MDZ and PH, for CYP3A4 and CYP1A2, the AAF was applied on the CLH,int,u of AFB1, for which only limited PK information is available (Jubert et al., 2009; T’jollyn et al., 2017). In vitro systems can be used for the determination of Km, Vmax and the intrinsic clearance. Noteworthy, in vitro systems seem to underestimate the in vivo clearance (Bowman and Benet, 2019). Although this was not the case for the hepatic blood clearances of the CYP probe substrates in these experiments, it must be taken into account for the reported values of AFB1. For the extrapolation to whole liver clearance or even CLpo, other important factors such as transporters, protein binding, bioavailability should be determined and taken into account. In conclusion, the hepatic blood clearances corrected for the AAF, i.e., CLH,B,MDZ,AAF, CLH,B,PH,AAF CLH,B,AFB1,AAF(CYP3A4) and CLH,B,AFB1,AAF(CYP1A2) were determined in HLM at 44.1 L/h, 21.7 L/h, 40.0 L/h and 38.5 L/h. Inhibition assays in HLM showed that 45% of the AFB1 metabolism was performed by CYP3A4/3A5 enzymes and 49% by CYP1A2 enzymes. In HLM the overall Km was 40.9 μM and the Vmax was 11.5 nmol/(mg.min) for AFB1. In recombinant enzyme systems, the Km and Vmax,AAF were 49.6 μM and 43.6 pmol/min/pmol P450 for CYP3A4 and 58.2 μM and 283 pmol/min/pmol P450 for CYP1A2.
Data availability statement
The original contributions presented in the study are included in the article/supplementary material, further inquiries can be directed to the corresponding authors.
Author contributions
OL: conceptualization, writing original draft, and correcting draft. MB, EG, and AV: conceptualization, supervision and review original draft, and final approval. JB and SS: supervision and review original draft, and final approval. All authors contributed to the article and approved the submitted version.
Acknowledgments
The expert knowledge of Peter Kilford was kindly appreciated. The assistance of Frédéric Dumoulin during the method development on the LC–MS/MS is kindly acknowledged.
Conflict of interest
The authors declare that the research was conducted in the absence of any commercial or financial relationships that could be construed as a potential conflict of interest.
Publisher’s note
All claims expressed in this article are solely those of the authors and do not necessarily represent those of their affiliated organizations, or those of the publisher, the editors and the reviewers. Any product that may be evaluated in this article, or claim that may be made by its manufacturer, is not guaranteed or endorsed by the publisher.
References
Bbosa, G. S., Kitya, D., Odda, J., and Ogwal-Okeng, J. (2013). Aflatoxins metabolism, effects on epigenetic mechanisms and their role in carcinogenesis. Health 5, 14–34. doi: 10.4236/health.2013.510A1003
Bennett, J. W., and Klich, M. (2003). Mycotoxins. Clin. Microbiol. Rev. 16, 497–516. doi: 10.1128/cmr.16.3.497-516.2003
Bian, Y., Yao, Q., Shang, H., Lei, J., Hu, H., and Guo, K. (2015). Expression of Bama minipig and human CYP3A enzymes: comparison of the catalytic characteristics with each other and their liver microsomes. Drug Metab. Dispos. 43, 1336–1340. doi: 10.1124/dmd.115.064717
Boobis, A. R., Kahn, G. C., Whyte, C., Brodie, M. J., and Davies, D. S. (1981). Biphasic O-deethylation of phenacetin and 7-ethoxycoumarin by human and rat liver microsomal fractions. Biochem. Pharmacol. 30, 2451–2456. doi: 10.1016/0006-2952(81)90340-3
Bowman, C. M., and Benet, L. Z. (2019). In vitro-in vivo extrapolation and hepatic clearance dependent underprediction. J. Pharm. Sci. 108, 2500–2504. doi: 10.1016/J.XPHS.2019.02.009
Claeys, L., Romano, C., De Ruyck, K., Wilson, H., Fervers, B., Korenjak, M., et al. (2020). Mycotoxin exposure and human cancer risk: a systematic review of epidemiological studies. Compr. Rev. Food Sci. Food Saf. 19, 1449–1464. doi: 10.1111/1541-4337.12567
Di, L., Kerns, E. H., Gao, N., Li, S. Q., Huang, Y., Bourassa, J. L., et al. (2004). Experimental design on single-time-point high-throughput microsomal stability assay. J. Pharm. Sci. 93, 1537–1544. doi: 10.1002/JPS.20076
Emelyanova, V. (2018). Graphical approach to compare concentration constants of hill and Michaelis-Menten equations. J. Biotechnol. Biomed. Sci. 1, 94–99. doi: 10.14302/ISSN.2576-6694.JBBS-18-2280
Erickson, D. A., Charleston, J. S., Zhang, J., Thorson, H., Gast, M., Berko, R., et al. (2015). Induction and Inhibition of Human Cytochromes P450 by Eteplirsen, a Phosphorodiamidate Morpholino Oligomer (PMO) (20th North American ISSX Meeting). Available at: https://issx.confex.com/issx/20NA/webprogram/Paper35063.html (Accessed August 12, 2022).
Eskola, M., Kos, G., Elliott, C. T., Hajšlová, J., Mayar, S., and Krska, R. (2019). Worldwide contamination of food-crops with mycotoxins: validity of the widely cited ‘FAO estimate’ of 25%. Crit. Rev. Food Sci. Nutr. 60, 2773–2789. doi: 10.1080/10408398.2019.1658570
Food and Drug Administration. (2020). Drug Development and Drug Interactions | Table of Substrates, Inhibitors and Inducers | FDA. Available at: https://www.fda.gov/drugs/drug-interactions-labeling/drug-development-and-drug-interactions-table-substrates-inhibitors-and-inducers (Accessed August 1, 2022).
Gallagher, E. P., Kunze, K. L., Stapleton, P. L., and Eaton, D. L. (1996). The kinetics of aflatoxin B1 oxidation by human cDNA-expressed and human liver microsomal cytochromes P450 1A2 and 3A4. Toxicol. Appl. Pharmacol. 141, 595–606. doi: 10.1006/taap.1996.0326
Gallagher, E. P., Wienkers, L. C., Stapleton, P. L., Kunze, K. L., and Eaton, D. L. (1994). Role of human microsomal and human complementary DNA-expressed cytochromes P4501A2 and P4503A4 in the bioactivation of aflatoxin 1. Cancer Res. 54, 101–108.
Gao, J., Jiewang, J., Gao, N., Tian, X., Zhou, J., Fang, Y., et al. (2017). Prediction of cytochrome P450-mediated drug clearance in humans based on the measured activities of selected CYPs. Biosci. Rep. 37:20171161. doi: 10.1042/BSR20171161
Gao, N., Qi, B., Liu, F.-J., Fang, Y., Zhou, J., Jia, L. J., et al. (2014). Inhibition of baicalin on metabolism of phenacetin, a probe of CYP1A2, in human liver microsomes and in rats. PLoS One 9:e89752. doi: 10.1371/journal.pone.0089752
Gertz, M., Harrison, A., Houston, J. B., and Galetin, A. (2010). Prediction of human intestinal first-pass metabolism of 25 CYP3A substrates from in vitro clearance and permeability data. Drug Metab. Dispos. 38, 1147–1158. doi: 10.1124/dmd.110.032649
Gilbert-Sandoval, I., Wesseling, S., and Rietjens, I. M. C. M. (2020). Predicting the acute liver toxicity of aflatoxin B1 in rats and humans by an in vitro–in silico testing strategy. Mol. Nutr. Food Res. 64:2000063. doi: 10.1002/mnfr.202000063
Gillam, E. M. J., and Reilly, P. E. B. (1988). Phenacetin o-deethylation by human liver microsomes: kinetics and propranolol inhibition. Xenobiotica 18, 95–104. doi: 10.3109/00498258809055140
Hannemann, F., Bichet, A., Ewen, K. M., and Bernhardt, R. (2007). Cytochrome P450 systems—biological variations of electron transport chains. Biochim. Biophys. Acta Gen. Subj. 1770, 330–344. doi: 10.1016/j.bbagen.2006.07.017
He, X. Y., Tang, L., Wang, S. L., Cai, Q. S., Wang, J. S., and Hong, J. Y. (2006). Efficient activation of aflatoxin B1 by cytochrome P450 2A13, an enzyme predominantly expressed in human respiratory tract. Int. J. Cancer 118, 2665–2671. doi: 10.1002/ijc.21665
Hickman, D., Wang, J. P., Wang, Y., and Unadkat, J. D. (1998). Evaluation of the selectivity of in vitro probes and suitability of organic solvents for the measurement of human cytochrome P450 monooxygenase activities. Drug Metab. Dispos. 26, 207–215.
IARC (2002). Monograph IARC Aflatoxins. Available at: https://monographs.iarc.fr/wp-content/uploads/2018/06/mono100F-23.pdf (Accessed February 28, 2022).
Ivanova, L., Denisov, I. G., Grinkova, Y. V., Sligar, S. G., and Fæste, C. K. (2019). Biotransformation of the mycotoxin enniatin B1 by CYP P450 3A4 and potential for drug-drug interactions. Meta 9:158. doi: 10.3390/metabo9080158
Jancova, P., Anzenbacher, P., and Anzenbacherova, E. (2010). Phase II drug metabolizing enzymes. Biomed. Papers 154, 103–116. doi: 10.5507/bp.2010.017
Jubert, C., Mata, J., Bench, G., Dashwood, R., Pereira, C., Tracewell, W., et al. (2009). Effects of chlorophyll and chlorophyllin on low-dose aflatoxin B 1 pharmacokinetics in human volunteers. Cancer Prev. Res. 2, 1015–1022. doi: 10.1158/1940-6207.CAPR-09-0099
Kamala, A., Shirima, C., Jani, B., Bakari, M., Sillo, H., Rusibamayila, N., et al. (2018). Outbreak of an acute aflatoxicosis in Tanzania during 2016. 11, 311–320. doi: 10.3920/WMJ2018.2344
Kamdem, L., Meineke, I., Gödtel-Armbrust, U., Brockmöller, J., and Wojnowski, L. (2006). Dominant contribution of P450 3A4 to the hepatic carcinogenic activation of aflatoxin B1. Chem. Res. Toxicol. 19, 577–586. doi: 10.1021/TX050358E
Kazmi, F. (2015). System dependent metabolism of drugs by cytochrome P450: The mechanistic basis for why human liver microsomes are superior to human hepatocytes at metabolizing midazolam but inferior at metabolizing desloratadine. Available at: https://kuscholarworks.ku.edu/handle/1808/19448 (Accessed March 18, 2022).
Kebede, H., Liu, X., Jin, J., and Xing, F. (2020). Current status of major mycotoxins contamination in food and feed in Africa. Food Control 110:106975. doi: 10.1016/j.foodcont.2019.106975
Kellermann, G., and Luyten-Kellermann, M. (1978). Benzo(a)pyrene metabolism and plasma elimination rates of phenacetin, acetanilide and theophylline in man. Pharmacology 17, 191–200. doi: 10.1159/000136854
Koganti, A., Hewitt, N. J., Zhang, W., Chesebrough, M., Terrell, C. M., Silber, P. M., et al. (2005). Metabolic Stability and Clearance of Pharmaceutical Chemicals in Pre-Pooled Cryo-Preserved Hepatocytes. In Vitro, 21227–21227.
Nguyen, H. Q., Kimoto, E., Callegari, E., and Obach, R. S. (2016). Mechanistic modeling to predict midazolam metabolite exposure from in vitro data. Drug Metab. Dispos. 44, 781–791. doi: 10.1124/dmd.115.068601
Persson, P., Nilsson, A., Hartvig, P., and Tamsen, A. (1987). Pharmacokinetics of midazolam in total I.V. anaesthesia. Br. J. Anaesth 59, 548–556. doi: 10.1093/bja/59.5.548
Pleadin, J., Frece, J., and Markov, K. (2019). Mycotoxins in food and feed. Adv. Food Nutr. Res. 89, 297–345. doi: 10.1016/bs.afnr.2019.02.007
Rotimi, O. A., Rotimi, S. O., Goodrich, J. M., Adelani, I. B., Agbonihale, E., and Talabi, G. (2019). Time-course effects of acute aflatoxin B1 exposure on hepatic mitochondrial lipids and oxidative stress in rats. Front. Pharmacol. 10:467. doi: 10.3389/fphar.2019.00467
Ruikar, D. B., and Rajput, S. J. (2012). Optimization of the in vitro oxidative biotransformation of glimepiride as a model substrate for cytochrome p450 using factorial design. Daru 20:38. doi: 10.1186/2008-2231-20-38
Sai, Y., Dai, R., Yang, T. J., Krausz, K. W., Gonzalez, F. J., Gelboin, H. V., et al. (2000). Assessment of specificity of eight chemical inhibitors using cDNA-expressed cytochromes P450. Xenobiotica 30, 327–343. doi: 10.1080/004982500237541
Schelstraete, W., De Clerck, L., Govaert, E., Millecam, J., Devreese, M., Deforce, D., et al. (2019a). Characterization of porcine hepatic and intestinal drug metabolizing CYP450: comparison with human orthologues from A quantitative, activity and selectivity perspective. Sci. Rep. 9:9233. doi: 10.1038/s41598-019-45212-0
Schelstraete, W., Devreese, M., and Croubels, S. (2019b). Impact of subacute exposure to T-2 toxin and zearalenone on the pharmacokinetics of midazolam as CYP3A probe drug in a porcine animal model: a pilot study. Front. Pharmacol. 10:399. doi: 10.3389/fphar.2019.00399
Shibata, Y., Takahashi, H., Chiba, M., and Ishii, Y. (2002). Prediction of hepatic clearance and availability by cryopreserved human hepatocytes: an application of serum incubation method. Drug Metab. Dispos. 30, 892–896. doi: 10.1124/dmd.30.8.892
Sobral, M., Faria, M., Cunha, S., and Ferreire, I. (2018). Toxicological interactions between mycotoxins from ubiquitous fungi: impact on hepatic and intestinal human epithelial cells. Chemosphere 202, 538–548. doi: 10.1016/J.CHEMOSPHERE.2018.03.122
T’jollyn, H., Snoeys, J., Van Bocxlaer, J., De Bock, L., Annaert, P., Van Peer, A., et al. (2017). Strategies for determining correct cytochrome P450 contributions in hepatic clearance predictions: in vitro–in vivo extrapolation as modelling approach and tramadol as proof-of concept compound. Eur. J. Drug Metab. Pharmacokinet. 42, 537–543. doi: 10.1007/S13318-016-0355-0/FIGURES/1
Tracy, T. S., Chaudhry, A. S., Prasad, B., Thummel, K. E., Schuetz, E. G., Zhong, X. B., et al. (2016). Interindividual variability in cytochrome P450-mediated drug metabolism. Drug Metab. Dispos. 44, 343–351. doi: 10.1124/dmd.115.067900
Von Moltke, L. L., Greenblatt, D. J., Schmider, J., Duan, S. X., Wright, C. E., Harmatz, J. S., et al. (1996). Midazolam hydroxylation by human liver microsomes in vitro: inhibition by fluoxetine, norfluoxetine, and by azole antifungal agents. J. Clin. Pharmacol. 36, 783–791. doi: 10.1002/j.1552-4604.1996.tb04251.x
Wang, J. J., Guo, J. J., Zhan, J., Bu, H. Z., and Lin, J. H. (2014). An in-vitro cocktail assay for assessing compound-mediated inhibition of six major cytochrome P450 enzymes. J. Pharm. Anal. 4, 270–278. doi: 10.1016/j.jpha.2014.01.001
World Health Organization (2018). Aflatoxins. Available at: https://www.who.int/foodsafety/FSDigest_Aflatoxins_EN.pdf (Accessed March 24, 2022).
Yang, X., Zhang, B., Molony, C., Chudin, E., Hao, K., Zhu, J., et al. (2010). Systematic genetic and genomic analysis of cytochrome P450 enzyme activities in human liver. Genome Res. 20, 1020–1036. doi: 10.1101/gr.103341.109
Youdim, K., and Dodia, R. (2010). Comparison between recombinant P450s and human liver microsomes in the determination of cytochrome P450 Michaelis-Menten constants. Xenobiotica 40, 235–244. doi: 10.3109/00498250903568504
Yuan, R., Madani, S., Wei, X. X., Reynolds, K., and Huang, S. M. (2002). Evaluation of cytochrome p450 probe substrates commonly used by the pharmaceutical industry to study in vitro drug interactions. Drug Metab. Dispos. 30, 1311–1319. doi: 10.1124/dmd.30.12.1311
Keywords: mycotoxins, CYP450 enzymes, pharmacokinetic, in vitro, Michaelis–Menten constant, LC–MS/MS, aflatoxin B1, human liver microsomes
Citation: Lootens O, De Boevre M, Gasthuys E, Van Bocxlaer J, Vermeulen A and De Saeger S (2022) Unravelling the pharmacokinetics of aflatoxin B1: In vitro determination of Michaelis–Menten constants, intrinsic clearance and the metabolic contribution of CYP1A2 and CYP3A4 in pooled human liver microsomes. Front. Microbiol. 13:988083. doi: 10.3389/fmicb.2022.988083
Edited by:
Federica Giacometti, University of Bologna, ItalyReviewed by:
Yongning Wu, China National Center for Food Safety Risk Assessment, ChinaPhitsanu Tulayakul, Kasetsart University, Thailand
Copyright © 2022 Lootens, De Boevre, Gasthuys, Van Bocxlaer, Vermeulen and De Saeger. This is an open-access article distributed under the terms of the Creative Commons Attribution License (CC BY). The use, distribution or reproduction in other forums is permitted, provided the original author(s) and the copyright owner(s) are credited and that the original publication in this journal is cited, in accordance with accepted academic practice. No use, distribution or reproduction is permitted which does not comply with these terms.
*Correspondence: Orphélie Lootens, orphelie.lootens@ugent.be; Marthe De Boevre, marthe.deboevre@ugent.be
†These authors share last authorship