 Ki-Tae Kim1
 Jaeho Ko1
 Hyeunjeong Song2
 Gobong Choi2Hyunbin Kim2†
 Jongbum Jeon2
 Kyeongchae Cheong2
 Seogchan Kang3
 Yong-Hwan Lee1,2,4,5,6*
- 1Department of Agricultural Biotechnology, Seoul National University, Seoul, South Korea
- 2Interdisciplinary Program in Agricultural Genomics, Seoul National University, Seoul, South Korea
- 3Department of Plant Pathology and Environmental Microbiology, The Pennsylvania State University, State College, PA, United States
- 4Center for Fungal Genetic Resources, Seoul National University, Seoul, South Korea
- 5Plant Immunity Research Center, Seoul National University, Seoul, South Korea
- 6Research Institute of Agriculture and Life Sciences, Seoul National University, Seoul, South Korea
Magnaporthe oryzae infects rice, wheat, and many grass species in the Poaceae family by secreting protein effectors. Here, we analyzed the distribution, sequence variation, and genomic context of effector candidate (EFC) genes in 31 isolates that represent five pathotypes of M. oryzae, three isolates of M. grisea, a sister species of M. oryzae, and one strain each for eight species in the family Magnaporthaceae to investigate how the host range expansion of M. oryzae has likely affected the evolution of effectors. We used the EFC genes of M. oryzae strain 70-15, whose genome has served as a reference for many comparative genomics analyses, to identify their homologs in these strains. We also analyzed the previously characterized avirulence (AVR) genes and single-copy orthologous (SCO) genes in these strains, which showed that the EFC and AVR genes evolved faster than the SCO genes. The EFC and AVR repertoires among M. oryzae pathotypes varied widely probably because adaptation to individual hosts exerted different types of selection pressure. Repetitive DNA elements appeared to have caused the variation of some EFC genes. Lastly, we analyzed expression patterns of the AVR and EFC genes to test the hypothesis that such genes are preferentially expressed during host infection. This comprehensive dataset serves as a foundation for future studies on the genetic basis of the evolution and host specialization in M. oryzae.
Introduction
Like other groups of plant pathogens, fungal pathogens secrete diverse effector proteins to manipulate host defense signaling pathways and downstream machinery. Although most effectors function to enhance virulence (Greenshields and Jones, 2008), some effectors trigger strong defense responses in host varieties that express specific resistance (R) gene products, and such effectors are categorized as avirulence (AVR) effectors (Zhang and Xu, 2014). The effector repertoire of each strain, including both the virulence and AVR effectors, determines its host specialization (Sánchez-Vallet et al., 2018). Due to the ‘arms race’ between plants and pathogens, effector genes and host resistance genes rapidly coevolve to overcome host defense and pathogen attack, respectively (Anderson et al., 2010). Accordingly, pathogens likely need to change their effector repertoire to infect a new host. Such changes include the acquisition of new effector gene(s), optimization of existing effectors for the new host, and modification of specific AVR genes in ways to avoid host recognition (Sánchez-Vallet et al., 2018). A comprehensive understanding of how such evolutionary changes have occurred and underlying mechanisms are crucial to help develop and deploy effective disease control measures (Dodds et al., 2009; Sánchez-Vallet et al., 2018). In this study, we analyzed the genomes of diverse strains that represent multiple host-specific groups (=pathotypes) of Magnaporthe oryzae, a fungal pathogen that infects important cereals, and related species to investigate how both types of effectors are distributed and have evolved.
Rice blast, a disease caused by M. oryzae, results in 10–30% yield loss every year (Talbot, 2003) and has served as a leading model for understanding the nature and mechanism of plant-pathogen interactions (Dean et al., 2012). This fungus belongs to the Magnaporthe grisea species complex, which also includes M. grisea and at least two cryptic species (Zhang et al., 2016). Individual isolates of M. oryzae typically have a limited host range (Choi et al., 2013b) and are divided into pathotypes based on their host range/compatibility. Since the publication of the genome sequences of M. oryzae strain 70-15 (Dean et al., 2005), isolates from rice and other hosts have been sequenced for comparative genomic analyses (Xue et al., 2012; Chen et al., 2013; Chiapello et al., 2015; Dong Y. et al., 2015; Gowda et al., 2015; Wu et al., 2015). Resulting data suggest that host specialization within M. oryzae appears to have been driven by gene gains and losses likely caused by repetitive DNA elements (Yoshida et al., 2016; Zhong et al., 2016). Other mechanisms likely underpinning host specialization include sequence change and repetitive DNA element-mediated genome rearrangement (Sánchez-Vallet et al., 2018).
The effector genes of oomycete pathogen Phytophthora infestans predominantly reside in gene-sparse and repeat-rich regions (Haas et al., 2009). Four AVR genes in Leptosphaeria maculans, including AvrLm1, AvrLm4-7, AvrLm6, and AvrLm11, are located at AT-rich regions (Grandaubert et al., 2014), and the M. oryzae AVR genes Avr-Pita, Avr-Pia, and Avr-Pit are located at telomere-proximal regions (Chen et al., 2007; Khang et al., 2008). Compartmentalization of effector genes in the areas of the genome that tend to change more frequently than the rest of the genome likely facilitates their rapid variation (Lo Presti et al., 2015). The ‘two-speed genome’ model was proposed to explain the bipartite genome architecture of filamentous pathogens (Dong S. et al., 2015).
The evolution of individual effector genes in M. oryzae has been analyzed (Dai et al., 2010; Kanzaki et al., 2012; Huang et al., 2014). Considering the large number of effector candidate (EFC) genes (Kim et al., 2016; Zhang et al., 2018), a systematic analysis of their distribution and genomic context across diverse isolates of M. oryzae is needed to understand how host adaptation has shaped the repertoire of effectors encoded by individual strains and pathotypes. We previously identified 348 EFC genes in M. oryzae strain 70-15 (Kim et al., 2016). Using this gene set, we mined their homologous CDS in 31 M. oryzae isolates from rice (Oryza), wheat (Triticum), foxtail (Setaria), goosegrass (Eleusine) and ryegrass (Lolium), three M. grisea strains isolated from crabgrass (Digitaria), and one strain each for eight species in the family Magnaporthaceae. We also mined the genomes of these isolates for the homologs of 15 known M. oryzae AVR genes (Table 1). The distribution pattern and genomic context of individual EFC and AVR genes were analyzed in a phylogenomic context. For comparison, we analyzed two sets of conserved 70-15 genes, including 10 reference (REF) genes that have been commonly used for gene expression analysis (Omar et al., 2016) and 2,245 single-copy orthologous (SCO) genes, and their homologs in other strains. Results from this comprehensive analysis help understand the genetic basis of host adaptation within M. oryzae.
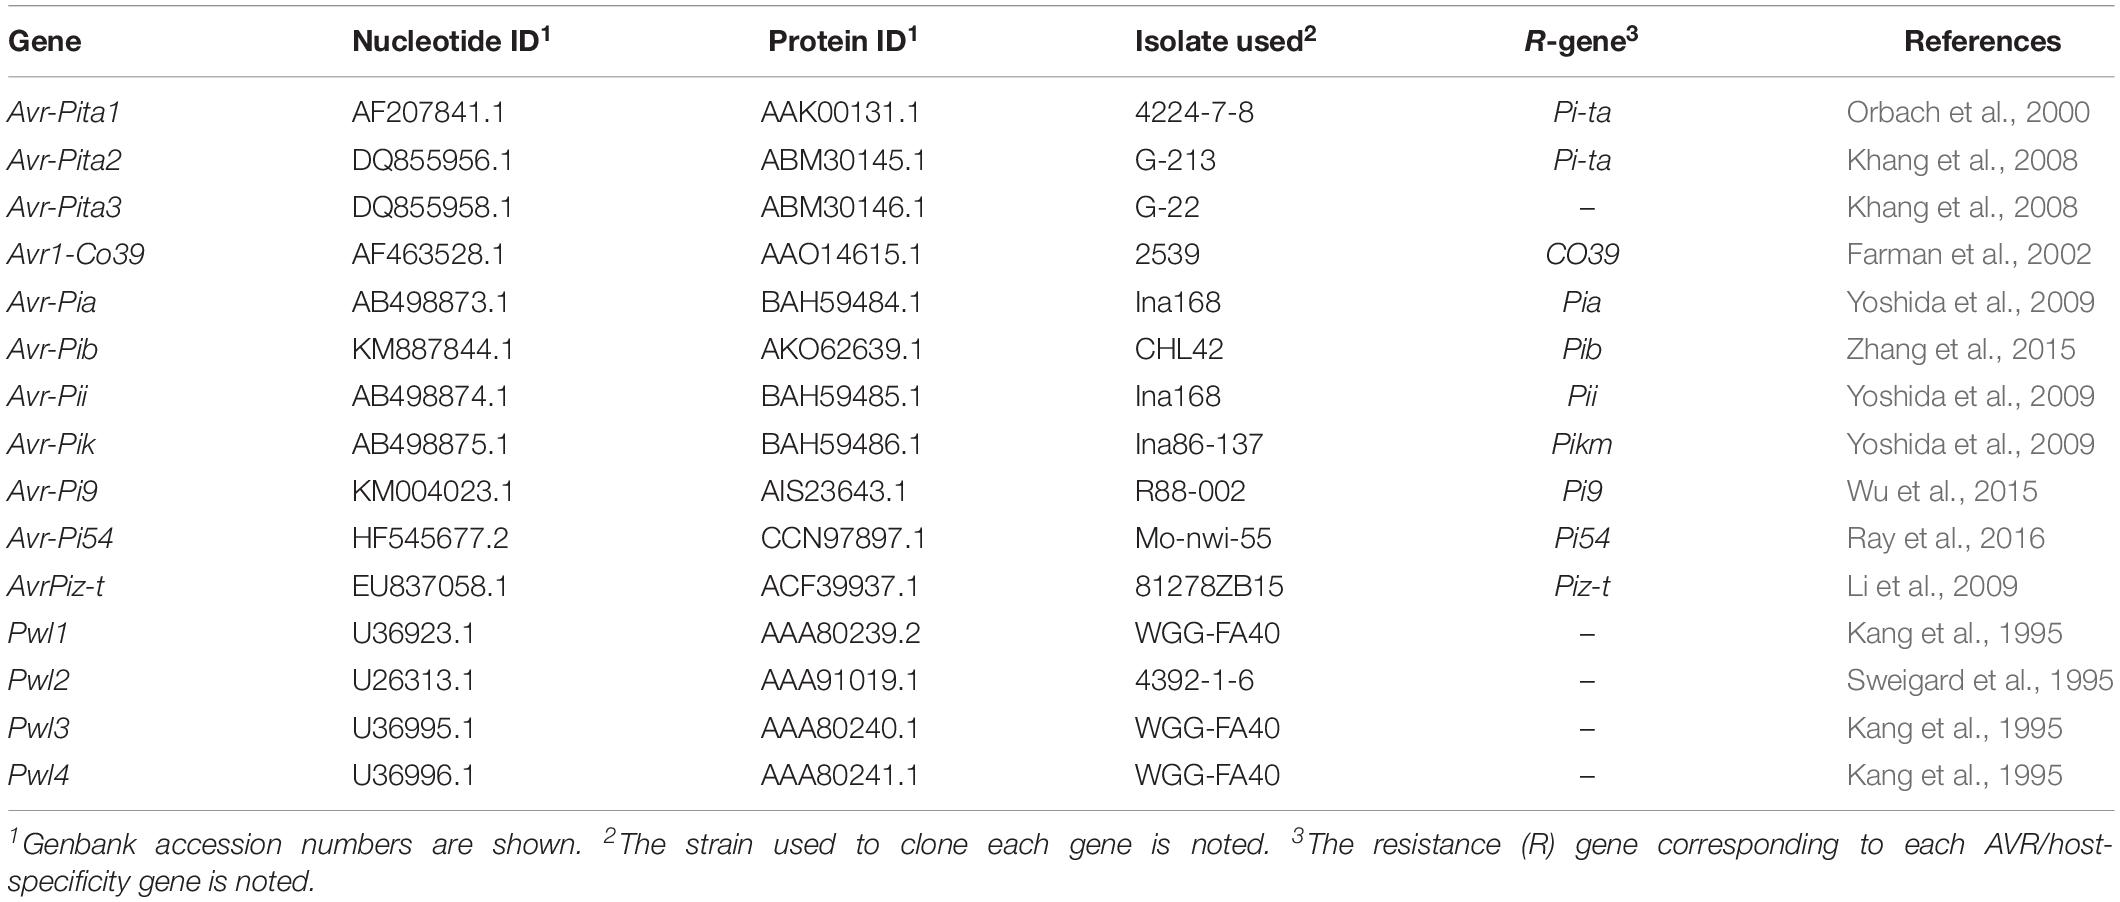
Table 1. The M. oryzae AVR and host-specificity genes analyzed in this study.
Materials and Methods
Sources of the Genomes Analyzed and the AVR Genes and EFC Genes Used to Mine Their Homologs in the Collected Genomes
We used a literature survey to collect the assembled genomes of 31 M. oryzae strains, including 12 MoO (representing pathotype Oryza), 11 MoT (Triticum), four MoE (Eleusine), three MoS (Setaria) and one MoL (Lolium) isolates, and three M. grisea (Mg) isolates from Digitaria (Supplementary Table 1). The genomes of M. oryzae strain 70-15, Magnaporthe poae, Gaeumannomyces graminis, and Neurospora crassa were downloaded from Comparative Fungal Genomics Platform (Choi et al., 2013a). The genomes of Harpophora oryzae, two Mg strains (DS0505 and DS9461), five MoO isolates (98-06, FJ81278, HN19311, KJ201, and MG01), two MoS isolates (SV9610 and SV9623), two MoE isolates (EI9411 and EI9604), and two MoT isolates (B71 and BdMeh16-1) were downloaded from the NCBI. The genomes of Mg isolate BR29, five MoO isolates (FR13, GY11, PH14, TH12, and TH16), MoS isolate US71, MoE isolate CD156, and MoT isolate BR32 were downloaded from GEMO-INRA (Chiapello et al., 2015). The genomes of eight MoT isolates (PY36.1, PY86.1, PY0925, PY5003, PY5010, PY5033, PY6017, and PY6045), MoL isolate PGKY, and MoE isolate BR62 were obtained from Open Wheat Blast (Islam et al., 2016). The genomes and proteomes of five species in the family Magnaporthaceae, including Magnaporthe salvinii, Magnaporthiopsis incrustan, Magnaporthiopsis rhizophila, Ophioceras dolichostomum, and Pseudohalonectria lignicola, were obtained from Rutgers University (Zhang et al., 2018). We used sequences of the AVR proteins downloaded from the NCBI (Table 1) and 348 small secreted proteins of MoO strain 70-15 as effector candidates (Kim et al., 2016) to identify their homologous CDSs encoded by the collected genomes.
Genome Annotation, Repeat Annotation and Homology Search for the AVR and EFC Genes
The genomes of H. oryzae, two M. grisea and 11 M. oryzae isolates that did not have proteome information were annotated using Maker 2.31.8 (Cantarel et al., 2008) linked with Augustus 2.5.5 (Stanke and Morgenstern, 2005), Exonerate 2.2.0 (Slater and Birney, 2005), SNAP (Korf, 2004), CEGMA 2.5 (Parra et al., 2007), and GMHMM3 3.49 (Ter-Hovhannisyan et al., 2008) (Supplementary Table 1 and Supplementary Dataset 1)1. The annotated proteome data were combined with the publicly available data for the other isolates to construct the phylogenomic tree (see below). The homolog of each AVR (Table 1) or EFC protein was identified using the “protein2genome” option of Exonerate 2.2.0 (Slater and Birney, 2005). For each protein, we chose the best hit among identified CDS as its homolog. Sequence identity between each reference AVR or EFC protein and its homologs in other isolates was calculated using Sident in TrimAl 1.2 after sequence alignment using Mafft 7.273 (Capella-Gutierrez et al., 2009; Katoh and Standley, 2013). We included the coverage of aligned sequences in calculating sequence identity (Capella-Gutierrez et al., 2009). To study the genomic context of the AVR and EFC genes, we analyzed all the genomes using RepeatMasker 4.0.5 with fungal repeat library from RepBase (20160829) (Tempel, 2012).
Clustering Analysis and Construction of the Phylogenomic and Phylogenetic Trees
The predicted proteomes of all the isolates were clustered using OrthoFinder 1.1.2 based on the default BlastP parameter and the inflation value 1.5 (Emms and Kelly, 2015). A phylogenomic tree was constructed using protein sequences of the 2,245 SCO genes identified via a clustering analysis with Neurospora crassa as an outgroup. How we performed the clustering analysis is described in Supplementary Table 2. After aligning protein sequences in each orthogroup using Mafft 7.273 (Katoh and Standley, 2013), we trimmed the aligned sequences and identified conserved regions using TrimAl 1.2 (Capella-Gutierrez et al., 2009). The sequences of individual orthogroups were concatenated to perform a phylogenetic analysis via RAxML 8.2.9 (Stamatakis, 2014). The Maximum Likelihood (ML) tree was generated using the default new rapid hill-climbing algorithm and JTTF protein model. The Neighbor-Joining (NJ) tree was constructed using MEGA 7 with 500 bootstrapping replicates (Kumar et al., 2016). Phylogenetic trees of SCOs, AVRs, and EFCs were constructed using Fasttree v2.1.9 (Price et al., 2010). The unrooted phylogenetic trees were rooted using the minimum variance algorithm in the MinVar-Rooting tool (Mai et al., 2017) so that we could compare individual gene trees with the phylogenomic tree. We performed this comparison using TreeKO (Marcet-Houben and Gabaldon, 2011).
Evolutionary Diversity Analysis
The haplotype diversity (h) and nucleotide diversity (π) of SCOs, REFs, AVRs, and EFCs were calculated using DnaSP 6.10.01 (Rozas et al., 2017). The dN/dS ratio for each gene group was calculated using codeml in PAML 4.9e package (Yang, 1997). We used FastTree 2.1.9 (Price et al., 2010) to construct the gene trees used for calculating the average dN/dS ratio. We discarded the gene groups with the average dN/dS ratio of >10 because their high ratios were likely caused by inaccurate sequence alignment during the automatic trimming and alignment of sequences.
Gene Expression Analysis
We analyzed transcriptome data from MoO isolate KJ201 (Jeon et al., 2019) and Bangladesh MoT isolate 12, a strain closely related to BR32 (Saunders et al., 2017). The data for KJ201 covered the mycelial stage in culture and the host infection stage at multiple time points [18, 27, 36, 45, and 72 h post-inoculation (hpi)]. The transcriptome data of Bangladesh isolate 12 were generated using field-collected wheat plants that displayed blast symptoms and those that look asymptomatic. We downloaded these data sets from the NCBI (SRA accession no. SRX5076910-SRX5076915) and Open Wheat Blast (Asymptomatic: LIB21748 and Symptomatic: LIB21752) (Saunders et al., 2017), respectively. Read mapping to the corresponding genomes was performed using HISAT2-2.0.5 (Kim et al., 2015). Because the genome of Bangladesh isolate 12 has not yet been sequenced, we used the genome of MoT isolate BR32 to map the transcriptome data. We used GFOLD v1.1.4 to conduct read counting (Feng et al., 2012).
Results
Distribution Pattern of the Proteins Homologous to M. oryzae AVRs
We mined the genes homologous to the previously characterized AVR (Table 1) and EFC (Kim et al., 2016) genes from the genomes of 31 isolates corresponding to five pathotypes of M. oryzae. The published annotation of the MoO strain 70-15 genome did not include the Avr-Pia and Avr-Pib genes. However, we discovered these genes via genome re-annotation (Supplementary Figure 1 and Supplementary Table 3), underscoring the importance of genome re-annotation for accurate comparative genomic studies. We analyzed how these AVR and EFC genes are distributed and structured in light of the phylogenomic relationship among the analyzed isolates. The genomes of three M. grisea isolates from Digitaria and one isolate each for eight species in the family Magnaporthaceae were also included in this analysis. A phylogenomic tree built using 2,245 SCO genes shows the clustering of M. oryzae isolates into monophyletic clades corresponding to the host of origin, and M. grisea isolates are distinct from the M. oryzae isolates (Figure 1A). The M. oryzae isolate tree based on a coalescent method (Gladieux et al., 2018) and the Neighbor-Joining tree (Supplementary Figure 2) also supported this pattern.
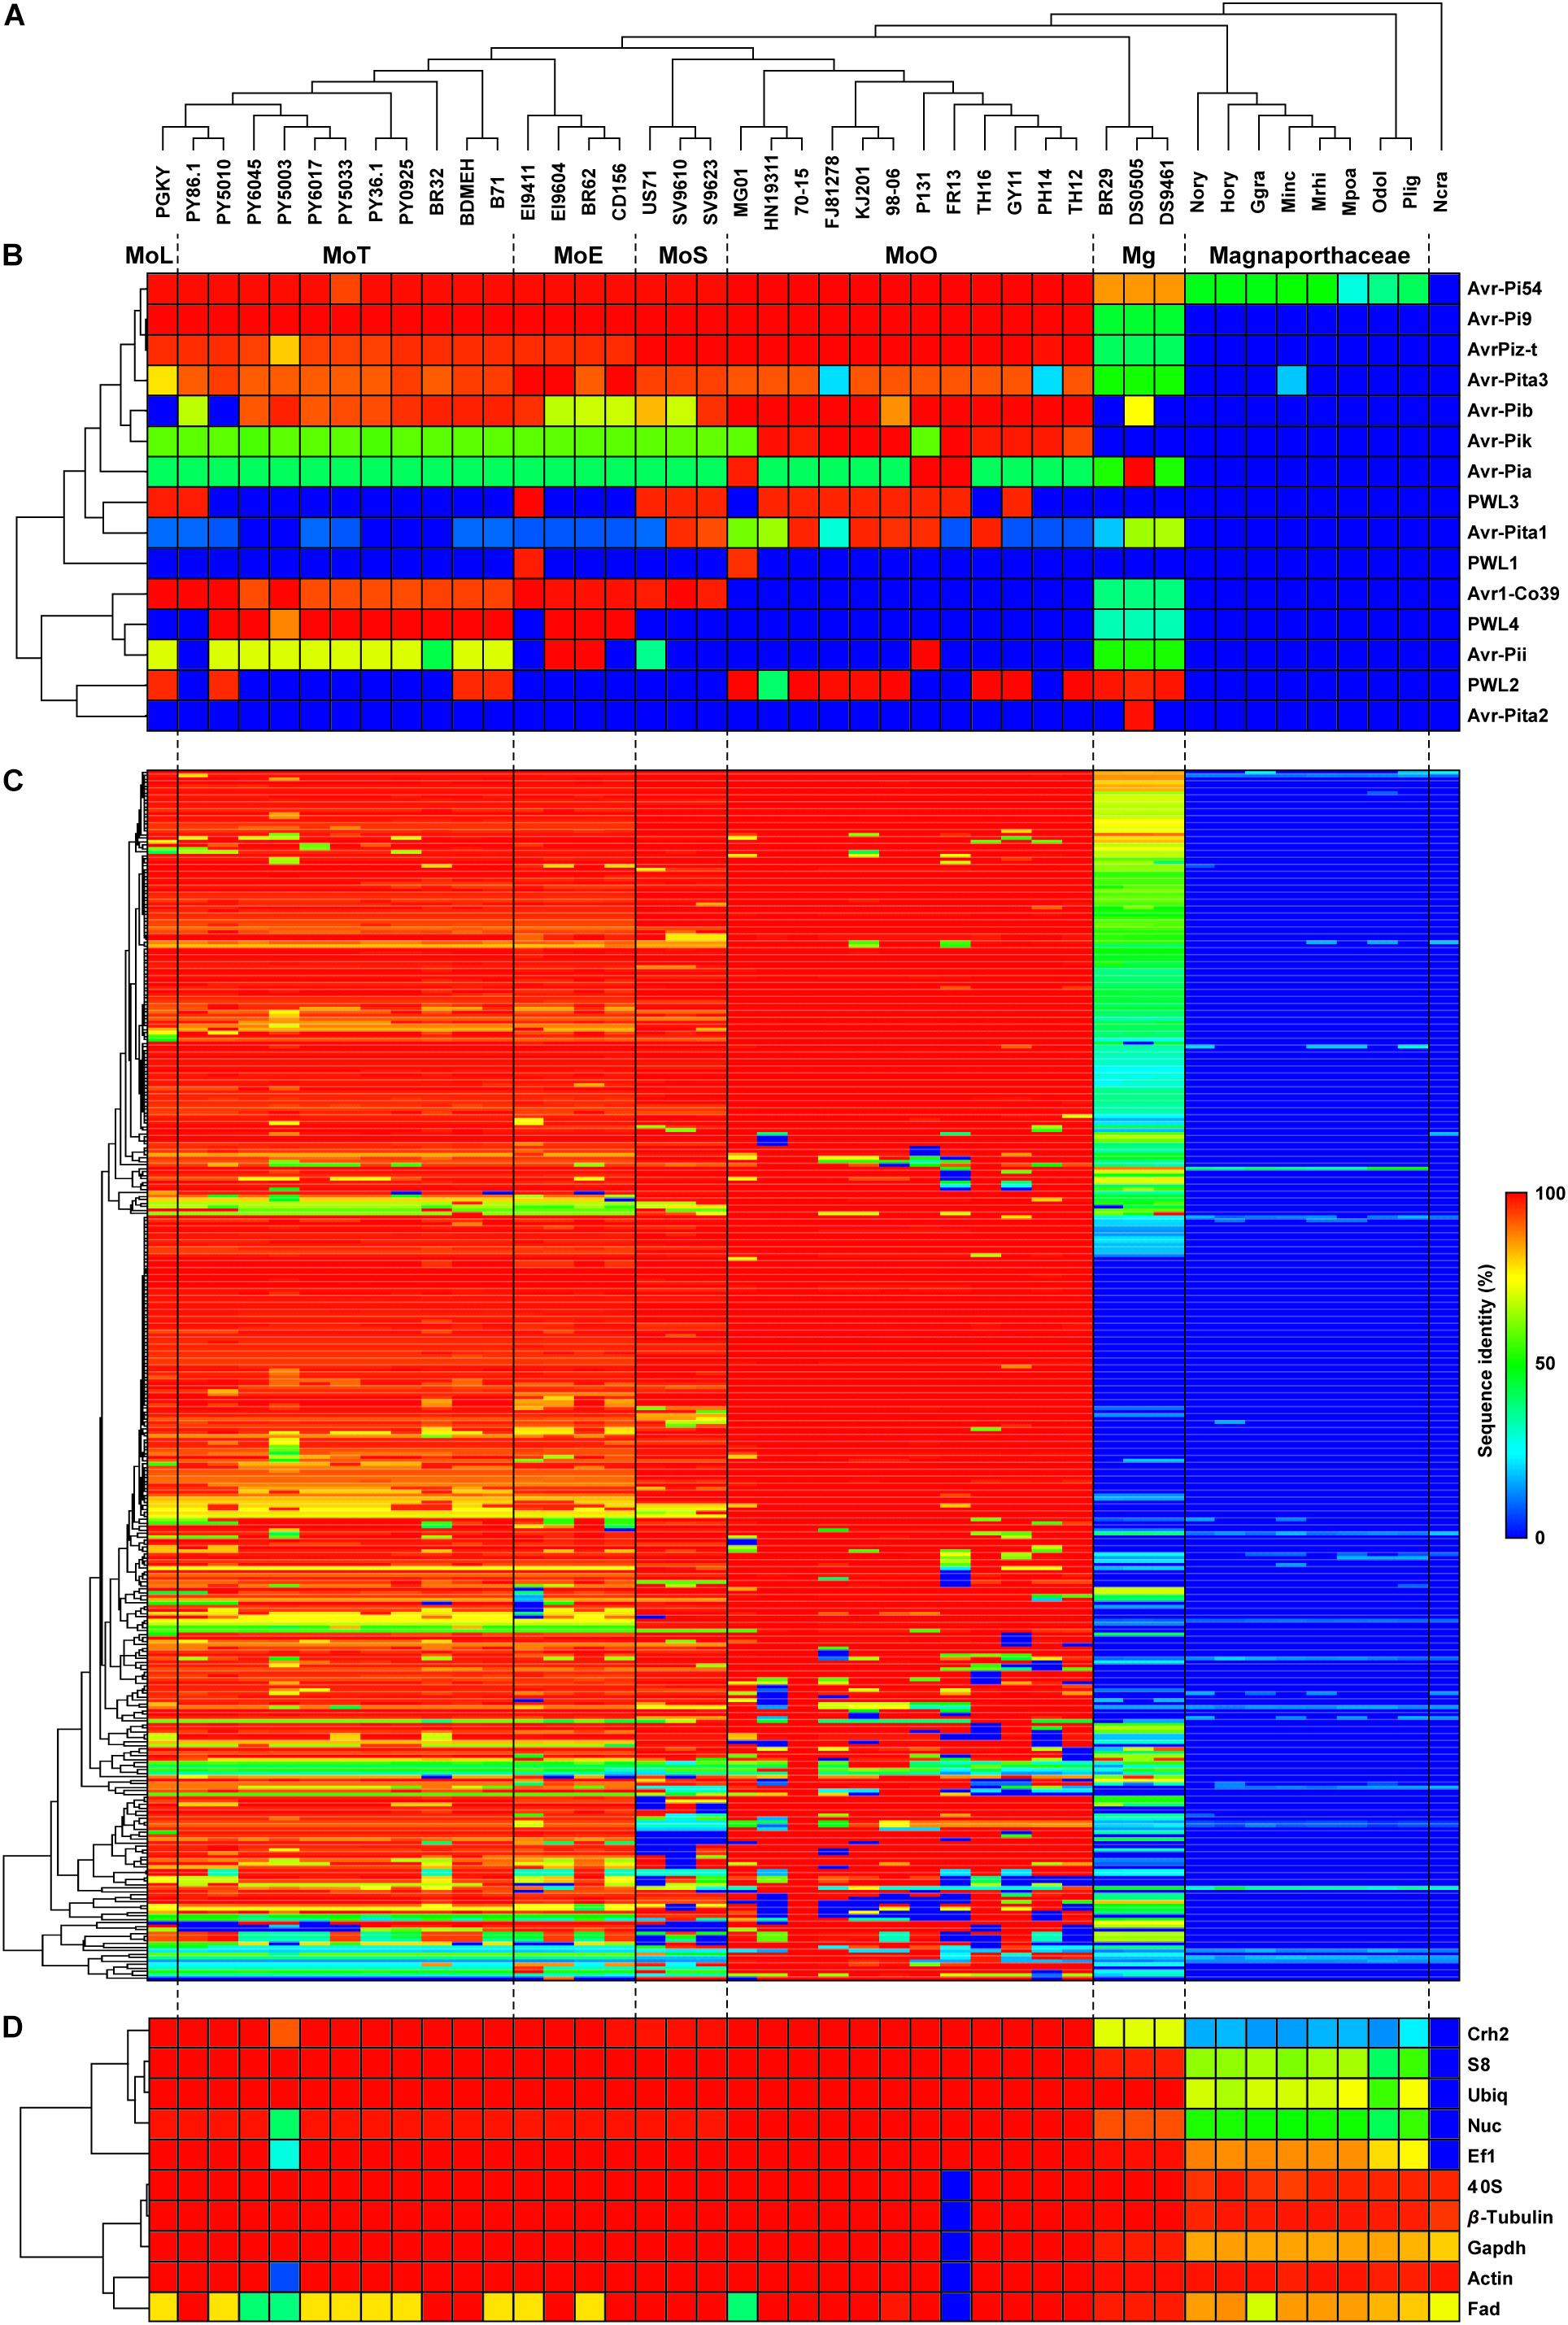
Figure 1. Distribution patterns of the AVR and EFC proteins encoded by M. oryzae, M. grisea and other Magnaporthaceae species. (A) A phylogenomic tree of the isolates/species analyzed in this study was constructed using 2,245 SCO gene products. The pathotype of each M. oryzae isolate is abbreviated according to the host of origin: Lolium (MoL), Triticum (MoT), Eleusine (MoE), Setaria (MoS), and Oryza (MoO). Isolates of M. grisea from Digitaria are designated as Mg. (The species in the family Magnaporthaceae are abbreviated as follows: Nory (Nakataea oryzae), Hory (Harpophora oryzae), Ggra (Gaeumannomyces graminis), Minc (Magnaporthiopsis incrustans), Mrhi (Magnaporthiopsis rhizophila), Mpoa (Magnaporthiopsis poae), Odol (Ophioceras dolichostomum), and Plig (Pseudohalonectria lignicola). Neurospora crassa, abbreviated as Ncra, is used as an outgroup. (B) A hierarchically clustered heatmap based on the degree of protein sequence identity depicts the presence/absence of the known AVR genes. (C) The heatmap for 348 EFCs, constructed using the data in Supplementary Table 4, is shown. (D) The heatmap for housekeeping REFs is shown.)
Some AVR genes are present in both M. oryzae and M. grisea isolates, while others are present only in a single clade/pathotype (Figure 1B). The Avr-Pi54, Avr-Pi9, AvrPiz-t, and Avr-Pita3 proteins are highly conserved in M. oryzae, and the sequences of their homologs in M. grisea have diverged from those encoded by M. oryzae at varying degrees. All Magnaporthaceae species carry a gene that encodes a protein exhibiting 37–51% identity to Avr-Pi54, but only M. incrustans appears to carry a gene encoding an Avr-Pita3-like protein. Sequences of Avr-Pib, Avr-Pik, and Avr-Pia in M. oryzae varied widely with the degree of identity ranging from 41 to 100% compared to the ones used to mine them. Only M. oryzae isolates encode Avr-Pik, but highly conserved Avr-Pia and Avr-Pib are encoded by Mg isolate DS0505. Only the MoO isolates do not encode the Avr1-Co39 protein in M. oryzae. Two MoE, one MoO isolate, and all MoT isolates, except PY86.1, carry a gene that encodes a protein highly similar to Avr-Pii (72% identity). For the Avr-Pita gene family, Avr-Pita3 is present in all isolates, Avr-Pita1 is mainly present in MoO and MoS isolates, and only Mg isolate DS0505 carries Avr-Pita2. Members of the PWL host-specificity gene family sporadically appeared.
Distribution Pattern of the Proteins Homologous to the 70-15 EFCs
Our Exonerate-based genome re-annotation uncovered many EFC-encoding genes that could not be identified via a BlastP-based search (Figure 1C and Supplementary Figure 3). The hierarchical clustering of EFC proteins showed the pattern of distribution that is similar to that for AVRs (Figure 1B) but different from that for REFs (Figure 1D). We determined the sequence identity between the 70-15 EFCs and their homologs in each isolate (Supplementary Table 4). Both the number of EFCs in each isolate (Figure 2A) and the average number of EFCs in each pathotype (Figure 2B) were subsequently analyzed using different levels of identity as filters. At the level of >30% identity, all M. oryzae isolates encode homologs of most 70-15 EFCs. However, we could detect homologs in Magnaporthaceae species but found 157 homologs in Mg isolates at this level (Figure 2A). The MoL, MoT, and MoE isolates encode slightly more homologs than the MoS and MoO isolates, but the difference was small and varied among isolates within individual pathotypes. For example, 11 MoT isolates had 346–347 homologs, whereas MoO isolates FR13 and HN19314 had 320 and 329, respectively. Except for Mg, the average number of homologs in each pathotype only slightly decreased until the identity of 90% or higher was applied (Supplementary Figure 4). The numbers rapidly decreased in all pathotypes except MoO at levels higher than 90% identity (Figure 2B and Supplementary Figure 4). The average number of homologs in MoO stayed approximately 300 until up to the level of 98% identity and only slightly decreased even at the level of 100% (Supplementary Figure 4). At the level of 100% identity, the number of homologs in the MoL, MoT, and MoE isolates ranged from 40 (MoE; EI9411) to 73 (MoT; PY5010). Consistent with their phylogenomic relationship with the MoO isolates, the MoS isolates encode more homologs than the other pathotypes (Figure 2B). If we assume those with a sequence identity of >30% as homologs, 332 genes (95.4% of the total) are present in all M. oryzae pathotypes with only 2 (0.6%) being specific to MoO (Figure 2C). When ≥98% identity was used, 119 (34.2%) genes are present in all M. oryzae pathotypes (Figure 2D). Because many EFC gene products encoded by the Mg isolates highly diverged from those encoded by 70-15, making their comparative analyses difficult with those encoded by M. oryzae, we excluded them from subsequent analyses.
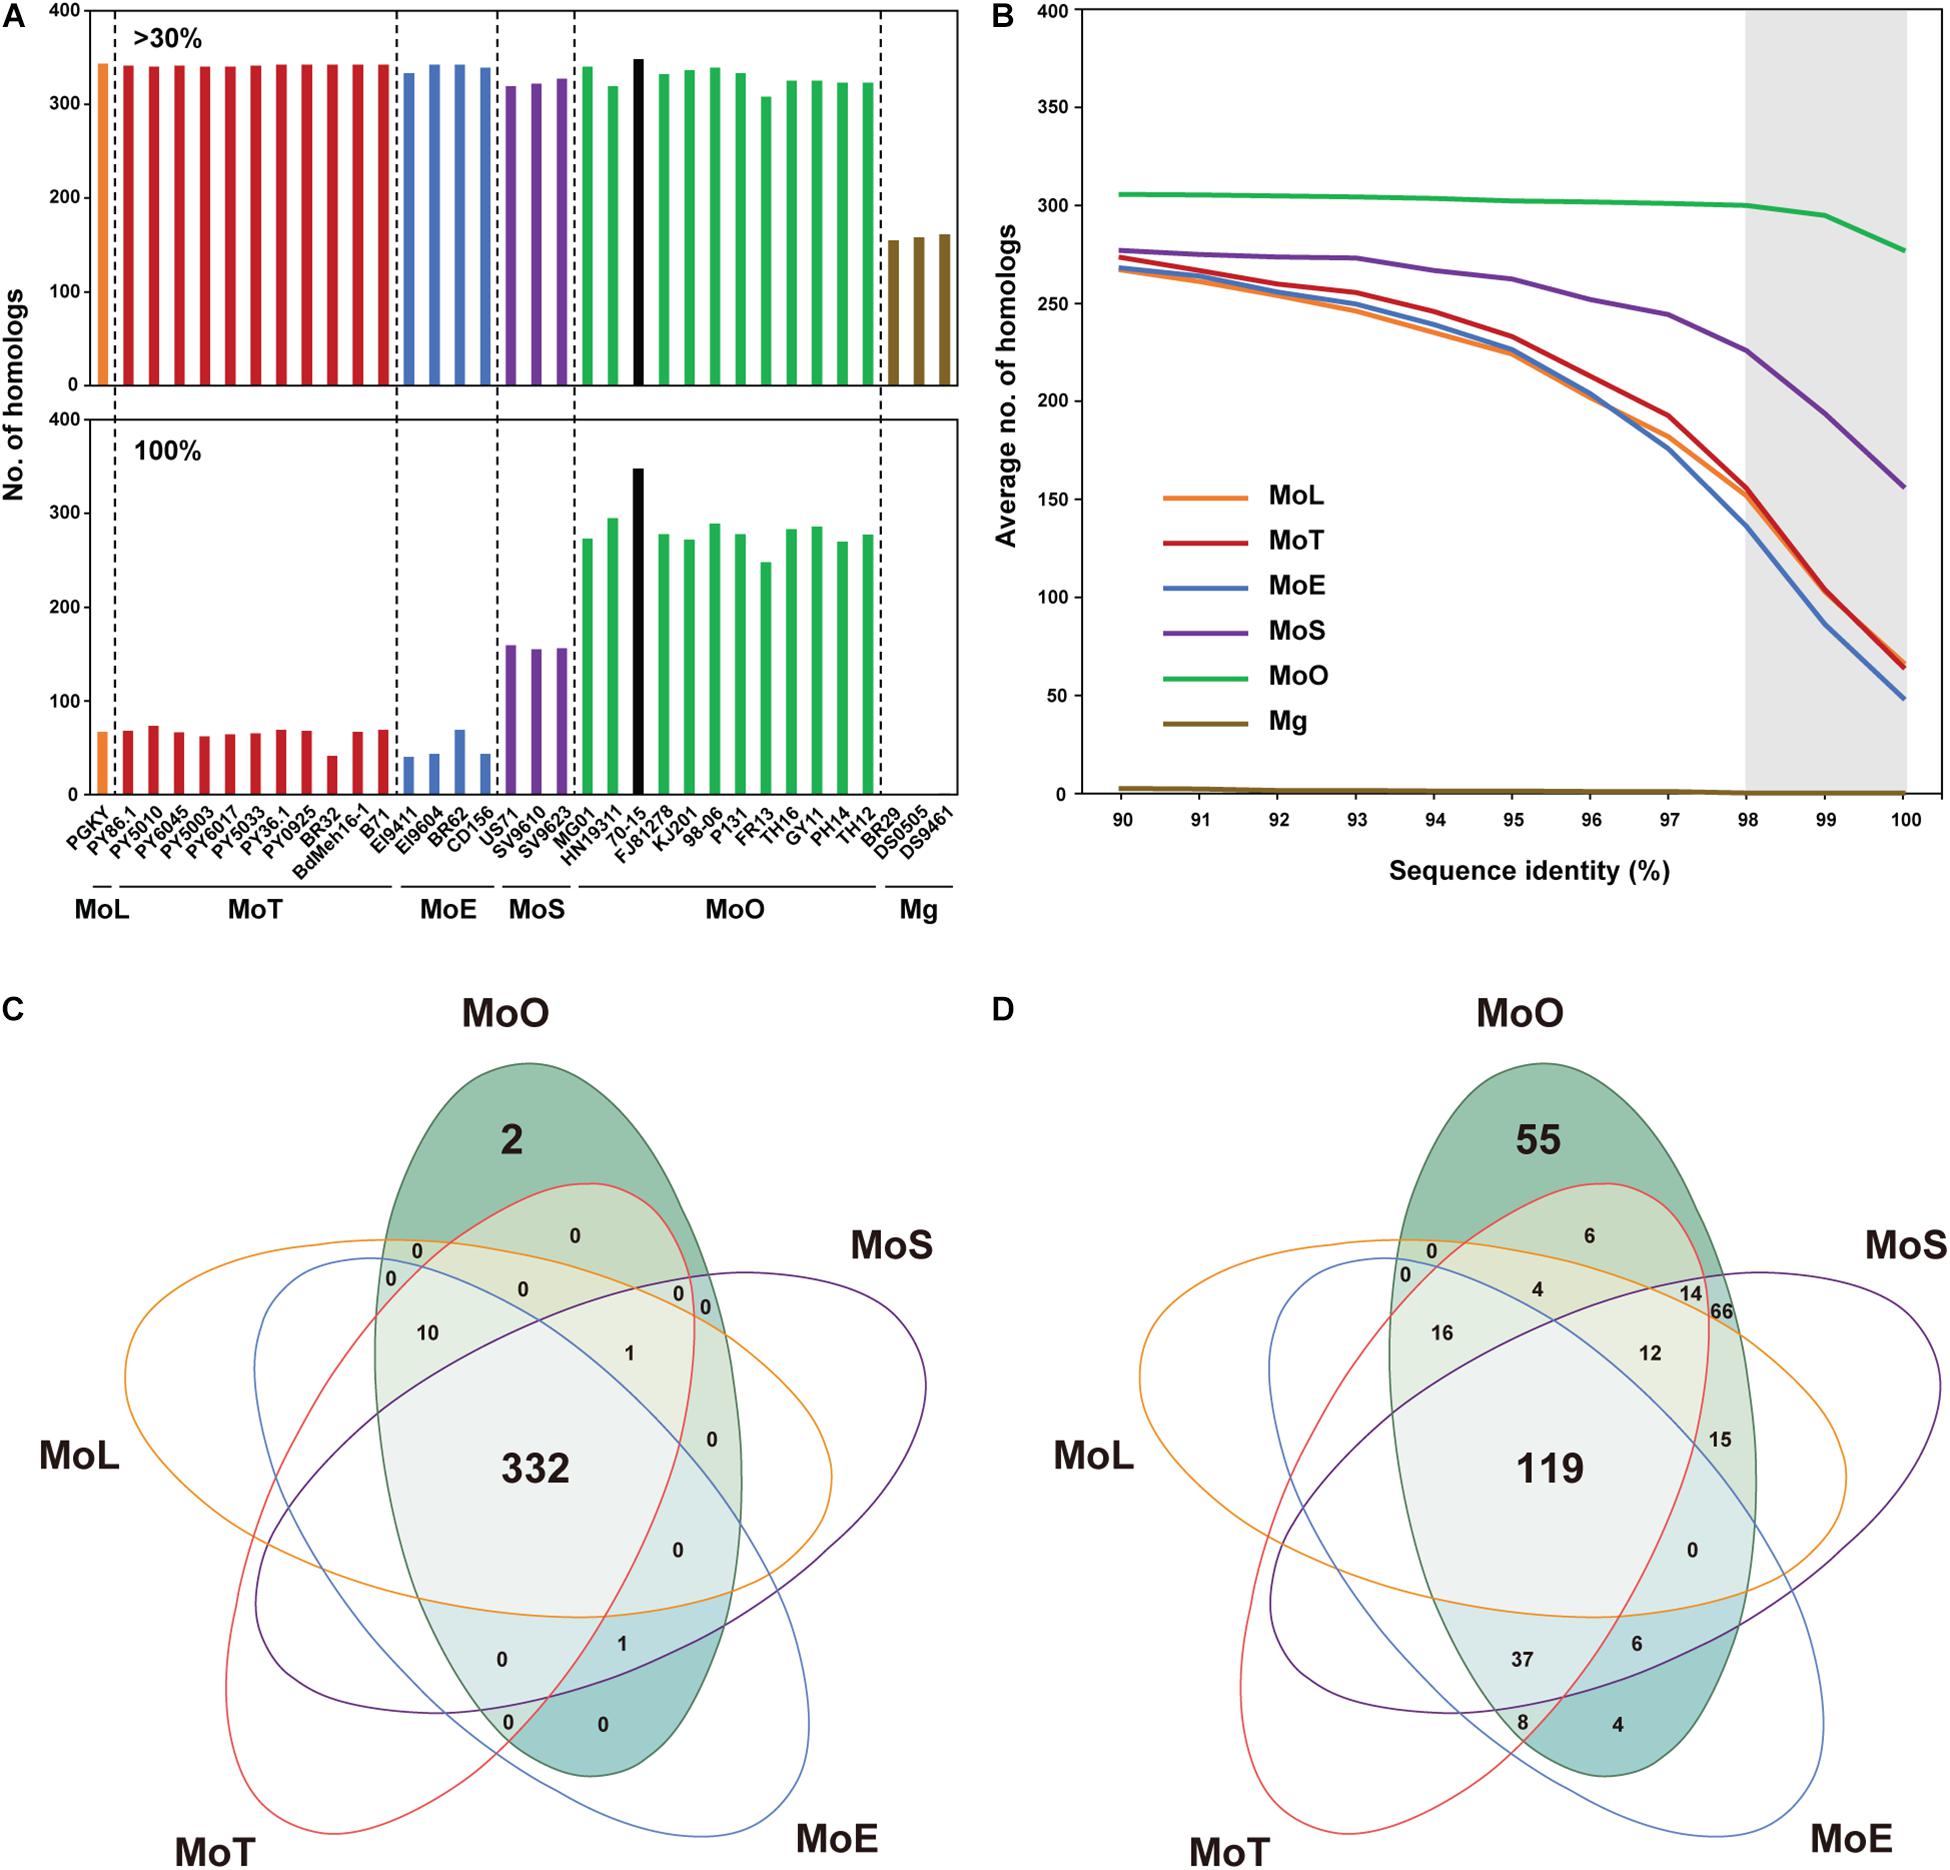
Figure 2. Distribution pattern of the proteins homologous to the 70-15 EFCs. (A) The number of EFC proteins homologous to those encoded by strain 70-15 (black bar) in each Magnaporthe isolate, identified via Exonerate, is shown. Data collected using two levels of sequence identity (>30% and 100%) are presented. Each pathotype is color-coded: MoL (orange), MoT (red), MoE (blue), MoS (purple), MoO (green), and Mg (brown). (B) The average numbers of EFCs that exhibit 90–100% sequence identity to their homologs in 70-15 are shown. The gray shading indicates those that display 98–100% sequence identity. The number of EFC homologs shared among the pathotypes at the level of (C) 30% and (D) ≥98% sequence identity is noted. The list of EFCs in each set is noted in Supplementary Table 4.
Structural and Sequence Variation of the EFC Genes in Different M. oryzae Pathotypes
Certain structural changes in AVR genes allow pathogens to avoid recognition by host resistance gene products (Sánchez-Vallet et al., 2018). We analyzed the EFC genes encoded by individual M. oryzae isolates using Exonerate to analyze their variation within M. oryzae (Supplementary Table 5). Some EFC genes displayed variation(s) at 5′-end, 3′-end, or both ends (Figure 3A). Not surprisingly, most SCO genes are intact in all isolates, but we found some that appeared to exhibit structural variation compared to their homolog in 70-15 (Figure 3B). The proportion of the EFC genes exhibiting structural variation was larger than that of SCOs in all isolates except FR13. The aligned CDS of MGG_12090, MGG_17250, and MGG_17590 illustrate three types of structural variation observed (Figure 3C). In MGG_12090, an insertion or deletion of T in some isolates appears to have caused its 5′-end variation. We also found two substitutions (G/C and A/G) at both sides of the splicing sites of the second intron (Supplementary Figure 5A). We detected the indel and G/C substitution in some MoS, MoE, MoT, and MoL isolates and the A/G substitution in all pathotypes, except MoO. The 3′-end variation in MGG_17250 was caused by a C/T substitution present at one splicing site among all MoO isolates (Supplementary Figure 5B). The high degree of variation observed at the ends of MGG_17590 is due to the presence of paralogs in some isolates (Supplementary Figure 5C).
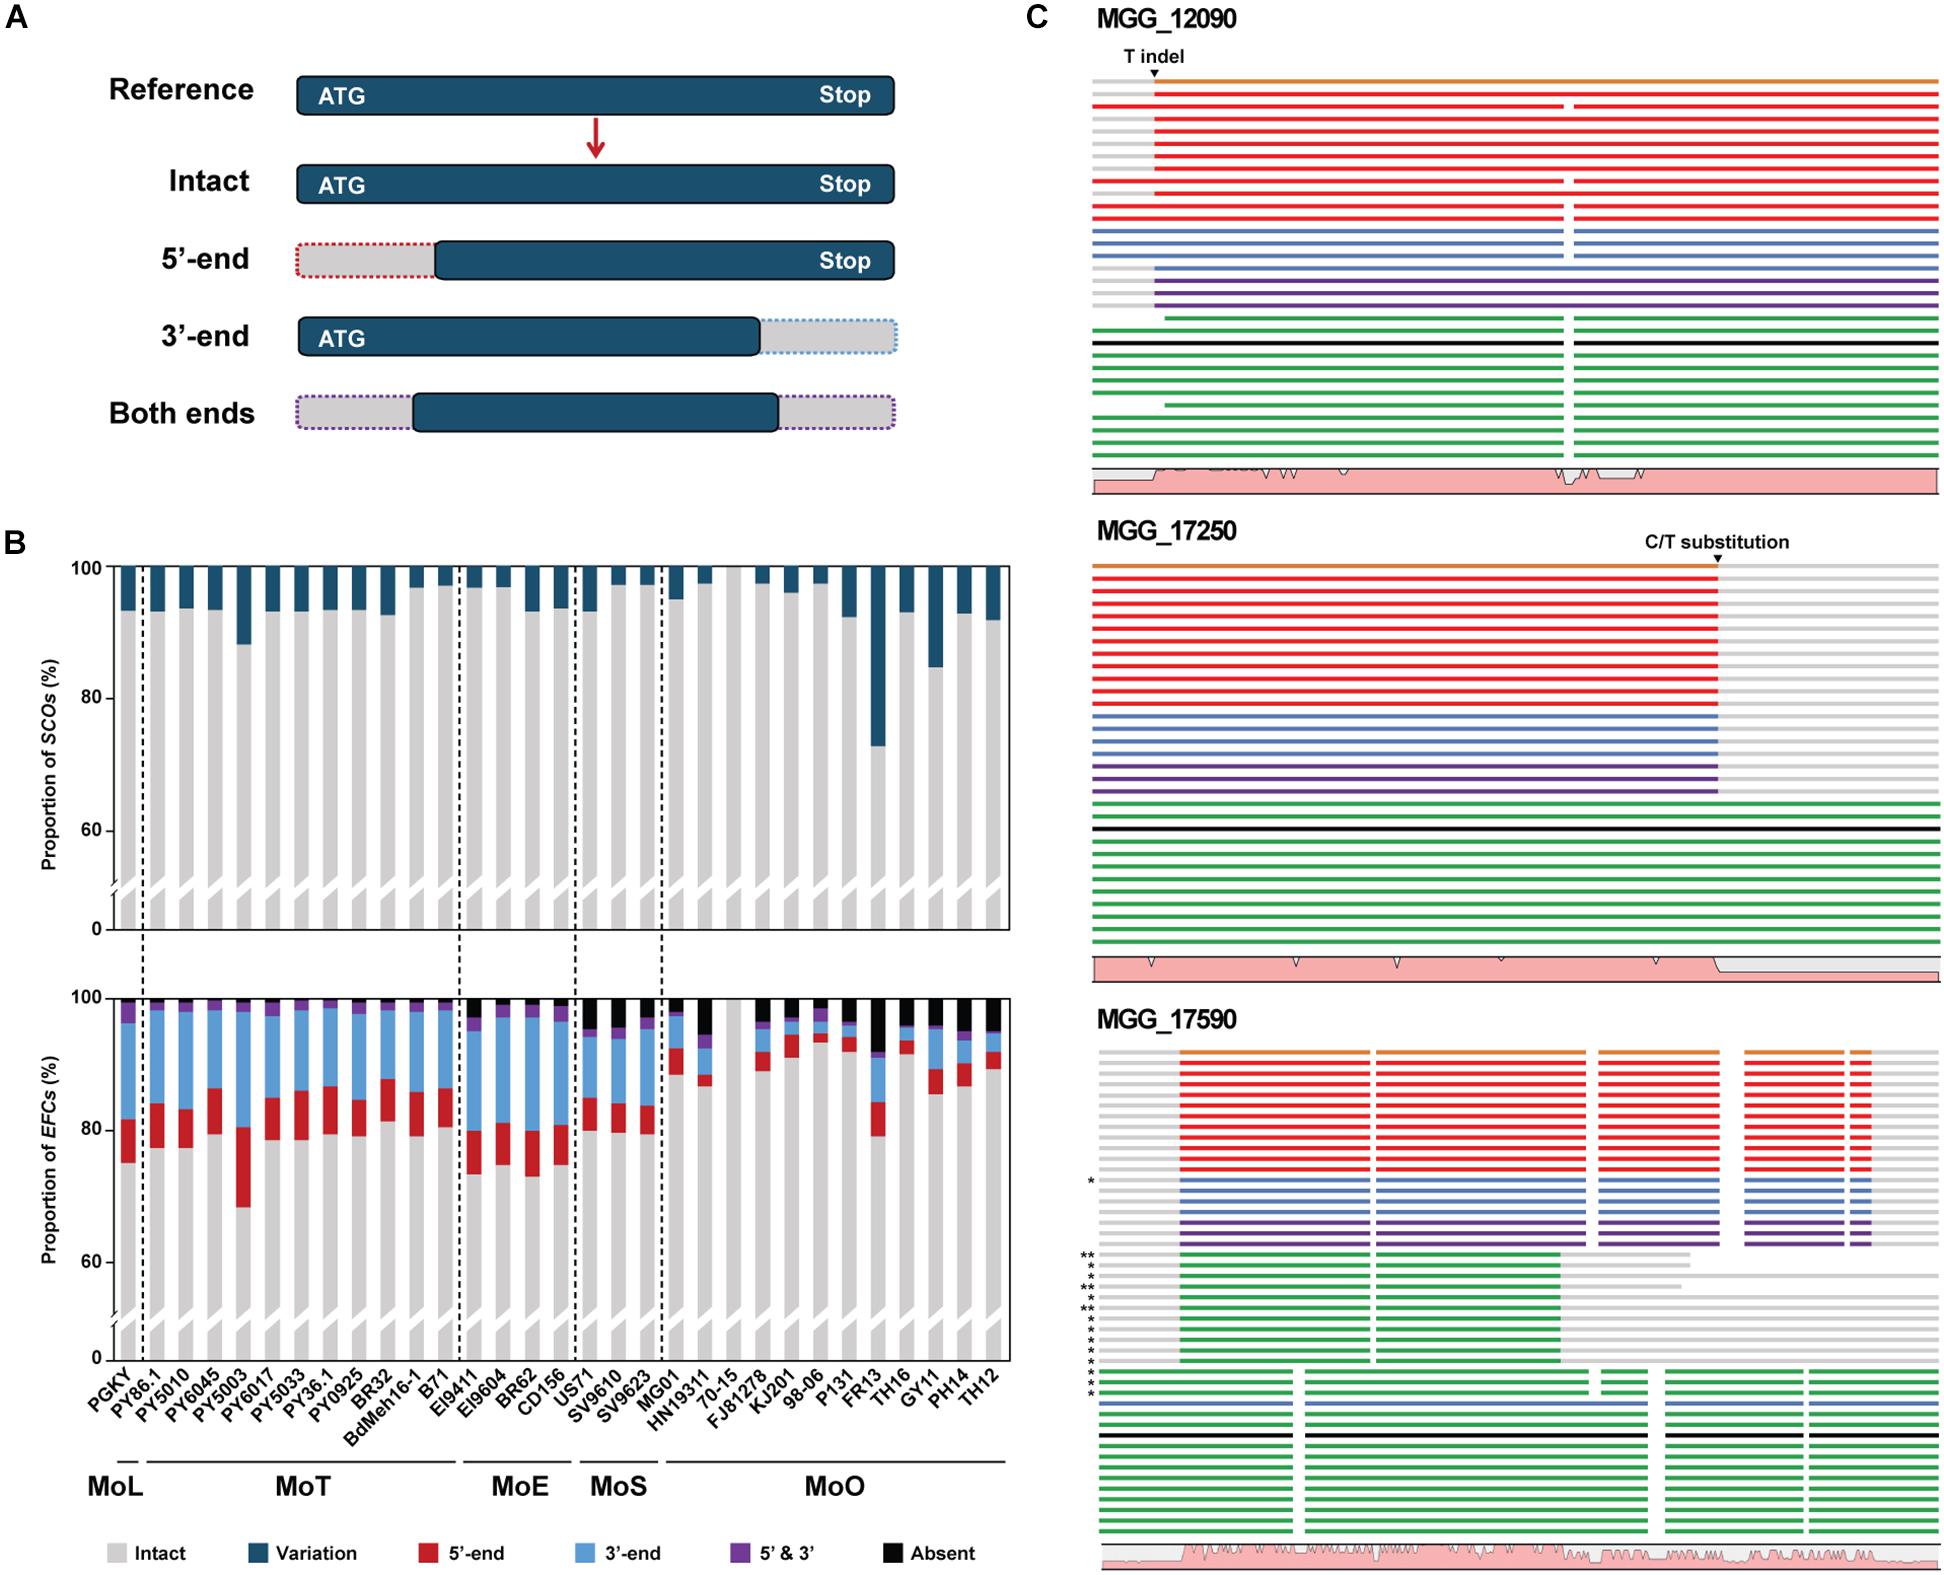
Figure 3. Characteristics of the structural variations in the SCO and EFC genes in M. oryzae isolates. (A) A schematic diagram depicting the types of gene structural change found using Exonerate. (B) The proportions of SCO (top) and EFC (bottom) genes in each isolate are shown. The proportions of the SCOs with structural variation (teal) and the EFCs detected to be truncated at 3′-end (blue), 5′-end (red) or both ends (purple) are noted. The proportion of the genes absent is noted in black. (C) Three examples of structural variation observed in CDS, including 5′-end variation, 3′-end variation, and variation at both ends, are shown. The isolates in the alignments follow their order in the phylogenomic tree. The reference genes encoded by MoO 70-15 are labeled black, and their homologs encoded by MoO, MoS, MoE, MoT, and MoL isolates are labeled green, purple, blue, red, and orange, respectively. For MGG_17590, asterisks are used to indicate the second (∗) and third (∗∗) best hits. The graph at the bottom of each alignment shows the degree of sequence conservation. Their full sequence alignment is shown in Supplementary Figure 5.
Genomic Contexts of the AVR and EFC Genes
Based on the ‘two-speed genome model’ (Dong S. et al., 2015), we hypothesized that the EFC and AVR genes in M. oryzae would be located in regions that likely undergo frequent changes. We analyzed their association with repetitive elements and the distance to neighboring genes (=intergenic length) and compared observed patterns with those associated with the SCO genes. The AVR genes in 70-15 are located in repeat-rich regions and have longer 5′ and 3′ intergenic lengths compared to its SCOs (Supplementary Figures 1, 6). Likewise, most EFC genes have longer 5′- and 3′-intergenic lengths compared to the SCOs (Supplementary Figure 7).
In 70-15, 40.5% of the EFC genes are associated with TEs, which is the highest among all isolates (Supplementary Table 6). The average proportion of the EFCs associated with TEs among the MoO isolates was 25.3%, but in other pathotypes, it is lower (18.9% for MoT, 16.1% for MoE, and 16.5% for MoS). Although the TEs flanking some EFC genes are conserved across all pathotypes/isolates analyzed, in most cases, their homologs in different isolates are associated with different TEs or lack them (Figure 4A). For example, MGG_14195 is highly conserved in all M. oryzae pathotypes, but its flanking regions varied a lot (Figure 4B). MGR583 is present at the 3′-region in 70-15 and some MoO isolates but is absent in other MoO isolates and different pathotypes (Figure 4B). We investigated whether the presence of TEs in flanking regions potentially influenced the degree of sequence/structural variation (Supplementary Figure 8 and Supplementary Tables 4, 5). Compared to homologs of the EFC genes that do not have TEs in the flanking regions in 70-15, those associated with TEs displayed higher variation (Supplementary Figure 8).
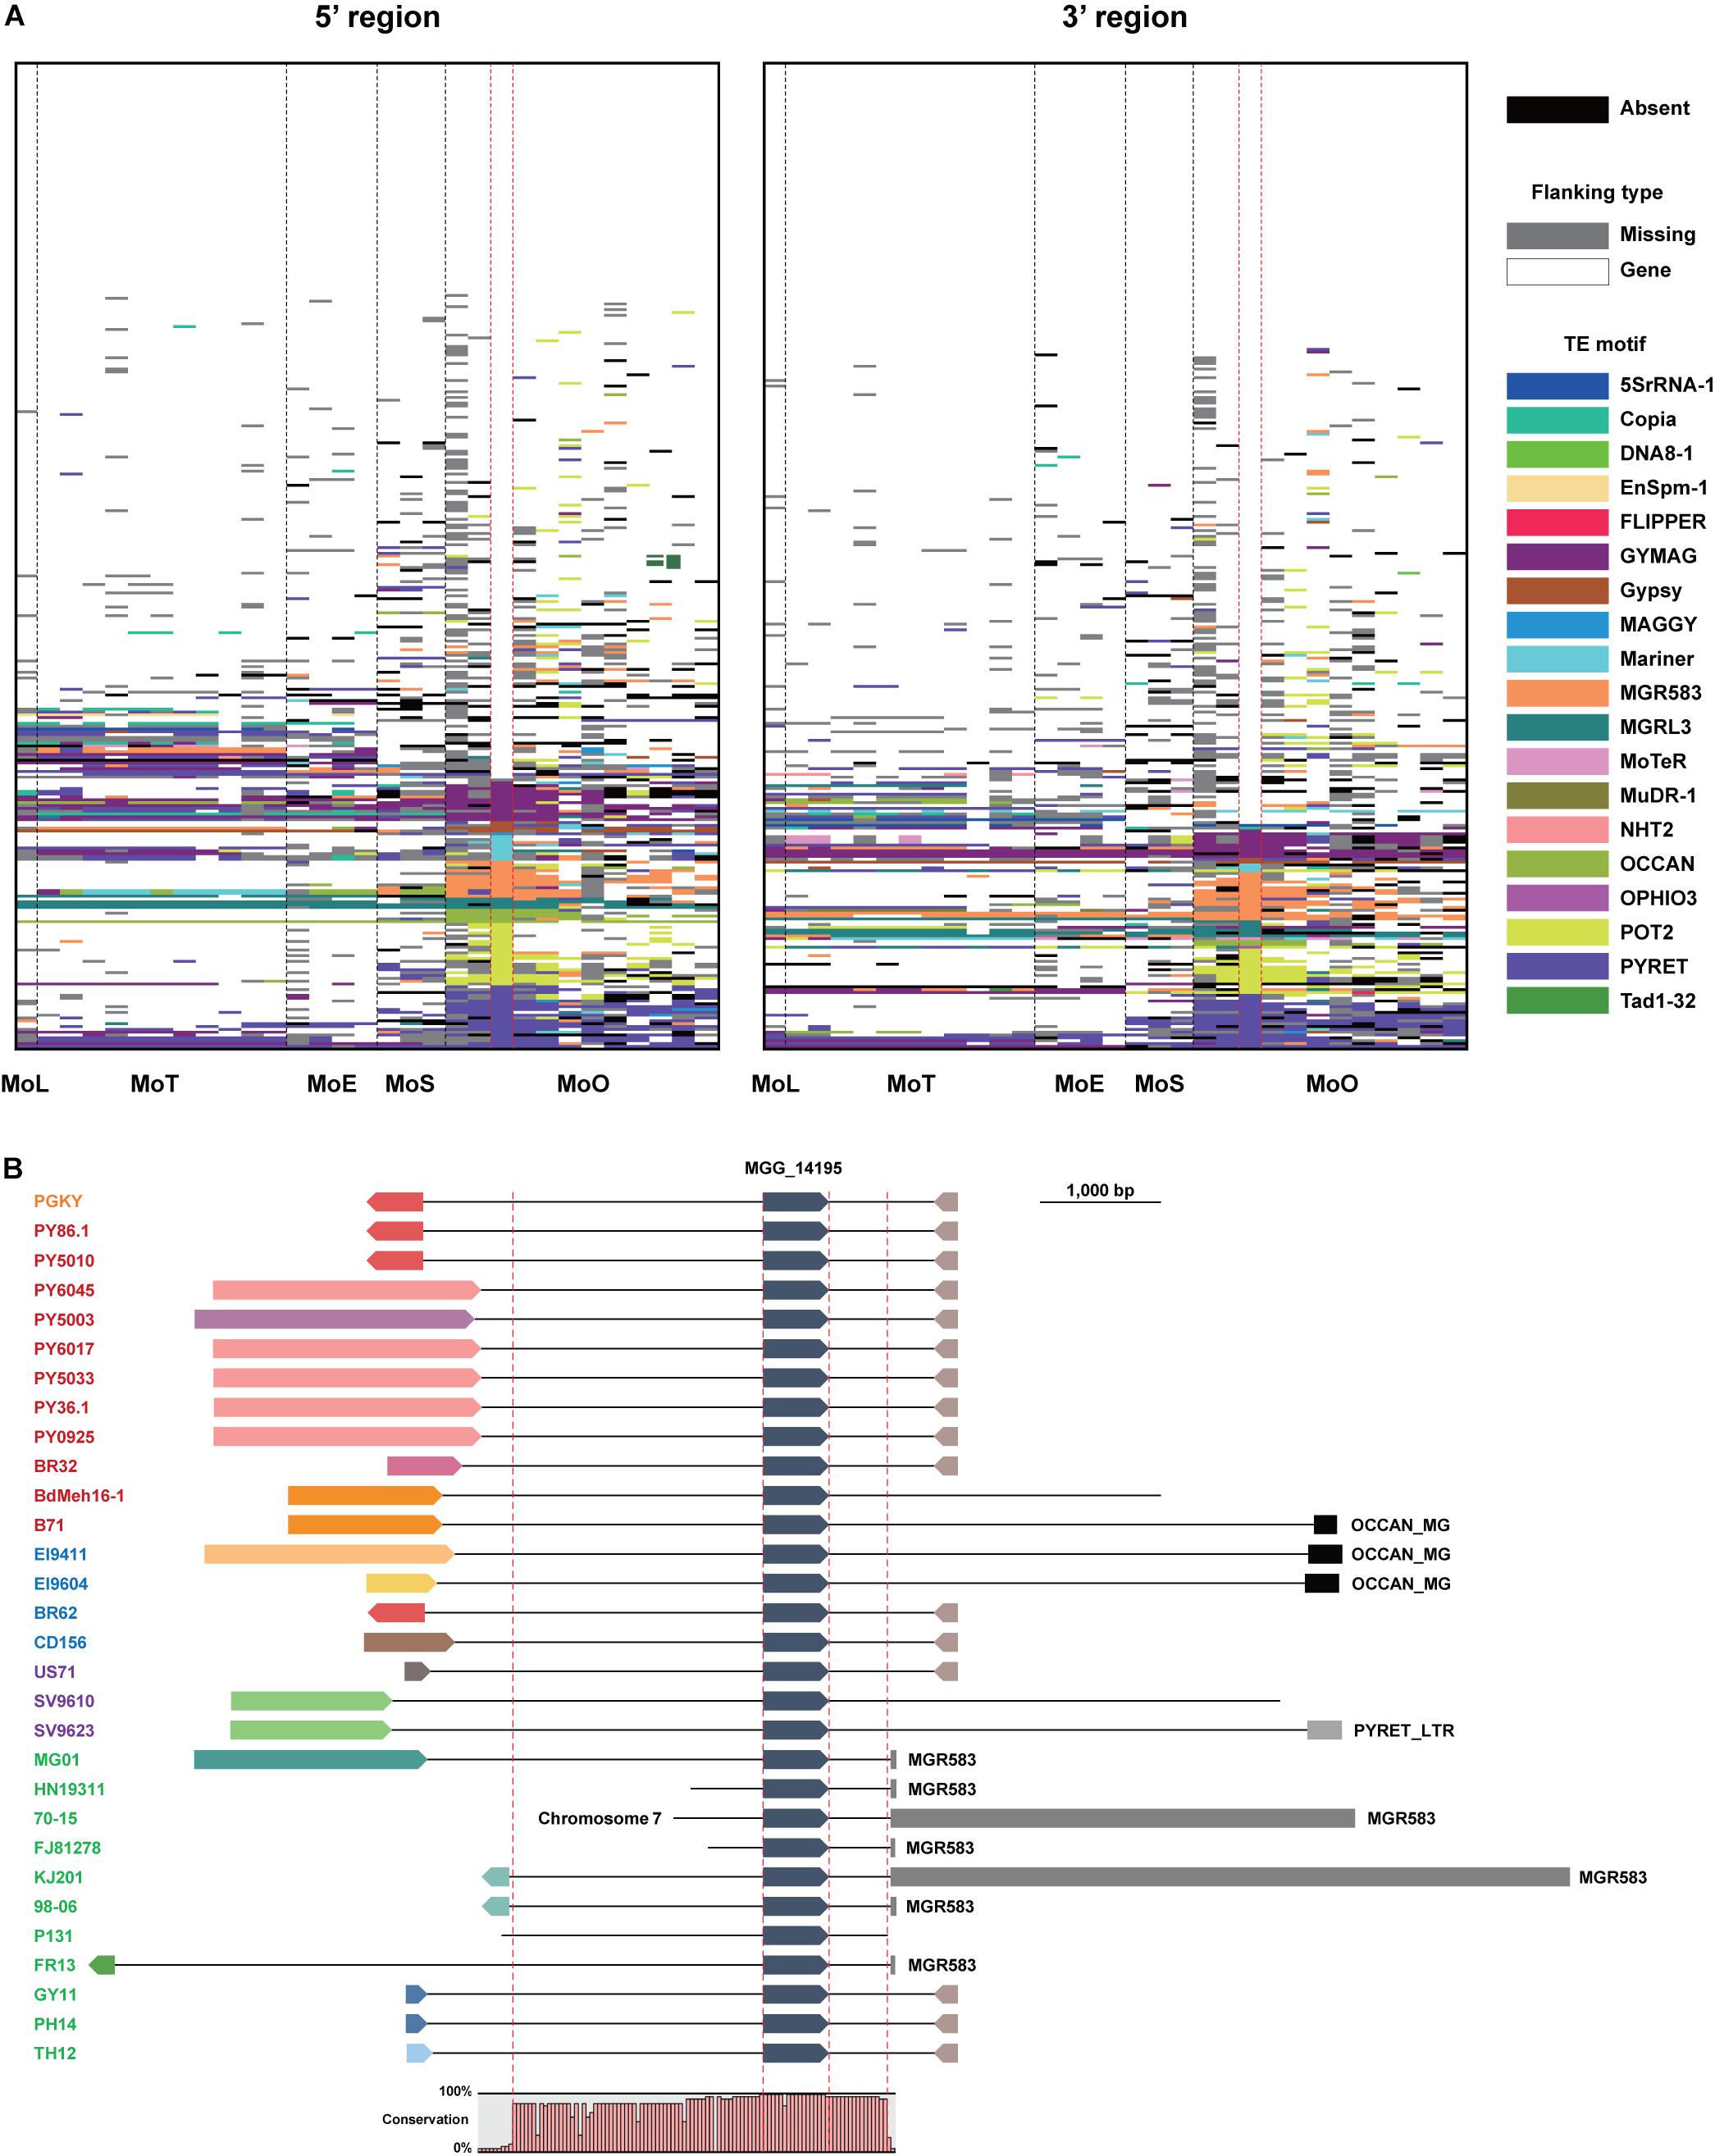
Figure 4. Transposable elements flanking the EFC genes in different M. oryzae isolates. (A) Transposable elements (TEs) present at the 5′ and 3′ regions of the EFC genes in different pathotypes are shown. Those present in strain 70-15 are shown between dashed red lines. The absence of each EFC is noted black, and the presence of a gene in its flanking regions is noted in white. If there is no element in flanking regions of EFC due to the end of a contig, it is shown in gray. Different TE motifs are denoted using multiple colors. (B) The flanking regions of MGG_14195 in strain 70-15 and its homologs in other M. oryzae isolates are shown. The isolates analyzed are color-coded: MoO (green), MoS (purple), MoE (blue), MoT (red), and MoL (orange). They were presented following the order shown in the phylogenomic (Figure 1A). The directionality of the gene and flanking genes are indicated. The conserved region in their sequences was examined using Mugsy, a genome alignment tool (Angiuoli and Salzberg, 2011). The whole contig alignment shows the region covering the gene, and its conserved flanking regions are shown between red dashed red lines (2,551 and 553 bp).
Evolution of Some AVR and EFC Genes Looks Discordant With the Evolution of M. oryzae
To investigate how the EFC genes have evolved within M. oryzae, we compared the 348 phylogenetic trees built using individual EFC genes with the phylogenomic tree shown in Figure 1A. We delineated the degree of congruence via the strict distance (d), which represents the similarity between two trees (Marcet-Houben and Gabaldon, 2011). Two trees are considered congruent if d is less than 0.5 and incongruent if d is between 0.5 and 1. We could not analyze approximately 4.8% of the SCO genes and 3.4% of the EFC genes because they are identical among all isolates. Some phylogenies are congruent with the evolution within M. oryzae, but some are not (Figure 5). The proportions of incongruent and congruent SCO-based phylogenies are 47.2 and 48.0%, respectively, but the proportion of incongruent phylogenies (62.2%) is much higher than that of congruent ones (33.3%) for EFCs. For the AVR genes, due to a combination of their high degrees of sequence variation and the presence of paralogs (Figure 1B), all phylogenies did not follow the phylogenomic relationship (Supplementary Figure 9). Results from the analysis of individual AVR genes are shown in Supplementary Figures 10–19.
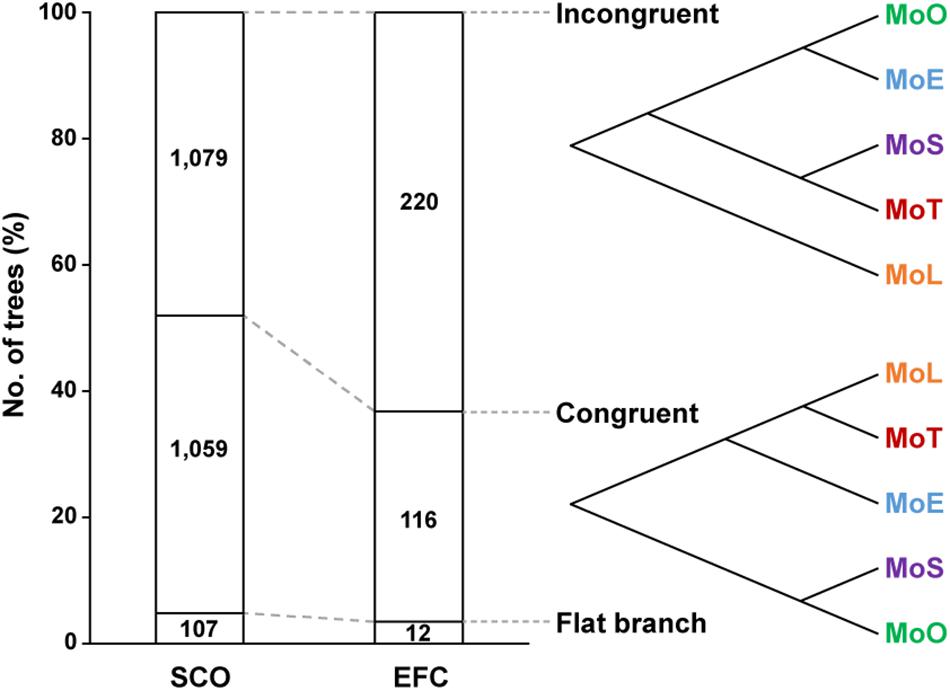
Figure 5. Patterns of the evolution of the SCO and EFC genes. The phylogenetic trees built using the SCO and EFC genes are grouped into those that are incongruent (d ≥ 0.5) with the phylogenomic tree (Figure 1A), those that are congruent (d < 0.5) and those caused flat branch due to perfectly conserved sequences. An example of each case is shown.
Nucleotide Polymorphisms Associated With the AVR and EFC Genes and the Selection Pressure on These Genes
We determined the haplotype diversity (h), nucleotide diversity (π), and average dN/dS ratio (ω) of the SCOs, REFs, AVRs, and EFCs to evaluate how natural selection has influenced their evolution. We also determined the h, π, and ω of the EFCs in different pathotypes to examine the likely effect of host adaptation on their evolution. The haplotype diversity of a gene of interest represents its uniqueness within a population analyzed, and the nucleotide diversity represents average nucleotide differences among sampled DNA sequences (Nei, 1987). The Wilcoxon rank sum statistical test indicated that the haplotype and nucleotide diversities of AVRs and EFCs are higher than those of SCOs and REFs (Figures 6A,B). Among the AVRs, PWL exhibited the highest haplotype and nucleotide diversities, and Avr-Pi54 displayed no variation. The nucleotide diversities of most AVRs, including PWL, Avr-Pii, Avr-Pik, Avr-Pita, Avr-Pia, and Avr-Pib, are similar to those displayed by the outliers of EFCs (Figure 6B). The haplotype diversity distribution of EFCs among four pathotypes varied significantly (Figure 6C), but the nucleotide diversity distribution was different only between MoT/MoE and MoS/MoO (Figure 6D).
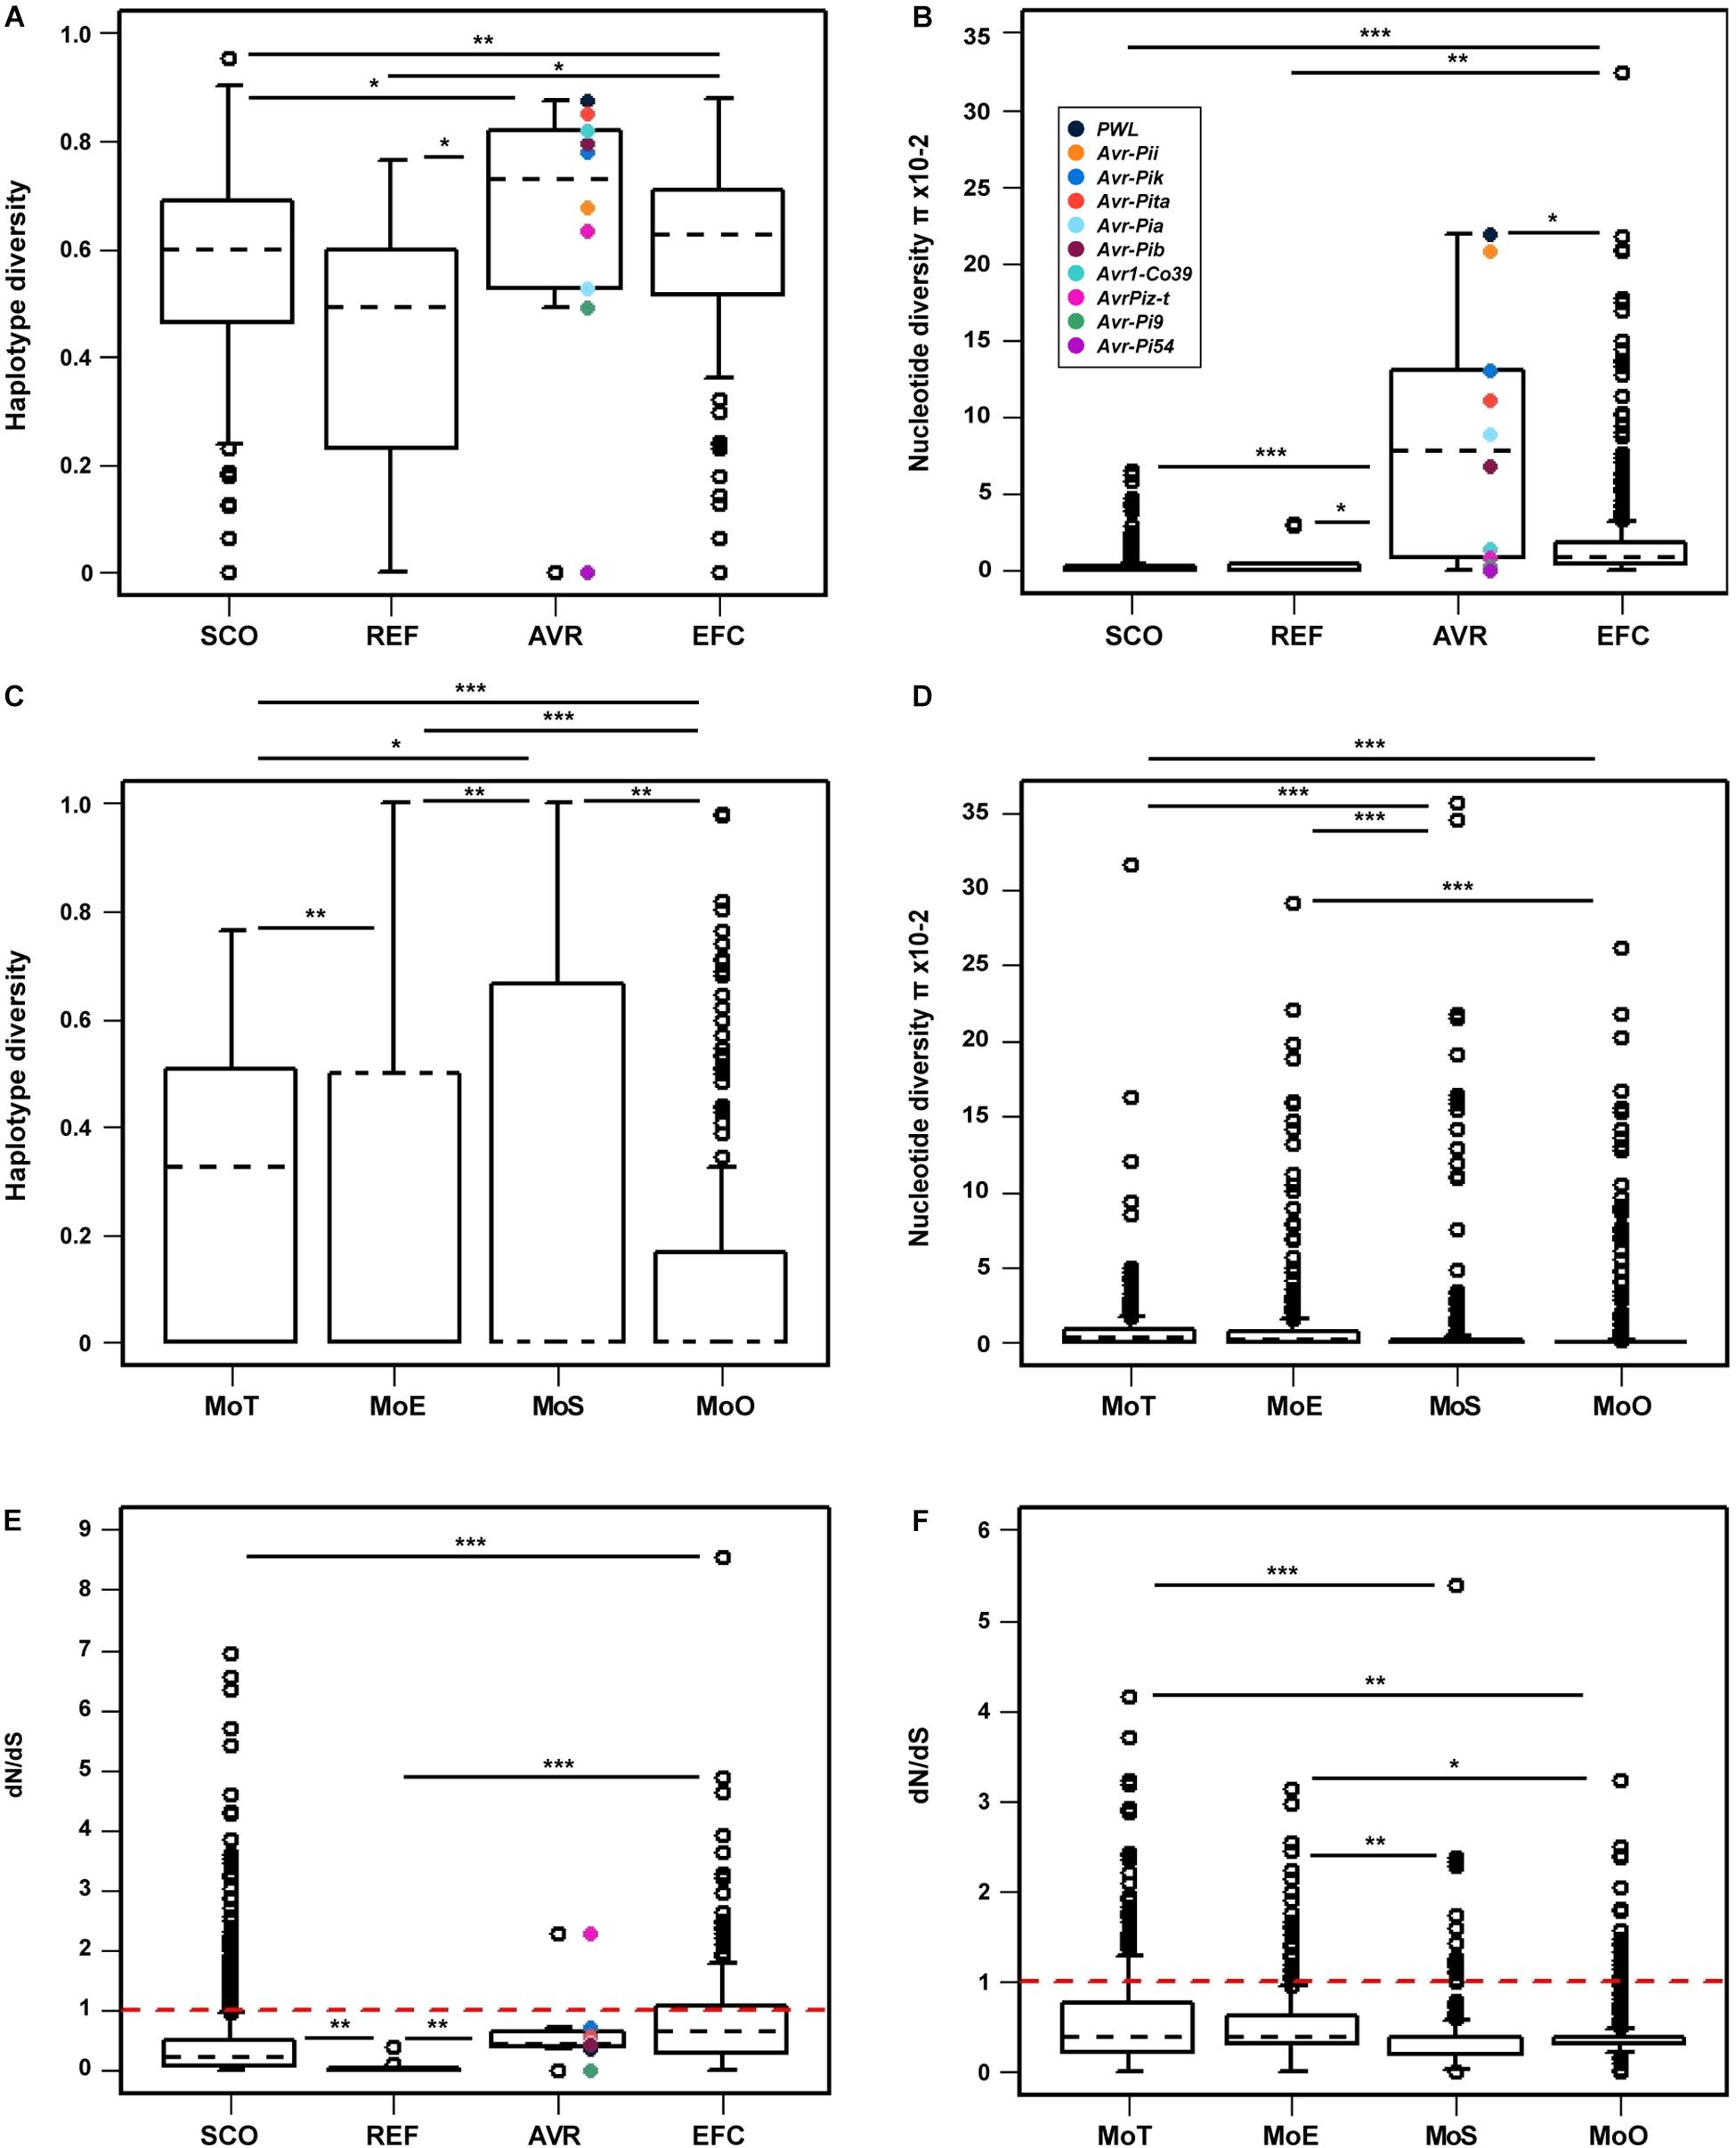
Figure 6. Comparison of the haplotype diversity, nucleotide diversity, and mean selection pressure among four gene sets. The (A) haplotype and (B) nucleotide diversities within each gene set are presented for comparison. The AVR genes are color-coded in both figures. The (C) haplotype and (D) nucleotide diversities of the EFC genes in four pathotypes are shown. Because only one MoL isolate was used, it was not included in this analysis. (E) The mean selection pressure on each of the four gene sets and (F) that on the EFC genes in four pathotypes are shown. The red dashed line in both (E,F) indicates neutral selection pressure (dN/dS = 1). In all figures, black dashed lines denote the median values for each gene set or pathotype. The asterisks represent significant differences in distribution according to the Wilcoxon rank sum test (∗P ≤ 0.05, ∗∗P ≤ 0.01, and ∗∗∗P ≤ 0.001).
The average ω ratio estimates selection pressure on a set of homologous genes (Yang and Bielawski, 2000). The ω ratio of one indicates neutral selection. We hypothesized that the EFCs would have ω values higher than one due to the selection pressure exerted by hosts. The average ω ratios for EFCs and AVRs are significantly higher than those for SCOs and REFs, but no EFCs display the value higher than one (Figure 6E). Among the AVRs, only AvrPiz-t displayed the ω ratio higher than one (positive selection). The average ω ratio for most EFCs in different pathotypes was also less than one, but some have a ω ratio higher than one (Figure 6F). The selection pressure on EFCs did not appear constant across the pathotypes (Supplementary Figure 20). The average ω ratios for EFCs in MoT and MoE are significantly higher than those in MoS and MoO isolates.
Expression Patterns of EFC Genes
Earlier studies showed that most effector genes are exclusively expressed during infection (Stergiopoulos and De Wit, 2009). We determined if the EFC genes are preferentially expressed during host infection using publicly available data (Figure 7A and Supplementary Figure 21). We also analyzed expression patterns of SCOs, REFs, and AVRs. As expected, the expression of REFs in MoO isolate KJ201 did not change much during mycelial growth and infection, whereas the AVRs showed elevated expression during the biotrophic and early necrotrophic stages of infection (27–45 hpi) (Figure 7A). In wheat plants infected with Bangladesh isolate 12, the REFs were similarly expressed in both symptomatic and asymptomatic plant tissues, whereas the AVRs were expressed only in symptomatic tissues (Supplementary Figure 21A). The expression of most EFCs in KJ201 appeared elevated during the biotrophic stage compared to the mycelial growth stage (Figure 7B). Overall, the putatively infection-related gene sets (AVRs and EFCs) in both isolates showed elevated levels of expression during infection (Figure 7C and Supplementary Figure 21B). In contrast, the expression of the SCO and REF genes in KJ201 did not change significantly. We also examined whether the presence of TEs in flanking regions affects the expression of EFCs in KJ201 (Figure 7D). The presence or absence of TEs does not appear to have a substantial effect on their expression.
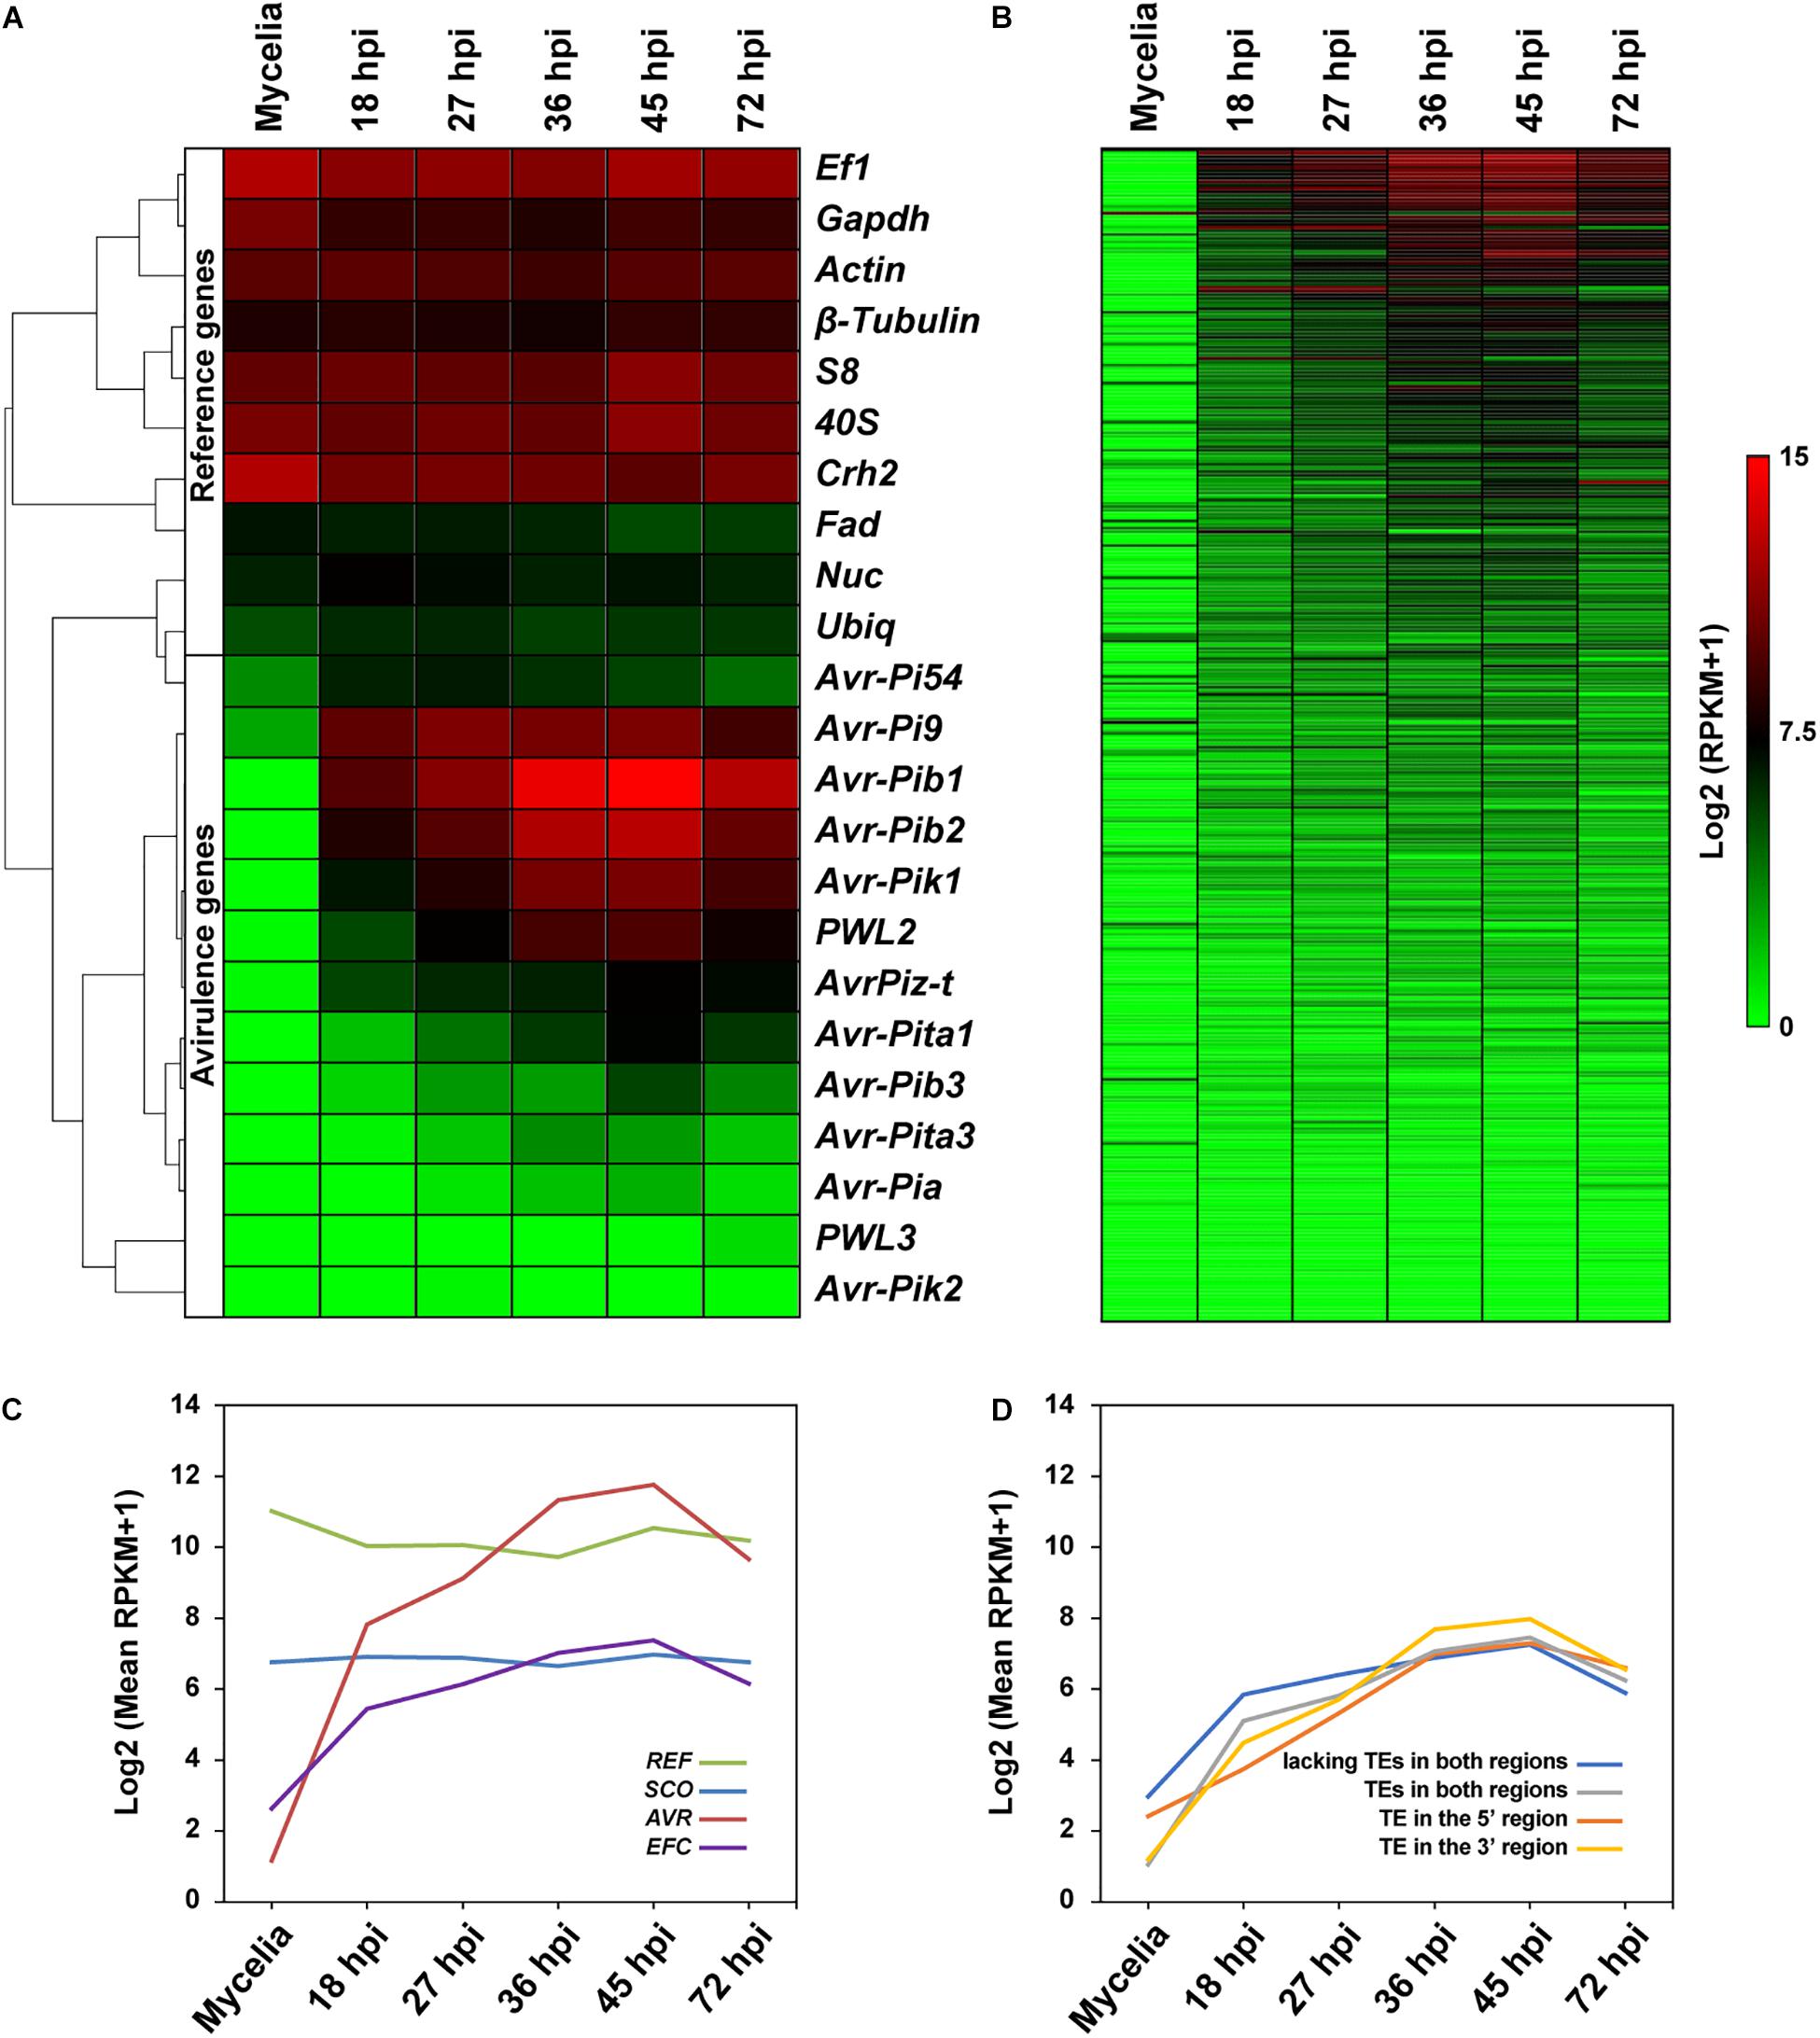
Figure 7. Comparative analysis of the expression patterns of the REF, AVR, EFC, and SCO genes in MoO isolate KJ201. Expression patterns of (A) REFs and AVRs and (B) EFCs in KJ201 in mycelia and during rice infection are shown. Data from the samples collected at the pre-penetration (18 hpi), biotrophic growth (27–36 hpi), and necrotrophic (45–72 hpi) stages are shown. (C) Averaged expression patterns of the four gene sets are shown. (D) Averaged expression patterns of the following types of EFCs are shown: those with TEs in both the 5′ and 3′ regions, those with TEs in the 5′ region only, and those with TEs in the 3′ region only, and those lacking TEs in both regions.
Discussion
The host range of a pathogen is determined by its effector repertoire, a characteristic that has been used to differentiate strains/isolates within species (Schulze-Lefert and Panstruga, 2011). Most effectors in plant pathogens exhibit species-specific presence/absence or sequence features likely due to the co-evolution between pathogens and hosts (Sonah et al., 2016). Many fungal/oomycete EFC genes have been identified based on one or more of the following characteristics of the gene or gene product: (a) likely secretion based on the presence of a signal peptide but no transmembrane domain or GPI-anchor sites; (b) small size (usually fewer than 300 amino acids); (c) presence only in specific species or isolates; (d) increased expression during infection; (e) rich in cysteine residues; and (f) presence of a conserved motif, particularly for oomycete EFCs (Godfrey et al., 2010; Zuccaro et al., 2011; Cheng et al., 2014). We previously identified and analyzed EFCs encoded by diverse groups of fungal pathogens based on the hypothesis that small secreted proteins function as EFCs (Kim et al., 2016). In this study, we analyzed the distribution, structure, genomic context, and expression pattern of the EFC genes, as well as known AVR genes, in the isolates that represent five pathotypes of M. oryzae and nine related species. Although resulting data are not sufficient to validate their role as effectors, they should facilitate subsequent studies needed to validate their function and will also support research on the genetic basis of the evolution and host specialization in M. oryzae. All the results from this study are readily available to guide such studies, and the approaches/methods we used can be applied to mine EFCs from newly sequenced M. oryzae genomes.
Comparative genomic analyses of the M. oryzae genes that are likely involved in host specificity have been performed using publicly available genome sequence data (Yoshida et al., 2016; Zhong et al., 2016). Because multiple methods/approaches have been used to annotate the genomes of M. oryzae isolates, the quality of genome annotation varied, likely affecting the quality of downstream analyses based on such genome data. To ensure accurate comparative analyses of the AVR and EFC genes in M. oryzae and related species, we first re-annotated the genomes of diverse isolates that represent five pathotypes of M. oryzae and nine related species (Supplementary Table 1) via Exonerate to identify their homologs. Through this reannotation, we discovered the Avr-Pia and Avr-Pib genes in the 70-15 genome (Supplementary Figure 1 and Supplementary Table 3) and many missing homologs of the 70-15 EFC genes (Kim et al., 2016) in other genomes. These results underscore the importance of re-annotating chosen genomes for robust comparative genomic studies.
Using the re-annotated data, we analyzed the distribution, sequence variation, and genomic context of the AVR and EFC genes at multiple phylogenomic levels to uncover notable patterns in light of the evolution of M. oryzae and related species. In parallel, we also analyzed a large number of SCO genes that are expected to be conserved among these species to compare results with those derived from the AVR and EFC genes. Despite a few shortcomings noted below, results from this study provide a global snapshot of how the AVR and EFC genes and their products have evolved in M. oryzae and related species. The comprehensive catalog of the EFC and AVR genes will serve as a foundation for future studies of these genes.
In M. oryzae, the host range of individual isolates is typically narrow. Isolates originated from a specific host infect the host of origin and closely related species (Kato et al., 2000; Oh et al., 2002; Murakami et al., 2003) and are grouped into pathotypes. We show that many EFC genes are shared among the isolates in multiple pathotypes with high levels of sequence identity. Many M. oryzae EFC genes appear species-specific (Figures 1, 2 and Supplementary Figure 3). However, because the Mg isolates carry genes that encode products with low sequence identity to M. oryzae EFC proteins (Supplementary Figure 4), it is possible that such Mg EFC genes correspond to the orthologs of 70-15 EFCs that have rapidly diverged.
Host range variation within M. oryzae likely involves changes in effector genes, including those that encode AVR proteins. Recently, a population genetic study using M. oryzae isolates from rice showed that individual isolates could infect only specific lines of rice due to the variation in their effector repertoire (Liao et al., 2016). In addition to varying degrees of sequence variation in individual EFC genes, multiple types of structural variation were also detected in M. oryzae (Figure 3). Such changes likely cause pseudogenization, leading to the production of non-functional EFC proteins. Although most of these mutations seem to be phylogenetically concordant with the evolution of M. oryzae, a few seem to have sporadically emerged in multiple pathotypes. We cannot rule out the possibility that errors during the genome assembly and annotation of some isolates caused some of the variations observed. Besides, some genes appear to be gene family members, and we may have retrieved paralogous members during genome mining.
Previous studies reported that variations of host compatibility genes were often associated with the presence or activity of TEs (Kang et al., 2001; Khang et al., 2008), and the selection pressure from hosts likely favors such changes (Yoshida et al., 2016; Zhong et al., 2016). Our analysis shows that sequence variation among the EFC genes occurred more frequently than the SCO genes (Supplementary Figure 8), supporting the role of the former group in host interaction. To determine whether the TEs surrounding EFC genes contribute to their sequence/structural variation, we compared the degree of sequence variation and the proportion of genes with structural variation among the EFC genes after dividing them based on the presence of flanking TEs (Supplementary Figure 8). Although it remains to be determined whether associated TEs caused sequence or structural variation in individual genes, higher degrees of variation were observed among those that are associated with TEs in 70-15. We tested whether the TEs in flanking regions of homologous EFC genes are conserved within a species. The nature of flanking TEs is quite variable (Figure 4), suggesting that TEs or surrounding genome sequences undergo frequent changes.
Although the ω ratio of most EFC genes within each pathotype was less than one, suggesting purifying selection, 21.6% of the EFC genes in MoO and 27.1% of MoT EFC genes exhibited the ω ratio higher than one, suggesting that they have been positively selected (Figure 6). These genes under positive selection from host likely involved in host adaptation and specialization. However, the ω ratio of most EFC genes is less than one, and these genes may encode effectors that function in different hosts of M. oryzae. The ω ratio of EFC genes was not constant in each pathotype (Supplementary Figure 20) probably because the type of selection on effectors from rice is likely different from that from other hosts.
Expression of effector genes is generally induced during host-pathogen interactions (Lo Presti et al., 2015; Sánchez-Vallet et al., 2018). We used gene expression data derived from mycelial culture and infected rice and wheat plants to determine whether the M. oryzae EFC genes are differentially expressed during infection. Although the expression level of EFC genes increased during infection in both plants, the degree of induction in KJ201 appeared much higher than that in MoT isolate (Figure 7). However, additional experiments with more biological repeats and under identical environmental conditions are needed to validate this observation because the transcriptome data for KJ201 were obtained via rice sheath assay to enrich the quantity of fungal RNAs (Jeon et al., 2019), while the data from wheat plants were obtained samples collected in the field (Saunders et al., 2017). We also determined whether the presence of TEs in flanking regions of the EFC genes affect their expression, as some TEs have been suggested to affect the expression of EFC genes in other pathogens (Whisson et al., 2012). We found no significant changes potentially associated with the presence of TEs in flanking regions in KJ201 (Figure 7D). Because we did not consider the distance between each EFC gene and neighboring TEs, it is premature to discount the effect of TEs on the expression of EFC genes.
Data Availability Statement
The datasets generated for this study can be found in the NCBI SRX5076910, SRX5076911, SRX5076912, SRX5076913, SRX5076914, and SRX5076915.
Author Contributions
K-TK and Y-HL designed the study. K-TK, SK, and Y-HL wrote the manuscript. K-TK, JK, HS, GC, HK, JJ, and KC performed the data mining and analyses.
Funding
This work was supported by grants from the National Research Foundation of Korea (NRF-2017R1A2A1A17069504, NRF-2015M3A9B8028679, and NRF-2018R1A5A1023599) and the Korea Institute of Planning and Evaluation for Technology in Food, Agriculture, and Forestry through the Agricultural Microbiome Program (918017-04-1-CG000). SK acknowledges a Brain Pool Grant from the National Research Foundation of Korea (NRF-2019H1D3A2A01054562). K-TK has been supported by a graduate fellowship from the Brain Korea 21 Plus Program.
Conflict of Interest
The authors declare that the research was conducted in the absence of any commercial or financial relationships that could be construed as a potential conflict of interest.
supplementary material
The Supplementary Material for this article can be found online at: https://www.frontiersin.org/articles/10.3389/fmicb.2019.02575/full#supplementary-material
Abbreviations
AVRs, avirulence genes; CDS, coding sequence; EFCs, effector candidate genes; Mg, M. grisea; MoE, M. oryzae pathotype Elusine; MoL, M. oryzae pathotype Lolium; MoO, M. oryzae pathotype Oryza; MoS, M. oryzae pathotype Setaria; MoT, M. oryzae pathotype Triticum; REFs, reference genes; SCOs, single-copy orthologous genes; TEs, transposable elements
Footnotes
References
Anderson, J. P., Gleason, C. A., Foley, R. C., Thrall, P. H., Burdon, J. B., and Singh, K. B. (2010). Plants versus pathogens: an evolutionary arms race. Funct. Plant Biol. 37, 499–512. doi: 10.1071/FP09304
Angiuoli, S. V., and Salzberg, S. L. (2011). Mugsy: fast multiple alignment of closely related whole genomes. Bioinformatics 27, 334–342. doi: 10.1093/bioinformatics/btq665
Cantarel, B. L., Korf, I., Robb, S. M. C., Parra, G., Ross, E., Moore, B., et al. (2008). MAKER: an easy-to-use annotation pipeline designed for emerging model organism genomes. Genome Res. 18, 188–196. doi: 10.1101/gr.6743907
Capella-Gutierrez, S., Silla-Martinez, J. M., and Gabaldon, T. (2009). trimAl: a tool for automated alignment trimming in large-scale phylogenetic analyses. Bioinformatics 25, 1972–1973. doi: 10.1093/bioinformatics/btp348
Chen, C., Lian, B., Hu, J., Zhai, H., Wang, X., Venu, R. C., et al. (2013). Genome comparison of two Magnaporthe oryzae field isolates reveals genome variations and potential virulence effectors. BMC Genomics 14:887. doi: 10.1186/1471-2164-14-887
Chen, Q. H., Wang, Y. C., Li, A. N., Zhang, Z. G., and Zheng, X. B. (2007). Molecular mapping of two cultivar-specific avirulence genes in the rice blast fungus Magnaporthe grisea. Mol. Genet. Genomics 277, 139–148. doi: 10.1007/s00438-006-0179-8
Cheng, Q., Wang, H., Xu, B., Zhu, S., Hu, L., and Huang, M. (2014). Discovery of a novel small secreted protein family with conserved N-terminal IGY motif in Dikarya fungi. BMC Genomics 15:1151. doi: 10.1186/1471-2164-15-1151
Chiapello, H., Mallet, L., Guerin, C., Aguileta, G., Amselem, J., Kroj, T., et al. (2015). Deciphering genome content and evolutionary relationships of isolates from the fungus Magnaporthe oryzae attacking different host plants. Genome Biol. Evol. 7, 2896–2912. doi: 10.1093/gbe/evv187
Choi, J., Cheong, K., Jung, K., Jeon, J., Lee, G. W., Kang, S., et al. (2013a). CFGP 2.0: a versatile web-based platform for supporting comparative and evolutionary genomics of fungi and Oomycetes. Nucleic Acids Res. 41, D714–D719. doi: 10.1093/nar/gks1163
Choi, J., Park, S. Y., Kim, B. R., Roh, J. H., Oh, I. S., Han, S. S., et al. (2013b). Comparative analysis of pathogenicity and phylogenetic relationship in Magnaporthe grisea species complex. PLoS One 8:e57196. doi: 10.1371/journal.pone.0057196
Dai, Y. T., Jia, Y. L., Correll, J., Wang, X. Y., and Wang, Y. L. (2010). Diversification and evolution of the avirulence gene AVR-Pita1 in field isolates of Magnaporthe oryzae. Fungal Genet. Biol. 47, 973–980. doi: 10.1016/j.fgb.2010.08.003
Dean, R. A., Talbot, N. J., Ebbole, D. J., Farman, M. L., Mitchell, T. K., Orbach, M. J., et al. (2005). The genome sequence of the rice blast fungus Magnaporthe grisea. Nature 434, 980–986. doi: 10.1038/nature03449
Dean, R. A., Van Kan, J. A., Pretorius, Z. A., Hammond-Kosack, K. E., Di Pietro, A., Spanu, P. D., et al. (2012). The top 10 fungal pathogens in molecular plant pathology. Mol. Plant Pathol. 13, 414–430. doi: 10.1111/j.1364-3703.2011.00783.x
Dodds, P. N., Rafiqi, M., Gan, P. H. P., Hardham, A. R., Jones, D. A., and Ellis, J. G. (2009). Effectors of biotrophic fungi and oomycetes: pathogenicity factors and triggers of host resistance. New Phytol. 183, 993–1000. doi: 10.1111/j.1469-8137.2009.02922.x
Dong, S., Raffaele, S., and Kamoun, S. (2015). The two-speed genomes of filamentous pathogens: waltz with plants. Curr. Opin. Genet. Dev. 35, 57–65. doi: 10.1016/j.gde.2015.09.001
Dong, Y., Li, Y., Zhao, M., Jing, M., Liu, X., Liu, M., et al. (2015). Global genome and transcriptome analyses of Magnaporthe oryzae epidemic isolate 98-06 uncover novel effectors and pathogenicity-related genes, revealing gene gain and lose dynamics in genome evolution. PLoS Pathog. 11:e1004801. doi: 10.1371/journal.ppat.1004801
Emms, D. M., and Kelly, S. (2015). OrthoFinder: solving fundamental biases in whole genome comparisons dramatically improves orthogroup inference accuracy. Genome Biol. 16:157. doi: 10.1186/s13059-015-0721-2
Farman, M. L., Eto, Y., Nakao, T., Tosa, Y., Nakayashiki, H., Mayama, S., et al. (2002). Analysis of the structure of the AVR1-CO39 avirulence locus in virulent rice-infecting isolates of Magnaporthe grisea. Mol. Plant Microbe Interact. 15, 6–16. doi: 10.1094/MPMI.2002.15.1.6
Feng, J. X., Meyer, C. A., Wang, Q., Liu, J. S., Liu, X. S., and Zhang, Y. (2012). GFOLD: a generalized fold change for ranking differentially expressed genes from RNA-seq data. Bioinformatics 28, 2782–2788. doi: 10.1093/bioinformatics/bts515
Gladieux, P., Condon, B., Ravel, S., Soanes, D., Maciel, J. L. N., Nhani, A., et al. (2018). Gene flow between divergent cereal- and grass-specific lineages of the rice blast fungus Magnaporthe oryzae. mBio 9:e01219-17. doi: 10.1128/mBio.01219-17
Godfrey, D., Böhlenius, H., Pedersen, C., Zhang, Z., Emmersen, J., and Thordal-Christensen, H. (2010). Powdery mildew fungal effector candidates share N-terminal Y/F/WxC-motif. BMC Genomics 11:317. doi: 10.1186/1471-2164-11-317
Gowda, M., Shirke, M. D., Mahesh, H. B., Chandarana, P., Rajamani, A., and Chattoo, B. B. (2015). Genome analysis of rice-blast fungus Magnaporthe oryzae field isolates from southern India. Genomics Data 5, 284–291. doi: 10.1016/j.gdata.2015.06.018
Grandaubert, J., Lowe, R. G. T., Soyer, J. L., Schoch, C. L., De Wouw, A. P. V., Fudal, I., et al. (2014). Transposable element-assisted evolution and adaptation to host plant within the Leptosphaeria maculans-Leptosphaeria biglobosa species complex of fungal pathogens. BMC Genomics 15:891. doi: 10.1186/1471-2164-15-891
Greenshields, D. L., and Jones, J. D. G. (2008). Plant pathogen effectors: getting mixed messages. Curr. Biol. 18, R128–R130. doi: 10.1016/j.cub.2007.11.064
Haas, B. J., Kamoun, S., Zody, M. C., Jiang, R. H. Y., Handsaker, R. E., Cano, L. M., et al. (2009). Genome sequence and analysis of the Irish potato famine pathogen Phytophthora infestans. Nature 461, 393–398. doi: 10.1038/nature08358
Huang, J., Si, W. N., Deng, Q. M., Li, P., and Yang, S. H. (2014). Rapid evolution of avirulence genes in rice blast fungus Magnaporthe oryzae. BMC Genet. 15:45. doi: 10.1186/1471-2156-15-45
Islam, M. T., Croll, D., Gladieux, P., Soanes, D. M., Persoons, A., Bhattacharjee, P., et al. (2016). Emergence of wheat blast in Bangladesh was caused by a South American lineage of Magnaporthe oryzae. BMC Biol. 14:84. doi: 10.1186/s12915-016-0309-7
Jeon, J., Lee, G. W., Kim, K. T., Park, S. Y., Kim, S., Kown, S., et al. (2019). Transcriptome profiling of the rice blast fungus Magnaporthe oryzae and its host Oryza sativa during infection. Mol. Plant Microbe Interact. doi: 10.1094/MPMI-07-19-0207-A
Kang, S., Lebrun, M. H., Farrall, L., and Valent, B. (2001). Gain of virulence caused by insertion of a Pot3 transposon in a Magnaporthe grisea avirulence gene. Mol. Plant Microbe Interact. 14, 671–674. doi: 10.1094/MPMI.2001.14.5.671
Kang, S., Sweigard, J. A., and Valent, B. (1995). The PWL host specificity gene family in the blast fungus Magnaporthe grisea. Mol. Plant Microbe Interact. 8, 939–948. doi: 10.1094/MPMI-8-0939
Kanzaki, H., Yoshida, K., Saitoh, H., Fujisaki, K., Hirabuchi, A., Alaux, L., et al. (2012). Arms race co-evolution of Magnaporthe oryzae AVR-Pik and rice Pik genes driven by their physical interactions. Plant J. 72, 894–907. doi: 10.1111/j.1365-313X.2012.05110.x
Kato, H., Yamamoto, M., Yamaguchi-Ozaki, T., Kadouchi, H., Iwamoto, Y., Nakayashiki, H., et al. (2000). Pathogenicity, mating ability and DNA restriction fragment length polymorphisms of Pyricularia populations isolated from Gramineae, Bambusideae and Zingiberaceae plants. J. Gen. Plant Pathol. 66, 30–47. doi: 10.1007/PL00012919
Katoh, K., and Standley, D. M. (2013). MAFFT multiple sequence alignment software version 7: improvements in performance and usability. Mol. Biol. Evol. 30, 772–780. doi: 10.1093/molbev/mst010
Khang, C. H., Park, S. Y., Lee, Y. H., Valent, B., and Kang, S. (2008). Genome organization and evolution of the AVR-Pita avirulence gene family in the Magnaporthe grisea species complex. Mol. Plant Microbe Interact. 21, 658–670. doi: 10.1094/MPMI-21-5-0658
Kim, D., Landmead, B., and Salzberg, S. L. (2015). HISAT: a fast spliced aligner with low memory requirements. Nat. Methods 12, 357–360. doi: 10.1038/nmeth.3317
Kim, K. T., Jeon, J., Choi, J., Cheong, K., Song, H., Choi, G., et al. (2016). Kingdom-wide analysis of fungal small secreted proteins (SSPs) reveals their potential role in host association. Front. Plant Sci. 7:186. doi: 10.3389/fpls.2016.00186
Korf, I. (2004). Gene finding in novel genomes. BMC Bioinformatics 5:59. doi: 10.1186/1471-2105-5-59
Kumar, S., Stecher, G., and Tamura, K. (2016). MEGA7: molecular evolutionary genetics analysis version 7.0 for bigger datasets. Mol. Biol. Evol. 33, 1870–1874. doi: 10.1093/molbev/msw054
Li, W., Wang, B., Wu, J., Lu, G., Hu, Y., Zhang, X., et al. (2009). The Magnaporthe oryzae avirulence gene AvrPiz-t encodes a predicted secreted protein that triggers the immunity in rice mediated by the blast resistance gene Piz-t. Mol. Plant Microbe Interact. 22, 411–420. doi: 10.1094/MPMI-22-4-0411
Liao, J., Huang, H., Meusnier, I., Adreit, H., Ducasse, A., Bonnot, F., et al. (2016). Pathogen effectors and plant immunity determine specialization of the blast fungus to rice subspecies. eLife 5:e19377. doi: 10.7554/eLife.19377
Lo Presti, L., Lanver, D., Schweizer, G., Tanaka, S., Liang, L., Tollot, M., et al. (2015). Fungal effectors and plant susceptibility. Annu. Rev. Plant Biol. 66, 513–545. doi: 10.1146/annurev-arplant-043014-114623
Mai, U., Sayyari, E., and Mirarab, S. (2017). Minimum variance rooting of phylogenetic trees and implications for species tree reconstruction. PLoS One 12:e0182238. doi: 10.1371/journal.pone.0182238
Marcet-Houben, M., and Gabaldon, T. (2011). TreeKO: a duplication-aware algorithm for the comparison of phylogenetic trees. Nucleic Acids Res. 39:e66. doi: 10.1093/nar/gkr087
Murakami, J., Tomita, R., Kataoka, T., Nakayashiki, H., Tosa, Y., and Mayama, S. (2003). Analysis of host species specificity of Magnaporthe grisea toward foxtail millet using a genetic cross between isolates from wheat and foxtail millet. Phytopathology 93, 42–45. doi: 10.1094/PHYTO.2000.90.10.1060
Oh, H. S., Tosa, Y., Takabayashi, N., Nakagawa, S., Tomita, R., Don, L. D., et al. (2002). Characterization of an Avena isolate of Magnaporthe grisea and identification of a locus conditioning its specificity on oat. Can. J. Bot. 80, 1088–1095. doi: 10.1139/b02-101
Omar, S. C., Bentley, M. A., Morieri, G., Preston, G. M., and Gurr, S. J. (2016). Validation of reference genes for robust qRT-PCR gene expression analysis in the rice blast fungus Magnaporthe oryzae. PLoS One 11:e0160637. doi: 10.1371/journal.pone.0160637
Orbach, M. J., Farrall, L., Sweigard, J. A., Chumley, F. G., and Valent, B. (2000). A telomeric avirulence gene determines efficacy for the rice blast resistance gene Pi-ta. Plant Cell 12, 2019–2032. doi: 10.1105/tpc.12.11.2019
Parra, G., Bradnam, K., and Korf, I. (2007). CEGMA: a pipeline to accurately annotate core genes in eukaryotic genomes. Bioinformatics 23, 1061–1067. doi: 10.1093/bioinformatics/btm071
Price, M. N., Dehal, P. S., and Arkin, A. P. (2010). FastTree 2 - approximately maximum-likelihood trees for large alignments. PLoS One 5:e9490. doi: 10.1371/journal.pone.0009490
Ray, S., Singh, P. K., Gupta, D. K., Mahato, A. K., Sarkar, C., Rathour, R., et al. (2016). Analysis of Magnaporthe oryzae genome reveals a fungal effector, which is able to induce resistance response in transgenic rice line containing resistance gene, Pi54. Front. Plant Sci. 7:1140. doi: 10.3389/fpls.2016.01140
Rozas, J., Ferrer-Mata, A., Sanchez-Delbarrio, J. C., Guirao-Rico, S., Librado, P., Ramos-Onsins, S. E., et al. (2017). DnaSP 6: DNA sequence polymorphism analysis of large data sets. Mol. Biol. Evol. 34, 3299–3302. doi: 10.1093/molbev/msx248
Sánchez-Vallet, A., Fouche, S., Fudal, I., Hartmann, F. E., Soyer, J. L., Tellier, A., et al. (2018). The genome biology of effector gene evolution in filamentous plant pathogens. Annu. Rev. Phytopathol. 56, 21–40. doi: 10.1146/annurev-phyto-080516-035303
Saunders, D. G. O., Win, J., Islam, T., and Kamoun, S. (2017). Transcriptome Sequencing of Infected Wheat Samples Collected During the Wheat Blast Epidemic in Bangladesh in 2016 and Release of Raw Sequence Data on OpenWheatBlast Website for Open Access. London: Figshare, doi: 10.6084/m9.figshare.5202448.v2
Schulze-Lefert, P., and Panstruga, R. (2011). A molecular evolutionary concept connecting nonhost resistance, pathogen host range, and pathogen speciation. Trends Plant Sci. 16, 117–125. doi: 10.1016/j.tplants.2011.01.001
Slater, G. S., and Birney, E. (2005). Automated generation of heuristics for biological sequence comparison. BMC Bioinformatics 6:31. doi: 10.1186/1471-2105-6-31
Sonah, H., Deshmukh, R. K., and Belanger, R. R. (2016). Computational prediction of effector proteins in fungi: opportunities and challenges. Front. Plant Sci. 7:126. doi: 10.3389/fpls.2016.00126
Stamatakis, A. (2014). RAxML version 8: a tool for phylogenetic analysis and post-analysis of large phylogenies. Bioinformatics 30, 1312–1313. doi: 10.1093/bioinformatics/btu033
Stanke, M., and Morgenstern, B. (2005). AUGUSTUS: a web server for gene prediction in eukaryotes that allows user-defined constraints. Nucleic Acids Res. 33, W465–W467. doi: 10.1093/nar/gki458
Stergiopoulos, I., and De Wit, P. J. (2009). Fungal effector proteins. Annu. Rev. Phytopathol. 47, 233–263. doi: 10.1146/annurev.phyto.112408.132637
Sweigard, J. A., Carroll, A. M., Kang, S., Farrall, L., Chumley, F. G., and Valent, B. (1995). Identification, cloning, and characterization of PWL2, a gene for host species specificity in the rice blast fungus. Plant Cell 7, 1221–1233. doi: 10.1105/tpc.7.8.1221
Talbot, N. J. (2003). On the trail of a cereal killer: exploring the biology of Magnaporthe grisea. Annu. Rev. Microbiol. 57, 177–202. doi: 10.1146/annurev.micro.57.030502.090957
Tempel, S. (2012). Using and understanding repeatmasker. Methods Mol. Biol. 859, 29–51. doi: 10.1007/978-1-61779-603-6_2
Ter-Hovhannisyan, V., Lomsadze, A., Chernoff, Y. O., and Borodovsky, M. (2008). Gene prediction in novel fungal genomes using an ab initio algorithm with unsupervised training. Genome Res. 18, 1979–1990. doi: 10.1101/gr.081612.108
Whisson, S. C., Vetukuri, R. R., Avrova, A. O., and Dixelius, C. (2012). Can silencing of transposons contribute to variation in effector gene expression in Phytophthora infestans? Mob. Genet. Elements 2, 110–114. doi: 10.4161/mge.20265
Wu, J., Kou, Y. J., Bao, J. D., Li, Y., Tang, M. Z., Zhu, X. L., et al. (2015). Comparative genomics identifies the Magnaporthe oryzae avirulence effector AvrPi9 that triggers Pi9-mediated blast resistance in rice. New Phytol. 206, 1463–1475. doi: 10.1111/nph.13310
Xue, M., Yang, J., Li, Z., Hu, S., Yao, N., Dean, R. A., et al. (2012). Comparative analysis of the genomes of two field isolates of the rice blast fungus Magnaporthe oryzae. PLoS Genet. 8:e1002869. doi: 10.1371/journal.pgen.1002869
Yang, Z., and Bielawski, J. P. (2000). Statistical methods for detecting molecular adaptation. Trends Ecol. Evol. 15, 496–503. doi: 10.1016/S0169-5347(00)01994-7
Yang, Z. H. (1997). PAML: a program package for phylogenetic analysis by maximum likelihood. Bioinformatics 13, 555–556. doi: 10.1093/bioinformatics/13.5.555
Yoshida, K., Saitoh, H., Fujisawa, S., Kanzaki, H., Matsumura, H., Yoshida, K., et al. (2009). Association genetics reveals three novel avirulence genes from the rice blast fungal pathogen Magnaporthe oryzae. Plant Cell 21, 1573–1591. doi: 10.1105/tpc.109.066324
Yoshida, K., Saunders, D. G. O., Mitsuoka, C., Natsume, S., Kosugi, S., Saitoh, H., et al. (2016). Host specialization of the blast fungus Magnaporthe oryzae is associated with dynamic gain and loss of genes linked to transposable elements. BMC Genomics 17:370. doi: 10.1186/s12864-016-2690-6
Zhang, H. F., Zheng, X. B., and Zhang, Z. G. (2016). The Magnaporthe grisea species complex and plant pathogenesis. Mol. Plant Pathol. 17, 796–804. doi: 10.1111/mpp.12342
Zhang, N., Cai, G. H., Price, D. C., Crouch, J. A., Gladieux, P., Hillman, B., et al. (2018). Genome wide analysis of the transition to pathogenic lifestyles in Magnaporthales fungi. Sci. Rep. 8:5862. doi: 10.1038/s41598-018-24301-6
Zhang, S., Wang, L., Wu, W., He, L., Yang, X., and Pan, Q. (2015). Function and evolution of Magnaporthe oryzae avirulence gene AvrPib responding to the rice blast resistance gene Pib. Sci. Rep. 5:11642. doi: 10.1038/srep11642
Zhang, S., and Xu, J. R. (2014). Effectors and effector delivery in Magnaporthe oryzae. PLoS Pathog. 10:e1003826. doi: 10.1371/journal.ppat.1003826
Zhong, Z. H., Norvienyeku, J., Chen, M. L., Bao, J. D., Lin, L. Y., Chen, L. Q., et al. (2016). Directional selection from host plants is a major force driving host specificity in Magnaporthe species. Sci. Rep. 6:25591. doi: 10.1038/srep25591
Keywords: avirulence, comparative genomics, effector, host specialization, M. grisea, M. oryzae
Citation: Kim K-T, Ko J, Song H, Choi G, Kim H, Jeon J, Cheong K, Kang S and Lee Y-H (2019) Evolution of the Genes Encoding Effector Candidates Within Multiple Pathotypes of Magnaporthe oryzae. Front. Microbiol. 10:2575. doi: 10.3389/fmicb.2019.02575
Received: 16 August 2019; Accepted: 24 October 2019;
Published: 06 November 2019.
Edited by:
Martijn Rep, University of Amsterdam, NetherlandsReviewed by:
Li-Jun Ma, University of Massachusetts Amherst, United StatesMin He, Sichuan Agricultural University, China
Copyright © 2019 Kim, Ko, Song, Choi, Kim, Jeon, Cheong, Kang and Lee. This is an open-access article distributed under the terms of the Creative Commons Attribution License (CC BY). The use, distribution or reproduction in other forums is permitted, provided the original author(s) and the copyright owner(s) are credited and that the original publication in this journal is cited, in accordance with accepted academic practice. No use, distribution or reproduction is permitted which does not comply with these terms.
*Correspondence: Yong-Hwan Lee, yonglee@snu.ac.kr
†Present address: Hyunbin Kim, Clinical Genomics Analysis Branch, National Cancer Center, Goyang, South Korea