 Chongchong Liu
 Shengbao Feng3
 Qun Wu
- 1Key Laboratory of Industrial Biotechnology of Ministry of Education, State Key Laboratory of Food Science and Technology, School of Biotechnology, Jiangnan University, Wuxi, China
- 2Suqian Industrial Technology Research Institute, Jiangnan University, Suqian, China
- 3Qinghai Huzhu Barley Wine Co., Ltd., Haidong, China
Raw material is important for flavors in fermented foods. Here, the effect of hulless barley on the microbiota in Chinese liquor was studied using two main cultivars (heilaoya and dulihuang). Six genera (Lactobacillus, Saccharomyces, Komagataella, Aspergillus, Pichia, and Weissella) were identified as flavor producers. Komagataella, mainly correlated with esters, dominated in heilaoya, and Pichia, mainly correlated with carbonyls, dominated in dulihuang. The Mantel test indicated reducing sugar drove the succession of microbiota (heilaoya: P = 0.001; dulihuang: P = 0.006). Especially, glucose (P = 0.0226) and fructose (P = 0.0168) presented the most significant correlations with Pichia and Komagataella, respectively. The simulative fermentation confirmed Komagataella phaffii QK2 grew better in heilaoya with more fructose, whereas Pichia fermentans PF grew better in dulihuang with more glucose. This work highlighted the effect of raw material on microbiota, which would be beneficial for regulating the quality of fermented foods.
Introduction
Microbiota of spontaneously fermented foods have provided humans with tools for storing and flavor development for thousands of years (Giraffa, 2004; Wolfe and Dutton, 2015). The flavors metabolism and accumulation of fermented foods are driven by microbiota succession and their inter-related metabolic roles (Sulaiman et al., 2014), which determines the quality of fermented foods (Rhee et al., 2011). Dynamics and diversity of microbiota succession during the fermentation process are helpful for revealing the link between individual species and flavors (Walsh et al., 2016). Recent studies have focused on revealing how environmental factors affected microbiota succession during the fermentation process, such as moisture (Wolfe et al., 2014), temperature (De Filippis et al., 2016), pH (Tao et al., 2014), salt concentration (Lee et al., 2017), metabolites (Zheng et al., 2018), microbial interaction (Olanbiwoninu and Odunfa, 2018), and initial microbe (Ponomarova et al., 2017). However, it is still unclear about the effect of raw material on microbiota in food fermentation.
Raw material is a key factor for the quality of fermented foods. A right selection of raw material is very important for improving the content of nutrients in fermented bran. Moreover, many organic substances of raw material can be metabolized to flavors (Zhao et al., 2017). For instance, goji rawmaterial played a primary role in flavor production, such as esters, benzenes, aldehydes/ketones, acids, alcohols and other volatiles (Yuan et al., 2016). Apart from these, raw material can regulate the growth and metabolism of microbes. Crude glycerol with corn steep liquor and mineral salts metabolized by Pichia guilliermondii results in a maximum concentration of lipid (Kumar et al., 2017). Rye bran as fermentation matrix boosts in situ dextran production by Weissella confusa compared to wheat bran (Kajala et al., 2016). Thus, it is necessary to reveal the effect of raw material on microbiota and the subsequent quality of fermented foods.
In this study, we took Chinese liquor brewed with hulless barley as the research object. Hulless barley including two main cultivars (heilaoya and dulihuang) is used as raw material in Chinese liquor in Qinghai-Tibet Plateau. It is well known that the hulless barley (Hordeum vulgare L. var. nudum), also called “Qingke” in Chinese, is the major grain for Tibetans and an important livestock feed in the Tibetan Plateau (Zeng et al., 2015). However, the effect of hulless barley on the quality of Chinese liquor remains unknown. This study dissects the effect of hulless barley on microbiota and flavor production in Chinese liquor fermentation, which is important to reveal the relationship between raw material and the quality of spontaneously fermented foods.
Materials and Methods
Sample Collection
The fermentation of hulless barley liquor is a typical spontaneous and solid-state fermentation process, which includes starter making and alcoholic fermentation in pits. A complete production process consisted of four fermentation batches. The fermentation of each batch lasted for about 30 days. For the first fermentation batch, a mixture of hulless barley (heilaoya or dulihuang) and water (1:1.1) was steamed for 30–40 min before being mixed with 10% volume of same starters. Following a solid-state fermentation process, samples (fermented grains) were collected at different fermentation times (day 0, 5, 10, 15, 20, and 30) from six separate fermentation pits (three pits for each type) in May 2017 from Qinghai Huzhu Barley Wine Co., Ltd., in Qinghai Province, China. A 200.0 g per sample were stored at -20°C before microbial population determination, physical and chemical parameter analyses, and flavors analysis. Another 200.0 g per sample were collected and immediately frozen in liquid nitrogen, then kept on dry ice and stored at -80°C before DNA extraction. The third 200.0 g per sample were stored at 4°C for strain isolation.
Strains Isolation and Identification
Six strains Lactobacillus acetotolerans B1, Weissella viridescens W1, Saccharomyces cerevisiae QK1, Komagataella phaffii QK2, Aspergillus niger M1, and Pichia fermentans PF, were all isolated from the hulless barley liquor fermentation process. Fermented grains (5.0 g) were suspended in 100 mL of sterile physiological saline (0.85% NaCl) and shaken for 15 min at room temperature. For the isolation of S. cerevisiae QK1, K. phaffii QK2, and P. fermentans PF, 0.1 ml of each decimal dilution was spread in triplicate on Wallerstein laboratory nutrient agar (WL) plates. The single colonies were inoculated into yeast extract-peptone-dextrose (YPD) medium and incubated at 30°C for 24 h under aerobic conditions. For the isolation of A. niger M1, 0.1 ml of each decimal dilution was spread in triplicate on potato dextrose agar (PDA) plates. The single colonies were inoculated into PDA plates and incubated at 30°C for 1–3 days under aerobic conditions. For the isolation of L. acetotolerans B1 and W. viridescens W1, 0.1 ml of each decimal dilution was spread in triplicate on de Man-Rogosa-Sharpe (MRS) agar plates. The single colonies were inoculated into MRS medium and incubated at 37°C for 36 h under anaerobic conditions. The genomic DNA of the single isolated strains was extracted according to the instruction of the TIANamp DNA kit (Tiangen, Beijing, China). For bacteria, 16S rRNA genes were amplified using the universal primer sets 27F and 1492R as described previously (Rochelle et al., 1992). For fungi, 26S rDNA genes were amplified using the universal primer sets NL1 and NL4 (Riethmüller et al., 2002). DNA sequencing of the PCR products was conducted by Sangon Biotech (Shanghai, China). The resulting sequences were compared with those available in the GenBank database at the National Center for Biotechnology Information (NCBI) using the basic local alignment search tool (BLAST). After a BLAST search against the sequences, the results were used for the identification of isolates.
Flavors Analysis
Fermented grain (5.0 g) was mixed with 20 mL of deionized water, ultrasonically treated at 0°C for 30 min, and then centrifuged at 4°C (8,000 × g) for 5 min. Eight milliliters of supernatant and 20 μL menthol (internal standard, 100 μg/mL) were placed into a 20-mL headspace vial with 3 g NaCl. Flavors were determined by HS-SPME-GC-MS (GC 6890N and MS 5975; Agilent Technologies, Santa Clara, CA, United States) on a DB-Wax column (30 m × 0.25 mm i.d., 0.25 μm film thickness; J&W Scientific, Folsom, CA, United States), according to the reported method (Gao et al., 2014).
Total DNA Extraction, Qualification, and Sequencing
Total DNA was extracted from 5 g fermented grains via the E.Z.N.A. (easy nucleic acid isolation) soil DNA kit (Omega bio-tek, Norcross, GA, United States) according to the processing instructions. Bacterial communities were studied by amplifying the V3-V4 hypervariable region of the 16S rRNA gene with universal primer sets F338 and barcode-R806 (Soergel et al., 2012). Fungal communities were studied by amplifying the internal transcribed spacer (ITS) region with primers ITS1F and ITS2R (Ihrmark et al., 2012). These primers contained a set of barcode sequences unique to each sample.
The PCR products were purified following a previous method (Ren et al., 2015). The purified PCR products were carried out on a MiSeq benchtop sequencer for 250-bp paired-end sequencing (2 × 250 bp; Illumina, San Diego, CA, United States) at Beijing Auwigene Tech., Ltd. (Beijing, China). All the generated raw sequences were analyzed using Qiime pipeline (v1.8.0) for preprocessing, taxonomic assignment, and community structure comparison (Caporaso et al., 2010). Quality trimming was conducted by removing the sequences with quality scores <30. Only sequences >200 bp were chosen for further analysis. The sequences that did not perfectly match the PCR primer, had not assigned tags, or had an N base were removed. Chimera sequences were removed using the Uchime algorithm (Edgar et al., 2011). A distance matrix was calculated from the aligned sequences and operational taxonomic units (OTUs) with a 97% identity threshold were clustered by Qiime’s uclust pipeline (Edgar, 2010). A single representative sequence from each clustered OTU was used to align to the Greengenes database (v13.8) (DeSantis et al., 2006) and the UNITE fungal ITS database (v6.0) (Koljalg et al., 2005). All sequencing data has been submitted to the DNA Data Bank of Japan (DDBJ) under the accession number of DRA007445 and DRA007455.
Analyses of Physical and Chemical Parameters
In the fermentation process, the temperature was monitored in real time by inserting three thermometers (1 m in depth) into fermented grains in each pit (2.6 × 2.4 × 1.9 m). The moisture content was measured by determining its weight loss after drying 10 g of sample at 105°C for 4 h to ensure constant weight. The acidity of fermented grains was analyzed by acid-base titration (Wang et al., 2017). The reducing sugar content was assessed by means of a colorimetric method using 3, 5-dinitrosalicylic acid (Kai et al., 2008). To analyze the ethanol and organic acid content in fermented grain samples, 20 mL of distilled water was added to 5 g samples and ultrasonically treated at 0°C for 30 min, and then centrifuged at 4°C (8,000 × g) for 5 min. The obtained supernatant was filtered through a 0.22 μm syringe filter (Nylon Acrodisc, Waters Co., Milford, MA, United States) prior to analysis. The ethanol content was detected via high-performance liquid chromatography (HPLC) (Agilent 1200 HPLC, Agilent Technologies, Santa Clara, CA, United States) with a column (Aminex HPX-87H, 300 × 7.8 mm, Bio-Rad, Hercules, CA, United States) and a refractive index detector (WGE, Germany), according to published report (Wu et al., 2013). The organic acid content was determined on a Waters Acquity ultraperformance liquid chromatography (UPLC) H-Class system (Waters, Milford, MA, United States) equipped with a quaternary solvent manager, an auto-sampler, a column compartment, a photodiode array, and an Acquity UPLC HSS T3 analytical column (100 × 2.1 mm i.d., 1.8 μm film thickness; Waters, Milford, MA, United States), according to a previous report (Tang et al., 2015).
The Sugar Profiles Analysis in Hulless Barley and Fermented Grains
To analyze the sugar profiles in hulless barley and fermented grain samples, one gram crushed hulless barley cultivar was added to 10 mL of 75% ethanol and ultrasonically treated at 0°C for 30 min. For fermented grains, five gram samples were added to 20 mL of 75% ethanol, ultrasonically treated at 0°C for 30 min. All samples were kept at 4°C for 12 h. After centrifugation (8000 × g for 10 min), the supernatant was collected and kept at water bath (80°C) for 30 min to remove protein. After centrifugation (8000 × g for 10 min), 500 μL of supernatant was collected and filtered by a 0.45 μm syringe filter (Nylon Acrodisc, Waters Co., Milford, MA, United States) and added to a screw-cap vial for subsequent analysis (Sun et al., 2014). The disaccharide content was determined by HPLC (Agilent 1100 HPLC, Agilent Technologies, Santa Clara, CA, United States) with a ZORBAX Eclipse XDB-C18 HPLC column (250 × 4.6 mm i.d., 5 μm film thickness, Agilent Technologies, Santa Clara, CA, United States) and a diode array detector, based on published report (Sun et al., 2014). The monosaccharide content was determined in a Dionex ICS-5000 ion chromatograph (Dionex, Sunnyvale, CA, United States) with a CarboPac-PA20 guard column (4 × 50 mm i.d., Dionex Corporation, Sunnyvale, CA, United States), and a CarboPac-PA20 analytical column (4 × 250 mm i.d., Dionex Corporation, Sunnyvale, CA, United States) and a pulsed amperometric detector, according to the previous report (Mellado-Mojica and Lopez, 2012).
Monoculture and Co-culture Experiments
Six strains Lactobacillus acetotolerans B1, Weissella viridescens W1, Saccharomyces cerevisiae QK1, Komagataella phaffii QK2, Aspergillus niger M1, and Pichia fermentans PF, were used for monoculture and co-culture experiments. In monoculture, the medium for fungi was yeast extract 10 g/L, peptone 20 g/L and different concentrations of glucose or fructose (5, 10, 20, 40, and 80 g/L). The medium for the bacteria was peptone 10 g/L, beef extract 10 g/L, yeast extract 5 g/L, diammonium hydrogen citrate 2 g/L, Tween 80 1 mL/L, sodium acetate 5 g/L, dipotassium hydrogen phosphate 2 g/L, magnesium sulfate 0.58 g/L, manganese sulfate, 0.25 g/L, and different concentrations of glucose or fructose (5, 10, 20, 40, and 80 g/L). The monoculture experiments were conducted in triplicate in 96 deep-well plates (volume is 2 mL) containing 1 mL medium. Six strains were separately inoculated with 1 × 10⁶ CFU/mL into the liquid medium and each experiment was static incubated at 30°C for 72 h. In co-culture, they were separately inoculated with 1 × 10⁶ CFU/g into 250 mL shaking flask filled up with the solid medium (two cultivars of hulless barley) for co-cultures. Each experiment was statically incubated at 30°C for 30 days. Samples were collected from each flask at day 0, 5, 10, 15, 20, and 30 to determine microbial enumeration using qPCR. The flavors in co-cultures at the end of fermentation were determined by GC–MS.
Quantitative Real-Time PCR (qPCR)
The qPCR was performed on Real-Time PCR System (Applied Biosystems) with the mixture of 8.2 μL ddH2O, 10.0 μL SYBR Green Supermix (SYBR®Premix Ex TaqTM II, Takara, Shanghai, China), 0.4 μL (20 μM) primers and 1.0 μL DNA templates. The information about primers is listed in Table 1. PCR program for L. acetotolerans B1 and W. viridescens W1 is as follows: 95°C for 10 min, followed by 40 cycles at 95°C for 5 s, 60°C for 30 s, and 72°C for 45 s with a final extension from 72°C to 95°C. PCR program for S. cerevisiae QK1, K. phaffii QK2, P. fermentans PF and A. niger M1 is as follows: preheating at 98°C for 3 min, 40 cycles of 98°C for 30 s, 55°C for 30 s, and an increase of 0.5°C every 5 s from 65°C to 95°C for melting curve analysis to confirm the specificity of the amplification.
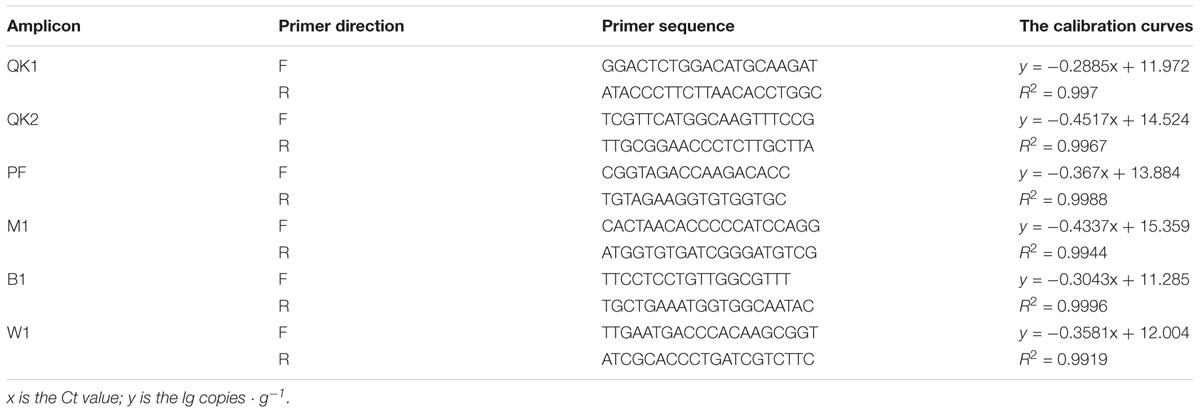
Table 1. The information about primers for qPCR in this study.
Data Analysis
The flavors were analyzed by principal component analysis (PCA) using SPSS Statistics 19.0 (IBM®SPSS®Statistics, NY, United States). To associate the microbiota and flavors, Pearson correlations coefficient (r) was calculated between the microbial genera and flavors, and r > 0.6 with statistically significant (P < 0.05) was considered as a robust correlation (De Pasquale et al., 2014). The correlation matrix was visualized using Cytoscape 3.4.0 (Shannon et al., 2003). The Mantel test was used to assess a Spearman’s correlation between entries of the dissimilarity matrix of microbiota succession and the distance matrix of physical and chemical parameters in R (version 3.2.4) via the vegan package (version 2.3-4) (Xiao et al., 2017). Redundancy analysis (RDA) was conducted based on sugar profiles and flavor-producing microbiota in fermented grains and the explanatory of physical and chemical parameters to microbiota was calculated via the vegan package (version 2.3-4) in R (version 3.2.4) (Wang et al., 2018). A paired-sample t-test was conducted to test the discrepancy of sugar profiles in different hulless barley and physical and chemical parameters in fermented grains.
Results
The Effect of Raw Material on Flavor Production During Hulless Barley Liquor Fermentation
The nutrient composition of hulless barley was detected, and the content of crude protein (157.5 mg/g) was significantly (P < 0.01) higher in heilaoya. However, the content of starch (588.9 mg/g) was significantly (P < 0.01) higher in dulihuang. To elucidate the effect of raw material on hulless barley fermentation, we processed two main cultivars of hulless barley fermentation. A total of 65 flavors were identified from fermented grains, including 2 acids, 15 alcohols, 7 aromatics, 12 carbonyls, 24 esters, and 5 others. PCA showed that the composition of flavors in fermented grains, heilaoya and dulihuang, were similar at the early stage of fermentation (day 0, 5, and 10), but differentiated after then (Figure 1A). The heat map revealed that more esters were produced in fermented grains heilaoya in the late stage of fermentation (day 15, 20, and 30), whereas the more carbonyls were produced in fermented grains dulihuang in the late stage of fermentation (day 20 and 30) (Figure 1B).
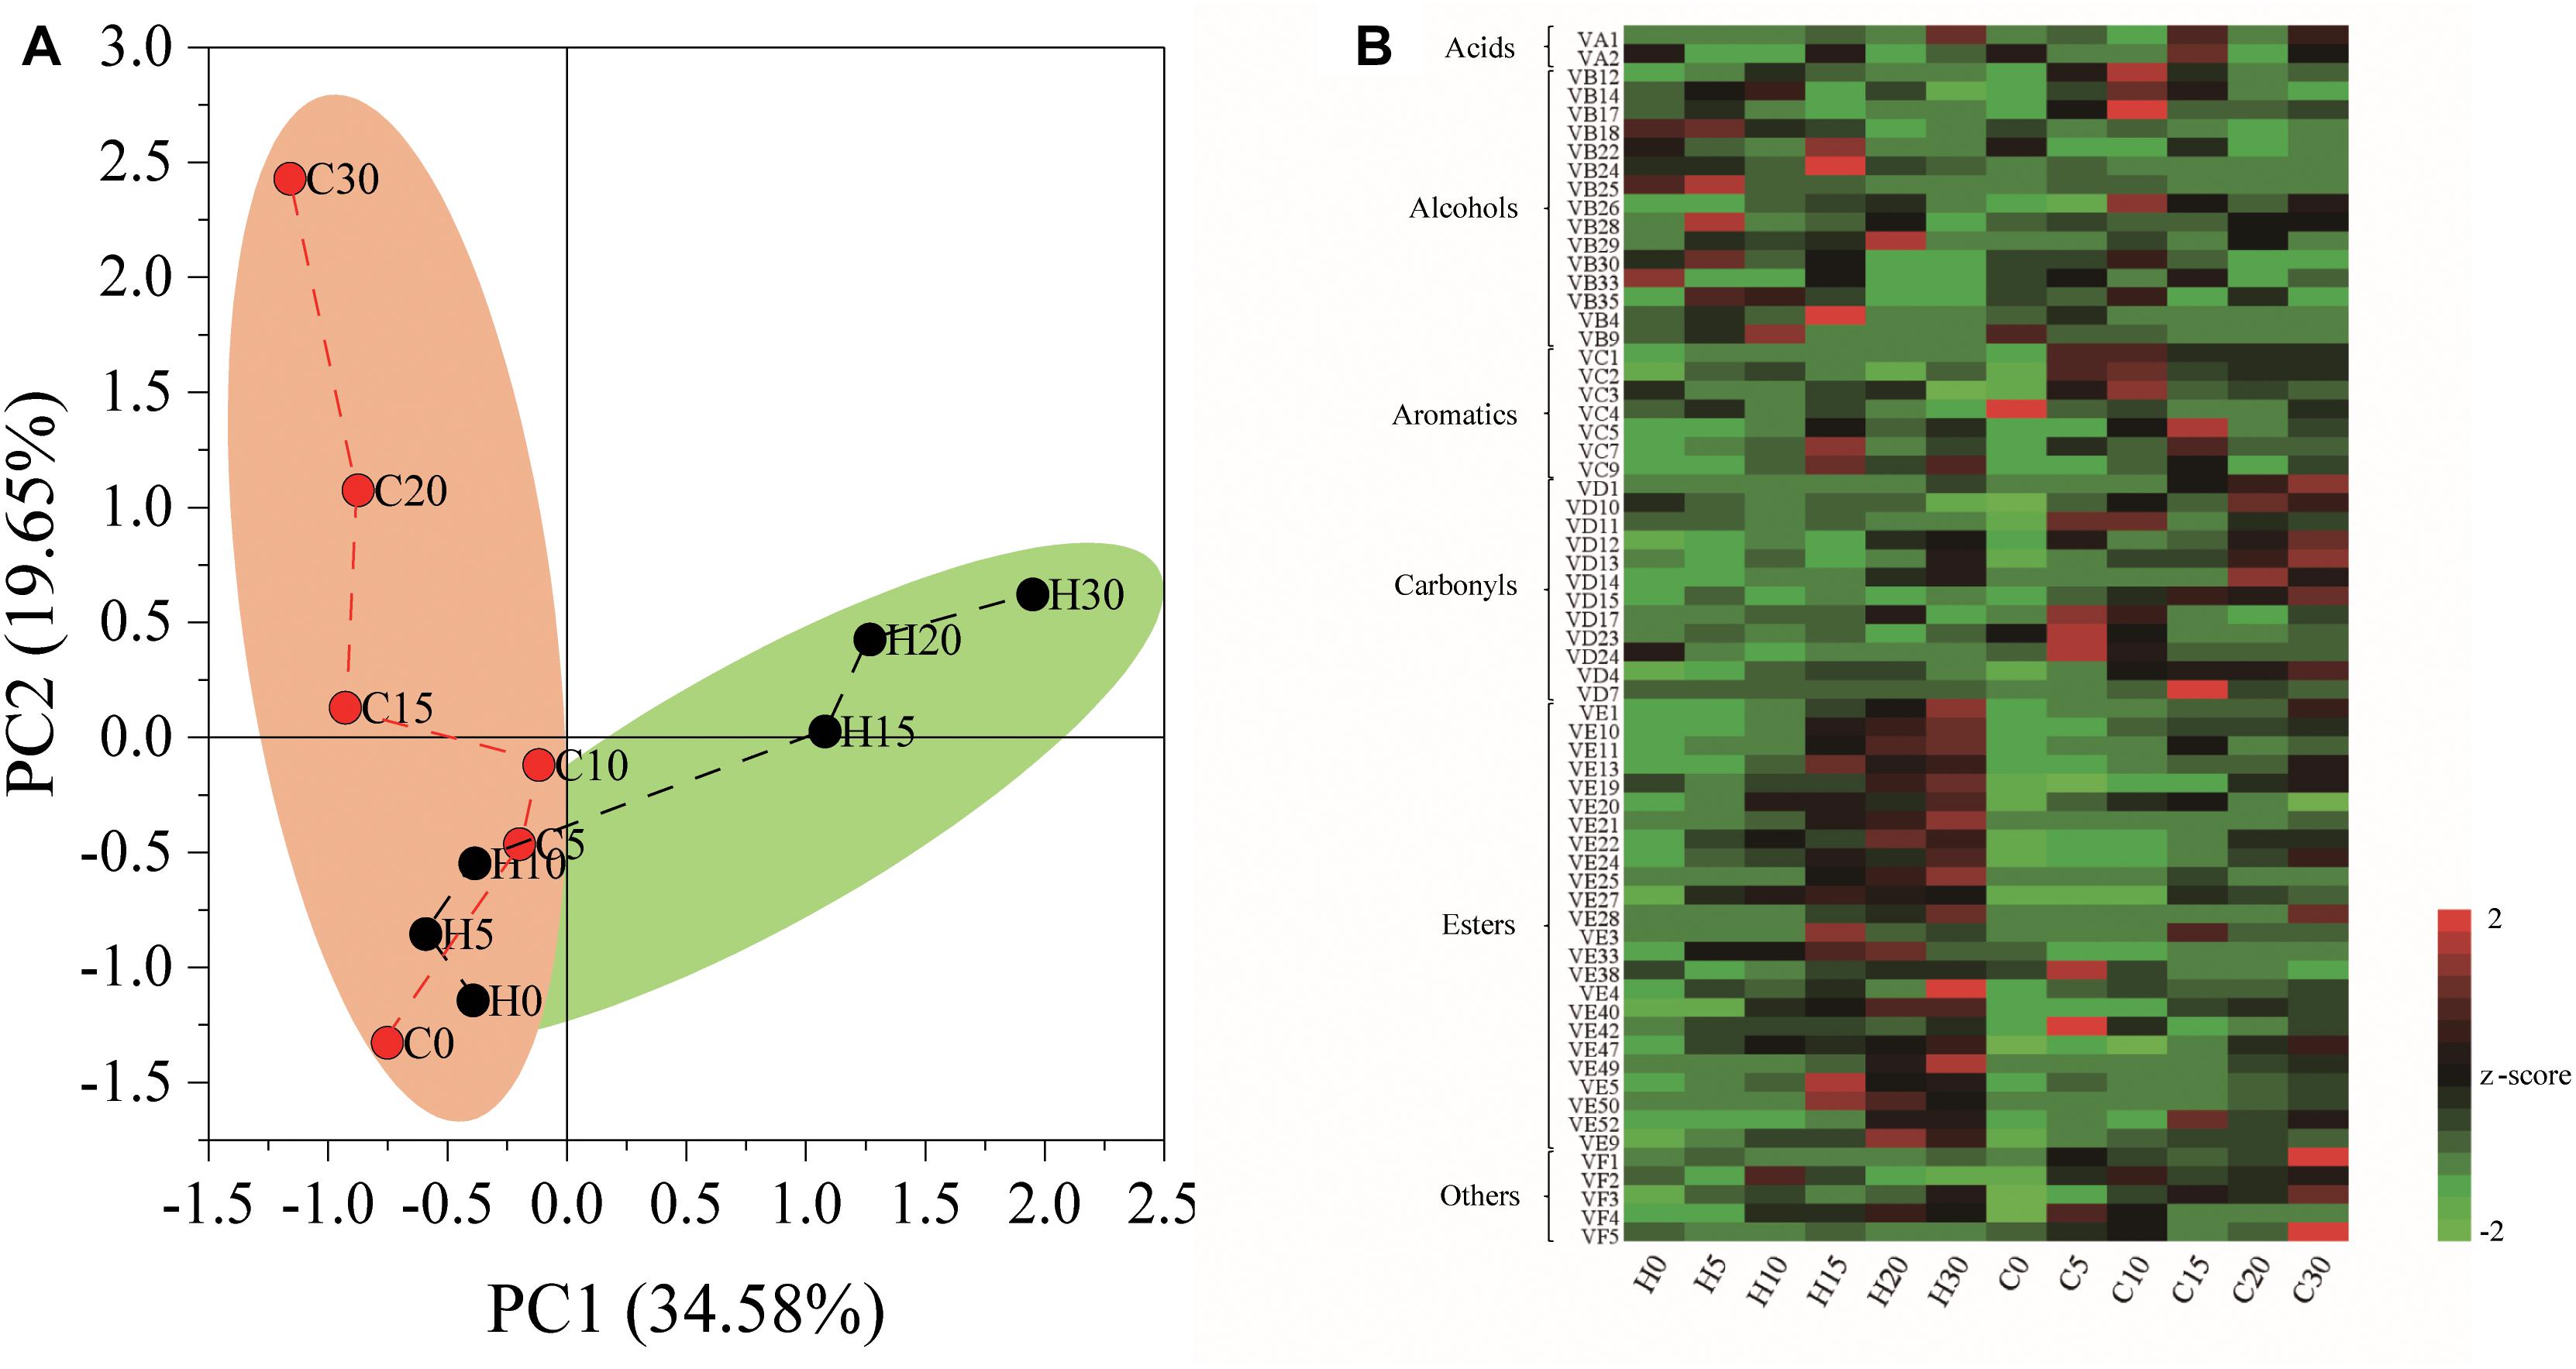
Figure 1. Flavors formation during fermentation. (A) Principal component analysis (PCA) based on flavors composition. (B) Heat map of flavors in fermented grains heilaoya and dulihuang during fermentation. A total of 65 flavors were identified from fermented grains, including 2 acids, 15 alcohols, 7 aromatics, 12 carbonyls, 24 esters, and 5 others. The Z score was used for data standardization. Fermentation time is shown as 0 to 30, e.g., “0” represents the sample fermented for day 0. H and C represents heilaoya and dulihuang, respectively.
Microbiota Pattern During Liquor Fermentation
Temporal profile of microbiota structure in fermented grains of two cultivars of hulless barley were shown in Figure 2. A total of 56 fungal genera and 120 bacterial genera were identified in all fermented grains samples. Only 9 fungal genera and 8 bacterial genera were abundant (>1%). For fungal communities, Pichia, Komagataella, Hyphopichia, Aspergillus, Saccharomyces, Candida, Wickerhamomyces, Hanseniaspora, and Geotrichum were abundant in both fermented grains heilaoya and dulihuang. Although the fungal diversity showed no significant differences (P > 0.05) throughout the fermentation process, the relative abundances of Pichia, Komagataella, Aspergillus, and Saccharomyces were different in the two types of fermented grain (Figure 2A). Pichia dramatically increased from 22 to 73% in day 5 to day 10, and Aspergillus and Saccharomyces decreased from day 0 to day 20 in fermented grains dulihuang. Whereas, Komagataella dramatically increased from 8 to 59% before day 10, and Aspergillus and Saccharomyces were stable before day 20 in fermented grains heilaoya (Figure 2A). Thus, Pichia was more abundant in fermented grains dulihuang (P < 0.05) and Komagataella was more abundant in fermented grains heilaoya (P < 0.05).
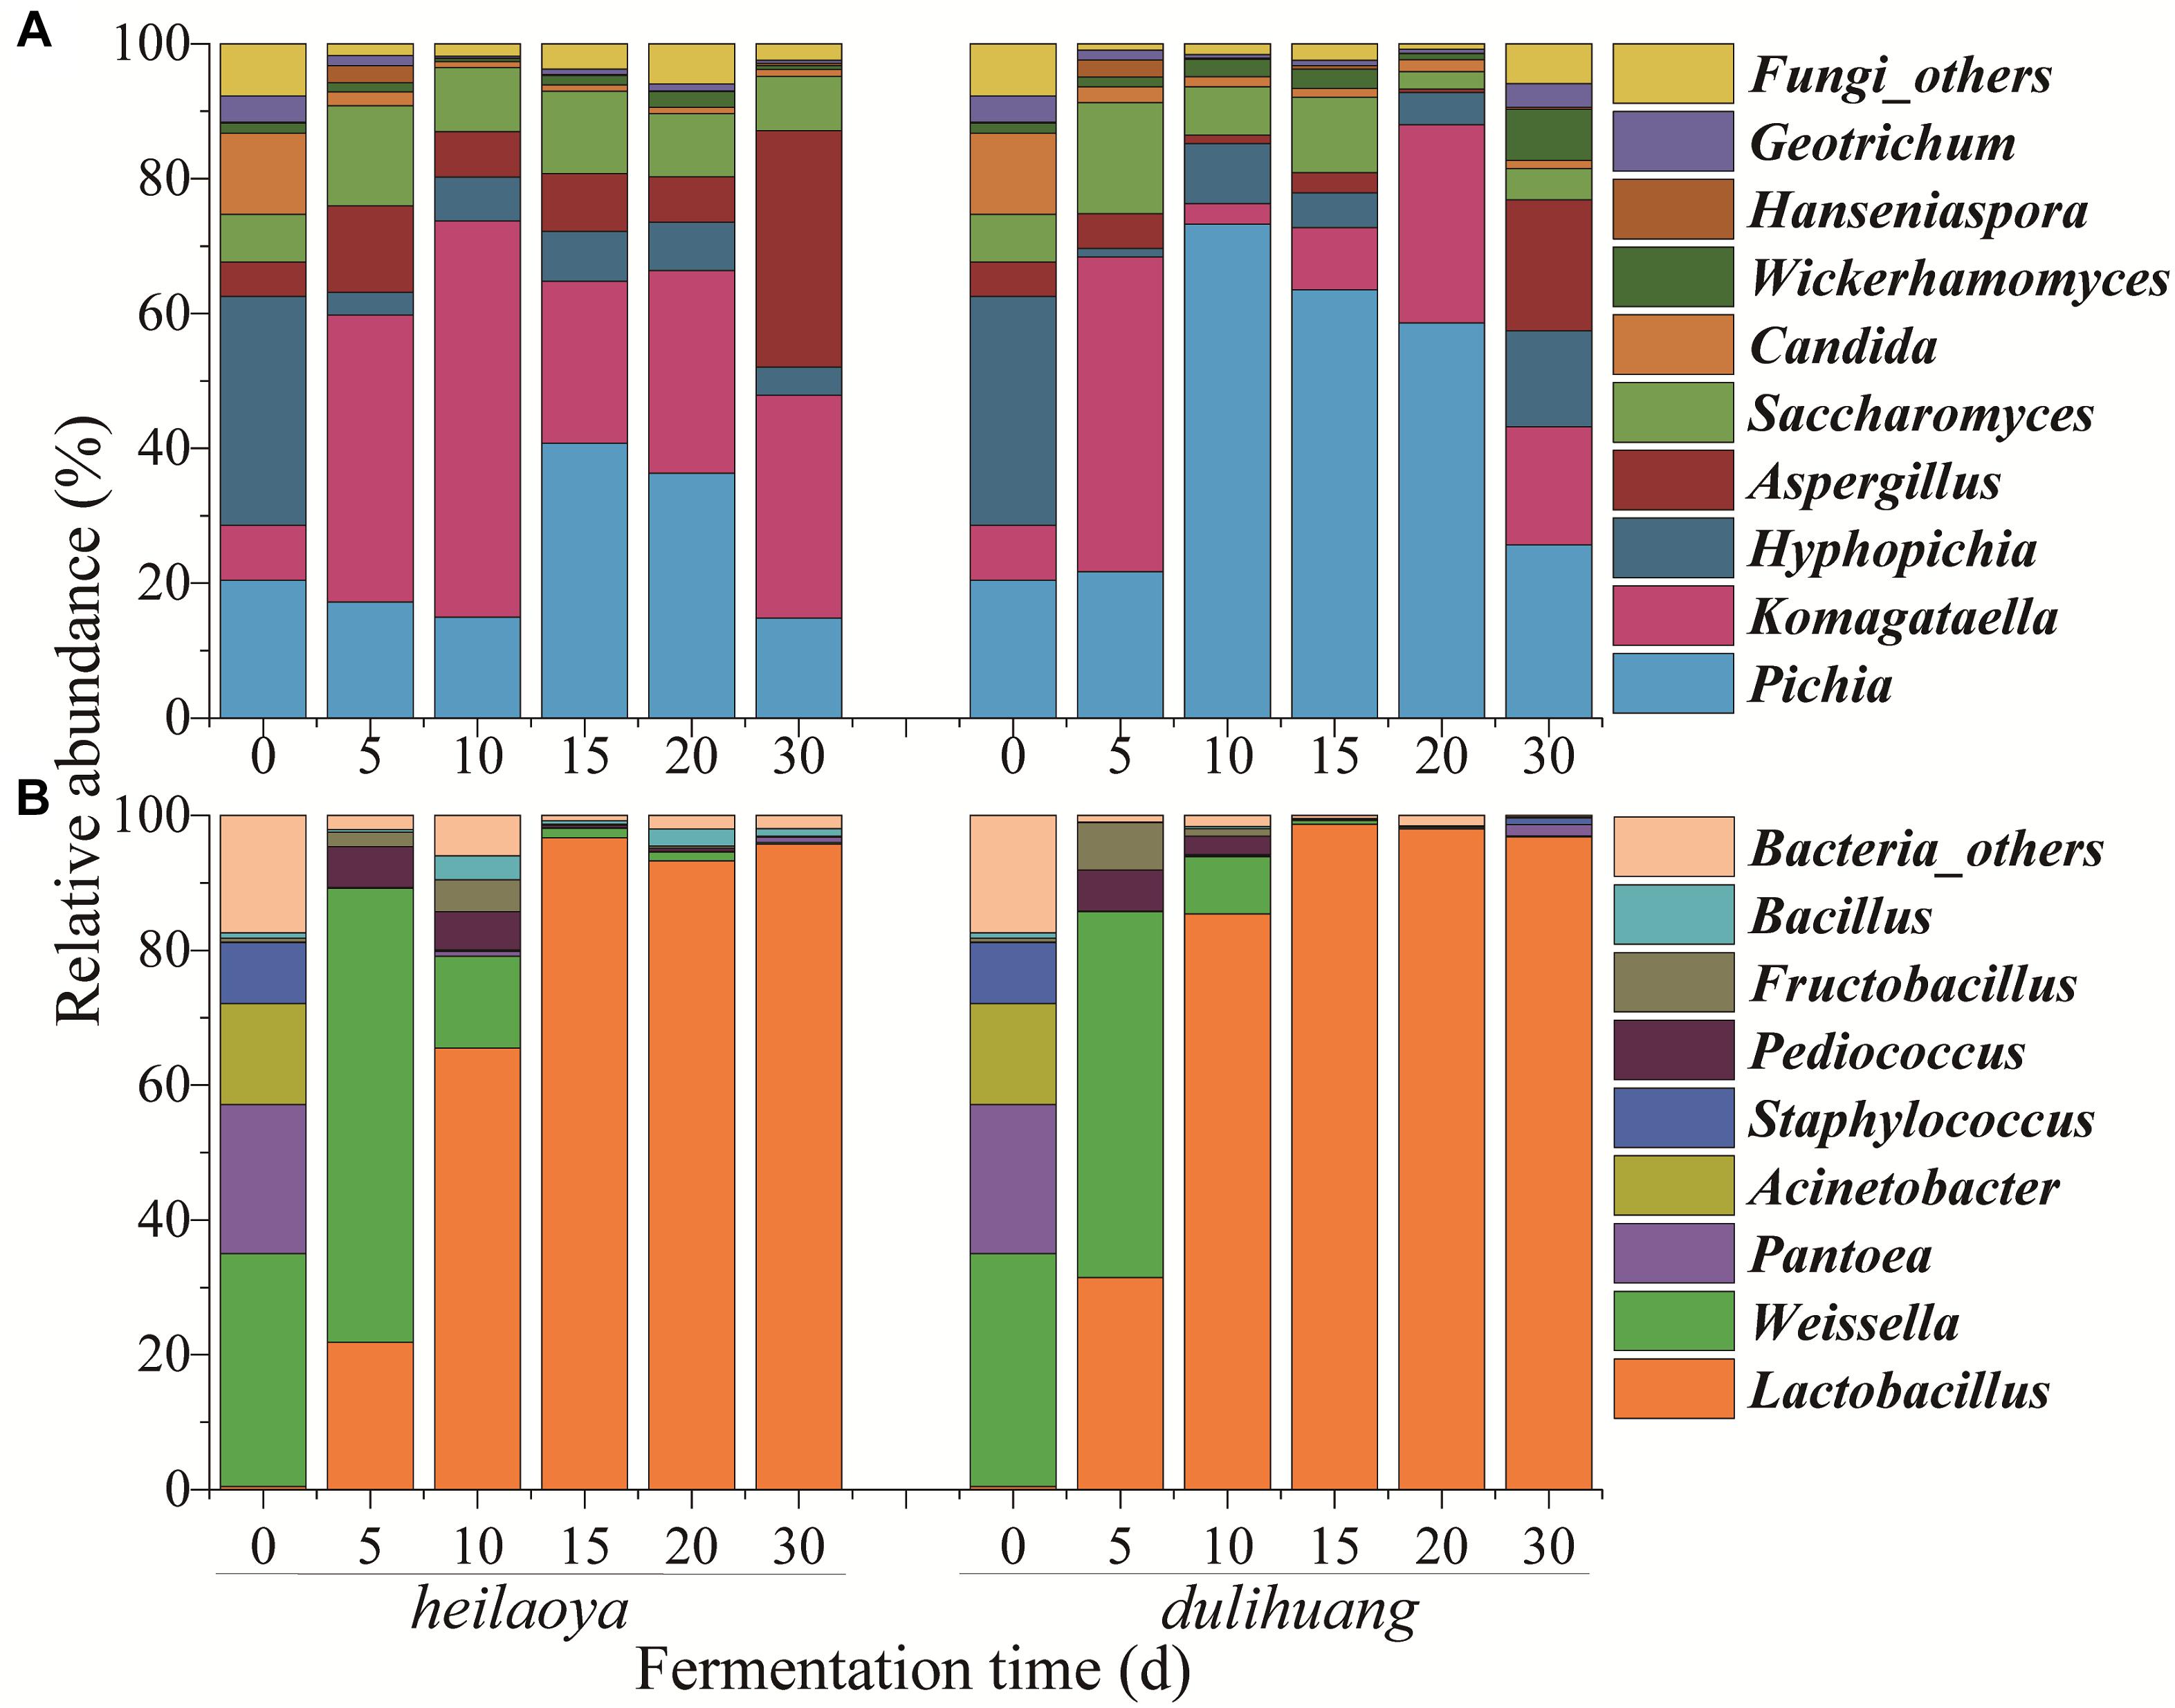
Figure 2. Distribution of microbiota during the fermentation process in two cultivars of hulless barley fermented grains (heilaoya and dulihuang). Temporal profile for the relative abundance of fungal taxa (A) and bacterial taxa (B) represents at the genus level. “Others” represents the genera with relative abundance <1%.
For bacterial communities, the abundance of Pantoea, Acinetobacter and Staphylococcus all dramatically decreased, respectively, from the beginning, and was less than 2% at the end of fermentation in both fermented grains heilaoya and dulihuang (Figure 2B). Whereas, the abundance of Weissella significantly increased from 35 to 67% and 54% in the first 5 days, and dramatically decreased until the end of fermentation in both fermented grains heilaoya and dulihuang. Relative abundance of Lactobacillus significantly increased from 0.5 to 65% in the first 10 days in fermented grains heilaoya. Surprisingly, it dramatically increased to 85% in the first 10 days in fermented grains dulihuang (Figure 2B). It indicated that Lactobacillus increased faster in fermented grains dulihuang than heilaoya.
The correlation network between microbial genera and flavors was used to identify flavor-producing microbiota (Wang et al., 2016). Lactobacillus, Saccharomyces, Komagataella, Aspergillus, Pichia, and Weissella were positively associated with the flavors assigned to acids, alcohols, aromatics, carbonyls and esters (Figure 3). These six genera were defined as flavor-producing microbiota in hulless barley fermentation. And Komagataella was positively associated with many esters while Pichia was positively associated with many carbonyls (Supplementary Table S1).
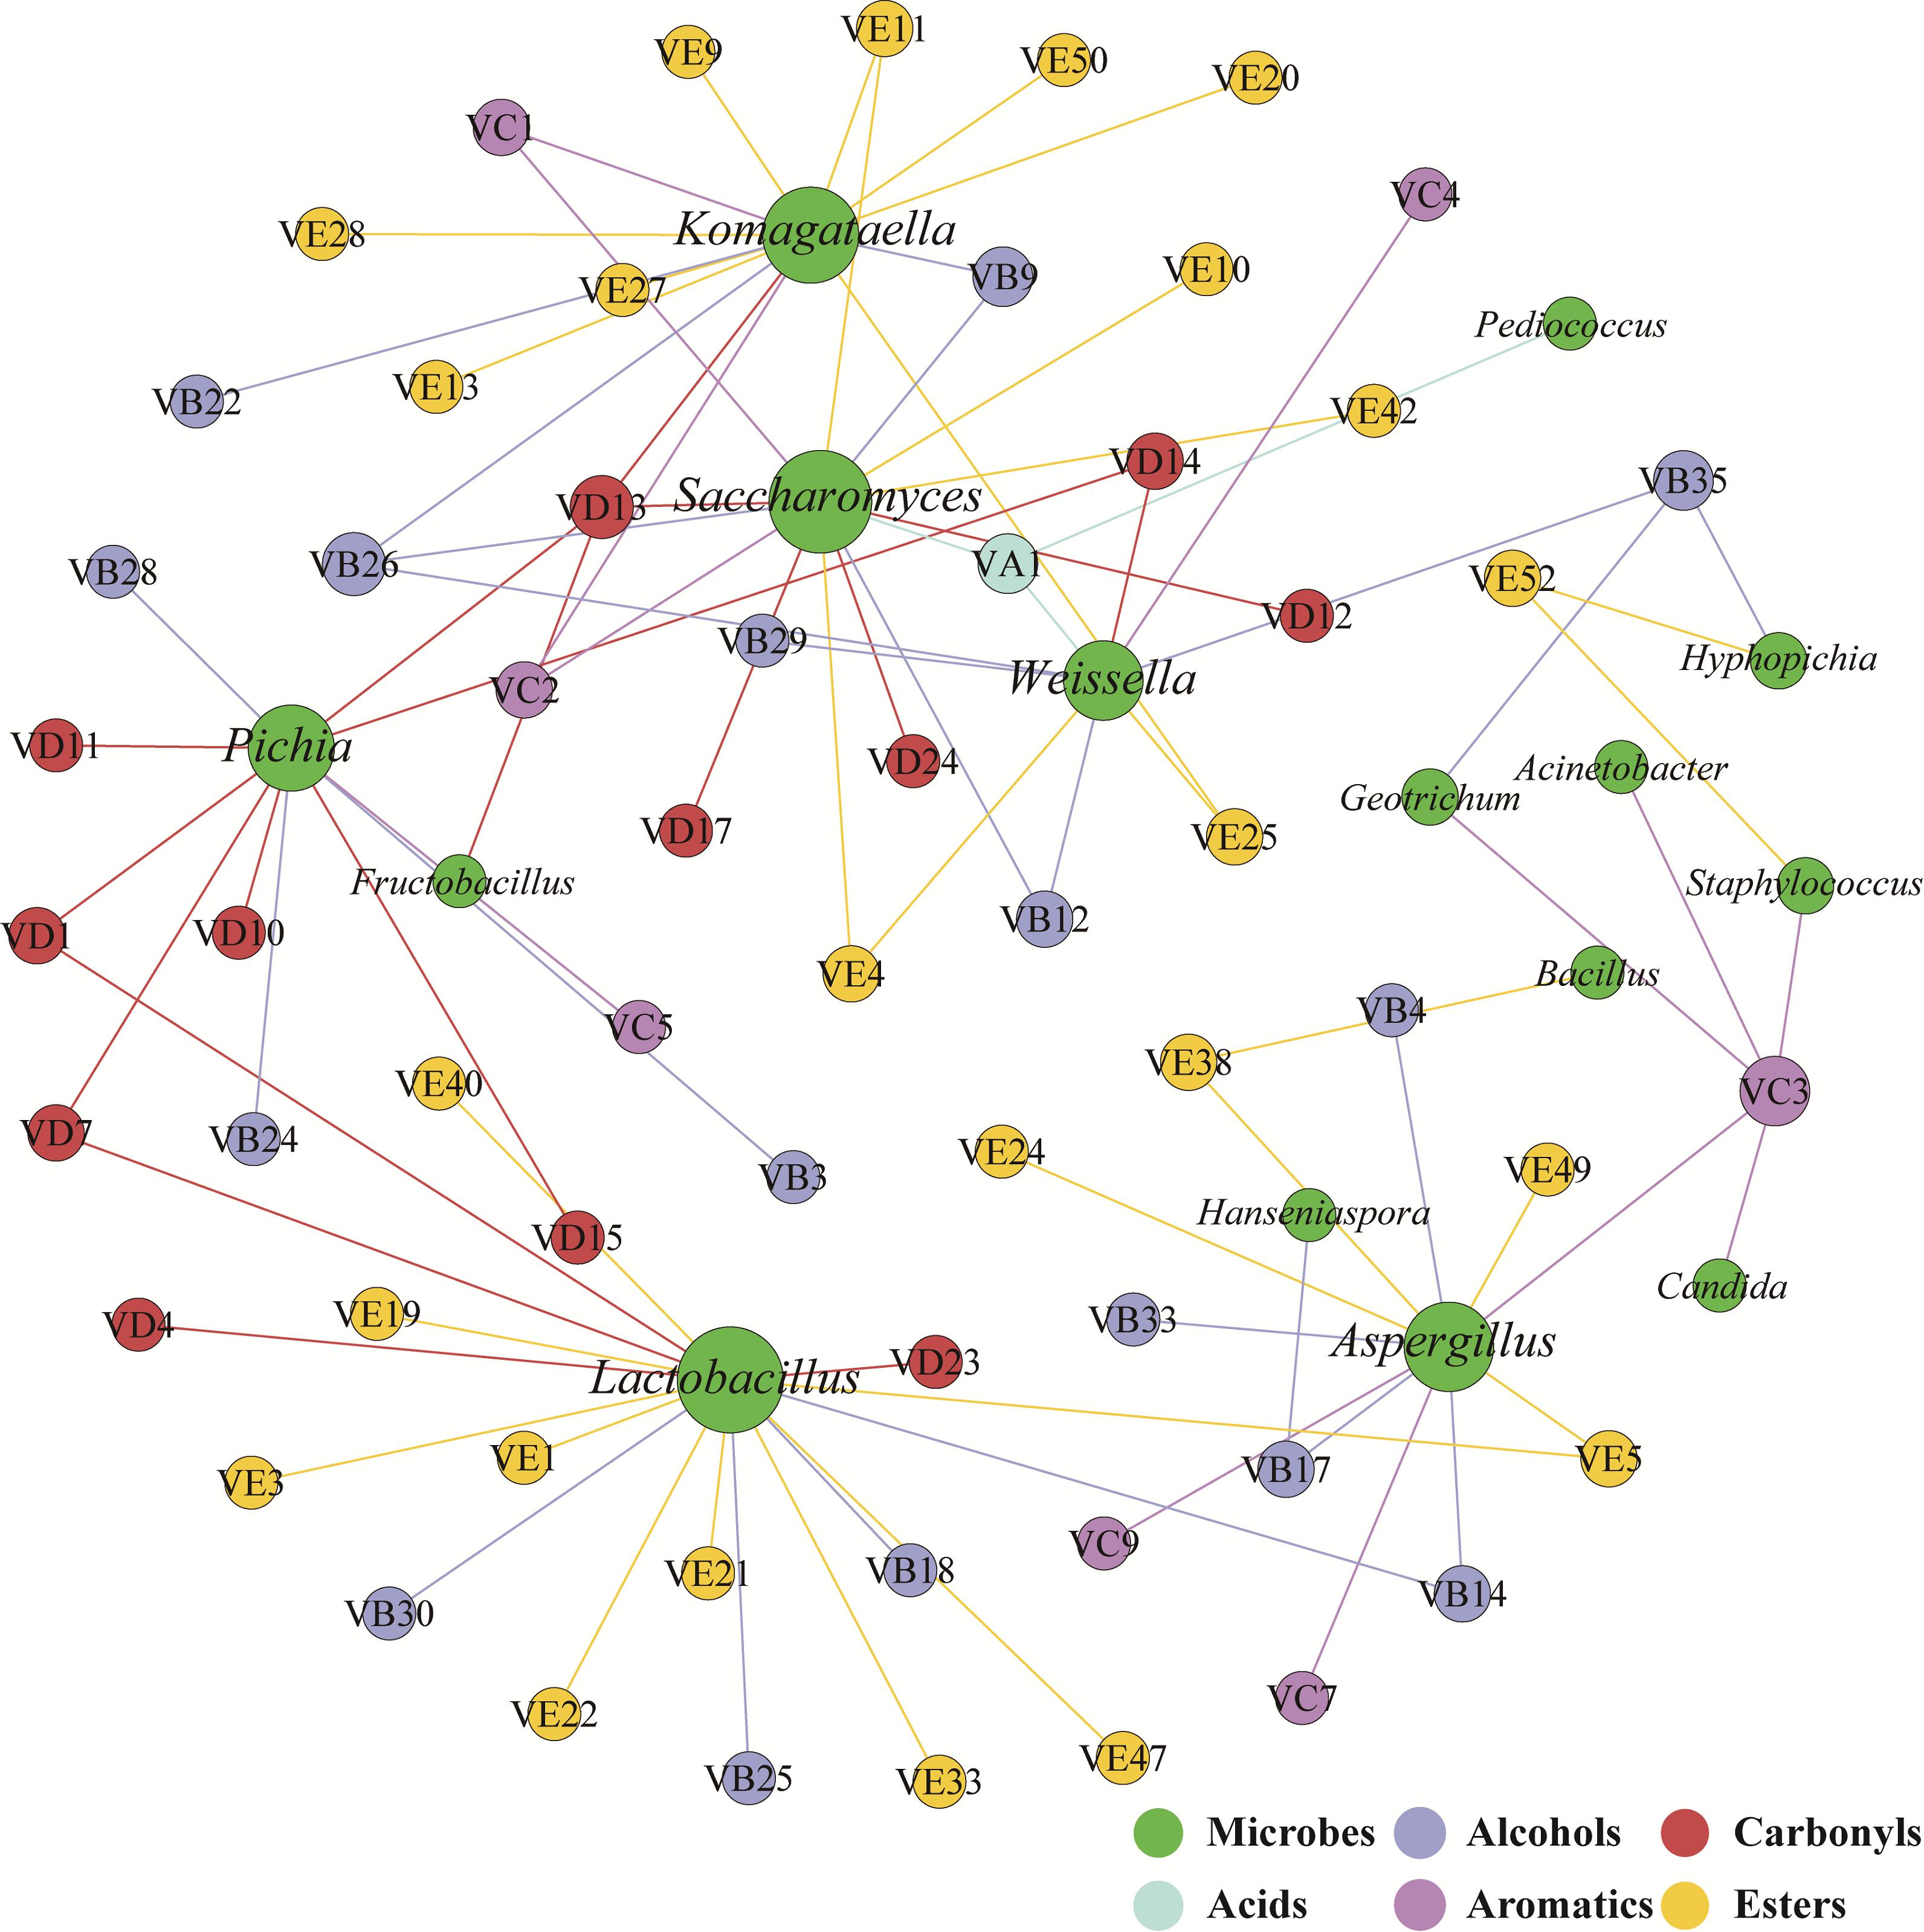
Figure 3. Correlation network between microbial genera (green) and flavors (other colored circles indicate different groups of compounds) was calculated by statistically significant (P < 0.05) and Pearson correlation coefficient (r > 0.6). The size of the circles is linked to the number of edge of microbial genera and flavors.
Relationships Between Microbiota and Physical and Chemical Parameters
The Mantel test was performed to assess significance of the Spearman’s correlation between the dynamics of physical and chemical parameters and the succession of the microbial community in fermented grains heilaoya and dulihuang (Table 2). Temperature, acidity, reducing sugar, ethanol, acetic acid and lactic acid were considered to be conventional endogenous factors during Chinese liquor fermentation (Song et al., 2017; Wang P. et al., 2018). And they were determined in fermented grains during hulless barley fermentation (Supplementary Figures S1, S2). In fermented grains heilaoya, reducing sugar (r2 = 0.6482, P = 0.001) and temperature (r2 = 0.4607, P = 0.043) correlated significantly with microbial community succession, while no significant correlation was shown between other parameters. In fermented grains dulihuang, only reducing sugar (r2 = 0.5788, P = 0.006) correlated significantly with microbial community succession (Table 2). Therefore, reducing sugar was determined to be an important diver of microbiota during hulless barley fermentation.
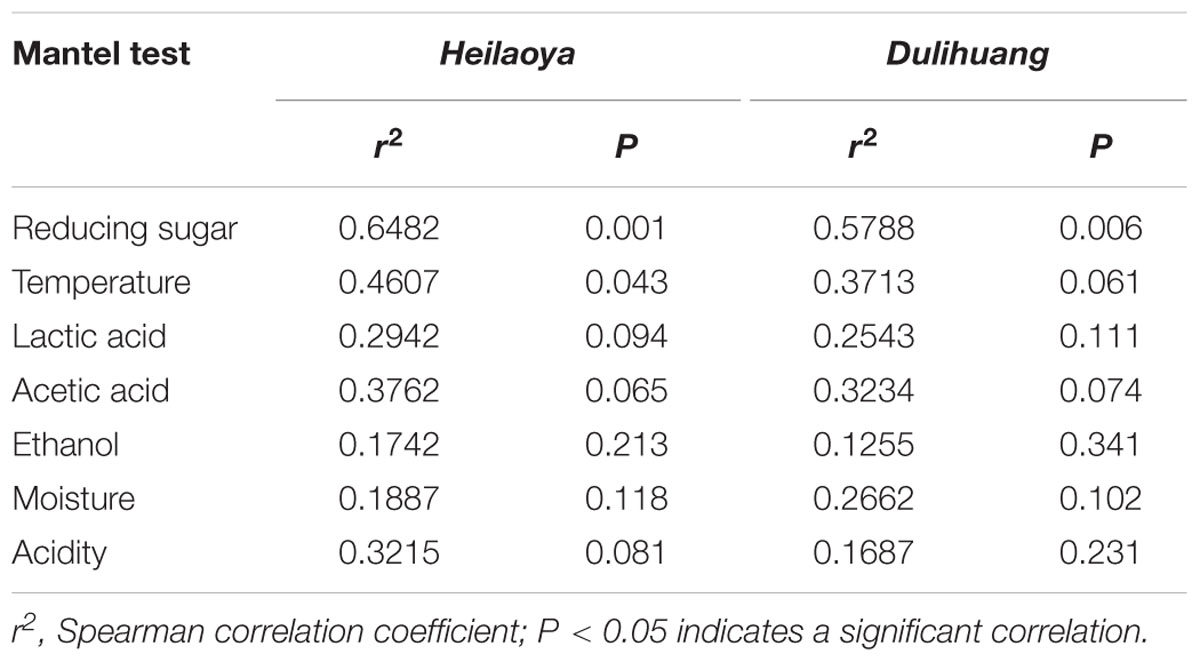
Table 2. Mantel test of physical and chemical parameters and microbial communities.
Effect of Reducing Sugar on Flavor-Producing Microbiota
To explore the effect of reducing sugar on flavor-producing microbiota, the sugar profiles was determined during fermentation. Eight kinds of sugar (galactose, glucose, fructose, arabinose, xylose, sucrose, maltose, and lactose) were identified in fermented grains. The two axes explained 59.81% of the total variance in flavor-producing microbiota, suggesting a potential correlation between sugars and flavor-producing microbiota in fermented grains (Figure 4A). RDA revealed Komagataella was positively correlated with fructose (ρ = 0.0168) in fermented grains heilaoya and Pichia was positively correlated with glucose (ρ = 0.0226) in fermented grains dulihuang. It indicated that fructose and glucose in fermented grains presented significant correlation with flavor-producing microbiota (Figure 4B).
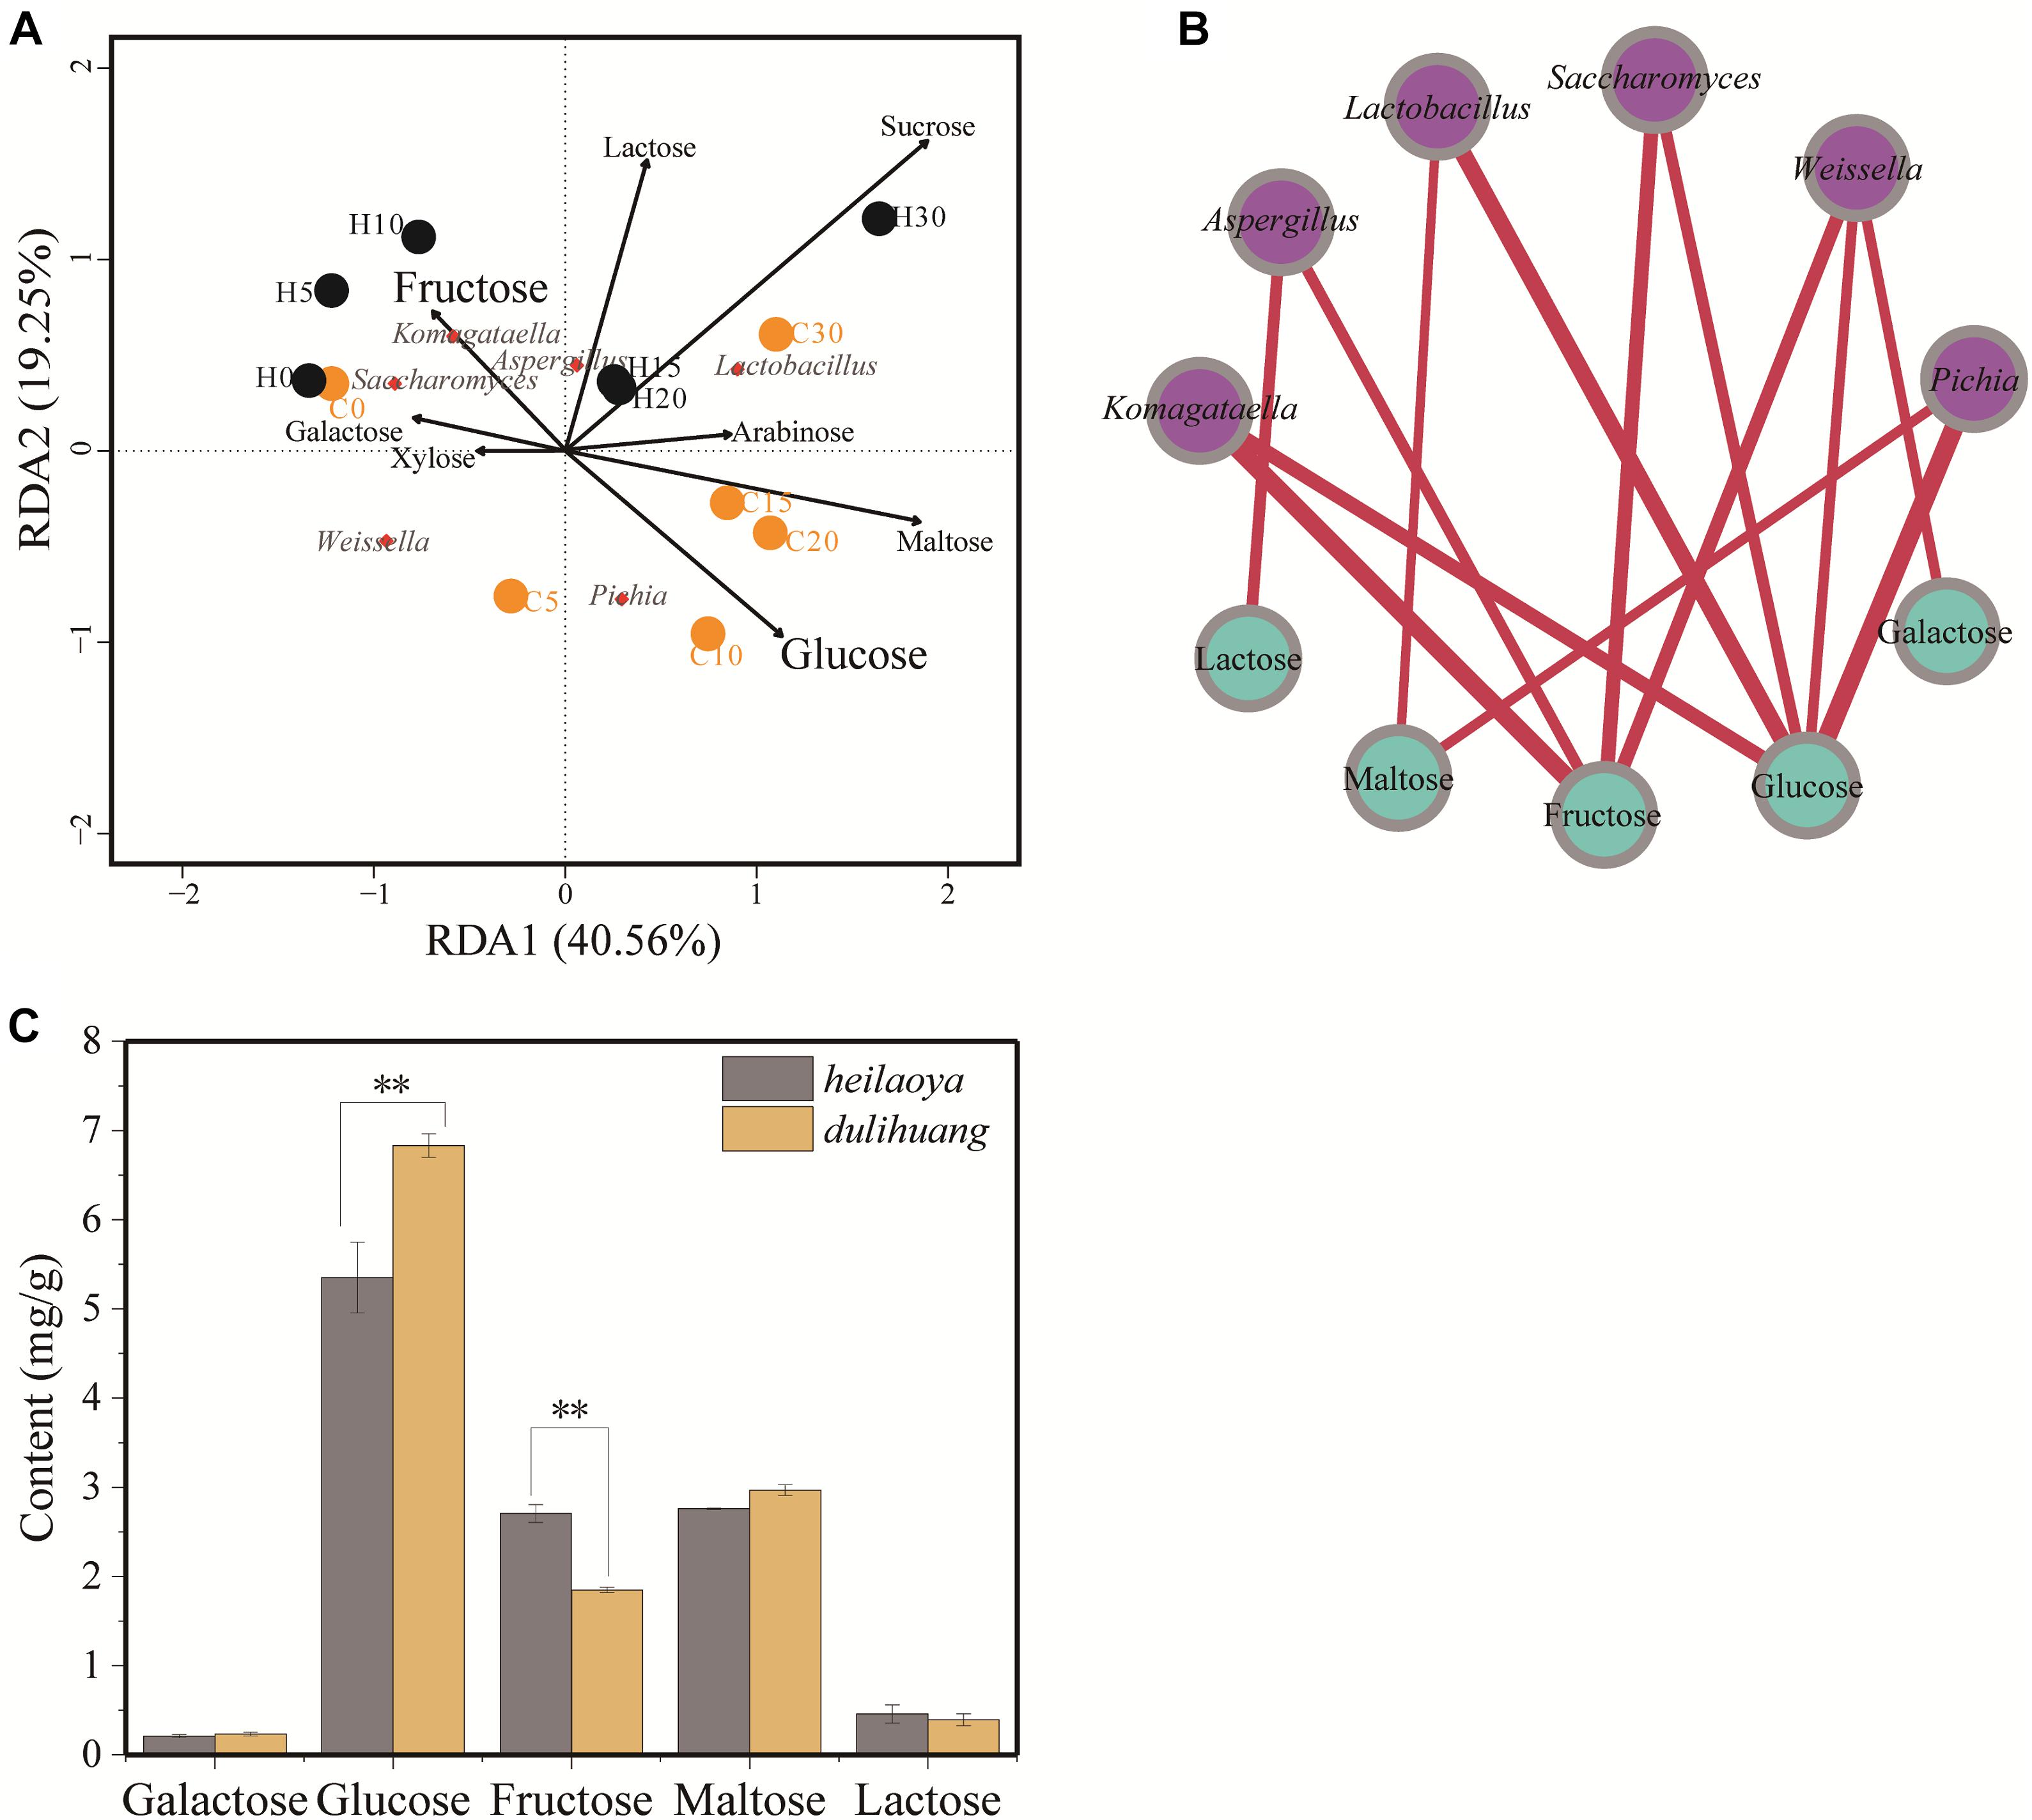
Figure 4. The composition of sugar profile and their association with flavor-producing microbiota succession. (A) Redundancy analysis (RDA) based on flavor-producing microbiota and sugar profiles in fermented grains. Fermentation time is shown as 0 to 30, e.g., “0” represents the sample fermented for day 0. H and C represents heilaoya and dulihuang, respectively. (B) Relationships between sugar profile and flavor-producing microbiota. A connection stands for a significant (P < 0.05) correlation. Size of each node is proportional to the number of connections, and the nodes are colored by blue (sugar) and purple (genus). The thickness of each connection between two nodes is proportional to the value of Spearman’s correlation coefficient (ρ). (C) Content of different sugars in hulless barley. Significant differences P< 0.01 (Students t-test) between heilaoya and dulihuang is denoted by ∗∗.
The sugar profiles in fermented grains were also monitored in the two cultivars of hulless barley (Figure 4C). Galactose, maltose, and lactose were not significantly different (P> 0.05). Whereas, the content of glucose was significantly higher in dulihuang (P< 0.01), and the content of fructose was significantly higher in heilaoya (P< 0.01). That suggested the sugar profiles in hulless barley selected flavor-producing microbiota in fermented grains, resulting in different flavors formation.
Fructose and Glucose Drove the Flavor-Producing Microbiota
The impact of fructose and glucose on flavor-producing microbiota was determined in monoculture experiments. Six strains (L. acetotolerans B1, W. viridescens W1, S. cerevisiae QK1, K. phaffii QK2, A. niger M1, and P. fermentans PF) isolated from this liquor fermentation process were used in the experiments. In monoculture, K. phaffii QK2 and A. niger M1 grew better in medium with fructose. They were positively correlated with fructose (ρ = 0.922∗ and ρ = 0.940∗) (Figures 5A,D). In contrast, P. fermentans PF was positively correlated with glucose (ρ = 0.904∗) (Figure 5B). L. acetotolerans B1 was both positively correlated with glucose and fructose (Figure 5E). But no significant correlation was shown for S. cerevisiae QK1 and W. viridescens W1 (Figures 5C,F). Therefore, K. phaffii QK2 and A. niger M1 showed preference for fructose, whereas P. fermentans PF showed preference for glucose.
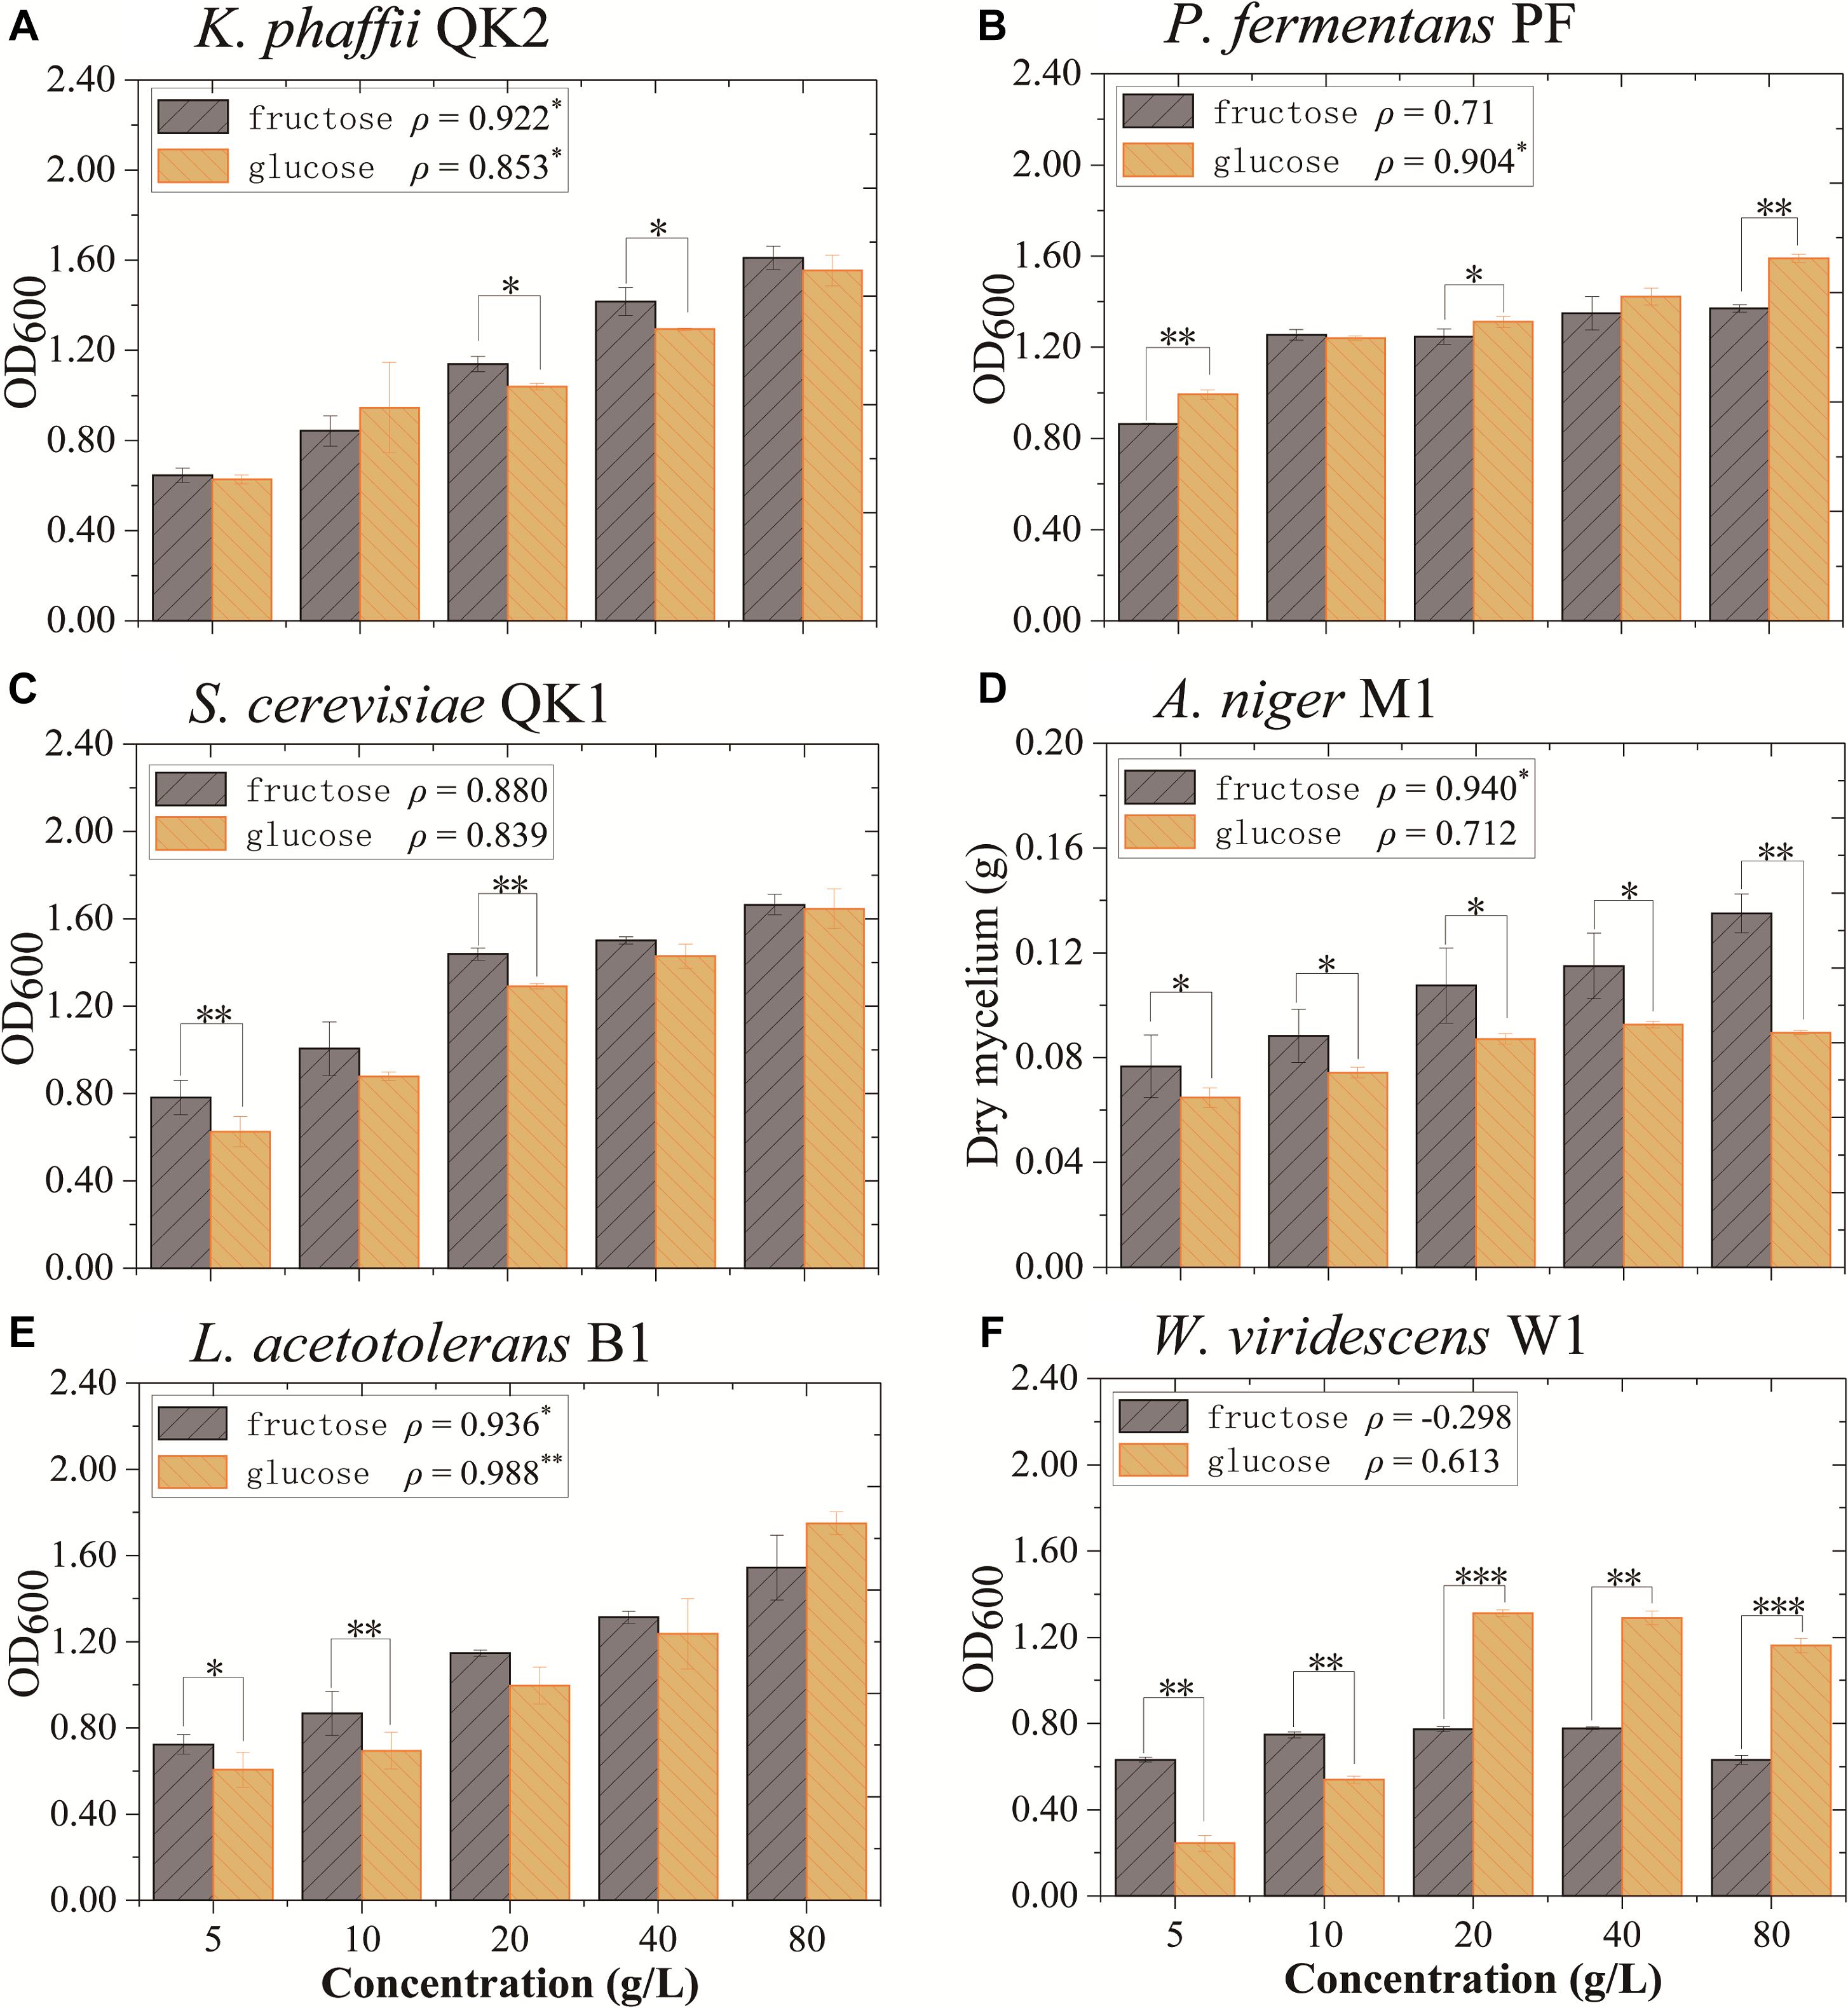
Figure 5. Growth of flavor-producing microbes in different concentrations of fructose and glucose after 3 days of cultivation. (A) K. phaffii QK2, (B) P. fermentans PF, (C) S. cerevisiae QK1, (D) A. niger M1, (E) L. acetotolerans B1, and (F) W. viridescens W1. The dry mycelium represents the biomass of A. niger M1 and the OD600 represents the biomass of other microbes. ρ indicates the value of Pearson correlation coefficient. Significant correlation (P< 0.05, P< 0.01, and P< 0.001) is denoted by ∗, ∗∗, and ∗∗∗.
Solid State Fermentation of Flavor-Producing Microbiota
The co-culture of six strains was performed in the solid medium with two cultivars of hulless barley as material separately. The cell growth of six strains in dulihuang was compared with those in heilaoya. K. phaffii QK2 was observed the significantly higher biomass (P< 0.05) in heilaoya throughout the fermentation process (Figure 6A) and S. cerevisiae QK1 had the highest biomass at day 5 in heilaoya (Figure 6C). However, P. fermentans PF and L. acetotolerans B1 had the significantly higher biomass (P< 0.05) in dulihuang throughout the fermentation process (Figures 6B,E). No significant differences for A. niger M1 and W. viridescens W1 were observed during the fermentation (Figures 6D,F). At the end of fermentation, the flavors profile of different fermented samples (heilaoya and dulihuang) was detected, including alcohols, acids, esters, carbonyls, and aromatics (Figure 7). The significantly higher content (P< 0.05) of esters (7.29 mg/kg) was found in heilaoya, and the significantly higher content (P< 0.05) of carbonyls (0.04 mg/kg) was discovered in dulihuang. These results showed heilaoya with higher fructose selected K. phaffii QK2, which produced more esters and dulihuang with higher glucose selected P. fermentans PF, which produced more carbonyls.
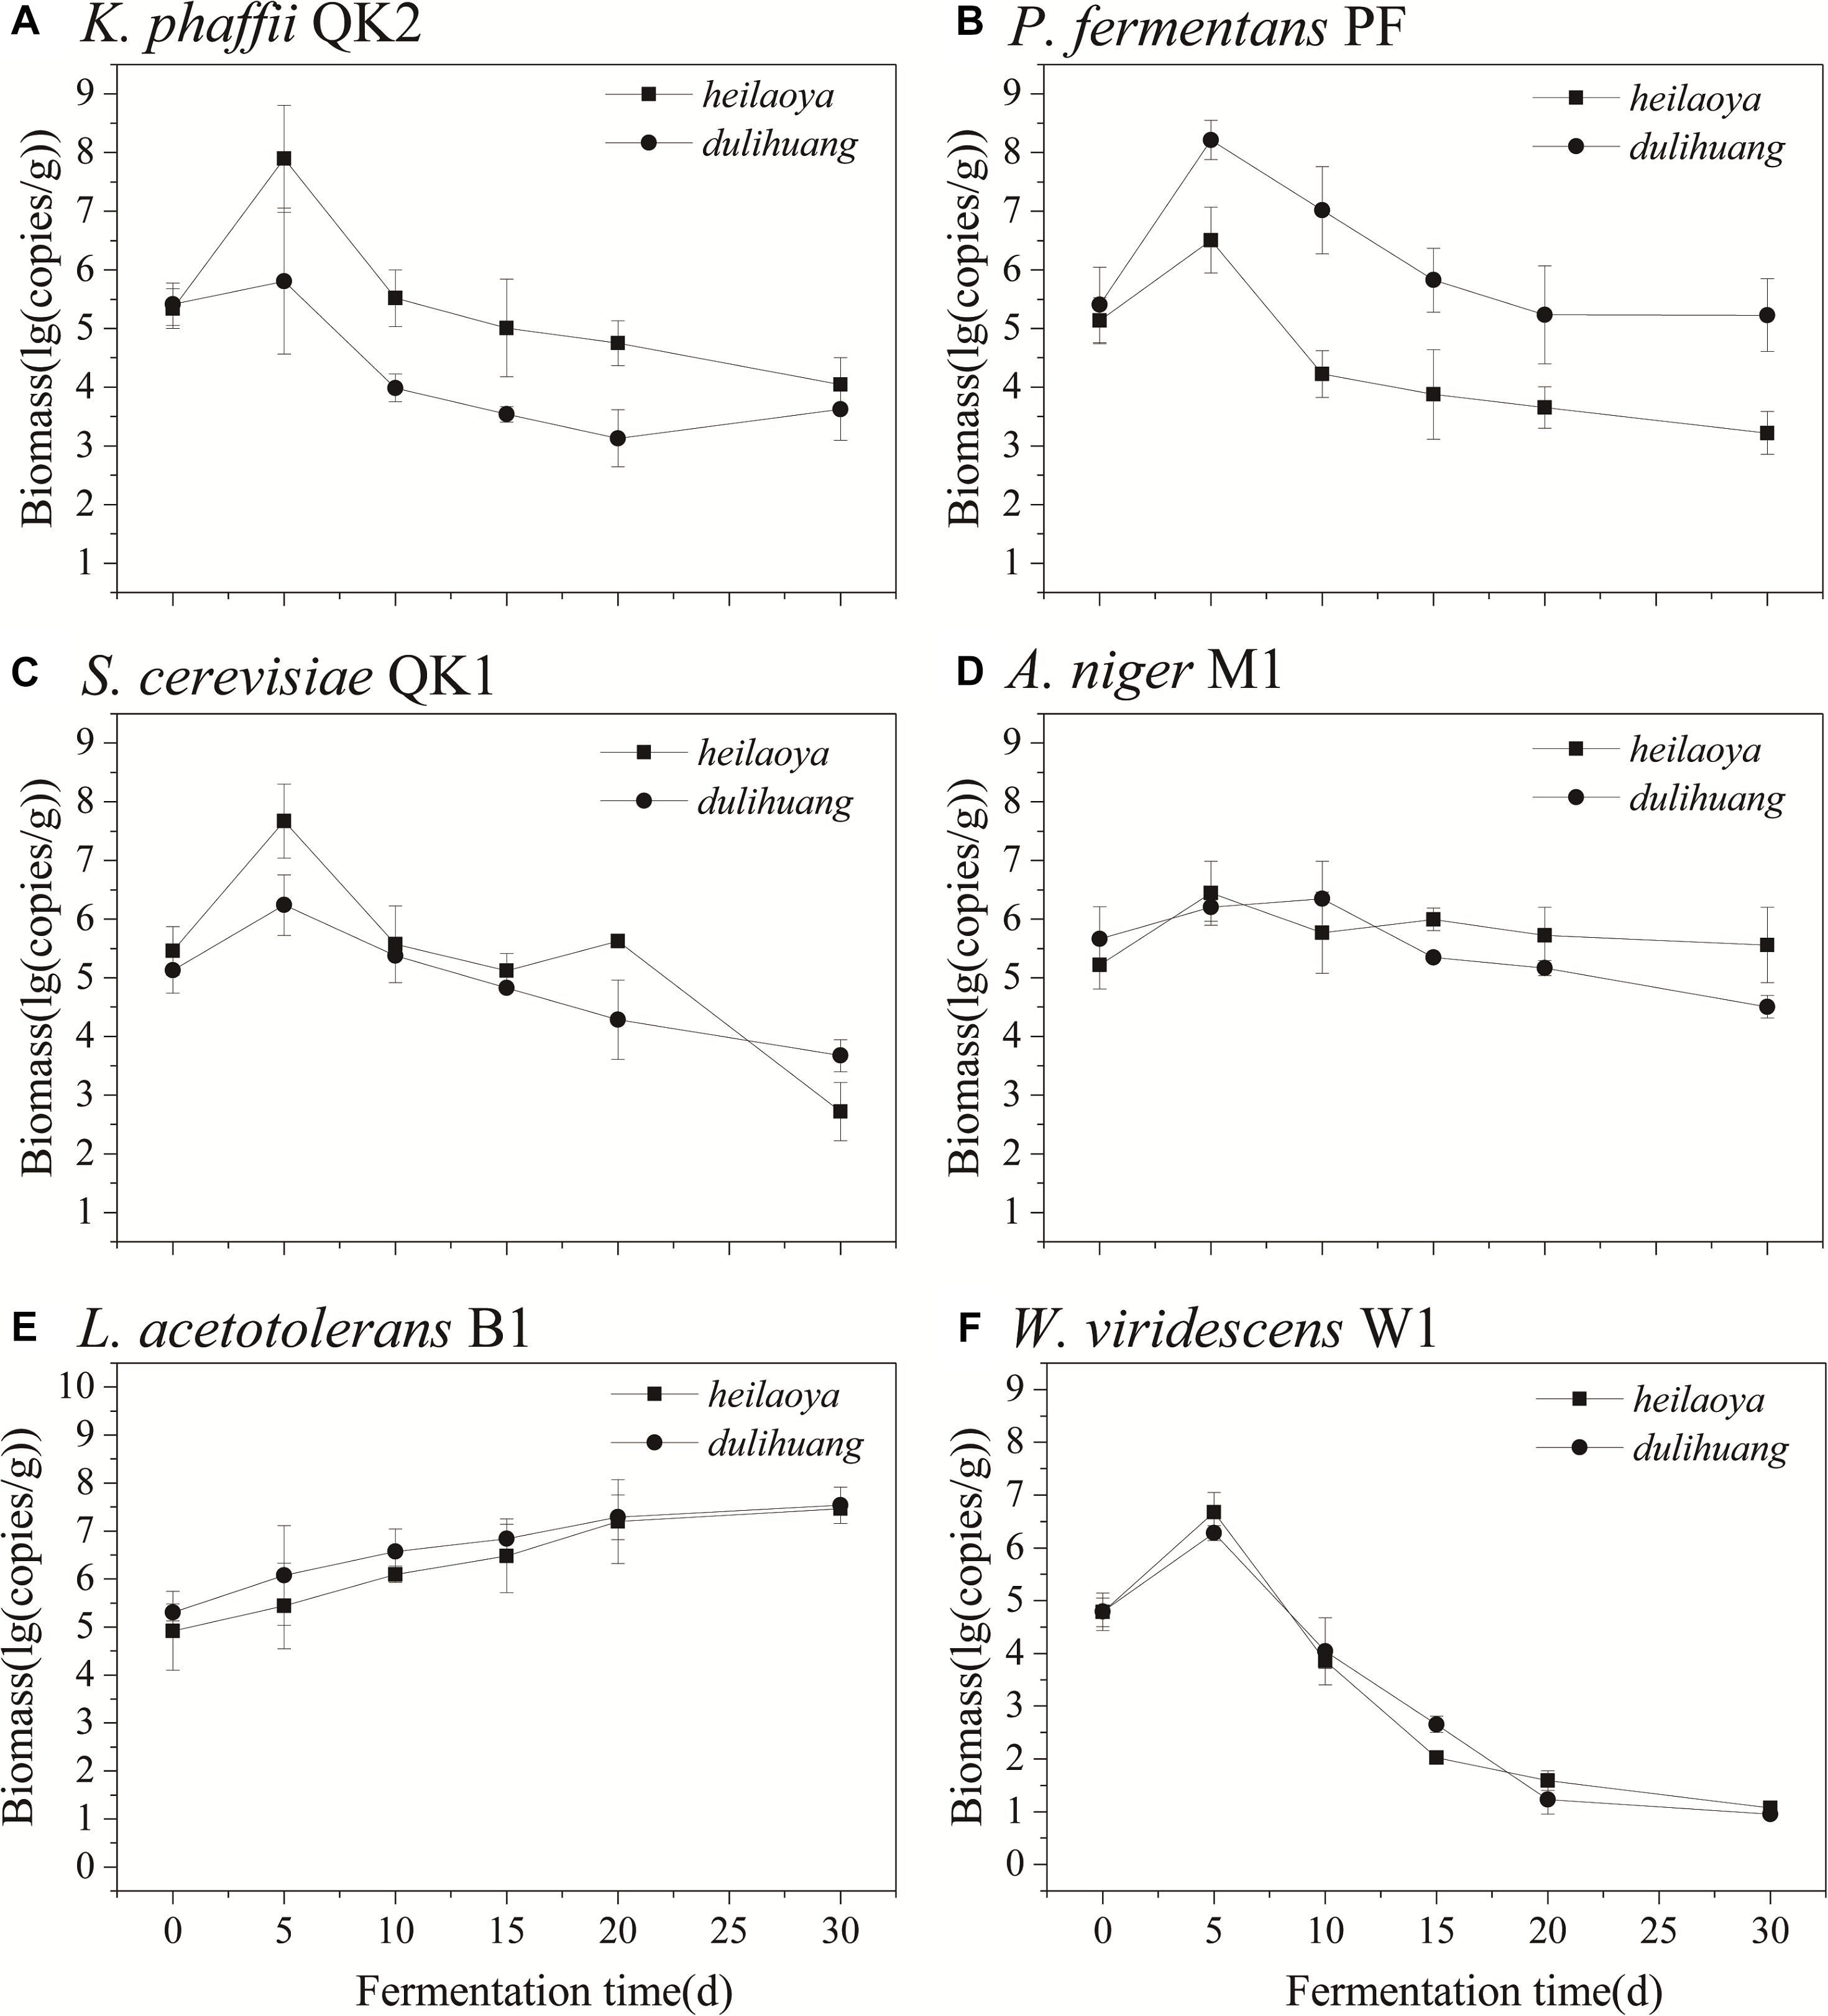
Figure 6. Comparison of biomass of flavor-producing microbes in co-cultures. (A) K. phaffii QK2, (B) P. fermentans PF, (C) S. cerevisiae QK1, (D) A. niger M1, (E) L. acetotolerans B1, and (F) W. viridescens W1.
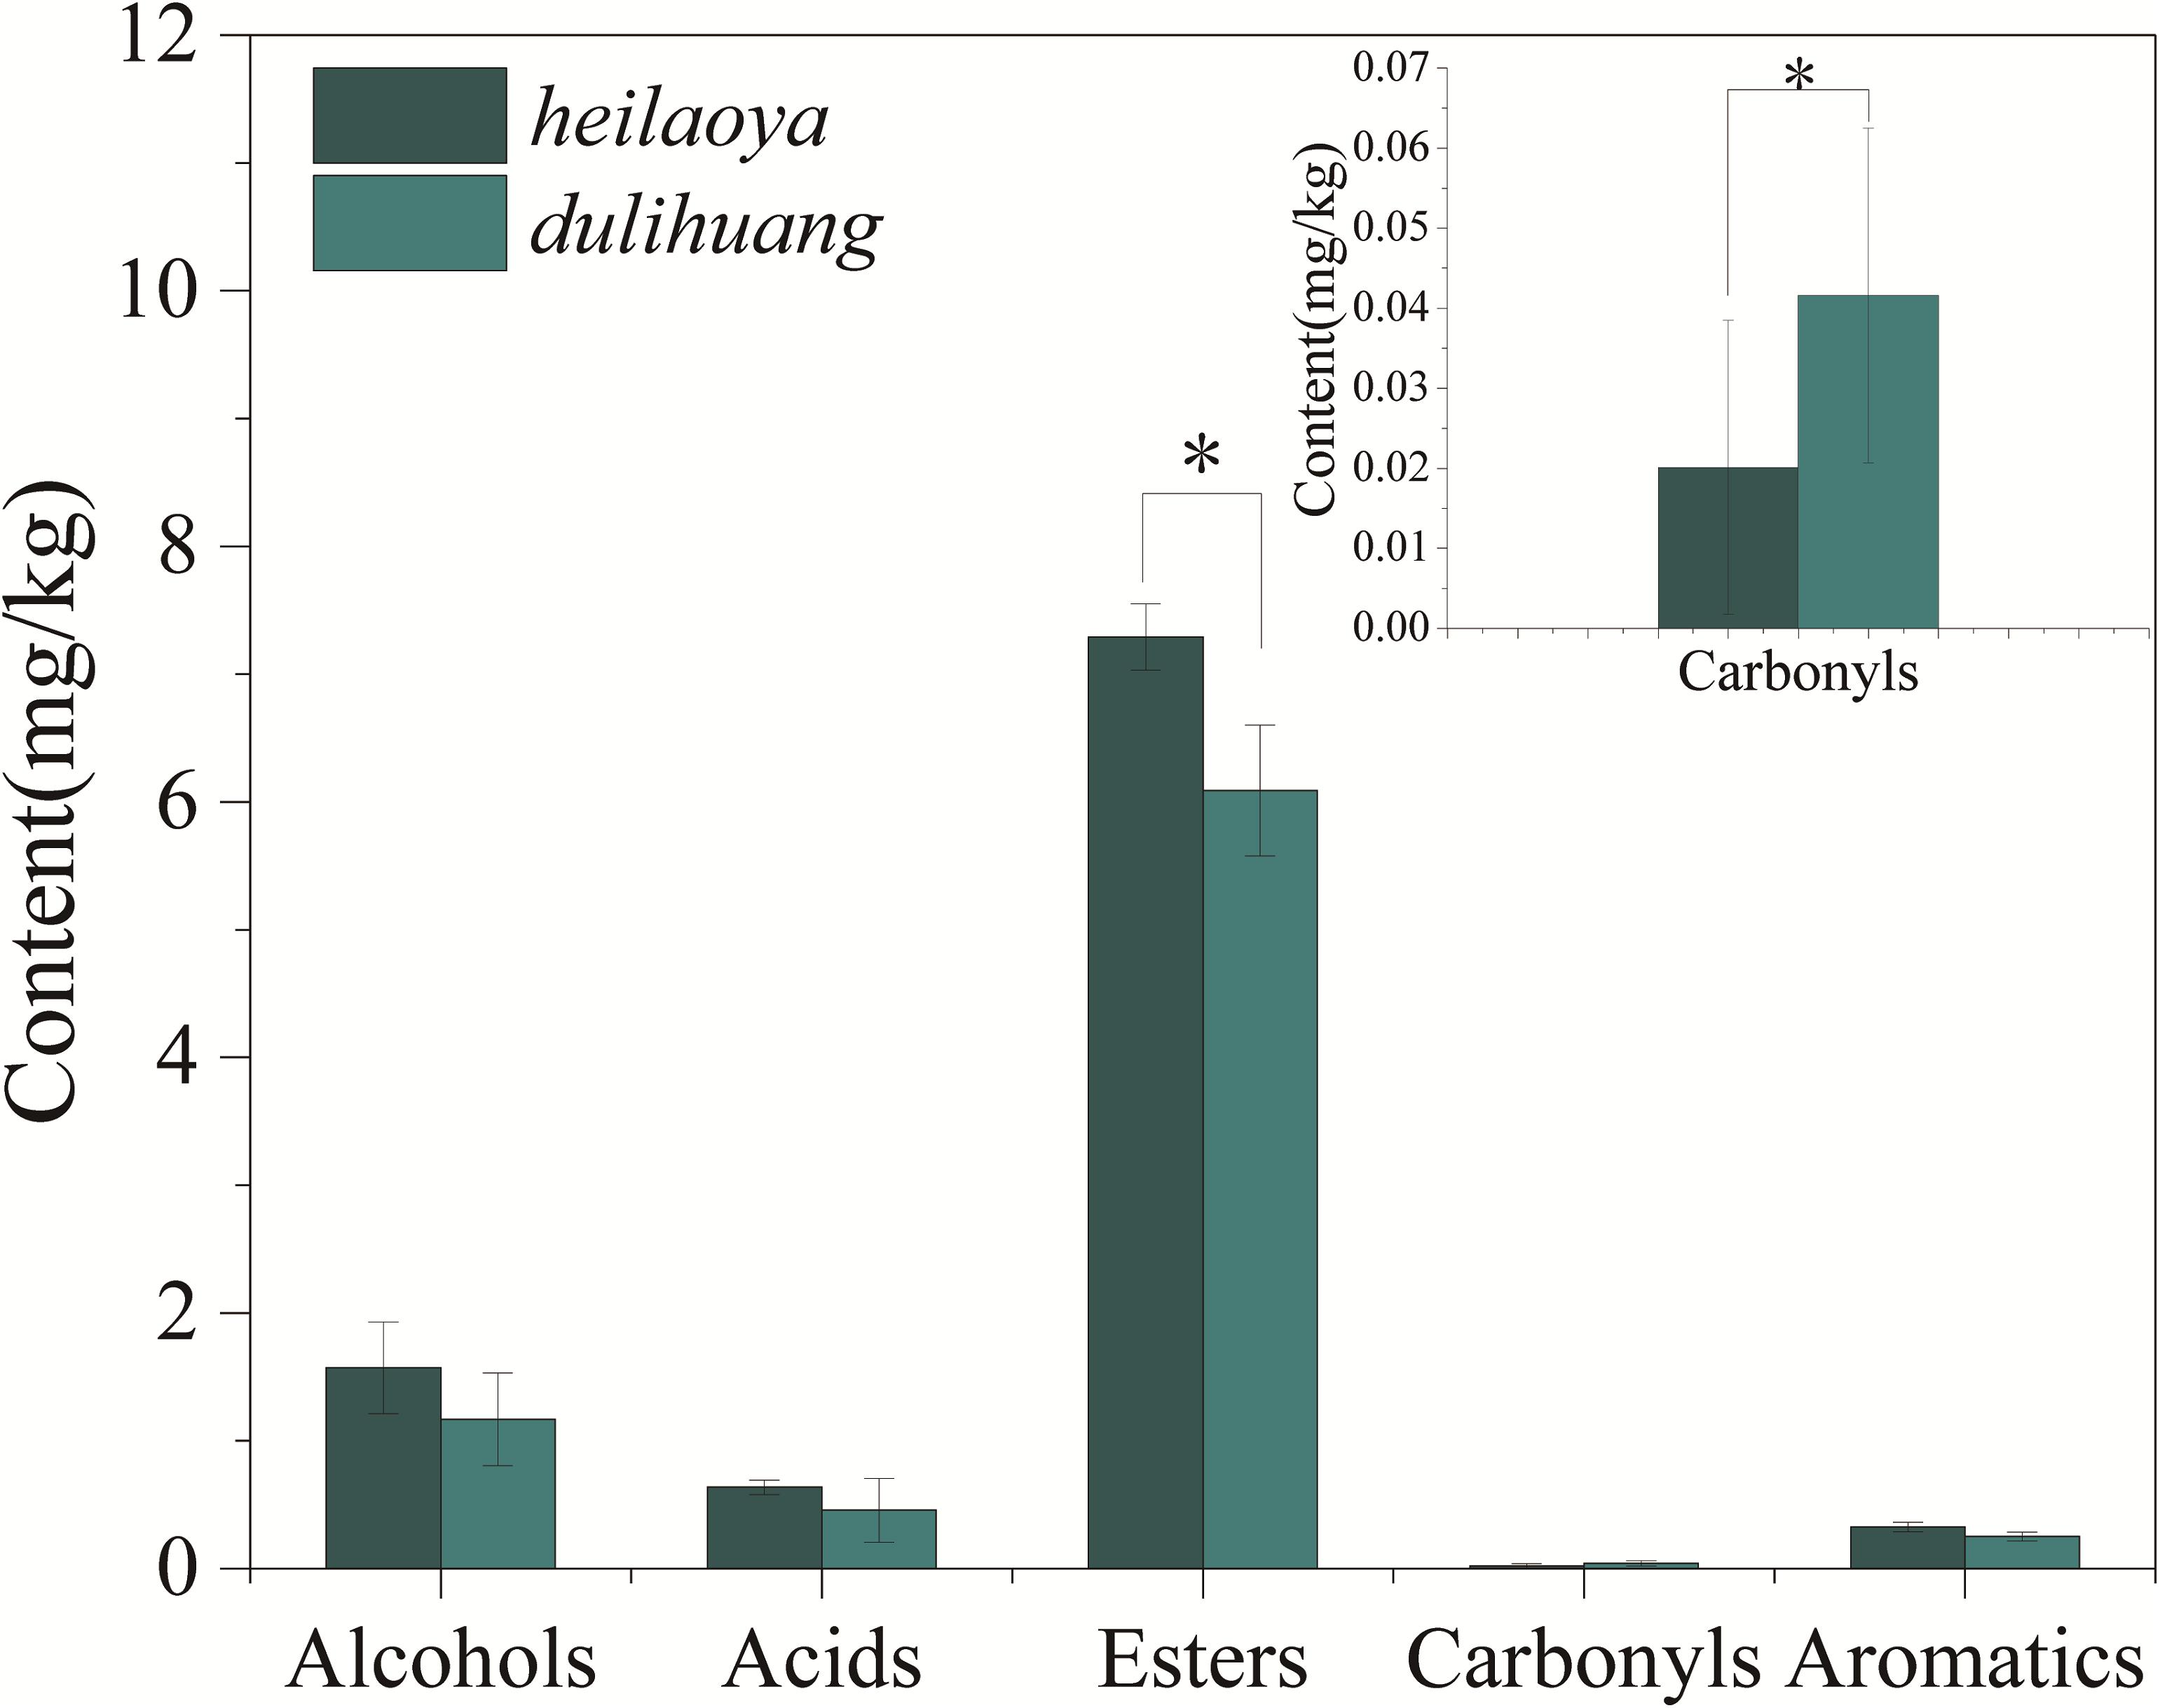
Figure 7. Content of different flavors at the end of fermentation. Significant differences P< 0.05 (Students t-test) is denoted by ∗.
Discussion
Raw material played an important role in providing various nutrients, precursors of flavor and epiphytic microbes to the food fermentation process (Gobbetti et al., 2014; Guan et al., 2018). This work showed an indirect contribution of raw material on food fermentation, in which the sugar profiles in hulless barley influenced flavor-producing microbiota and regulated flavors formation in Chinese liquor fermentation process.
In various fermented foods, microbiota were highly correlated with flavor production (Mota-Gutierrez et al., 2018; Wuyts et al., 2018). Six genera including Lactobacillus, Saccharomyces, Komagataella, Aspergillus, Pichia, and Weissella were identified as flavor-producing microbiota in hulless barley fermentation process in this work. Previous studies showed that, Lactobacillus led to producing 1-octen-3-ol, benzaldehyde, pentanal, octanal, nonanal, and 2-pentyl-furan in pork jerky fermentation (Zhao et al., 2016) and produced lactic acid and acetic acid in vegetable fermentation (Oguntoyinbo and Dodd, 2010) and yogurt (Pan et al., 2014). Saccharomyces produced large amounts of higher alcohols and acetate esters in food fermentation (Stribny et al., 2015). Pichia produced a total of 16 flavors, including 3-methylbutanal, 2-phenylethyl alcohol, phenylethyl acetate, 2,3-butadione in bread (Mo and Sung, 2014). These studies supported the contributions of Lactobacillus, Saccharomyces, and Pichia on flavors production in this work (Supplementary Table S1). And they were also reported as the core microbiota in other Chinese light aroma type liquor (Wang et al., 2019). Aspergillus was widely reported to produce many saccharifying enzymes to degrade the starch in raw material for food fermentation (Chen et al., 2014; Pervez et al., 2015). It would also interact with other microbes, such as Lactobacillus and Saccharomyces, hence regulate their flavor compounds producing (Ivey et al., 2013; Li et al., 2014). Very few studies showed the contribution of Komagataella and Weissella on flavors during food fermentation. Our work found Komagataella were positively correlated with 3-methyl-1-butanol, 1-butanol, pentanoic acid-ethyl ester, hexanoic acid-ethyl ester, and butanoic acid-3-methyl-ethyl ester. Weissella were positively correlated with pentanoic acid and 2-methoxy-5-methylphenol. These results suggested potential and important flavor-producing microbiota in Chinese liquor. Further studies are required to learn the contribution of these flavor-producing microbiota on flavors via monoculture and co-culture experiments with same raw material.
The composition and abundance of flavor-producing microbiota determine the flavor formation in liquor fermentation. In addition, some endogenous factors might strongly influence the composition and abundance of flavor-producing microbiota, such as moisture, temperature and pH (Tao et al., 2014; Wolfe et al., 2014; De Filippis et al., 2016). It is important to identify the main driving force to regulate microbiota during fermentation. In this study, we showed that reducing sugar was a key factor to influence microbial composition in Chinese liquor fermentation. Interestingly, a noteworthy increase of reducing sugar contents was observed at an early stage during fermentation process (Supplementary Figure S2A), which highlighted the intense hydrolyzing activity of microbial community, and the rate of hydrolysis of substrates to reducing sugar is faster than the utilization of reducing sugar (Sulaiman et al., 2014). An increase in reducing sugar was shown to be correlated with the increasing temperature and moisture, which could be taken as persuasive evidence of microbial growth and metabolism (Hubbe et al., 2010). This work highlighted that reducing sugar, as an important driver, affected the relative abundance of flavor-producing microbiota.
Notably, the sugar profiles could drive the growth and composition of microbiota during fermentation (Chatellard et al., 2016; Li et al., 2017; Lu et al., 2017). For bacterial community during doubanjiang-meju fermentation, Pseudomonas preferred glucose and arabinose while Streptococcus preferred arabinose, ribose and fructose, which resulted in bacterial succession and dynamic changes in organic acids and amino acids (Li et al., 2017). In addition, xylose, arabinose, glucose and cellobiose showed a strong selection for Clostridiaceae, Bacillaceae and Peanibacillaceae families in dark fermentation (Chatellard et al., 2016). In fructose-rich niches, the optimum substrate for the growth of fructophilic LAB was fructose, and its growth on glucose was very poor (Endo et al., 2009). Interestingly, in our study, we found that Komagataella phaffii QK2 grew better in heilaoya with more fructose, whereas Pichia fermentans PF grew better in dulihuang with more glucose. And the effects of hulless barley on glucose and fructose mainly included two points. On the one hand, hulless barley contained rich fructose and glucose (Figure 4C). On the other hand, the difference of nutrients would influence metabolism and enzyme activity of microorganisms (Singh et al., 2015; Zhu et al., 2017), especially glycosidase and polysaccharide hydrolase, which would influence synthesis and consumption of glucose and fructose. Knowing the selection of a particular sugar for microbiota would be beneficial for designing more efficient flavor-producing biological systems. Further studies should focus on the mechanism of the effect of these sugars on shaping the flavor-producing microbiota in Chinese liquor.
This work demonstrated that fructose and glucose of hulless barley affected the relative abundance of flavor-producing microbiota, hence influenced the flavor formation in Chinese liquor fermentation. It shed new light on the effect of raw material on food fermentation, and would contribute to improve the flavor of fermented foods by regulating the cultivar and composition of raw materials.
Data Availability
The datasets generated for this study are available in the DNA Data Bank of Japan, DRA007445 and DRA007455.
Author Contributions
CL, QW, and YX designed the study. CL, SF, QW, HH, ZC, SL, and YX performed the experiments and analyzed the data. CL wrote the manuscript.
Funding
We gratefully acknowledge the National Key R&D Program of China (2018YFD0400402 and 2016YFD0400500), the National Natural Science Foundation of China (31530055), the Jiangsu Province Science and Technology Project (BE2017705), the China Postdoctoral Science Foundation (2017M611702), and the National First-Class Discipline Program of Light Industry Technology and Engineering (LITE2018-12), the Priority Academic Program Development of Jiangsu Higher Education Institutions, the 111 Project (No. 111-2-06), and the Collaborative Innovation Center of Jiangsu Modern Industrial Fermentation.
Conflict of Interest Statement
SF, HH, ZC, and SL were employed by the Qinghai Huzhu Barley Wine Co., Ltd.
The remaining authors declare thatthe research was conducted in the absence of any commercial or financial relationships that could be construed as a potential conflict of interest.
Supplementary Material
The Supplementary Material for this article can be found online at: https://www.frontiersin.org/articles/10.3389/fmicb.2019.01520/full#supplementary-material
References
Caporaso, J. G., Kuczynski, J., Stombaugh, J., Bittinger, K., Bushman, F. D., Costello, E. K., et al. (2010). QIIME allows analysis of high-throughput community sequencing data. Nat. Methods 7, 335–336.
Chatellard, L., Trably, E., and Carrere, H. (2016). The type of carbohydrates specifically selects microbial community structures and fermentation patterns. Bioresour. Technol. 221, 541–549. doi: 10.1016/j.biortech.2016.09.084
Chen, B., Wu, Q., and Xu, Y. (2014). Filamentous fungal diversity and community structure associated with the solid state fermentation of Chinese Maotai-flavor liquor. Int. J. Food Microbiol. 179, 80–84. doi: 10.1016/j.ijfoodmicro.2014.03.011
De Filippis, F., Genovese, A., Ferranti, P., Gilbert, J. A., and Ercolini, D. (2016). Metatranscriptomics reveals temperature-driven functional changes in microbiome impacting cheese maturation rate. Sci. Rep. UK 6:21871. doi: 10.1038/srep21871
De Pasquale, I., Di Cagno, R., Buchin, S., De Angelis, M., and Gobbetti, M. (2014). Microbial ecology dynamics reveal a succession in the core microbiota involved in the ripening of pasta filata caciocavallo pugliese cheese. Appl. Environ. Microbiol. 80, 6243–6255. doi: 10.1128/AEM.02097-14
DeSantis, T. Z., Hugenholtz, P., Larsen, N., Rojas, M., Brodie, E. L., Keller, K., et al. (2006). Greengenes, a chimera-checked 16S rRNA gene database and workbench compatible with ARB. Appl. Environ. Microbiol. 72, 5069–5072. doi: 10.1128/aem.03006-05
Edgar, R. C. (2010). Search and clustering orders of magnitude faster than BLAST. Bioinformatics 26, 2460–2461. doi: 10.1093/bioinformatics/btq461
Edgar, R. C., Haas, B. J., Clemente, J. C., Quince, C., and Knight, R. (2011). UCHIME improves sensitivity and speed of chimera detection. Bioinformatics 27, 2194–2200. doi: 10.1093/bioinformatics/btr381
Endo, A., Futagawa-Endo, Y., and Dicks, L. M. T. (2009). Isolation and characterization of fructophilic lactic acid bacteria from fructose-rich niches. Systemat. Appl. Microbiol. 32, 593–600. doi: 10.1016/j.syapm.2009.08.002
Gao, W., Fan, W., and Xu, Y. (2014). Characterization of the key odorants in light aroma type chinese liquor by gas chromatography-olfactometry, quantitative measurements, aroma recombination, and omission studies. J. Agric. Food Chem. 62, 5796–5804. doi: 10.1021/jf501214c
Giraffa, G. (2004). Studying the dynamics of microbial populations during food fermentation. FEMS Microbiol. Rev. 28, 251–260. doi: 10.1016/j.femsre.2003.10.005
Gobbetti, M., Rizzello, C. G., Di Cagno, R., and De Angelis, M. (2014). How the sourdough may affect the functional features of leavened baked goods. Food Microbiol. 37, 30–40. doi: 10.1016/j.fm.2013.04.012
Guan, H., Yan, Y., Li, X., Li, X., Shuai, Y., Feng, G., et al. (2018). Microbial communities and natural fermentation of corn silages prepared with farm bunker-silo in Southwest China. Bioresour. Technol. 265, 282–290. doi: 10.1016/j.biortech.2018.06.018
Hubbe, M. A., Nazhad, M., and Sanchez, C. (2010). Composting as a way to convert cellulosic biomass and organic waste into high-value soil amendments: a review. Bioresources 5, 2808–2854.
Ihrmark, K., Bodeker, I. T., Cruz-Martinez, K., Friberg, H., Kubartova, A., Schenck, J., et al. (2012). New primers to amplify the fungal ITS2 region–evaluation by 454-sequencing of artificial and natural communities. FEMS Microbiol. Ecol. 82, 666–677. doi: 10.1111/j.1574-6941.2012.01437.x
Ivey, M., Massel, M., and Phister, T. G. (2013). Microbial interactions in food fermentations. Annu. Rev. Food Sci. Technol. 4, 141–162. doi: 10.1146/annurev-food-022811-101219
Kai, Z., Pengju, X. U. E., and Guangye, G. U. (2008). Study on determination of reducing sugar content using 3,5-dinitrosalicylic acid method. Food Sci. 29, 534–536.
Kajala, I., Makela, J., Coda, R., Shukla, S., Shi, Q., Maina, N. H., et al. (2016). Rye bran as fermentation matrix boosts in situ dextran production by Weissella confusa compared to wheat bran. Appl. Microbiol. Bio. 100, 3499–3510. doi: 10.1007/s00253-015-7189-6
Koljalg, U., Larsson, K. H., Abarenkov, K., Nilsson, R. H., Alexander, I. J., Eberhardt, U., et al. (2005). UNITE: a database providing web-based methods for the molecular identification of ectomycorrhizal fungi. New Phytol. 166, 1063–1068. doi: 10.1111/j.1469-8137.2005.01376.x
Kumar, R., Dhanarajan, G., Bhaumik, M., Chopra, J., and Sen, R. (2017). Performance evaluation of a yeast biorefinery as a sustainable model for co-production of biomass, bioemulsifier, lipid, biodiesel and animal-feed components using inexpensive raw materials. Sustain. Energ. Fuels 1, 923–931. doi: 10.1039/c7se00010c
Lee, M., Song, J. H., Jung, M. Y., Lee, S. H., and Chang, J. Y. (2017). Large-scale targeted metagenomics analysis of bacterial ecological changes in 88 kimchi samples during fermentation. Food Microbiol. 66, 173–183. doi: 10.1016/j.fm.2017.05.002
Li, P., Li, S., Cheng, L., and Luo, L. (2014). Analyzing the relation between the microbial diversity of DaQu and the turbidity spoilage of traditional Chinese vinegar. Appl. Microbiol. Bio. 98, 6073–6084. doi: 10.1007/s00253-014-5697-4
Li, Z., Rui, J., Li, X., Li, J., Dong, L., Huang, Q., et al. (2017). Bacterial community succession and metabolite changes during doubanjiang-meju fermentation, a Chinese traditional fermented broad bean (Vicia faba L.) paste. Food Chem. 218, 534–542. doi: 10.1016/j.foodchem.2016.09.104
Lu, Y. C., Gong, Y. L., Li, Y. J., Pan, Z. J., Yao, Y., Li, N., et al. (2017). Characterization of microbial communities in Chinese rice wine collected at Yichang city and Suzhou city in China. J. Microbiol. Biotechnol. 27, 1409–1418. doi: 10.4014/jmb.1704.04029
Mellado-Mojica, E., and Lopez, M. G. (2012). Fructan metabolism in A. tequilana Weber Blue variety along its developmental cycle in the field. J. Agric. Food Chem. 60, 11704–11713. doi: 10.1021/jf303332n
Mo, E. K., and Sung, C. K. (2014). Production of white pan bread leavened by Pichia anomala SKM-T. Food Sci. Biotechnol. 23, 431–437. doi: 10.1007/s10068-014-0059-7
Mota-Gutierrez, J., Botta, C., Ferrocino, I., Giordano, M., Bertolino, M., Dolci, P., et al. (2018). Dynamics and biodiversity of bacterial and yeast communities during fermentation of cocoa beans. Appl. Environ. Microbiol. 84, e01164-18. doi: 10.1128/AEM.01164-18
Oguntoyinbo, F. A., and Dodd, C. E. R. (2010). Bacterial dynamics during the spontaneous fermentation of cassava dough in gari production. Food Control 21, 306–312. doi: 10.1016/j.foodcont.2009.06.010
Olanbiwoninu, A. A., and Odunfa, S. A. (2018). Microbial interaction in selected fermented vegetable condiments in Nigeria. Int. Food Res. J. 25, 439–445.
Pan, D. D., Wu, Z., Peng, T., Zeng, X. Q., and Li, H. (2014). Volatile organic compounds profile during milk fermentation by Lactobacillus pentosus and correlations between volatiles flavor and carbohydrate metabolism. J. Dairy Sci. 97, 624–631. doi: 10.3168/jds.2013-7131
Pervez, S., Siddiqui, N. N., Ansari, A., Aman, A., and Qader, S. A. U. (2015). Phenotypic and molecular characterization of Aspergillus species for the production of starch-saccharifying amyloglucosidase. Ann. Microbiol. 65, 2287–2291. doi: 10.1007/s13213-015-1070-9
Ponomarova, O., Gabrielli, N., Sevin, D. C., Mulleder, M., Zimgibl, K., Bulyha, K., et al. (2017). Yeast creates a niche for symbiotic lactic acid bacteria through nitrogen overflow. Cell Syst. 5, 345–357. doi: 10.1016/j.cels.2017.09.002
Ren, G., Ren, W., Teng, Y., and Li, Z. (2015). Evident bacterial community changes but only slight degradation when polluted with pyrene in a red soil. Front. Microbiol. 6:22. doi: 10.3389/fmicb.2015.00022
Rhee, S. J., Lee, J.-E., and Lee, C.-H. (2011). Importance of lactic acid bacteria in Asian fermented foods. Microb. Cell Fact. 10:S5. doi: 10.1186/1475-2859-10-S1-S5
Riethmüller, A., Voglmayr, H., Göker, M., Weiß, M., and Oberwinkler, F. (2002). Phylogenetic relationships of the downy mildews (Peronosporales) and related groups based on nuclear large subunit ribosomal DNA sequences. Mycologia 94, 834–849. doi: 10.1080/15572536.2003.11833177
Rochelle, P. A., Fry, J. C., Parkes, R. J., and Weightman, A. J. (1992). DNA extraction for 16S rRNA gene analysis to determine genetic diversity in deep sediment communities. FEMS Microbiol. Lett. 100, 59–65. doi: 10.1016/0378-1097(92)90188-t
Shannon, P., Markiel, A., Ozier, O., Baliga, N. S., Wang, J. T., Ramage, D., et al. (2003). Cytoscape: a software environment for integrated models of biomolecular interaction networks. Genome Res. 13, 2498–2504. doi: 10.1101/gr.1239303
Singh, N., Kumari, A., Gakhar, S. K., and Singh, B. (2015). Enhanced cost-effective phytase production by Aspergillus niger and its applicability in dephytinization of food ingredients. Microbiology 84, 219–226. doi: 10.1134/s0026261715020149
Soergel, D. A., Dey, N., Knight, R., and Brenner, S. E. (2012). Selection of primers for optimal taxonomic classification of environmental 16S rRNA gene sequences. ISME J. 6, 1440–1444. doi: 10.1038/ismej.2011.208
Song, Z., Du, H., Zhang, Y., and Xu, Y. (2017). Unraveling core functional microbiota in traditional solid-state fermentation by high-throughput amplicons and metatranscriptomics sequencing. Front. Microbiol. 8:1294. doi: 10.3389/fmicb.2017.01294
Stribny, J., Gamero, A., Perez-Torrado, R., and Querol, A. (2015). Saccharomyces kudriavzevii and Saccharomyces uvarum differ from Saccharomyces cerevisiae during the production of aroma-active higher alcohols and acetate esters using their amino acidic precursors. Int. J. Food Microbiol. 205, 41–46. doi: 10.1016/j.ijfoodmicro.2015.04.003
Sulaiman, J., Gan, H. M., Yin, W. F., and Chan, K. G. (2014). Microbial succession and the functional potential during the fermentation of Chinese soy sauce brine. Front. Microbiol. 5:556. doi: 10.3389/fmicb.2014.00556
Sun, X., Wang, H., Han, X., Chen, S., Zhu, S., and Dai, J. (2014). Fingerprint analysis of polysaccharides from different Ganoderma by HPLC combined with chemometrics methods. Carbohydr. Polym. 114, 432–439. doi: 10.1016/j.carbpol.2014.08.048
Tang, K., Ma, L., Han, Y.-H., Nie, Y., Li, J.-M., and Xu, Y. (2015). Comparison and chemometric analysis of the phenolic compounds and organic acids composition of Chinese wines. J. Food Sci. 80, C20–C28. doi: 10.1111/1750-3841.12691
Tao, Y., Li, J. B., Rui, J. P., Xu, Z. C., Zhou, Y., Hu, X. H., et al. (2014). Prokaryotic communities in pit mud from different-aged cellars used for the production of Chinese strong-flavored liquor. Appl. Environ. Microbiol. 80, 2254–2260. doi: 10.1128/AEM.04070-13
Walsh, A. M., Crispie, F., Kilcawley, K., O’sullivan, O., O’sullivan, M. G., Claesson, M. J., et al. (2016). Microbial succession and flavor production in the fermented dairy beverage Kefir. Msystems 1:e00052-16.
Wang, P., Wu, Q., Jiang, X., Wang, Z., Tang, J., and Xu, Y. (2017). Bacillus licheniformis affects the microbial community and metabolic profile in the spontaneous fermentation of Daqu starter for Chinese liquor making. Int. J. Food Microbiol. 250, 59–67. doi: 10.1016/j.ijfoodmicro.2017.03.010
Wang, P., Wu, Q., and Xu, Y. (2018). Core microbiota in Chinese liquor fermentation and associations with environmental factors. Acta Microbiol. Sin. 58, 142–153.
Wang, S., Wu, Q., Nie, Y., Wu, J., and Xu, Y. (2019). Construction of synthetic microbiota for reproducible flavor compound metabolism in Chinese light-aroma-type liquor produced by solid-state fermentation. Appl. Environ. Microbiol. 85:e03090-18
Wang, X., Du, H., Zhang, Y., and Xu, Y. (2018). Environmental microbiota drives microbial succession and metabolic profiles during Chinese liquor fermentation. Appl. Environ. Microbiol. 84:e02369-17. doi: 10.1128/AEM.02369-17
Wang, Z. M., Lu, Z. M., Shi, J. S., and Xu, Z. H. (2016). Exploring flavour-producing core microbiota in multispecies solid-state fermentation of traditional Chinese vinegar. Sci. Rep. 6:26818. doi: 10.1038/srep26818
Wolfe, B. E., Button, J. E., Santarelli, M., and Dutton, R. J. (2014). Cheese rind communities provide tractable systems for in situ and in vitro studies of microbial diversity. Cell 158, 422–433. doi: 10.1016/j.cell.2014.05.041
Wolfe, B. E., and Dutton, R. J. (2015). Fermented foods as experimentally tractable microbial ecosystems. Cell 161, 49–55. doi: 10.1016/j.cell.2015.02.034
Wu, Q., Chen, L., and Xu, Y. (2013). Yeast community associated with the solid state fermentation of traditional Chinese Maotai-flavor liquor. Int. J. Food Microbiol. 166, 323–330. doi: 10.1016/j.ijfoodmicro.2013.07.003
Wuyts, S., Van Beeck, W., Oerlemans, E. F. M., Wittouck, S., Claes, I. J. J., De Boeck, I., et al. (2018). Carrot juice fermentations as man-made microbial ecosystems dominated by lactic acid bacteria. Appl. Environ. Microbiol. 84:e00134-18. doi: 10.1128/AEM.00134-18
Xiao, C., Lu, Z. M., Zhang, X. J., Wang, S. T., Ao, L., Shen, C. H., et al. (2017). Bio-heat Is a key environmental driver shaping the microbial community of medium-temperature Daqu. Appl. Environ. Microbiol. 83:e01550-17. doi: 10.1128/AEM.01550-17
Yuan, G. S., Ren, J., Ouyang, X. Y., Wang, L. Y., Wang, M. Z., Shen, X. D., et al. (2016). Effect of raw material, pressing and glycosidase on the volatile compound composition of wine made from Goji Berries. Molecules 21:27.
Zeng, X., Long, H., Wang, Z., Zhao, S., Tang, Y., Huang, Z., et al. (2015). The draft genome of Tibetan hulless barley reveals adaptive patterns to the high stressful Tibetan Plateau. Proc. Natl. Acad. Sci. U.S.A. 112, 1095–1100. doi: 10.1073/pnas.1423628112
Zhao, C. Q., Zhao, X. X., Lu, Z. Y., Huang, J., He, S., Tan, H., et al. (2016). Production of fermented pork jerky using Lactobacillus bulgaricus. Lwt-Food Sci. Technol. 72, 377–382. doi: 10.1016/j.lwt.2016.04.060
Zhao, H. M., Guo, X. N., and Zhu, K. X. (2017). Impact of solid state fermentation on nutritional, physical and flavor properties of wheat bran. Food Chem. 217, 28–36. doi: 10.1016/j.foodchem.2016.08.062
Zheng, Y., Mou, J., Niu, J., Yang, S., Chen, L., Xia, M., et al. (2018). Succession sequence of lactic acid bacteria driven by environmental factors and substrates throughout the brewing process of Shanxi aged vinegar. Appl. Microbiol. Biot. 102, 2645–2658. doi: 10.1007/s00253-017-8733-3
Keywords: Chinese liquor, flavor producers, fructose, glucose, hulless barley
Citation: Liu C, Feng S, Wu Q, Huang H, Chen Z, Li S and Xu Y (2019) Raw Material Regulates Flavor Formation via Driving Microbiota in Chinese Liquor Fermentation. Front. Microbiol. 10:1520. doi: 10.3389/fmicb.2019.01520
Received: 09 March 2019; Accepted: 18 June 2019;
Published: 04 July 2019.
Edited by:
Lin Lin, Jiangsu University, ChinaReviewed by:
Whasley Duarte, Universidade Federal de Lavras, BrazilYefu Chen, Tianjin University of Science and Technology, China
Copyright © 2019 Liu, Feng, Wu, Huang, Chen, Li and Xu. This is an open-access article distributed under the terms of the Creative Commons Attribution License (CC BY). The use, distribution or reproduction in other forums is permitted, provided the original author(s) and the copyright owner(s) are credited and that the original publication in this journal is cited, in accordance with accepted academic practice. No use, distribution or reproduction is permitted which does not comply with these terms.
*Correspondence: Qun Wu, wuq@jiangnan.edu.cn; Yan Xu, yxu@jiangnan.edu.cn