 Ashley Smith1,2
 Agnieszka Kaczmar1,2
 Rosemary A. Bamford1,2
 Christopher Smith2Simona Frustaci1
 Andrea Kovacs-Simon2
 Paul O’Neill2
 Karen Moore2Konrad Paszkiewicz2
 Richard W. Titball2
 Stefano Pagliara1,2*
- 1Living Systems Institute, University of Exeter, Exeter, United Kingdom
- 2Biosciences, University of Exeter, Exeter, United Kingdom
Microorganisms shape the composition of the medium they are growing in, which in turn has profound consequences on the reprogramming of the population gene-expression profile. In this paper, we investigate the progressive changes in pH and sugar availability in the medium of a growing Escherichia coli (E. coli) culture. We show how these changes have an effect on both the cellular heterogeneity within the microbial community and the gene-expression profile of the microbial population. We measure the changes in gene-expression as E. coli moves from lag, to exponential, and finally into stationary phase. We found that pathways linked to the changes in the medium composition such as ribosomal, tricarboxylic acid cycle (TCA), transport, and metabolism pathways are strongly regulated during the different growth phases. In order to quantify the corresponding temporal changes in the population heterogeneity, we measure the fraction of E. coli persisters surviving different antibiotic treatments during the various phases of growth. We show that the composition of the medium in which β-lactams or quinolones, but not aminoglycosides, are dissolved strongly affects the measured phenotypic heterogeneity within the culture. Our findings contribute to a better understanding on how the composition of the culture medium influences both the reprogramming in the population gene-expression and the emergence of phenotypic variants.
Introduction
Within isogenic populations there may be substantial cell-to-cell heterogeneity in terms of metabolic activity (Nikolic et al., 2013; Şimşek and Kim, 2018), growth rate (Kotte et al., 2014), substrate assimilation (Sheik et al., 2016), compound secretion (Veening et al., 2008), virulence (Arnoldini et al., 2014), and resistance to stress (Balaban et al., 2004). This heterogeneity has been observed across all the domains of life and arises from the inherent random nature of biochemical reactions (Elowitz et al., 2002; Kaern et al., 2005; Lidstrom and Konopka, 2010). Phenotypic heterogeneity may allow some individual cells to survive shifts in the environmental conditions, and thus permitting the population to withstand fluctuating environments (Balaban et al., 2004; Ackermann, 2015; Venturelli et al., 2015; Schreiber et al., 2016; Bódi et al., 2017). It has also been suggested that phenotypic heterogeneity can accelerate evolutionary adaptation to different environmental challenges (Beaumont et al., 2009; New et al., 2014). The culture environment in turn affects the population transcriptome. For instance, pH has been shown to regulate genes involved in catabolism and transport (Hayes et al., 2006), whereas glucose-lactose diauxie induces the downregulation of amino acid biosynthesis and aerobic metabolism genes (Chang et al., 2002). Additionally, changes in gene-expression levels in response to nutritional changes are strongly linked to growth rate and cell size (Weart et al., 2007; Scott et al., 2010; Chien et al., 2012; Yao et al., 2012). Moreover, it has been suggested that a reduction in cell size increases the heterogeneity in gene-expression within the population (Kaern et al., 2005).
However, only a small subpopulation of bacteria shows observable physiological variations, such as growth rate that is more than twofold different than the remainder of the population (Lidstrom and Konopka, 2010). Therefore, the identification and study of such small subpopulations can be challenging but can be simplified by analyzing the functional consequences of a given case of phenotypic heterogeneity (Ackermann, 2015).
For example, persister cells are a small proportion of a clonal microbial population that can survive otherwise lethal doses of antibiotics and resume growth shortly after removing the antibiotic (Hansen et al., 2008; Lewis, 2010; Maisonneuve et al., 2013), but without acquiring genetic changes that confer antibiotic resistance. In this paper we used persister cell formation as a proxy for phenotypic heterogeneity. Persister cells have been observed across all the domains of life (Lewis, 2010; Hangauer et al., 2017; Megaw and Gilmore, 2017) and are believed to contribute to the survival of bacteria in biofilms exposed to antibiotics (LaFleur et al., 2006; Lewis, 2010) and to chronic infections in immunosuppressed hosts (Mulcahy et al., 2010; Maisonneuve and Gerdes, 2014).
Persisters can form stochastically as a result of fluctuations in gene-expression (Amato et al., 2013). However, a variety of environmental factors favor persister formation, including subinhibitory concentrations of antibiotics (Amato et al., 2013), nutrient limitation (Vega et al., 2012), intra-species interactions (Bernier et al., 2013), starvation (Fung et al., 2010), and in the case of pathogens, interactions with the host (Helaine et al., 2014). Amato et al. (2013) showed that diauxic growth contributes to persister cell formation, whereas another study by the same group showed that nutrient transitions contributed to persister formation within bacterial biofilms (Amato and Brynildsen, 2014). Keren et al. reported that the number of ampicillin or ofloxacin persisters increased from lag to stationary phase (Keren et al., 2004a). However, the temporal windows when there are substantial increases in the formation of persisters to different antibiotics during growth of Escherichia coli (E. coli) on lysogeny broth (LB) have yet to be defined. Moreover, gene-expression profiling has been carried out on both exponential and stationary phase E. coli O157 growing on 3-(N-morpholino)propanesulfonic acid (MOPS) minimal medium supplemented with 0.1% glucose (Bergholz et al., 2007). However, the changes in the transcriptome throughout the growth cycle of E. coli K12 growing in LB remain to be determined, despite this being an experimental model system employed in microbiology, biotechnology, and molecular biology.
In this paper, we report the changes in sugar levels and pH and the associated reprogramming in gene-expression during the transitions between the different phases of E. coli growth. We then investigate the phenotypic heterogeneity within the E. coli population throughout the growth cycle by using persister formation, in response to ampicillin, gentamicin, or ofloxacin as a proxy for studying cellular heterogeneity. Our findings will be instrumental for investigations into the mechanisms underlying microbial survival in transitioning environments and provide key transcriptomic data for a commonly used model in many bacterial studies.
Materials and Methods
Chemicals and Culture Preparation
All chemicals were purchased from Fisher Scientific or Sigma-Aldrich unless otherwise stated. LB medium (10 g/L tryptone, 5 g/L yeast extract, and 10 g/L NaCl, Melford) and LB agar plates (LB with 15 g/L agar) were used for planktonic growth and enumeration of colony-forming units (CFUs), respectively. E. coli BW25113 was purchased from Dharmacon (GE Healthcare). A single colony of E. coli BW25113 was grown in 200 ml fresh LB in a shaking incubator at 200 rpm and 37°C for 17 h (Supplementary Figure S1A). After 17 h incubation, the culture was diluted 1:1000 in fresh LB and growth was measured hourly by taking three aliquots that were then centrifuged (13,000 g for 5 min), the supernatant was removed, the pellet was resuspended in phosphate-buffered saline (PBS), and serial dilutions were plated on LB agar for CFU counts (Supplementary Figures S1B,C,H). This experiment allowed us to determine that the culture was in stationary phase at t = 17 h (left axis in Supplementary Figure S2). In order to avoid introducing any bias in our measurements (Luidalepp et al., 2011), we used the same LB autoclaving conditions in all our assays. The relatively small error bars in our measurements and in other recent reports (Orman and Brynildsen, 2016; Radzikowski et al., 2016) demonstrate the suitability of autoclaved LB for these microbiological assays.
Characterizing the Bacterial Environment
A culture was prepared as described above and eighty-one 100 μl aliquots were added to individual wells of a 96-well plate (three technical replicates in biological triplicates for each of the nine time points were investigated). The remaining wells were filled with fresh LB for blank measurements. The plate was placed in a preheated (37°C) Infinite® 200 PRO plate reader (TECAN) shaking at 200 rpm. To quantify bacterial growth in this assay, optical density at 595 nm (OD595) was measured hourly in nine selected wells for each time point. Bacterial growth measured via the plate reader method (right axis in Supplementary Figure S2) was comparable to that measured via CFU counts in cultures growing in 200 ml flasks (left axis in Supplementary Figure S2). To quantify the amount of reducing sugars, preheated (100°C) Benedict’s reagent (Sigma-Aldrich) was then added to the same wells according to the manufacturer’s instructions and absorbance at 490 nm was measured after 15 min incubation. The absolute sugar concentration was determined by extrapolation through a standard curve of known glucose concentration (Supplementary Figure S3). This was obtained by adding glucose in MilliQ water at concentrations of 125, 250, 500, or 1000 μM in triplicate in a 96-well plate. Preheated (100°C) Benedict’s reagent was then added to the same wells and the absorbance at 490 nm was measured after a 15 min incubation. The average reading from three wells containing only MilliQ water was subtracted from the readings of the glucose containing wells. These blank subtracted readings are reported in Supplementary Figure S3 together with a linear regression fitting of the experimental data. In order to measure the culture pH, the probe of a PH-100 ATC pH meter (with an accuracy of pH 0.01, Voltcraft) was immersed in a separate culture prepared as described above and the pH was recorded hourly. The measurements were taken in at least three biological replicates.
Transcriptomic and qPCR Analysis
A culture was prepared as described above. Immediately after dilution (0 h), 500 μl aliquots were taken from the overnight (17 h) culture and 1, 2, 3, 3.5, 4, 4.5, 5, 6, or 7 h after dilution in fresh LB (1:1000) and were incubated at 200 rpm and 37°C as described above. The RNA of the cells contained in each aliquot was stabilized using RNAprotect Bacteria Reagent (Qiagen). Extraction was performed with RNeasy Mini Kit (Qiagen) and DNA removal with DNase I (RNase-free, Ambion), using the recommended protocols. RNA concentration and purity were determined using a 2100 Bioanalyzer (Agilent). cDNA libraries from all samples with an RNA integrity number (RIN) greater than eight were prepared and then sequenced using Illumina HiSeq 2500. The paired reads were trimmed and sequencing adaptors were removed using fastq-mcf. RNA ERCC spike-in control sequences were removed using bowtie version 1.0.0, and the remaining reads were aligned to the reference genome using tophat2 version 2.1.0. The gene-expression was quantified using HTseq-count. DESeq2 v1.6.3 was used to normalize the raw transcript reads for all genes by using the median-ratio normalization method and for library size (Love et al., 2014). To reduce the number of false-positive results, the log2 fold changes were shrunk toward zero for lowly expressed genes and the adjusted p-values were calculated using a false discovery rate (FDR) of 0.1. We then determined the log2 fold change in the normalized transcript reads for each gene at different time points, relative to the normalized transcript reads in the overnight stationary phase sample (t = 17 h). In order to identify the variables that best differentiate the data, as well as to determine how well-clustered the replicates were, we performed principal component analysis (PCA) using DESeq2 and a built-in R method (prcomp) on the top 500 expressed genes. These genes were normalized using a regularized log transform prior to PCA to allow better visualization of the trends and clusters that may otherwise remain hidden. The data shown represent the first (PC1) and second principal components (PC2). The clustering of the time point replicates indicates a high level of reproducibility in our data. During the three different growth phases the top 10% of upregulated and downregulated genes, based on their log2 fold change, were identified and goseq was used to identify overrepresented pathways in the Kyoto Encyclopedia of Genes and Genomes (KEGG) (Ogata et al., 1999; Kanehisa et al., 2016, 2017). In order to check the results, qPCR was performed on the same aliquots on a StepOnePlusTM Real-Time PCR System for selected genes. Both RNA-seq and qPCR measurements were performed in biological triplicates.
MIC Determination
The minimum inhibitory concentration (MIC) of the employed antibiotics against E. coli BW25113 was determined using a 96-well plate method. E. coli was grown for 17 h in LB containing different concentrations of ampicillin (0.5–512 μg ml-1), ofloxacin (0.0625–64 μg ml-1), or gentamicin (0.125–128 μg ml-1) and the OD595 was measured hourly. The MICs were measured as the lowest concentrations at which the OD595 was the same as the control (bacteria-free LB) and were determined as 5, 4, and 0.125 μg ml-1 for ampicillin, gentamicin, and ofloxacin, respectively.
Persister Enumeration
A culture was prepared as described above and during mid-exponential phase (t = 3 h after dilution) the respective antibiotics were added to the culture to reach a concentration of 25 × MIC, with persister levels typically not varying above this concentration of antibiotics (Johnson and Levin, 2013). Every 30 min an aliquot was taken from the treated culture, centrifuged (13,000 g for 5 min), re-suspended in PBS, and plated on LB agar plates. The plates were incubated and CFUs were determined the following day. For each antibiotic, the fraction of persister cells plateaued after 3 h of treatment, as previously reported (Johnson and Levin, 2013), confirming that we were studying persister subpopulations rather than antibiotic-tolerant populations (Brauner et al., 2016).
In order to enumerate persisters based on the effect of different antibiotics during the various phases of growth, a culture was prepared as described above (Supplementary Figures S1A,B). Nine 500 μl aliquots were withdrawn from the growing culture hourly (Supplementary Figures S1C,E). Three of them were used for untreated controls, the aliquots were centrifuged (13,000 g for 5 min), supernatant was removed, the pellet was resuspended in PBS, and serial dilutions were plated on LB agar (Supplementary Figure S1H). Three aliquots were supplied with 500 μl LB (1:1 dilution) containing 50 × MIC of one of the three above specified antibiotics (final concentration 25 × MIC) and were returned to the shaking incubator (Supplementary Figure S1F). After 3 h, these aliquots were centrifuged, the supernatant was removed, and the pellet was re-suspended in PBS. Serial dilutions were then performed and plated on LB agar (Supplementary Figure S1I). Three aliquots were injected with 10 μl of one of the three above specified antibiotics to reach a final concentration of 25 × MIC and returned to the shaking incubator (Supplementary Figure S1G). After 3 h these aliquots were centrifuged, the supernatant was removed, the pellet was re-suspended in PBS, serially diluted and plated on LB agar (Supplementary Figure S1J).
Results
Nutritional and Chemical Environment of a Growing E. coli Culture
We investigated how the sugar content and the pH of the growth medium changed over time. Notably, both quantities are known to affect the outcome of antibiotic treatment (Allison et al., 2011; Cama et al., 2014). The measured concentration of fermentable sugars in the LB medium we employed was 163 ± 35 μM. A previous study found that LB contained less than 100 μM fermentable sugars by using a genetic approach based on a hemA deletion mutant unable to grow in the absence of fermentable sugars (Sezonov et al., 2007). This discrepancy could be due to the different sources of LB and the different techniques used to quantify the sugar concentrations. This further emphasizes the added value of carrying out the simple assay described in Section 3.2 to quantify the concentration of fermentable sugars during bacterial growth.
After E. coli inoculation into LB medium, we measured the remaining sugar concentration at various intervals throughout the growth cycle (Figure 1A). We calculated the corresponding concentration of sugar available per bacterium (squares in Figure 1B) by dividing the measured sugar concentration by the measured number of bacteria in the culture (full symbols in Supplementary Figure S2, left axis). This revealed a one order of magnitude decrease in the sugar available per bacterium between 3 and 6 h after inoculation, when the culture transitioned from exponential to stationary growth-phase.
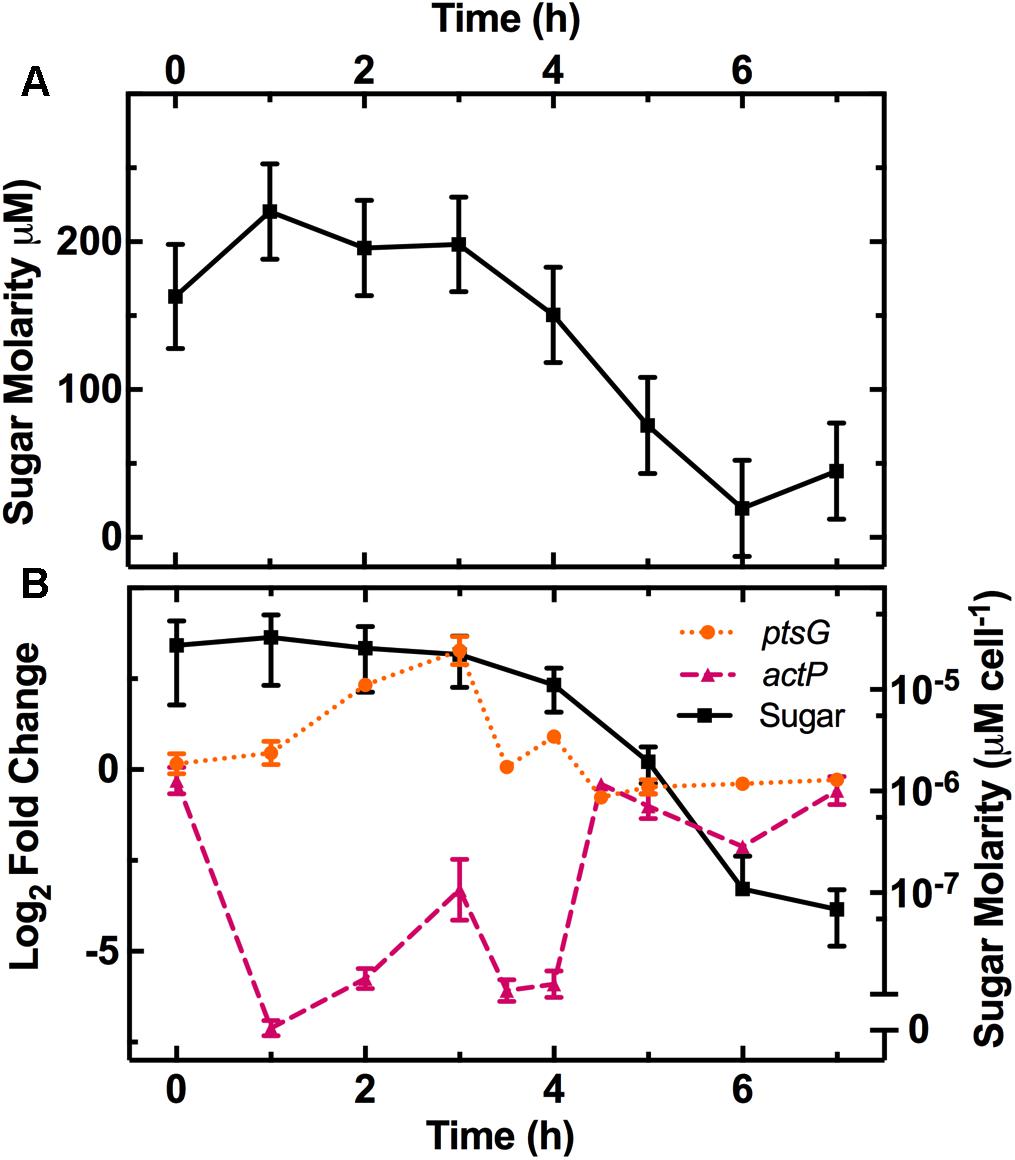
FIGURE 1. Characterization of the physical changes in the bacterial environment. (A) Dependence of the concentration of reducing sugars in the culture on the time elapsed from dilution in LB medium of an overnight E. coli culture. (B) Dependence of sugar concentration per cell (squares, right axis) and the expression of the glucose (ptsG, circles, left axis) and acetate (actP, triangles, left axis) related genes on time elapsed from dilution in LB medium. Gene-expression is reported as the log2 fold change with respect to the measurements on the overnight samples (t = 17 h). Data and error bars are the mean and standard error of the mean (SEM) calculated on measurements obtained in biological triplicate.
We also measured the pH of the culture throughout the growth cycle (Supplementary Figure S4). The pH decreased from 6.8 and reached it’s most acidic value of 6.2 during the exponential phase at t = 4 h, then rose up to a maximum of 7.0 during the stationary phase at t = 7 h. We explain this finding by considering that the culture environment is acidified by the excretion of acetate during aerobic fermentation, resulting from bacterial growth on carbohydrates during exponential phase (Kleman and Strohl, 1994). However, upon exhaustion of these carbohydrates, the bacteria use alternative carbon sources such as amino acids and other gluconeogenic substrates (Sezonov et al., 2007), resulting in the production and excretion of ammonia that increases the culture pH. Losen et al. (2004) did not observe the same growth-phase dependence for the pH of a growing E. coli culture. However, their assay was performed using a different E. coli strain (ATCC 53323) and different culture conditions including a different LB supplier, a one order of magnitude smaller LB volume and a one order of magnitude higher inoculum concentration. All together, our data complement our existing knowledge on the changes occurring in the medium composition during E. coli growth in LB (Losen et al., 2004; Sezonov et al., 2007).
Changes in Gene-Expression During the Growth Cycle
The gene-expression profile of bacterial populations is profoundly affected by changes in the culture (Hua et al., 2004; Bergholz et al., 2007; Klumpp and Hwa, 2015; Vital et al., 2015). However, to the best of our knowledge, this is the first study reporting the progressive reprogramming of the gene-expression profile of E. coli growing in LB throughout the different phases of growth.
In order to study the effect of the changing nutritional or chemical environment of the culture on the population transcriptome, we measured gene-expression profile in aliquots taken at different stages of growth in biological triplicates. Supplementary Table S1 reports, for each gene, the mean and SEM of the normalized transcript reads measured in the samples taken at t = 17 h post inoculation. Supplementary Table S1 also reports the mean and SEM of the log2 fold change in normalized transcript reads in the samples taken at t = 0, 1, 2, 3, 3.5, 4, 4.5, 5, 6, or 7 h post inoculation relative to the t = 17 h sample. The mean relative error, averaged on the relative errors for the transcript reads of all genes at t = 17 h, is 24%, thus confirming good reproducibility across biological replicates. Indeed, this corresponds to a log2 fold change of 0.31, whereas in comparison, the average absolute log2 fold change in gene-expression at t = 2 h relative to t = 17 h is 1.9. We further confirmed the changes in gene-expression of selected genes using qPCR (Supplementary Figure S5).
The PCA allowed clustering of the transcriptome profiles measured from the different biological replicates at each time point (Figure 2A), demonstrating good reproducibility of our cultures grown in shake flasks without the need for fermenter cultivation (Chang et al., 2002). The transcriptomes from adjacent time points clustered close to each other forming a nearly complete cycle, with the transcriptome measured at t = 0 being close to that measured at t = 7 h. Similarly, a cyclic transcriptional response of E. coli to acid adaptation was previously reported (Stincone et al., 2011). Furthermore, the transcriptomes measured at t = 0 and t = 1 h are simultaneously similar in terms of PC2 but different in terms of PC1 (Figure 2B), suggesting that part of the transcriptome rapidly adapts to changes in the nutritional environment. The population transcriptome then becomes increasingly different in PC1 (circles in Figure 2B). This suggests that the regulation of the genes used for PC1 analysis allows the culture to progressively adapt to an environment unfavorable for growth, as explained in the discussion below. On the other hand, the PC2 variance reveals that the transcriptomes at t = 3.5 and t = 4 h differ the most from the transcriptome at t = 0 h. The PC2 variance for the t = 0 h transcriptome is instead similar to that of the t = 7 h transcriptome, a trend similar to the temporal dependence of the average division rate (Supplementary Figure S6) and a mirror image of the trend in pH (Supplementary Figure S4). This suggests that the regulation of the genes used in the PC2 analysis governs the cell division and metabolism machineries, which in turn drive the changes in the environmental pH. This is, to the best of our knowledge, the first time PCA is carried out on the transcriptome of an E. coli culture throughout its growth cycle.
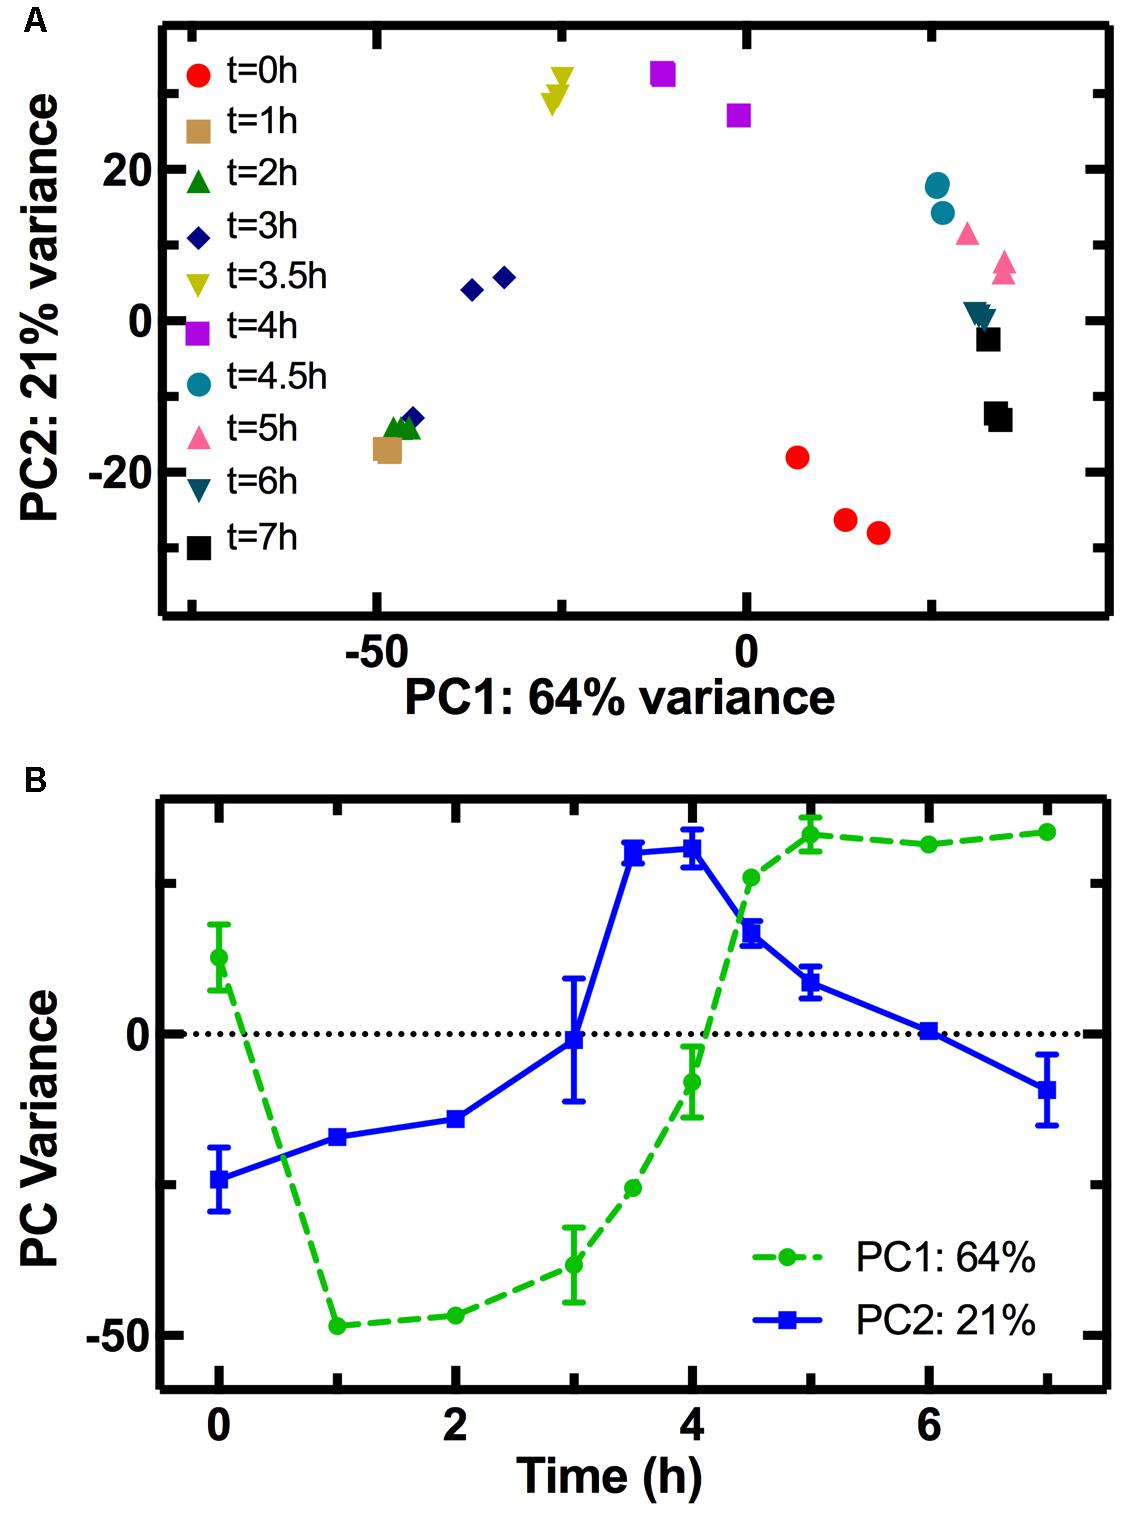
FIGURE 2. Principal component analysis (PCA) of the transcriptome at different stages of growth. (A) Correlation between the first (PC1) and second (PC2) principal components of the transcriptome of samples taken in biological triplicate at different time points during E. coli growth in LB. The clustering of transcriptomes from the same time points confirms the reproducibility of our measurements. Furthermore, adjacent time points clustered close to each other forming a nearly complete cycle, the transcriptome measured at t = 0 being close to that measured at t = 7 h. (B) The temporal dependence of PC1 (circles) resembles that of E. coli growth (Figure 3A) suggesting that genes used for PC1 may play a role in adaptation to the exhaustion of nutrients, whereas the temporal dependence of PC2 (squares) resembles that of the culture pH (Supplementary Figure S4) suggesting that these genes may be involved in the adaptation to pH changes.
The decrease in sugar levels in the medium parallels the regulation of a set of genes including ptsG, a glucose-specific phosphotransferase (Luli and Strohl, 1990), and the dedicated acetate uptake system actP (Luli and Strohl, 1990; Figure 1B). Expression of ptsG increases during the lag phase (circles in Figure 1B) when fresh medium is added to the culture and then decreases as the sugar concentration per bacterium decreases after t = 3 h (squares in Figure 1B). Bergholz et al. did not investigate gene-expression profile during lag phase but reported a similar downregulation of ptsG with a -3 log2 fold change between 4.5 and 5 h growth. In comparison, actP expression rapidly decreases between t = 0 h to t = 1 h as fresh medium is added to the culture before increasing at t = 4 h as sugars are metabolized and acetate becomes available in the environment (triangles in Figure 1B) as previously reported (Bergholz et al., 2007).
The growth curve in Figure 3A shows the three characteristic phases of growth: lag phase between t = 0 h and t = 2 h, exponential phase from t = 2 h to t = 5 h, and stationary phase from t = 5 h onward. We considered gene regulation during each of these phases based on the log2 fold change in transcript levels at t = 2 h relative to t = 0 h, t = 5 h relative to t = 2 h, and t = 7 h relative to t = 5 h, respectively. Furthermore, for each growth phase we grouped the top 10% of upregulated genes, from the 4313 genes analyzed. Then for each KEGG pathway we determined the number of genes that were in the top 10% group. We then used goseq to calculate the probability of this number occurring when compared to the total number of genes in the pathway (p-value in Figure 3). For example, the KEGG pathway “Microbial metabolism in diverse environments” has 201 associated genes. Therefore, in the top 10% group of the upregulated genes from all pathways one would expect to find 20 genes associated to this KEGG pathway. However, in the top 10% group of upregulated genes during exponential phase, we identified 54 genes from the “Microbial metabolism in diverse environments” pathway. Therefore, this pathway was overrepresented in the 10% group of upregulated genes during exponential phase with a p-value of 1.12 × 10⁻¹². We repeated this process for the top 10% downregulated genes, before ranking all the KEGG pathways by p-value, and reported the top 20 overrepresented pathways for the up- and downregulated genes (in red and blue, respectively, in Figure 3) during lag phase (Figure 3B), exponential phase (Figure 3C), and stationary phase (Figure 3D). Supplementary Table S2 reports the p-value and number of genes in each of these pathways for lag, exponential, and stationary phase. We could not directly compare our results with previously reported datasets (Weber et al., 2005; Bergholz et al., 2007) because these studies did not employ the KEGG database. Therefore, we report below the expression of strongly regulated genes for each growth phase and discuss our findings in the context of data reported in previous studies investigating either persisters or the influence of the medium composition on gene regulation.
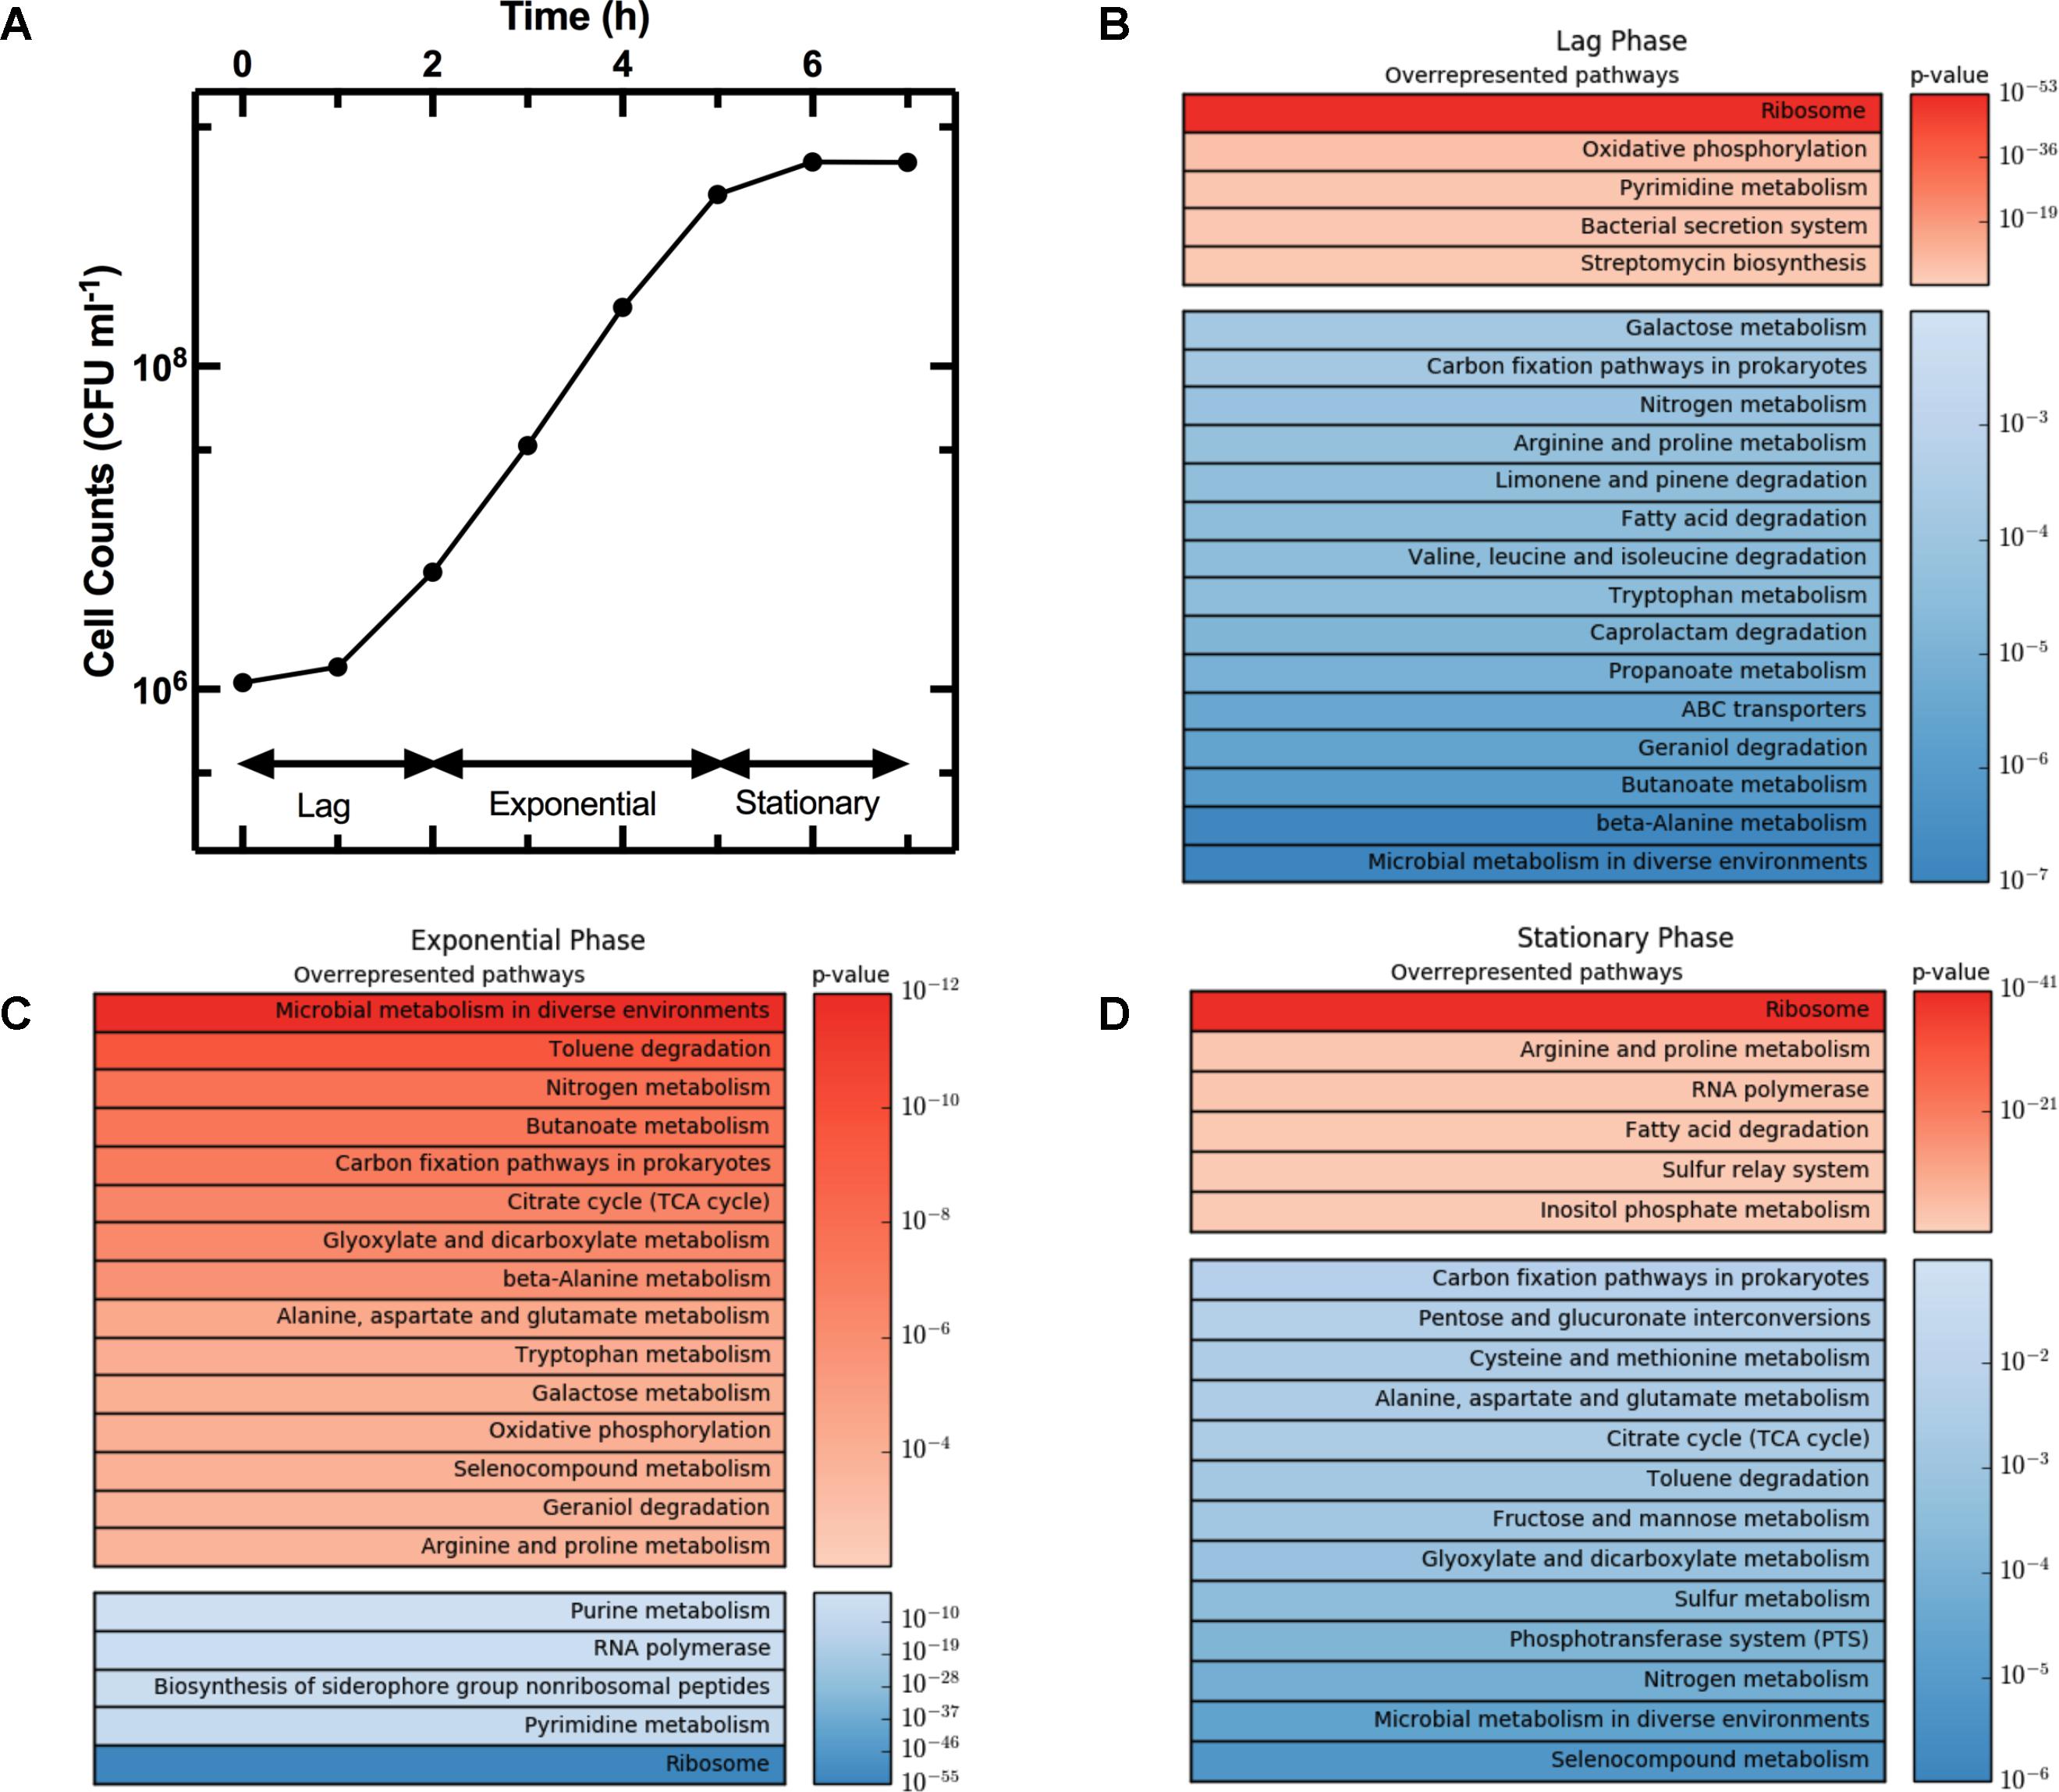
FIGURE 3. Regulation of KEGG pathways during different phases of the growth cycle. (A) Growth phases of an E. coli culture. (B–D) Heat map tables of the top twenty overrepresented KEGG pathways during lag, exponential, and stationary phase, respectively. Each top table reports upregulated genes (in red) while each bottom table reports downregulated pathways (in blue). Pathways were ranked by significance of their p-values. Both growth and gene-expression profile measurements were performed in biological triplicate. In (A) data and error bars are the mean and SEM of measurements. Error bars are small compared to the corresponding mean values and are hidden behind some of the data points.
The average expression dynamics for the whole transcriptome (dashed line in Figure 4) remained relatively constant throughout the different phases of growth. However, unlike previous reports (Chang et al., 2002), we found significant changes in the expression of several pathways during the lag phase (t = 0 to t = 2 h). Metabolism pathways were strongly downregulated (Figure 3B bottom table and Supplementary Table S2) and in particular the most overrepresented of these KEGG pathways was “Microbial metabolism in diverse environments.” This pathway was previously found to play a key role in Klebsiella pneumoniae adaptation to cold or heat shocks (Tripathy et al., 2014). Among the 10 most downregulated genes, we found astA (-13.0 log2 fold change, squares in Figure 4A), astB, and astC in the AST pathway controlling arginine degradation; gadA and gadB controlling glutamate decarboxylase activity (De Biase et al., 1999); the biofilm regulator bssR; and the aldehyde dehydrogenase aldB. These genes were then all strongly induced during the exponential phase (between 8 and 10 log2 fold).
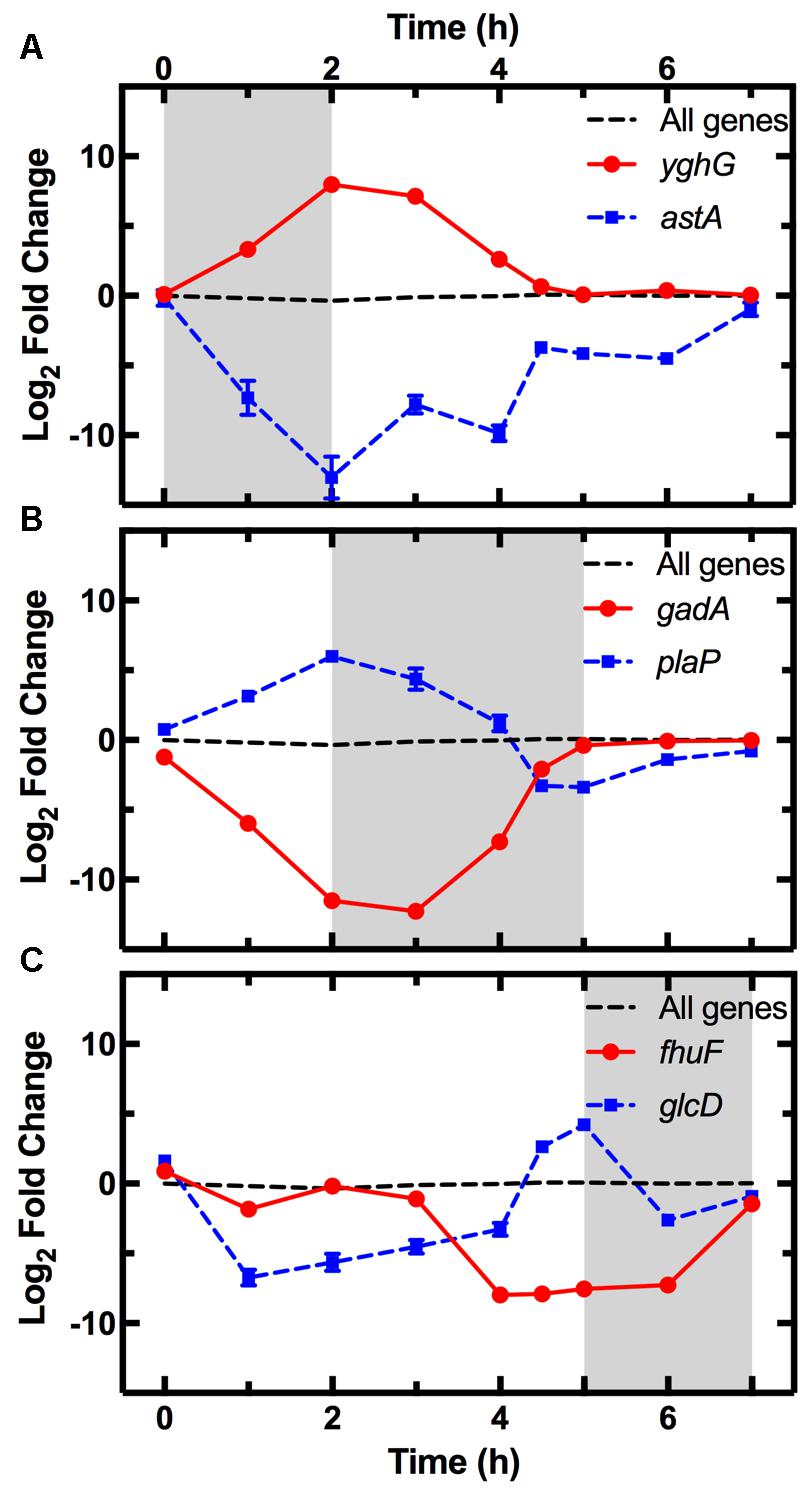
FIGURE 4. Pattern of expression of the top most upregulated and downregulated genes during each phase. Expression profiles of the most upregulated (circles) and downregulated (squares) genes between t = 0–2 h (A), t = 2–5 h (B), and t = 5–7 h (C) from dilution in LB medium of an overnight E. coli culture. Gene expression is reported as the log2 fold change with respect to the measurements on the overnight samples (t = 17 h). The average expression dynamics for the whole transcriptome (dashed line) remains relatively constant throughout the different phases of growth. The expression dynamics for all the 4373 analyzed genes is reported in Supplementary Table S1. Data and error bars are the mean and SEM of measurements obtained on biological triplicates. Error bars are hidden behind some of the data points.
Among the upregulated pathways (Figure 3B top table and Supplementary Table S2), “Ribosome” was the most overrepresented indicating induction of the translation machinery. Furthermore, among the 10 most upregulated genes, we found yghG (7.9 log2 fold change, circles in Figure 4A) and yghF that were induced at t = 1 h and have previously been linked to type II secretion (Kim et al., 2017); borD encoding a prophage lipoprotein; proV, proW, and proX also induced at t = 1 h, encoding parts of an ABC transporter for the uptake of glycine, betaine, and proline; iraM induced at t = 1 h and encoding an anti-adapter protein that inhibits RpoS proteolysis; and stpA encoding a DNA-binding protein. yghG, yghF, borD, iraM, and stpA were then strongly downregulated (between -6 and -8 log2 fold) during exponential phase. Notably, gene-expression profiling during the lag phase was not reported in a previous transcriptomic study carried out on E. coli O157 (Bergholz et al., 2007).
During the exponential growth phase (t = 2 h to t = 5 h) there was an extensive reprogramming of gene-expression. The “Ribosome” pathway was the most overrepresented in the top 10% downregulated genes, indicating repression of the translation machinery at the transition between exponential and stationary phase (t = 5 h) in response to the depletion of nutrients in the culture conditions. This was reflected in the measured division rate (Supplementary Figure S6). Among the 10 most downregulated genes, we found plaP (-9.4 log2 fold change, squares in Figure 4B) encoding a putrescine importer required for the induction of pili-driven motility, in accordance with the reported low motility of exponentially growing E. coli (Amsler et al., 1993); cspA encoding a cold shock protein; fhuF encoding an iron reductase protein; lpxT encoding the lipid A 1-diphosphate synthase; fecA encoding an outer membrane receptor in the Fe3+ dicitrate transport system; and the above discussed yghF. fhuF and plaP were then upregulated by a factor of 6 and 2 log2 fold, respectively, during stationary phase.
Metabolism related pathways were upregulated with “Microbial metabolism in diverse environments” now being the most overrepresented KEGG pathway (Figure 3C top table). Among the 10 most upregulated genes, we found gadA (11.1 log2 fold change, circles in Figure 4B), gadB, gadC, and gadE that were induced at t = 4 h and whose upregulation at the transition between exponential and stationary phase have previously been reported (De Biase et al., 1999; Weber et al., 2005; Bergholz et al., 2007); glcD and glcE induced at t = 3.5 h, encoding a subunit of the glycolate oxidase; narU induced at t = 3 h, encoding a nitrate and nitrite inner membrane transporter; aldB already discussed above; and tnaC discussed below. glcD, glcE, and tnaC were then downregulated during the stationary phase. The tnaC gene is part of the tnaCAB operon that regulates tryptophan catabolism and is comprised of a 24 residue upstream peptide TnaC, the tryptophanase TnaA, and the low affinity tryptophan permease TnaB (Konan and Yanofsky, 1997). TnaA is responsible for the breakdown of tryptophan, which is utilized by E. coli as an energy source to produce pyruvate, ammonia, and indole (Luli and Strohl, 1990). Interestingly, as the sugars were depleted in the culture, we observed an increase in expression of the tnaCAB operon (Supplementary Table S1). This was in accordance with a previous proteomic study carried out on E. coli K12 BW25113 growing on minimal medium (Soufi et al., 2015), suggesting a correlation between tryptophan related gene and protein expression. Furthermore, Gaimster and Summers (2015) observed an increase in tnaA expression in a growing E. coli culture, correlating this to an increase in the concentration of extracellular indole (Gaimster et al., 2014). Finally, we also observed an upregulation of transport genes including ompF and lamB encoding two of the major E. coli outer membrane porins (Supplementary Table S1), which was not previously observed (Bergholz et al., 2007).
Metabolism related pathways were downregulated as the population entered stationary phase (t = 5 h to t = 7 h) with “Microbial metabolism in diverse environments” now being the most overrepresented KEGG pathway (Figure 3D bottom table). This coincided with the previously mentioned reduction in sugar availability (Figure 1B). Almost all of the genes in the phosphoenolpyruvate (PEP)-dependent phosphotransferase system (PTS) pathway, a major bacterial mechanism for the accumulation of carbohydrates (Shimizu, 2013), were downregulated as the bacteria moved from late-exponential to stationary phase (Figure 3D). The downregulation of the PTS pathway may cause reduced levels of glycolysis intermediates such as fructose 1,6-bisphosphate (FDP), which in E. coli results in the activation of cra and the subsequent transcriptional repression of pfkA and pykF (Shimizu, 2013). Both pykF and pfkA were downregulated as the culture transitioned from exponential to stationary phase (Supplementary Figure S7) resulting in the downregulation of the TCA cycle (Figure 3D). This is in agreement with a previous transcriptomic study carried out on E. coli O157, reporting a downregulation of the tricarboxylic acid (TCA) cycle pathway after t = 4.5 h compared to t = 3 h growth on minimal medium (Bergholz et al., 2007). Similarly, we found agreement between Bergholz’s data and ours on the downregulation of the sulfur metabolism pathway, sulfur being present in LB and instrumental for the biosynthesis of the amino acids cysteine and methionine (Sekowska et al., 2000).
Among the 10 most downregulated genes were glcD (-5.1 log2 fold change, squares in Figure 4C), glcE, glcA, and glcB; ansB encoding L-asparaginase 2; fumB encoding a fumarate hydratase; and adiY encoding a transcriptional regulator. glcD, glcE, glcA, and glcB were further downregulated during the lag phase. Finally, genes encoding transporters including ompF and lamB, were also downregulated as previously reported (Chang et al., 2002).
The “Ribosome” pathway was the most overrepresented in the top 10% upregulated genes. However, the mean expression of all the 48 genes in this pathway was downregulated by a factor of 2.8 log2 fold at t = 7 h compared to t = 2 h. Among the 10 most upregulated genes, we identified fhuF (6.1 log2 fold change, circles in Figure 4C); astA, astC, and astE in the AST pathway, that were induced at t = 6 h; prpB induced at t = 4 h, encoding the 2-methylisocitrate lyase; bfd encoding bacterioferritin-associated ferredoxin; rmf induced at t = 4 h, encoding a ribosome modulation factor; ynfM encoding an inner membrane transporter; sodA induced at t = 6 h, encoding a superoxide dismutase, previously associated with the emergence of metabolic heterogeneity during nutrient starvation (Şimşek and Kim, 2018); and obgE encoding the essential GTPase ObgE/CgtA. In the AST pathway, rmf, ynfM, and prpB were then strongly downregulated (between -5 and -10 log2 fold) during lag phase. Furthermore, a major regulator of the stress response in bacteria, particularly their entry into stationary phase, is the sigma factor rpoS controlling the expression of approximately 10% of genes in E. coli (Weber et al., 2005). Our data shows that rpoS expression increases rapidly as the culture enters stationary phase (Supplementary Figure S8), in accordance with previously reported data (2.4 and 2.8 log2 fold change, respectively, between t = 4 h and 5 h from inoculation) (Bergholz et al., 2007). Bergholz, et al. also reported that the most highly upregulated gene during the transition to stationary phase was acs, which encodes acetyl CoA synthetase, confirming the data reported in a separate study on E. coli MG1655 (Baev et al., 2006). Similarly, between t = 4 h and t = 4.5 h from inoculation, we observe a 7.4 log2 fold change in the expression of acs and 4.7 log2 fold change of aceB expression, in accordance with Bergholz, et al. who reported a 5.4 log2 fold change for aceB during the same temporal window. These data suggest that at least some E. coli responses to changes in growth medium are conserved across evolutionary distance and are not specific to the growth medium employed. All together, our data on the reprogramming of the culture gene-expression during the transitions between the different growth phases (Figures 3, 4 and Supplementary Tables S1, S2) will be relevant for studying the responses of microbial communities to environmental changes.
Growth Stage Dependent Persister Formation
We then studied the growth cycle dependence of phenotypic heterogeneity within the population by measuring persistence to antibiotics as a phenotypic proxy. We used three antibiotics with distinct modes of action: ampicillin, gentamicin, and ofloxacin. Specifically, ampicillin is a β-lactam that binds to the penicillin-binding proteins located inside the bacterial cell wall. It inhibits the last stage of bacterial cell wall synthesis leading to lysis mediated by autolytic enzymes. Gentamicin is an aminoglycoside that works by irreversibly binding to the 30S subunit of the bacterial ribosome, thereby interrupting protein synthesis. Ofloxacin is a second-generation fluoroquinolone that acts on DNA gyrase and topoisomerase IV, and thus altering the control of DNA supercoiling and inhibiting normal cell division (Aldred et al., 2014).
To investigate the growth-dependent heterogeneity of the response to each antibiotic, we performed two different treatments (see Supplementary Figure S1): three culture aliquots were injected with antibiotic and fresh LB (Supplementary Figure S1F), while three other aliquots were injected with antibiotic only (Supplementary Figure S1G). In both cases, the final antibiotic concentration was 25× the antibiotic MIC. For each time point and each antibiotic treatment, we then calculated the ratio between the measured number of persisters in the culture relative to the total number of bacteria in the culture (Figure 3A), defining this as the persister fraction. We finally normalized each persister fraction dataset to their maximum values.
When gentamicin was added to the culture aliquots with fresh LB, the fraction of persisters showed a 3.4 log10 fold increase between t = 3 h and t = 4 h, before remaining relatively constant for the remainder of the growth cycle (Figure 5A). When only gentamicin was added to the culture aliquots the fraction of persisters showed a similar pattern, except for a shift of 1 h, with a 3.6 log10 fold increase between t = 2 h and t = 3 h (Figure 5B).
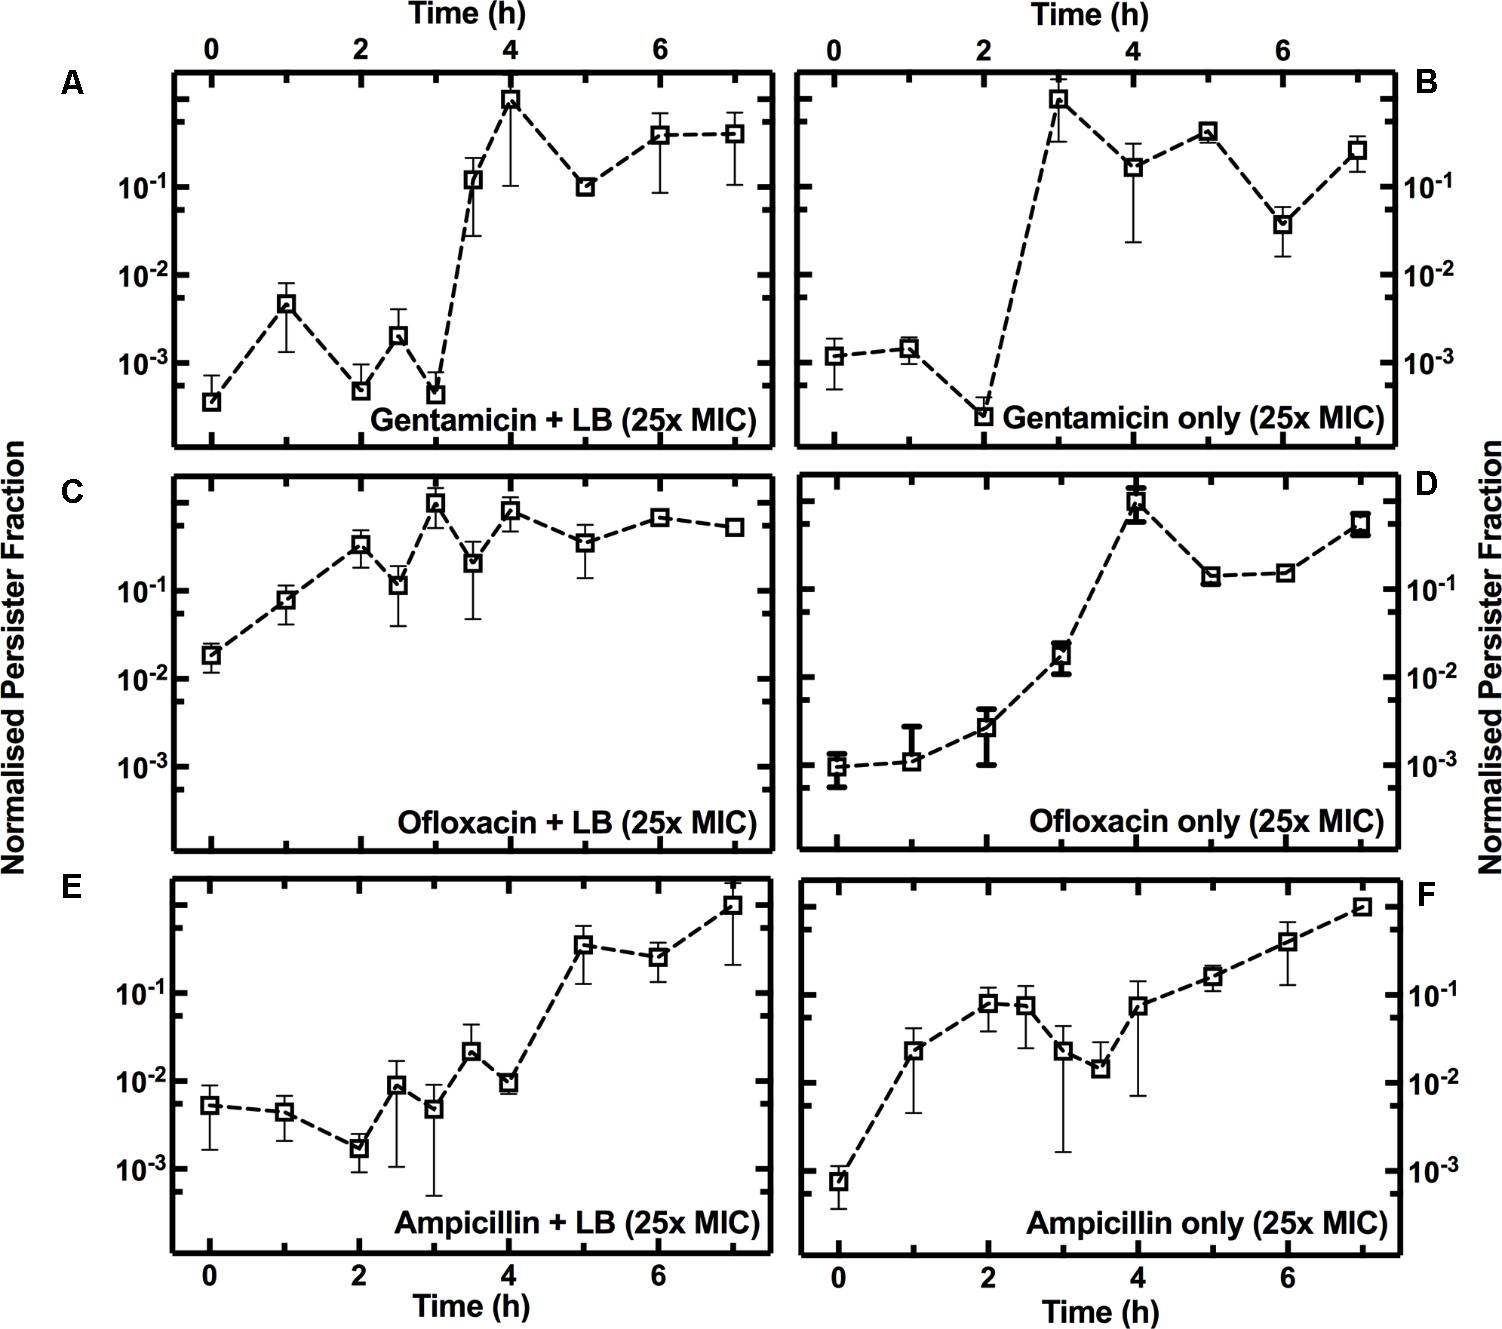
FIGURE 5. Growth phase dependence of the fraction of persisters to gentamicin, ofloxacin, or ampicillin. Temporal dependence of the normalized fraction of persisters to treatment either with gentamicin (A), ofloxacin (C), or ampicillin (E), with the addition of fresh LB, or with antibiotics only [(B,D,F), respectively]. At t = 0 an overnight E. coli culture was diluted 1:1000 in LB medium and the culture growth started. Each data set is normalized to its maximum persister fraction. Data and error bars are the mean and SEM of measurements obtained at least on biological and technical triplicates.
When ofloxacin was added to the culture aliquots with fresh LB, there was a small increase in the persister fraction during the lag phase (Figure 5C). However, the persister fraction showed a 2.6 log10 fold increase during the exponential phase (between t = 2 h and t = 4 h) when only ofloxacin was added to the culture aliquots (Figure 5D).
When ampicillin was added to the culture aliquots with fresh LB, we measured a 2 log10 fold increase in the persister fraction during the stationary phase (Figure 5E). When only ampicillin was added to the culture aliquots, we measured a 1.5 log10 fold increase in the fraction of persister cells during the lag phase (t = 1 h, Figure 5F).
Growth-dependent bacterial susceptibility has recently been reported (Greulich et al., 2015). Here, we demonstrate that as the composition of the medium in the culture environment changes, the microbial population becomes increasingly heterogeneous in response to the treatment to antibiotics with different modes of action.
Furthermore, antibiotic susceptibility and persister assays are often carried out by supplementing antibiotics with fresh LB medium (Wu et al., 2015; Orman and Brynildsen, 2016). We demonstrate that in the case of gentamicin, the addition of fresh LB medium does not substantially affect the dependence of persister fraction on growth phase. Indeed, it has recently been demonstrated that nutrient-rich environments do not increase susceptibility to antibiotics that irreversibly bind to the 30S subunit of the bacterial ribosome (Greulich et al., 2015). On the contrary, we observed that the formation of persisters to β-lactams and quinolones is strongly affected by the medium composition, suggesting that this should be carefully considered when screening for antibiotics against persister cells.
Discussion
Within an isogenic population, there is inherent phenotypic heterogeneity which allows an adaptive response to an ever-changing extracellular environment (Balaban et al., 2004; Ryall et al., 2012; Nikolic et al., 2013; Kotte et al., 2014). For example, within a growing isogenic population of bacteria there are multiple growth phenotypes present, from exponentially growing to slow growing, or dormant bacteria (Ryall et al., 2012; Kotte et al., 2014). Persister cells are an example of a phenotype which differs from the majority of cells in a clonal population in terms of growth rate (Lewis, 2010; Maisonneuve et al., 2013), motility, gene expression, and cell size (Ryall et al., 2012). Furthermore, persister cells can be generated in response to a number of environmental conditions (Keren et al., 2004b; Vega et al., 2012; Bernier et al., 2013; Helaine et al., 2014), including nutrient limitation (Fung et al., 2010; Maisonneuve and Gerdes, 2014) and nutrient transitions (Amato et al., 2013) that also generate a variety of other bacterial responses (Lidstrom and Konopka, 2010).
Therefore, we utilized the persister phenotype as a proxy for changes in population-wide heterogeneity throughout the E. coli growth cycle where the environmental conditions are constantly changing. We observed homogeneity in response to all antibiotics during lag phase with very few persisters to any of the tested antibiotics. However, the different persister fractions observed in response to the different antibiotics further emphasize the phenotypic heterogeneity within the population during the exponential and stationary phases. In fact, population based heterogeneity allows rapid response to alterations in the nutritional environment; it is only when the environment becomes favorable to a given subpopulation that they are able to dominate the whole population-level response (Lidstrom and Konopka, 2010). Indeed, within the growth cycle we observed changes in both nutrient availability (Figure 1) and pH (Supplementary Figure S4).
These changes in the culture medium also influenced the population transcriptome during the same temporal windows where we measured notable increases in the fraction of persisters. We observed upregulation of carbon fixation pathways and tryptophan metabolism (Figure 3C), potentially as a result of an increase in the concentration of extracellular indole (Gaimster et al., 2014). Indole has also been linked to persister cell formation (Vega et al., 2012, 2013) and the induced expression of a variety of drug exporters (Meng and Bennett, 1992; Balaban et al., 2004). Moreover, ompF and lamB, encoding two of the major outer membrane porins that have been associated with drug uptake (Ziervogel and Roux, 2013; Lin et al., 2014; Cama et al., 2015) were also upregulated at the whole population level during exponential phase (Supplementary Table S1).
In comparison, during stationary phase we observed a clear downregulation of metabolism related pathways (Figure 3D). The downregulation of the TCA cycle as the population moves from exponential to stationary phase (Figure 3D) results in the excretion of acetate into the extracellular environment and its subsequent utilization (Figure 1; Luli and Strohl, 1990; Shimizu, 2013). Kotte et al. (2010) modeled population adaptation to different nutrients in silico, showing that as glucose levels reduce, cells are predicted to utilize their natively produced acetate. This ability to adapt to nutrient availability appears to be a result of metabolic flux at the single-cell level (Kotte et al., 2010; Kochanowski et al., 2013) and results in the diversification of growing and non-growing phenotypes, such as persisters (Kotte et al., 2014). Indeed, we measured an increase in persister fraction in response to all three antibiotics as the available sugars become limited (Figure 1). However, each type of antibiotic reveals different levels of heterogeneity suggesting that different biological pathways underlie persistence to different antibiotics.
We also found that the outcome of antibiotic treatment is strongly influenced by the composition of the medium containing the antibiotic. In fact, the addition of antibiotics and fresh LB alters the native culture environment and causes a reduction in the number of persisters (Figure 5), reducing phenotypic heterogeneity within the E. coli community.
One of the current limitations within our knowledge of persister bacteria is that their transcriptome has been examined only after treatment with antibiotics (Keren et al., 2004b) owing to the lack of biomarkers to isolate persisters from the majority of susceptible cells before antibiotic challenge. However, antibiotic treatment is known to alter the bacterial transcriptome (Lewis, 2010). Our current study identifies molecular pathways that are strongly regulated at the whole population level when the environment changes and, coincidentally, the fraction of persisters within the population increases. Some of the identified pathways such as tryptophan metabolism and TCA cycle (Vega et al., 2012; Kotte et al., 2014), have indeed previously been associated with persisters. However, it is noteworthy that our approach measures the mean transcriptomic response of the whole population. Therefore, our measurements do not allow us to determine whether the pathways that we have identified are also strongly regulated in the minority of persister cells. Indeed, the differential response of persisters could be masked by that of the majority of susceptible cells. Considering that cell-to-cell variation increases with increasing mean gene-expression (Silander et al., 2012), these comprehensive data sets provide well defined culturing time points, medium compositions, and putative pathways that could be investigated with single-cell approaches (Henry and Brynildsen, 2016; Bamford et al., 2017) to determine molecular pathways that are differentially regulated in persisters compared to the majority of susceptible cells.
Our approach could easily be extended to investigate the dynamics of phenotypic heterogeneity in different microbial communities such as bacterial biofilms (Domka et al., 2007), natural yeast and fungal populations (LaFleur et al., 2010; Holland et al., 2014), or cancer cells (Hangauer et al., 2017) responding to a variety of environmental cues.
Author Contributions
SP developed the project and designed the research. AS, AK, RB, CS, SF, and AK-S performed the experiments. PO, KM, and KP carried out sequencing. All authors analyzed and discussed the data. AS and SP wrote the paper.
Funding
This work was supported by a Royal Society Research Grant (RG140203), a Wellcome Trust Strategic Seed Corn Fund (WT097835/Z/11/Z), and a start up Grant from the University of Exeter awarded to SP. AS acknowledges support from the BBSRC through a SWBio-DTP studentship (BB/M009122/1). KP, KM, and PO would like to acknowledge support from the following awards: Wellcome Trust Institutional Strategic Support Fund (WT097835MF), Wellcome Trust Multi User Equipment Award (WT101650MA), and Medical Research Council Clinical Infrastructure Funding (MR/M008924/1). This work was partly supported by BBSRC award BB/1024631/1 to RT.
Conflict of Interest Statement
The authors declare that the research was conducted in the absence of any commercial or financial relationships that could be construed as a potential conflict of interest.
Supplementary Material
The Supplementary Material for this article can be found online at: https://www.frontiersin.org/articles/10.3389/fmicb.2018.01739/full#supplementary-material
References
Ackermann, M. (2015). A functional perspective on phenotypic heterogeneity in microorganisms. Nat. Rev. Microbiol. 13, 497–508. doi: 10.1038/nrmicro3491
Aldred, K. J., Kerns, R. J., and Osheroff, N. (2014). Mechanism of quinolone action and resistance. Biochemistry 53, 1565–1574. doi: 10.1021/bi5000564
Allison, K. R., Brynildsen, M. P., and Collins, J. J. (2011). Metabolite-enabled eradication of bacterial persisters by aminoglycosides. Nature 473, 216–220. doi: 10.1038/nature10069
Amato, S. M., and Brynildsen, M. P. (2014). Nutrient transitions are a source of persisters in Escherichia coli biofilms. PLoS One 9:e93110. doi: 10.1371/journal.pone.0093110
Amato, S. M., Orman, M. A., and Brynildsen, M. P. (2013). Metabolic control of persister formation in Escherichia coli. Mol. Cell 50, 475–487. doi: 10.1016/j.molcel.2013.04.002
Amsler, C. D., Cho, M., and Matsumura, P. (1993). Multiple factors underlying the maximum motility of Escherichia coli as cultures enter post-exponential growth. J. Bacteriol. 175, 6238–6244. doi: 10.1128/jb.175.19.6238-6244.1993
Arnoldini, M., Vizcarra, I. A., Peña-Miller, R., Stocker, N., Diard, M., Vogel, V., et al. (2014). Bistable expression of virulence genes in Salmonella leads to the formation of an antibiotic-tolerant subpopulation. PLoS Biol. 12:e1001928. doi: 10.1371/journal.pbio.1001928
Baev, M. V., Baev, D., Radek, A. J., and Campbell, J. W. (2006). Growth of Escherichia coli MG1655 on LB medium: determining metabolic strategy with transcriptional microarrays. Appl. Microbiol. Biotechnol. 71, 323–328. doi: 10.1007/s00253-006-0392-8
Balaban, N. Q., Merrin, J., Chait, R., Kowalik, L., and Leibler, S. (2004). Bacterial persistence as a phenotypic switch. Science 305, 1622–1625. doi: 10.1126/science.1099390
Bamford, R. A., Smith, A., Metz, J., Glover, G., Titball, R. W., and Pagliara, S. (2017). Investigating the physiology of viable but non-culturable bacteria by microfluidics and time-lapse microscopy. BMC Biol. 15:121. doi: 10.1186/s12915-017-0465-4
Beaumont, H. J. E., Gallie, J., Kost, C., Ferguson, G. C., and Rainey, P. B. (2009). Experimental evolution of bet hedging. Nature 462, 90–93. doi: 10.1038/nature08504
Bergholz, T. M., Wick, L. M., Qi, W., Riordan, J. T., Ouellette, L. M., and Whittam, T. S. (2007). Global transcriptional response of Escherichia coli O157:H7 to growth transitions in glucose minimal medium. BMC Microbiol. 7:97. doi: 10.1186/1471-2180-7-97
Bernier, S. P., Lebeaux, D., DeFrancesco, A. S., Valomon, A., Soubigou, G., Coppée, J. Y., et al. (2013). Starvation, together with the SOS response, mediates high biofilm-specific tolerance to the fluoroquinolone ofloxacin. PLoS Genet. 9:e1003144. doi: 10.1371/journal.pgen.1003144
Bódi, Z., Farkas, Z., Nevozhay, D., Kalapis, D., Lázár, V., Csörgő, B., et al. (2017). Phenotypic heterogeneity promotes adaptive evolution. PLoS Biol. 15:e2000644. doi: 10.1371/journal.pbio.2000644
Brauner, A., Fridman, O., Gefen, O., and Balaban, N. Q. (2016). Distinguishing between resistance, tolerance and persistence to antibiotic treatment. Nat. Rev. Microbiol. 14, 320–330. doi: 10.1038/nrmicro.2016.34
Cama, J., Bajaj, H., Pagliara, S., Maier, T., Braun, Y., Winterhalter, M., et al. (2015). Quantification of fluoroquinolone uptake through the outer membrane channel ompf of Escherichia coli. J. Am. Chem. Soc. 137, 13836–13843. doi: 10.1021/jacs.5b08960
Cama, J., Chimerel, C., Pagliara, S., Javer, A., and Keyser, U. F. (2014). A label-free microfluidic assay to quantitatively study antibiotic diffusion through lipid membranes. Lab Chip 14, 2303–2308. doi: 10.1039/c4lc00217b
Chang, D., Smalley, D. J., and Conway, T. (2002). Gene expression profiling of Escherichia coli growth transitions: an expanded stringent response model. Mol. Microbiol. 45, 289–306. doi: 10.1046/j.1365-2958.2002.03001.x
Chien, A.-C., Hill, N. S., and Levin, P. A. (2012). Cell size control in bacteria. Curr. Biol. 22, R340–R349. doi: 10.1016/j.cub.2012.02.032
De Biase, D., Tramonti, A., Bossa, F., and Visca, P. (1999). The response to stationary-phase stress conditions in Escherichia coli: role and regulation of the glutamic acid decarboxylase system. Mol. Microbiol. 32, 1198–1211. doi: 10.1046/j.1365-2958.1999.01430.x
Domka, J., Lee, J., Bansal, T., and Wood, T. K. (2007). Temporal gene-expression in Escherichia coli K-12 biofilms. Environ. Microbiol. 9, 332–346. doi: 10.1111/j.1462-2920.2006.01143.x
Elowitz, M., Levine, A., Siggia, E., and Swain, P. (2002). Stochastic gene expression in a single cell. Science 297, 1183–1186. doi: 10.1126/science.1070919
Fung, D. K. C., Chan, E. W. C., Chin, M. L., and Chan, R. C. Y. (2010). Delineation of a bacterial starvation stress response network which can mediate antibiotic tolerance development. Antimicrob. Agents Chemother. 54, 1082–1093. doi: 10.1128/AAC.01218-09
Gaimster, H., Cama, J., Hernández-Ainsa, S., Keyser, U. F., and Summers, D. K. (2014). The indole pulse: a new perspective on indole signalling in Escherichia coli. PLoS One 9:e93168. doi: 10.1371/journal.pone.0093168
Gaimster, H., and Summers, D. (2015). Regulation of indole signalling during the transition of E. coli from exponential to stationary phase. PLoS One 10:e0136691. doi: 10.1371/journal.pone.0136691
Greulich, P., Scott, M., Evans, M. R., and Allen, R. J. (2015). Growth-dependent bacterial susceptibility to ribosome-targeting antibiotics. Mol. Syst. Biol. 11:796. doi: 10.15252/msb.20145949
Hangauer, M. J., Viswanathan, V. S., Ryan, M. J., Bole, D., Eaton, J. K., Matov, A., et al. (2017). Drug-tolerant persister cancer cells are vulnerable to GPX4 inhibition. Nature 551, 247–250. doi: 10.1038/nature24297
Hansen, S., Lewis, K., and Vulić, M. (2008). Role of global regulators and nucleotide metabolism in antibiotic tolerance in Escherichia coli. Antimicrob. Agents Chemother. 52, 2718–2726. doi: 10.1128/AAC.00144-08
Hayes, E. T., Wilks, J. C., Sanfilippo, P., Yohannes, E., Tate, D. P., Jones, B. D., et al. (2006). Oxygen limitation modulates pH regulation of catabolism and hydrogenases, multidrug transporters, and envelope composition in Escherichia coli K-12. BMC Microbiol. 6:89. doi: 10.1186/1471-2180-6-89
Helaine, S., Cheverton, A., Watson, K., Faure, L., Matthews, S., and Holden, D. (2014). Internalization of Salmonella by macrophages induces formation of nonreplicating persisters. Science 343, 204–208. doi: 10.1126/science.1244705
Henry, T. C., and Brynildsen, M. P. (2016). Development of persister-FACSeq: a method to massively parallelize quantification of persister physiology and its heterogeneity. Sci. Rep. 6:25100. doi: 10.1038/srep25100
Holland, S. L., Reader, T., Dyer, P. S., and Avery, S. V. (2014). Phenotypic heterogeneity is a selected trait in natural yeast populations subject to environmental stress. Environ. Microbiol. 16, 1729–1740. doi: 10.1111/1462-2920.12243
Hua, Q., Yang, C., Oshima, T., Mori, H., and Shimizu, K. (2004). Analysis of gene expression in Escherichia coli in response to changes of growth-limiting nutrient in chemostat cultures. Appl. Environ. Microbiol. 70, 2354–2366. doi: 10.1128/AEM.70.4.2354-2366.2004
Johnson, P. J. T., and Levin, B. R. (2013). Pharmacodynamics, population dynamics, and the evolution of persistence in Staphylococcus aureus. PLoS Genet. 9:e1003123. doi: 10.1371/journal.pgen.1003123
Kaern, M., Elston, T. C., Blake, W. J., and Collins, J. J. (2005). Stochasticity in gene expression: from theories to phenotypes. Nat. Rev. Genet. 6, 451–464. doi: 10.1038/nrg1615
Kanehisa, M., Furumichi, M., Tanabe, M., Sato, Y., and Morishima, K. (2017). KEGG: new perspectives on genomes, pathways, diseases and drugs. Nucleic Acids Res. 45, D353–D361. doi: 10.1093/nar/gkw1092
Kanehisa, M., Sato, Y., Kawashima, M., Furumichi, M., and Tanabe, M. (2016). KEGG as a reference resource for gene and protein annotation. Nucleic Acids Res. 44, D457–D462. doi: 10.1093/nar/gkv1070
Keren, I., Kaldalu, N., Spoering, A., Wang, Y., and Lewis, K. (2004a). Persister cells and tolerance to antimicrobials. FEMS Microbiol. Lett. 230, 13–18. doi: 10.1016/S0378-1097(03)00856-5
Keren, I., Shah, D., Spoering, A., Kaldalu, N., and Lewis, K. (2004b). Specialized persister cells and the mechanism of multidrug tolerance in Escherichia coli. J. Bacteriol. 186, 8172–8180.
Kim, S., Jeong, H., Kim, E. Y., Kim, J. F., Lee, S. Y., and Yoon, S. H. (2017). Genomic and transcriptomic landscape of Escherichia coli BL21(DE3). Nucleic Acids Res. 45, 5285–5293. doi: 10.1093/nar/gkx228
Kleman, G. L., and Strohl, W. R. (1994). Acetate metabolism by Escherichia coli in high-cell-density fermentation. Appl Environ. Microbiol. 60, 3952–3958.
Klumpp, S., and Hwa, T. (2015). Bacterial growth: global effects on gene expression, growth feedback and proteome partition. Curr. Opin. Biotechnol. 28, 96–102. doi: 10.1016/j.copbio.2014.01.001
Kochanowski, K., Volkmer, B., Gerosa, L., Haverkorn van Rijsewijk, B. R., Schmidt, A., and Heinemann, M. (2013). Functioning of a metabolic flux sensor in Escherichia coli. Proc. Natl. Acad. Sci. U.S.A. 110, 1130–1135. doi: 10.1073/pnas.1202582110
Konan, K. V., and Yanofsky, C. (1997). Regulation of the Escherichia coli tna operon: nascent leader peptide control at the tnaC stop codon. J. Bacteriol. 179, 1774–1779. doi: 10.1128/jb.179.5.1774-1779.1997
Kotte, O., Volkmer, B., Radzikowski, J. L., and Heinemann, M. (2014). Phenotypic bistability in Escherichia coli’s central carbon metabolism. Mol. Syst. Biol. 10:736. doi: 10.15252/msb.20135022
Kotte, O., Zaugg, J. B., and Heinemann, M. (2010). Bacterial adaptation through distributed sensing of metabolic fluxes. Mol. Syst. Biol. 6, 1–9. doi: 10.1038/msb.2010.10
LaFleur, M. D., Kumamoto, C. A., and Lewis, K. (2006). Candida albicans biofilms produce antifungal-tolerant persister cells. Antimicrob. Agents Chemother. 50, 3839–3846. doi: 10.1128/AAC.00684-06
LaFleur, M. D., Qi, Q., and Lewis, K. (2010). Patients with long-term oral carriage harbor high-persister mutants of Candida albicans. Antimicrob. Agents Chemother. 54, 39–44. doi: 10.1128/AAC.00860-09
Lewis, K. (2010). Persister cells. Annu. Rev. Microbiol. 64, 357–372. doi: 10.1146/annurev.micro.112408.134306
Lidstrom, M. E., and Konopka, M. C. (2010). The role of physiological heterogeneity in microbial population behavior. Nat. Chem. Biol. 6, 705–712. doi: 10.1038/nchembio.436
Lin, X. M., Yang, M. J., Li, H., Wang, C., and Peng, X. X. (2014). Decreased expression of LamB and Odp1 complex is crucial for antibiotic resistance in Escherichia coli. J. Proteomics 98, 244–253. doi: 10.1016/j.jprot.2013.12.024
Losen, M., Frölich, B., Pohl, M., and Büchs, J. (2004). Effect of oxygen limitation and medium composition on Escherichia coli fermentation in shake-flask cultures. Biotechnol. Prog. 20, 1062–1068. doi: 10.1021/bp034282t
Love, M. I., Huber, W., and Anders, S. (2014). Moderated estimation of fold change and dispersion for RNA-seq data with DESeq2. Genome Biol. 15, 1–21. doi: 10.1186/s13059-014-0550-8
Luidalepp, H., Jõers, A., Kaldalu, N., and Tenson, T. (2011). Age of inoculum strongly influences persister frequency and can mask effects of mutations implicated in altered persistence. J. Bacteriol. 193, 3598–3605. doi: 10.1128/JB.00085-11
Luli, G. W., and Strohl, W. R. (1990). Comparison of growth, acetate production, and acetate inhibition of Escherichia coli strains in batch and fed-batch fermentations. Appl. Environ. Microbiol. 56, 1004–1011.
Maisonneuve, E., Castro-Camargo, M., and Gerdes, K. (2013). (p)ppGpp controls bacterial persistence by stochastic induction of toxin-antitoxin activity. Cell 154, 1140–1150. doi: 10.1016/j.cell.2013.07.048
Maisonneuve, E., and Gerdes, K. (2014). Molecular mechanisms underlying bacterial persisters. Cell 157, 539–548. doi: 10.1016/j.cell.2014.02.050
Megaw, J., and Gilmore, B. F. (2017). Archaeal persisters: persister cell formation as a stress response in Haloferax volcanii. Front. Microbiol. 8:1589. doi: 10.3389/fmicb.2017.01589
Meng, S. Y., and Bennett, G. N. (1992). Nucleotide sequence of the Escherichia coli cad operon: a system for neutralization of low extracellular pH. J. Bacteriol. 174, 2659–2669. doi: 10.1128/jb.174.8.2659-2669.1992
Mulcahy, L. R., Burns, J. L., Lory, S., and Lewis, K. (2010). Emergence of Pseudomonas aeruginosa strains producing high levels of persister cells in patients with cystic fibrosis. J. Bacteriol. 192, 6191–6199. doi: 10.1128/JB.01651-09
New, A. M., Cerulus, B., Govers, S. K., Perez-Samper, G., Zhu, B., Boogmans, S., et al. (2014). Different levels of catabolite repression optimize growth in stable and variable environments. PLoS Biol. 12:e1001764. doi: 10.1371/journal.pbio.1001764
Nikolic, N., Barner, T., and Ackermann, M. (2013). Analysis of fluorescent reporters indicates heterogeneity in glucose uptake and utilization in clonal bacterial populations. BMC Microbiol. 13:258. doi: 10.1186/1471-2180-13-258
Ogata, H., Goto, S., Sato, K., Fujibuchi, W., Bono, H., and Kanehisa, M. (1999). KEGG: Kyoto encyclopedia of genes and genomes. Nucleic Acids Res. 27, 29–34. doi: 10.1093/nar/27.1.29
Orman, M. A., and Brynildsen, M. P. (2016). Persister formation in Escherichia coli can be inhibited by treatment with nitric oxide. Free Radic. Biol. Med. 93, 145–154. doi: 10.1016/j.freeradbiomed.2016.02.003
Radzikowski, J. L., Vedelaar, S., Siegel, D., Ortega,ÁD., Schmidt, A., and Heinemann, M. (2016). Bacterial persistence is an active σS stress response to metabolic flux limitation. Mol. Syst. Biol. 12:882. doi: 10.15252/msb.20166998
Ryall, B., Eydallin, G., and Ferenci, T. (2012). Culture history and population heterogeneity as determinants of bacterial adaptation: the adaptomics of a single environmental transition. Microbiol. Mol. Biol. Rev. 76, 597–625. doi: 10.1128/MMBR.05028-11
Schreiber, F., Littmann, S., Lavik, G., Escrig, S., Meibom, A., Kuypers, M. M. M., et al. (2016). Phenotypic heterogeneity driven by nutrient limitation promotes growth in fluctuating environments. Nat. Microbiol. 1, 1–7. doi: 10.1038/nmicrobiol.2016.55
Scott, M., Gunderson, C. W., Mateescu, E. M., Zhang, Z., and Hwa, T. (2010). Interdependence of cell growth origins and consequences. Science 330, 1099–1102. doi: 10.1126/science.1192588
Sekowska, A., Kung, H., and Danchin, A. (2000). Sulfur metabolism in Escherichia coli and related bacteria: facts and fiction. J. Mol. Microbiol. Biotechnol. 2, 145–177.
Sezonov, G., Joseleau-Petit, D., and D’Ari, R. (2007). Escherichia coli physiology in Luria-Bertani broth. J. Bacteriol. 189, 8746–8749. doi: 10.1128/JB.01368-07
Sheik, A. R., Muller, E. E. L., Audinot, J. N., Lebrun, L. A., Grysan, P., Guignard, C., et al. (2016). In situ phenotypic heterogeneity among single cells of the filamentous bacterium Candidatus Microthrix parvicella. ISME J. 10, 1274–1279. doi: 10.1038/ismej.2015.181
Shimizu, K. (2013). Regulation systems of bacteria such as Escherichia coli in response to nutrient limitation and environmental stresses. Metabolites 4, 1–35. doi: 10.3390/metabo4010001
Silander, O. K., Nikolic, N., Zaslaver, A., Bren, A., Kikoin, I., Alon, U., et al. (2012). A genome-wide analysis of promoter-mediated phenotypic noise in Escherichia coli. PLoS Genet. 8:e1002443. doi: 10.1371/journal.pgen.1002443
Şimşek, E., and Kim, M. (2018). The emergence of metabolic heterogeneity and diverse growth responses in isogenic bacterial cells. ISME J. 12, 1199–1209. doi: 10.1038/s41396-017-0036-2
Soufi, B., Krug, K., Harst, A., and Macek, B. (2015). Characterization of the E. coli proteome and its modifications during growth and ethanol stress. Front. Microbiol. 6:103. doi: 10.3389/fmicb.2015.00103
Stincone, A., Daudi, N., Rahman, A. S., Antczak, P., Henderson, I., Cole, J., et al. (2011). A systems biology approach sheds new light on Escherichia coli acid resistance. Nucleic Acids Res. 39, 7512–7528. doi: 10.1093/nar/gkr338
Tripathy, S., Sen, R., Padhi, S. K., Mohanty, S., and Maiti, N. K. (2014). Upregulation of transcripts for metabolism in diverse environments is a shared response associated with survival and adaptation of Klebsiella pneumoniae in response to temperature extremes. Funct. Integr. Genomics 14, 591–601. doi: 10.1007/s10142-014-0382-3
Veening, J. W., Igoshin, O. A., Eijlander, R. T., Nijland, R., Hamoen, L. W., and Kuipers, O. P. (2008). Transient heterogeneity in extracellular protease production by Bacillus subtilis. Mol. Syst. Biol. 4, 1–15. doi: 10.1038/msb.2008.18
Vega, N. M., Allison, K. R., Khalil, A. S., and Collins, J. J. (2012). Signaling-mediated bacterial persister formation. Nat. Chem. Biol. 8, 431–433. doi: 10.1038/nchembio.915
Vega, N. M., Allison, K. R., Samuels, A. N., Klempner, M. S., and Collins, J. J. (2013). Salmonella typhimurium intercepts Escherichia coli signaling to enhance antibiotic tolerance. Proc. Natl. Acad. Sci. U.S.A. 110, 14420–14425. doi: 10.1073/pnas.1308085110
Venturelli, O. S., Zuleta, I., Murray, R. M., and El-Samad, H. (2015). Population diversification in a yeast metabolic program promotes anticipation of environmental shifts. PLoS Biol. 13:e1002042. doi: 10.1371/journal.pbio.1002042
Vital, M., Chai, B., Østman, B., Cole, J., Konstantinidis, K. T., and Tiedje, J. M. (2015). Gene expression analysis of E. coli strains provides insights into the role of gene regulation in diversification. ISME J. 9, 1130–1140. doi: 10.1038/ismej.2014.204
Weart, R. B., Lee, A. H., Chien, A. C., Haeusser, D. P., Hill, N. S., and Levin, P. A. (2007). A metabolic sensor governing cell size in bacteria. Cell 130, 335–347. doi: 10.1016/j.cell.2007.05.043
Weber, H., Polen, T., Heuveling, J., Wendisch, V. F., and Hengge, R. (2005). Genome-wide analysis of the general stress response network in Escherichia coli: σ S -dependent genes, promoters, and sigma factor selectivity. J. Bacteriol. 187, 1591–1603. doi: 10.1128/JB.187.5.1591-1603.2005
Wu, N., He, L., Cui, P., Wang, W., Yuan, Y., Liu, S., et al. (2015). Ranking of persister genes in the same Escherichia coli genetic background demonstrates varying importance of individual persister genes in tolerance to different antibiotics. Front. Microbiol. 6:1003. doi: 10.3389/fmicb.2015.01003
Yao, Z., Davis, R. M., Kishony, R., Kahne, D., and Ruiz, N. (2012). Regulation of cell size in response to nutrient availability by fatty acid biosynthesis in Escherichia coli. Proc. Natl. Acad. Sci. U.S.A. 109, E2561–E2568. doi: 10.1073/pnas.1209742109
Keywords: phenotypic heterogeneity, Escherichia coli, persisters, metabolism, bacterial physiology, antibiotics, gene-expression profiling, KEGG pathways
Citation: Smith A, Kaczmar A, Bamford RA, Smith C, Frustaci S, Kovacs-Simon A, O’Neill P, Moore K, Paszkiewicz K, Titball RW and Pagliara S (2018) The Culture Environment Influences Both Gene Regulation and Phenotypic Heterogeneity in Escherichia coli. Front. Microbiol. 9:1739. doi: 10.3389/fmicb.2018.01739
Received: 11 March 2018; Accepted: 11 July 2018;
Published: 15 August 2018.
Edited by:
Daniela De Biase, Sapienza Università di Roma, ItalyReviewed by:
Bei-Wen Ying, University of Tsukuba, JapanPeter Adrian Lund, University of Birmingham, United Kingdom
Copyright © 2018 Smith, Kaczmar, Bamford, Smith, Frustaci, Kovacs-Simon, O’Neill, Moore, Paszkiewicz, Titball and Pagliara. This is an open-access article distributed under the terms of the Creative Commons Attribution License (CC BY). The use, distribution or reproduction in other forums is permitted, provided the original author(s) and the copyright owner(s) are credited and that the original publication in this journal is cited, in accordance with accepted academic practice. No use, distribution or reproduction is permitted which does not comply with these terms.
*Correspondence: Stefano Pagliara, s.pagliara@exeter.ac.uk