 Alma Botas1,2
 Rosario Pérez-Redondo2
 Antonio Rodríguez-García1,2
 Rubén Álvarez-Álvarez1
 Paula Yagüe3
 Angel Manteca3
 Paloma Liras1*
- 1Área de Microbiología, Departamento de Biología Molecular, Universidad de León, León, Spain
- 2Instituto de Biotecnología de León, León, Spain
- 3Área de Microbiología, Departamento de Biología Funcional e IUOPA, Universidad de Oviedo, Oviedo, Spain
ArgR is a well-characterized transcriptional repressor controlling the expression of arginine and pyrimidine biosynthetic genes in bacteria. In this work, the biological role of Streptomyces coelicolor ArgR was analyzed by comparing the transcriptomes of S. coelicolor ΔargR and its parental strain, S. coelicolor M145, at five different times over a 66-h period. The effect of S. coelicolor ArgR was more widespread than that of the orthologous protein of Escherichia coli, affecting the expression of 1544 genes along the microarray time series. This S. coelicolor regulator repressed the expression of arginine and pyrimidine biosynthetic genes, but it also modulated the expression of genes not previously described to be regulated by ArgR: genes involved in nitrogen metabolism and nitrate utilization; the act, red, and cpk genes for antibiotic production; genes for the synthesis of the osmotic stress protector ectoine; genes related to hydrophobic cover formation and sporulation (chaplins, rodlins, ramR, and whi genes); all the cwg genes encoding proteins for glycan cell wall biosynthesis; and genes involved in gas vesicle formation. Many of these genes contain ARG boxes for ArgR binding. ArgR binding to seven new ARG boxes, located upstream or near the ectA-ectB, afsS, afsR, glnR, and redH genes, was tested by DNA band-shift assays. These data and those of previously assayed fragments permitted the construction of an improved model of the ArgR binding site. Interestingly, the overexpression of sporulation genes observed in the ΔargR mutant in our culture conditions correlated with a sporulation-like process, an uncommon phenotype.
Introduction
Biosynthesis of amino acids is regulated in microorganisms when these nutrients are abundant in the culture medium. ArgR first described in Escherichia coli is the model for the ArgR repressor superfamily; this transcriptional regulator, in response to the presence of arginine, represses the expression of arginine biosynthesis genes using arginine as a co-repressor and decreases the activity of arginine biosynthesis enzymes (Maas, 1994). A similar effect was found for pyrimidine biosynthesis. The ArgR protein is widely distributed in bacteria, acting mostly as a repressor of genes for arginine uptake and biosynthesis (Cunin et al., 1983) but may also act as an activator, as in the aot operon for arginine and ornithine uptake in Pseudomonas (Nishijyo et al., 1998; Lu et al., 2004). It is an essential accessory protein in the site-specific resolution of ColE1 oligomers in E. coli (Stirling et al., 1988).
In gram-positive bacteria, the control of arginine and pyrimidine biosynthesis in Lactococcus lactis (Larsen et al., 2008) and the repression of the corynebacteria argCJBDFR operon by ArgR are well documented (Yim et al., 2011). L-arginine has been overproduced in a corynebacteria industrial strain by increasing the copy number of the arginine operon genes in an ArgR-defective mutant (Xu et al., 2012). The Bacillus AhrC repressor, homologous to ArgR, represses the argCAEBD-cpa-argF gene cluster in the presence of arginine (Smith et al., 1989) and activates arginine catabolism genes in cooperation with the RocR activator (Gardan et al., 1997).
In Streptomyces coelicolor and Streptomyces clavuligerus, a repression system of the arginine biosynthesis genes homologous to those of other bacteria has been described (Soutar and Baumberg, 1996; Rodríguez-García et al., 1997). The effect of arginine as the ArgR co-repressor is weak in Streptomyces, and high levels of this amino acid are required to observe repression of arginine biosynthesis genes or a decrease in arginine biosynthesis enzyme activities (Rodríguez-García et al., 1997). Arginine, when added to S. coelicolor cultures at 25 mM, only affected the expression of 27 arginine-related genes (0.35% of the genome; Pérez-Redondo et al., 2012).
The crystallized hexameric ArgR repressor of E. coli is formed by two trimers (van Duyne et al., 1996). It has been demonstrated to interact with the operator region of argF (Grandori et al., 1995) by binding specific DNA sequences known as ARG boxes. A standard ARG box in E. coli is formed by two 18-bp sequences separated by 3 bp and is located close to the promoters of ArgR-controlled genes (Tian et al., 1992). In E. coli, ArgR binding to the ARG boxes strictly depends on L-arginine as the co-repressor (van Duyne et al., 1996). In corynebacteria, the ArgR C-terminal end contains a conserved GTIAGDDTL/I oligomerization domain (amino acids 146–154 in S. coelicolor ArgR), which has been demonstrated to be essential for arginine binding (Yim et al., 2011). ArgR proteins in Bacillus (Dion et al., 1997) show lower specificity and dependency on L-arginine as co-repressor, exhibit an equilibrium trimer-hexamer and bind to ARG boxes normally separated by 2 bp (Song et al., 2002).
DNase I footprinting and electrophoresis mobility shift assay experiments analyzing the binding of B. subtilis AhrC to the argCJBDR operon of S. clavuligerus and the binding of ArgR to the S. coelicolor arginine biosynthesis genes (argC, argG, arcB, and argH) revealed the presence of ARG boxes arranged as two 20-bp contiguous sequences in these actinomycetes (Rodríguez-García et al., 1997; Pérez-Redondo et al., 2012; Botas, 2013), as in the Bacillus system (Dion et al., 1997; Song et al., 2002).
Pérez-Redondo et al. (2012) studied the S. coelicolor transcriptome at a single developmental time-point (32 h), identifying 459 genes regulated by ArgR. These genes were involved in purine and pyrimidine biosynthesis, cell morphology, and antibiotic production. In this work, we analyzed the differences between the transcriptomes of the parental strain and a ΔargR mutant at five different time-points in the culture development, which allowed us to confirm the previous results and significantly increase the number of ArgR-controlled genes at other time points and ratify the significance of data obtained in the single developmental point from previous experiments (Pérez-Redondo et al., 2012). Novel DNA binding experiments enabled the location and characterization of new functional ARG boxes and redefinition of the ARG box model in S. coelicolor. A bioinformatic search was performed to locate additional putative ARG boxes that could explain the regulatory role of the ArgR protein. In addition, a sporulation-like phenomenon in liquid culture was observed in the ΔargR mutant strain. Sporulation is unusual in S. coelicolor and has never been reported for Streptomyces argR mutants.
Materials and Methods
Strains and Culture Conditions
S. coelicolor M145 was used as a control strain (Bentley et al., 2002). S. coelicolor ΔargR derives from the former strain and is a mutant with a deletion in the argR gene (Pérez-Redondo et al., 2012). For transcriptomic studies, S. coelicolor strains were inoculated in a defined MG medium containing 50 g/l starch, 12 mM glutamic acid as the only nitrogen source, 2.5 mM phosphate and salts (Doull and Vining, 1989; Pérez-Redondo et al., 2012), using 108 spores stored in glycerol at −80°C. The cultures were grown at 30°C and 300 rpm in triplicate in 500-ml baffled flasks containing 100 ml of medium. Actinorhodin and undecylprodigiosin were spectrophotometrically determined at 640 and 530 nm, respectively, as previously described (Kieser et al., 2000). Dry weight was determined in culture samples (2 ml) washed twice with deionized-ultrapure water and dried for 80 h at 60°C. Growth was similar for both strains (not shown).
RNA Isolation, Microarray Hybridization, and Transcriptomic Data Analysis
Samples from three independent S. coelicolor M145 and S. coelicolor ΔargR cultures were taken at five time points: 32, 42 (exponential phase start and end) 49, 56, and 66 h (stationary phase). RNA samples with RIN values above 8.5 (2100 Bioanalyzer, Agilent) were employed. Cy5-gDNA and Cy3-cDNA labeling, hybridization in the Sco-Chip2-v2 microarrays (Oxford Gene Technology), washing, scanning, and signal quantification were performed as indicated in Yagüe et al. (2014). Fluorescence intensities were processed and normalized using the limma package (Smyth, 2004) in the R environment as indicated previously (Yagüe et al., 2014), except that quality weights were estimated for the non-control spots (43,798) of each array (Table S1). These weights were used for normalization and linear model statistics. For each gene, the normalized Mg values were calculated as the average among three replicates of the binary logarithms of the Cy3-cDNA signal divided by the Cy5-gDNA signal (log Cy3/Cy5). Probe values were previously averaged if more than one probe for a gene were present (mean of 4.6 probes per gene in the arrays). For each culture time, comparisons between the Mg values of the mutant and parental strains were the basis of the statistical results and corresponded to the Mc value (fold change). A threshold of 0.01 for the Benjamini-Hochberg adjusted p-values was used to identify significantly differentially expressed genes. This resulted in 1544 genes (out of a total of 7,721 present in the microarray), which passed the threshold in at least one comparison. Significantly differential expression profiles where identified in the time-course microarray experiment by means of maSigPro (Conesa et al., 2006) and grouped in 10 profiles. The GEO accession number for microarray data is GSE58666.
qRT-PCR
The qRT-PCR was performed in triplicate RNA samples with the oligonucleotides shown in Table S2, as previously described (López-García et al., 2010). RNA was retrotranscribed to cDNA using random primers and the Invitrogen SuperScript III commercial kit. Amplification and quantification of DNA by qRT-PCR was performed using a StepOnePlus thermocycler using SYBR Green PCR Master Mix (both from Applied Biosystems). The baseline and threshold cycle determination was performed using Sequence Detection Software (Applied Biosystems).
The reactions were prepared in a final volume of 20 μl. A template of 2 μl of undiluted (or 2- to 10-fold diluted) cDNA was used to give Ct detection between cycles 15 and 25. The final concentration of 300 μM oligonucleotides increased the highest amplification of the specific product at a lower Ct without primer dimer formation. The RNA was confirmed to be free of DNA contamination using negative controls where template cDNA was replaced with RNA.
The relative quantification of the expression differences of a target gene between mutant and control strains was performed using the ΔΔCt method (Livak and Schmittgen, 2001). As a reference, the hrdB gene, encoding a constitutive Streptomyces sigma factor (Buttner et al., 1990), was used.
The efficiency of each oligonucleotide pair was determined by amplifying serial dilutions of genomic DNA (six different dilutions, each amplified in triplicate) and measuring the slope of the resulting line of Ct plotted against the logarithm of DNA concentration. Slope values between −3.6 and −3.1 were regarded as valid, indicating efficiencies of 90–100%, which were required to apply the ΔΔCT method.
The relative expression of a gene in the mutant strain is given by 2−ΔΔCt, where ΔΔCt indicates the difference between the ΔCt of both strains analyzed, obtained from the difference in the Ct of the target gene and the reference gene in each strain. Relative expression above 1 indicated that the analyzed gene is overexpressed in the mutant strain, while values below 1 indicate its repression.
DNA Band-Shift Studies and Structure of the ArgR Binding Site
To improve the previous model of the ArgR binding site (Pérez-Redondo et al., 2012), we used the DNA band-shift assays (EMSA, electrophoretic mobility shift assay) results for 50 DNA fragments. The conditions used were as indicated in a previous work (Pérez-Redondo et al., 2012).
In brief, ArgR protein was purified from E. coli as a Strep-tag fused protein. DNA fragments to be tested by EMSA were amplified using specific oligonucleotides (Table S2), cloned in pBluescript SK+ (Stratagene), and labeled by PCR with Universal 6-FAM oligonucleotides to obtain fluorescent probes. The DNA-protein binding reaction contained: 5 μL buffer (10 mM Tris–HCl, pH 7.4, 5 mM MgCl2, 2.5 mM CaCl2, 250 mM KCl, 0.5 mM DTT, 10 mM L-arginine, pH 7.4), poly-(dIdC) 1,3 μg/mL, glycerol 10%, 6-FAM-labeled probe 2 nM, and Strep-ArgR protein 0.8 μM in 15 μL. This mixture was incubated for 30 min at 30°C and immediately resolved in a 5% acrylamide gel using 0.5x TBE as running buffer at 50 V. Competition experiments were done with increasing amounts of unlabeled specific probe. The chromosomal sequences of the probes used for DNA binding shift are included in Table S3.
To improve the previous model of the ArgR binding site (Pérez-Redondo et al., 2012), we used the EMSA which resulted in 50 DNA fragments shifted. The chromosomal sequences of the probes used for DNA band-shift assays, obtained by PCR amplification, are included in Table S3. These sequences were chosen among those containing putative ArgR binding sites, according to the previous model. A three-step process was conducted to identify ARG boxes in the sequences of the positive probes and to build a new binding-site model. First, the MEME algorithm, available through the MEME server (Bailey et al., 2009), was used for motif discovery using two search strategies: (i) the discriminative mode, fed with both sets of positive and negative sequences and searching for palindromes 14–20 nt in length (ZOOPS option), detected a total of 25 ARG boxes in the input positive sequences and built an ARG box model 14 nt in length (named ARGNE04); (ii) the normal mode, searching for palindromes 18–20 nt in length with the ANR option, detected 14 sites among the set of positive probes and produced a model 20 nt in length (ARGNE05). Second, the sequences giving positive DNA band-shift were scanned with both the ARGNE04 and ARGNE05 models using the FIMO algorithm (Grant et al., 2011). The results were manually inspected to determine the most likely binding site(s) in each positive sequence, in terms of sequence conservation, location relative to the translation start site of the regulated gene, and the presence of a unique ARG box or two tandemly arranged ARG boxes (Table 1). Third, 37 ARG boxes were well-conserved sequences that were selected among the 44 boxes identified in the previous analysis and used to build the final model using information theory algorithms (Schneider, 1997).
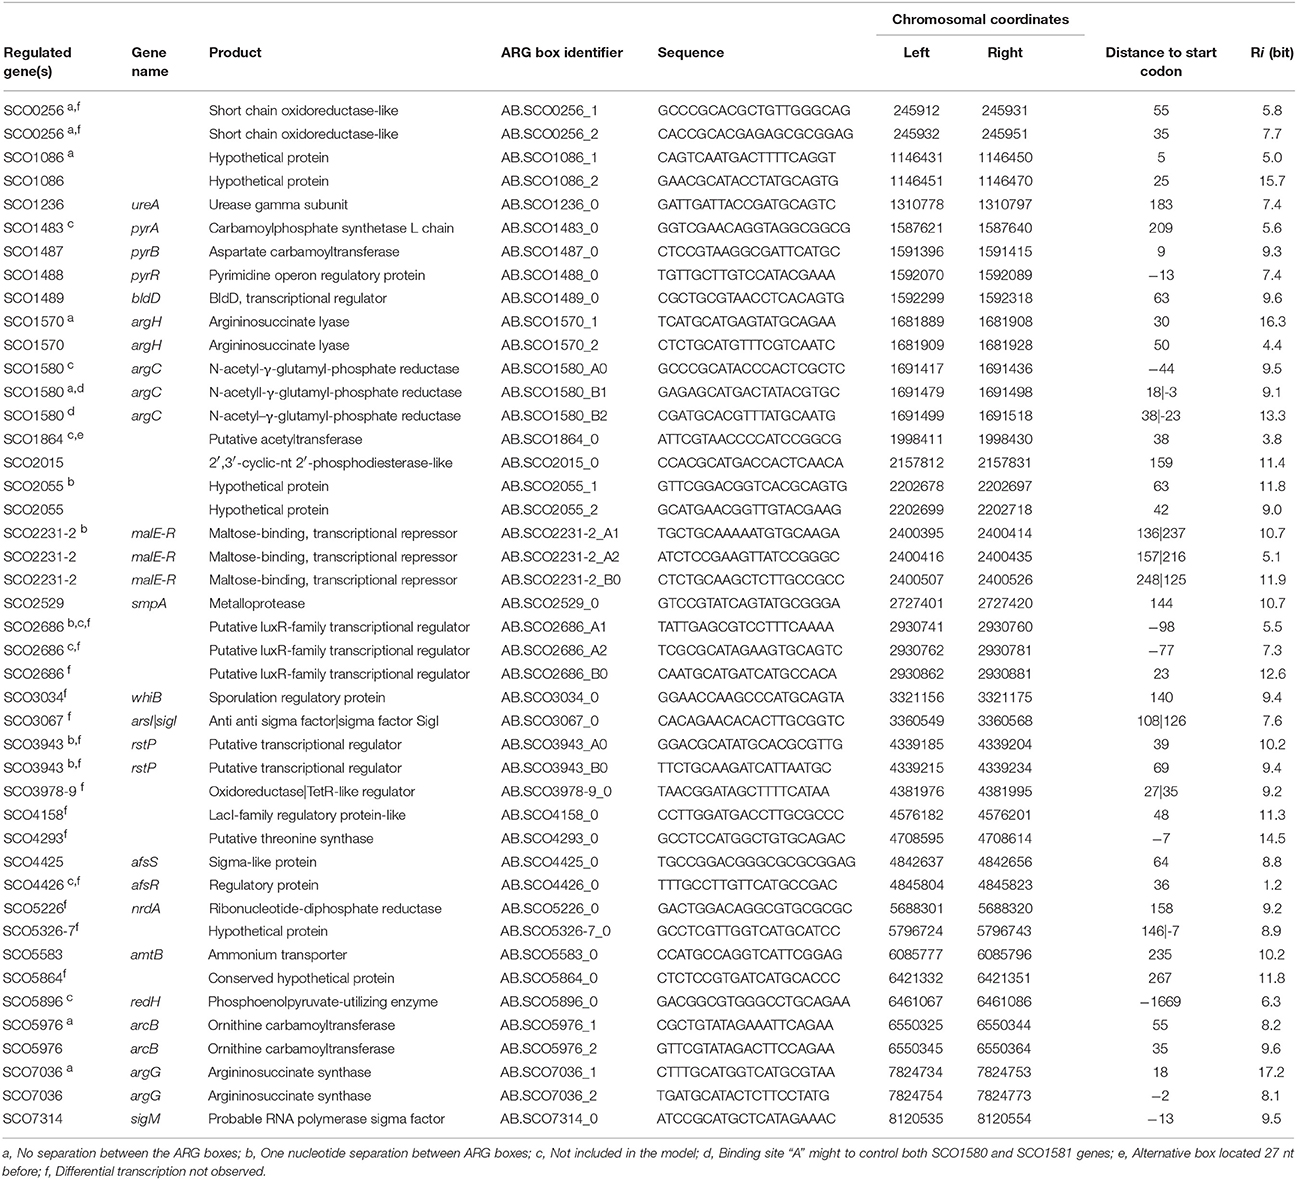
Table 1. ARG boxes detected in DNA fragments bound by ArgR in DNA band-shift assays.
Viability Stain
Culture samples were obtained and processed for microscopy at different incubation time-points, as previously described (Manteca et al., 2007, 2008). To detect the dead cell population, the cells were stained with the cell-impermeant nucleic acid stain propidium iodide (PI), which only penetrates bacteria with damaged membranes. In addition, SYTO 9 green fluorescent nucleic acid stain, which labels all cells (LIVE/DEAD BacLight Bacterial Viability Kit, Invitrogen) was used to detect viable cells. In the presence of both stains, bacteria with intact cell membranes appeared to fluoresce green, whereas bacteria with damaged membranes appear red. After being left to sit at least 10 min in the dark, the samples were examined under a Leica TCS-SP2-AOBS confocal laser-scanning microscope at a wavelength of either 488 or 568 nm excitation and 530 nm (green) or 630 nm (red) emission, respectively (optical sections ~0.2 μm). Images were mixed using Leica Confocal Software. In some cases, samples were also examined in differential interference contrast mode using the same equipment.
Images were processed with ImageJ. Compartmentalized hyphae were counted using the cell counter plugin (https://imagej.nih.gov/ij/plugins/cell-counter.html). The percentage of hyphae suffering segmentation (sporulation-like) was estimated by counting 727 hyphae among numerous pictures, and two different biological replicates, visualized independently in the same focal plane. The average segment length was estimated from 226 measurements (Figure S1).
Results
Construction of a New Model to Analyse ArgR Binding in S. coelicolor
Previous footprinting, EMSA and in vivo luciferase-fused sequence data demonstrated ArgR binding to several gene promoters (Rodríguez-García et al., 1997; Pérez-Redondo et al., 2012). ArgR binding sites (ARG boxes) are imperfect palindromes up to 20 nt in length (two turns of the DNA helix). Most evident ArgR binding sites were identified in the arginine biosynthesis promoters of S. clavuligerus (Rodríguez-García et al., 1997) and S. coelicolor (Pérez-Redondo et al., 2012). All binding sites are composed of two contiguous ARG boxes, although DNA band-shift studies showed ArgR binding sites, formed by a unique ARG box (Pérez-Redondo et al., 2012). A bioinformatics model of the S. coelicolor ARG box was built according to these sequences (Pérez-Redondo et al., 2012). In this work, the results of EMSA with 50 DNA fragments (27 previously published) were used to build an improved model of the ArgR binding site. Of these 50 fragments assayed, 30 yielded mobility shifts, and 20 fragments failed to show ArgR binding (Table S3). Seven novel positive fragments correspond to the intergenic regions of SCO0255-SCO0256 and SCO1863-SCO1864 (ectA-ectB) genes, to the upstream regions of SCO4425 (afsS) and SCO4426 (afsR) genes, and to the coding regions of SCO4159 (glnR), SCO5326 and SCO5896 (redH). All the experimental data described in Materials and Methods allowed that a new model of the ARG box was built (Figure 1). The total conservation of this model is Rsequence = 9.9 bits, and the Ri value of the consensus sequence is 20.9 bits.
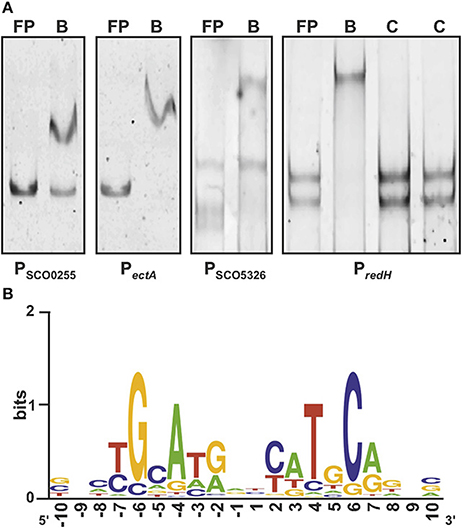
Figure 1. DNA band-shift assays of new ARG boxes and Sequence Logo. (A) ArgR binding analysis of DNA fragments containing ARG boxes. Free probe (FP), binding reaction (B), competition reactions with non labeled probe (C). In all cases competition reactions were made to determine the binding specificity, however it is only shown the competition for the redH binding assay (amount of competitor in the reactions: 9.5 and 19x, left and right, respectively). Assays were performed on intergenic regions of SCO0255-SCO0256 and SCO1863-1864 (ectA) and coding regions of SCO5326 and SCO5896 (redH). (B) Sequence logo of ARGNE06 model. Letter height is proportional to the base frequency in aligned sequences used to build the model, and letter stack height is conservation in bits at that position.
The new model was used to analyse the ArgR binding sites present in the DNA fragments giving positive EMSA. A total of 44 ARG functional boxes were identified, showing various conservation values (Table 1). These ARG boxes were arranged into three types of binding sites: (1) typical binding sites formed by two contiguous ARG boxes, such as those of arg genes; (2) binding sites formed by two tandem ARG boxes but separated by one nucleotide; and (3) binding sites formed by a single ARG box. In the promoter of the rstP gene, there are two possible ARG boxes separated by 10 nucleotides. It is possible that both boxes form a single binding site or constitute two independent sites.
To identify ARG boxes in the genes transcriptionally affected by the lack of ArgR (see below), a bioinformatic search was conducted in the S. coelicolor chromosome. The list of predicted ArgR binding sites was filtered by probability (p-value < 10−5) and information content (Ri > 10.0 bit) (Table S4A). The 315 ArgR putative sites shown control 221 differentially expressed genes, at either the gene located downstream of the ARG site or the next. In addition, many ArgR binding sites with lower probability were identified, some of which were related to differentially transcribed genes; some are shown in Table S4B. The functionality of most of these ARG boxes remains to be validated.
Transcriptomic Studies of S. coelicolor M145 and S. coelicolor ΔargR
Gene expression was analyzed in MG liquid cultures of S. coelicolor M145 and S. coelicolor ΔargR, employing three biological replicates at five time points. A total of 1544 genes (~20% of the S. coelicolor genome) showed differences in expression (signification level p < 0.01) in at least one of the 5 time points analyzed. These transcripts corresponded to the genes involved in amino acid metabolism (75 genes), purine and pyrimidine metabolism (31 genes), nitrogen and phosphate control (20 genes), DNA repair and recombination (25 genes), structure and morphology (78 genes), secondary metabolism (74 genes), coenzyme biosynthesis (13 genes), two-component systems (57 genes), regulators and sigma factors (106 genes), or membrane protein-encoding genes (160 genes). Many genes were related to protein secretion or had unknown functions (767 genes), and others were unclassified genes (138) (Table S5). The differentially expressed genes in the control strain and ΔargR mutant were fitted into ten prototypical expression patterns (Figure 2). ArgR behaves mainly as a repressor (profiles 1, 2, 3, and 4) but can also be a weak activator (profiles 5, 6, 7, and 8), and few genes showed either repression or activation at various growth times (profiles 9 and 10). It has to be noted that 50% of the genes did not fit any of the 10 maSigPro profiles. Only 45 of the 7,721 genes scanned were deregulated at all times.
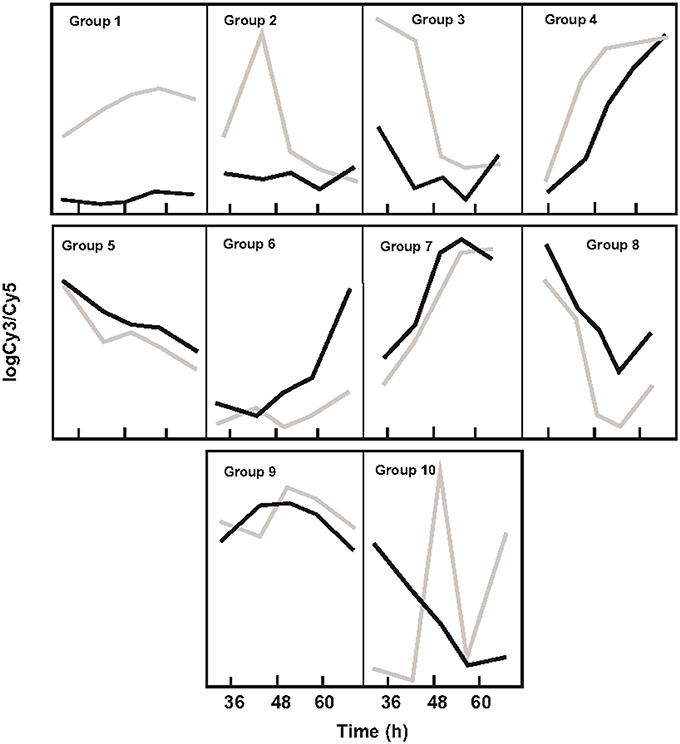
Figure 2. Clustering of gene expression profiles in S. coelicolor M145 and S. coelicolor ΔargR. S. coelicolor M145 gene expression is indicated by black lines; expression of S. coelicolor ΔargR gene is indicated by gray lines. Clustering was obtained using maSigPro Program.
Genes Related to Amino Acids and Pyrimidine Biosynthesis
The genes most affected by the absence of ArgR were those involved in arginine biosynthesis (Figure 3A). They were overexpressed in the ΔargR mutant, in agreement with previous observations for type II ArgR repressors (Tian et al., 1992). Fold changes (or Mc values) for these transcripts oscillated between 7- and 38-fold upregulation in the mutant, and argC was the most upregulated gene (Table S5). Conserved ARG boxes were located upstream of argC, argH, argR, arcB, and in the intergenic argG-gabD bidirectional promoter region (Pérez-Redondo et al., 2012; Table 1). Amino acid biosynthesis genes, such as hppD (SCO2927) and glyA3 (SCO5364) involved in glycine-serine-threonine metabolism or gabD (SCO7035) encoding a succinate semialdehyde dehydrogenase, were upregulated in the ΔargR mutant (Table S5). Especially remarkable was the effect on gene SCO1086, encoding a protein with a transglutaminase domain (125-fold upregulation) (Table S5).

Figure 3. Expression profile of different genes in S. coelicolor M145 and S. coelicolor ΔargR. (A) Arginine biosynthesis genes. Profiles of argB, argC, argD, argJ, and argR are shown. Mg values for argR probe in mutant strain correspond to a nonexistent argR gene, and, thus serve to assess Mg values reflecting lack of expression. (B) Pyrimidine biosynthesis genes. Only pyrAa, pyrA, pyrB, and SCO1485 are shown as a model. (C) Profile of glnII amtB, glnK, and glnD as model of nitrogen metabolism genes. (D) Expression profile of nar3 genes. S. coelicolor M145 genes (black lines) and S. coelicolor ΔargR genes (gray lines).
Genes for pyrimidine biosynthesis were highly upregulated in the ΔargR strain, with fold changes close to 4.0; pyrB and pyrR were the most upregulated genes (Figure 3B; Table S5). Conserved ARG boxes are present upstream of pyrB, pyrA, pyrD, and pyrR (Table 1), and some were already confirmed to be bound by ArgR in vitro (Pérez-Redondo et al., 2012). The ribonucleotide reductases, forming deoxyribonucleotides in an oxygen-dependent (nrdABS) or oxygen-independent (nrdRJ) manner, were upregulated by the absence of ArgR but only at the early exponential growth phase (32 h) (Pérez-Redondo et al., 2012). The same was true for the cobB and cobQ genes required for cobalamin B12 formation, a cofactor controlling nrdABS transcription (Table S5).
Genes Related to Nitrogen Metabolism
The expression of nitrogen metabolism genes (glnII, glnA, amtB, glnK, and glnD) in S. coelicolor M145 is shown in Figure 3C. These genes showed high expression at early times, moderate expression between 42 and 56 h, and another increase at the end of the culture. This pattern does not clearly fit any of the profiles shown in Figure 2. The ΔargR mutant displayed expression similar to the control strain between 42 and 56 h of growth, but the strong upregulation at early and late times observed in the control strain did not occur in the mutant (Figure 3C).
S. coelicolor grows on nitrate as sole nitrogen source, and it possesses three gene clusters for nitrate reduction: SCO0216 to SCO0219 and SCO4947 to SCO4750, complexes 2 and 3, respectively, and SCO6532 to SCO6535 (Fischer et al., 2010). All genes encoding for the nitrate reductase complex 3 are underexpressed in the ΔargR mutant (Figure 3D), with an expression profile that fitted in group 6, as shown in Figure 2. Functional ARG boxes are present upstream of amtB (Pérez-Redondo et al., 2012) and in the 3′ region of SCO4159, glnR (Table 1).
Membrane and Secretion Proteins
Approximately 150 genes encoding proteins related to secretion and 160 genes for membrane proteins were up- or down-regulated in expression compared to the parental and the ΔargR strains (Table S5). Some of these genes were strongly underexpressed (SCO4251 and SCO6934) in the mutant at early or late culture times. Other genes, especially SCO0615, SCO0665, SCO6375, and SCO2704, are overexpressed in the ΔargR mutant (Table S5).
Secondary Metabolism Gene Clusters
Lack of ArgR affects the production of the pigmented antibiotics actinorhodin and undecylprodigiosin (Pérez-Redondo et al., 2012). Red and Act production in the control strain reached 6 and 50 nmol/mg dry weight and were detected at 56 and 66 h, respectively. The mutant antibiotic production was reduced to 12% (for Act) and 8% (for Red) of the levels detected in the parental strain (not shown).
All genes for actinorhodin biosynthesis (SCO5071 to SCO5092) shared the same expression profile with growth (group 6 in Figure 2). Expression of the act genes in the parental strain decreased from 32 to 42 h and increased steadily thereafter to reach a 6-fold level, whereas the genes expression in the mutant was always lower (18–55% of the level of the parental strain) and increased after 49 h to reach a final level 23% lower than that of the parental strain (Figure 4A).
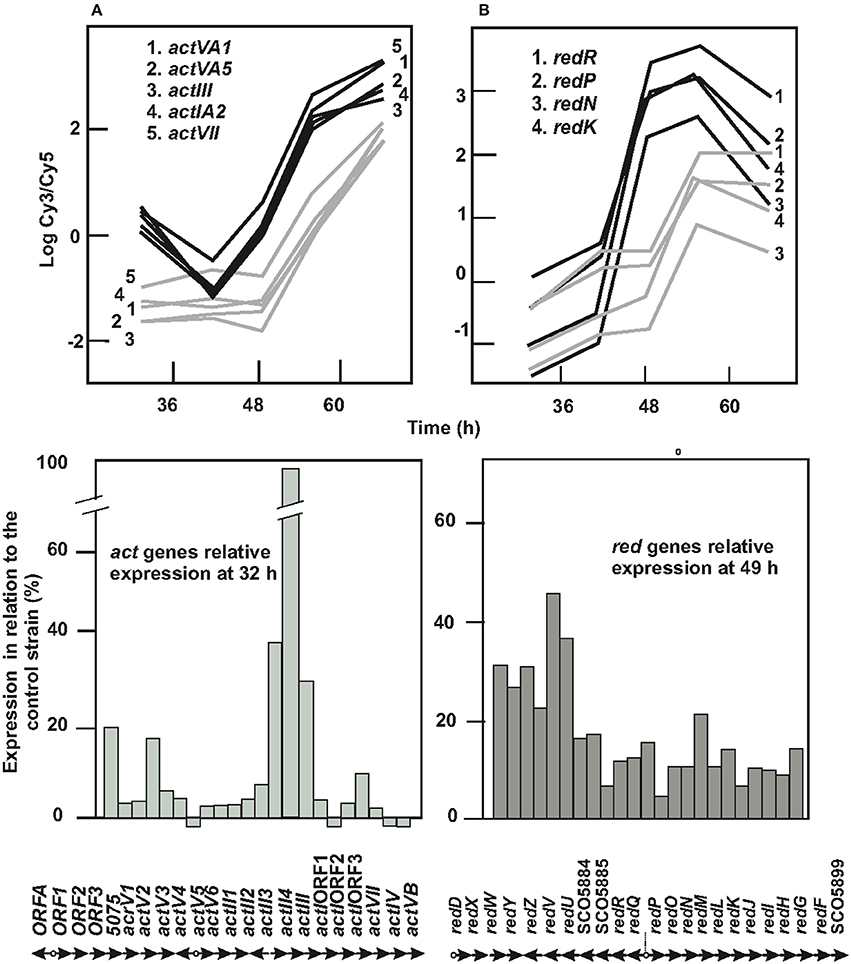
Figure 4. Expression of act and red genes in S. coelicolor M145 and S. coelicolor ΔargR. (A) Actinorhodin biosynthesis genes. Expression profile of actVA1, actVA5, actII, actIA2, and actVII are shown as model (upper left panel). In lower left panel, columns show the relative expression of each act gene in S. coelicolor ΔargR at 32 h compared to S. coelicolor M145 expression, taken as 100. The corresponding genes are indicated below. (B) Undecylprodigiosin biosynthesis genes. Expression profile of redR, redP, redN, and redK are shown as a model (upper right panel). In lower right panel columns show relative expression of each red gene in S. coelicolor ΔargR at 49 h compared to S. coelicolor M145 expression, taken as 100. The corresponding red genes are indicated below. S. coelicolor M145 genes (black lines), S. coelicolor ΔargR genes (gray lines). The time point at which the expression difference between strains of both sets of genes is maximal (32 or 49 h) have been chosen for representation in lower panels.
The 23 genes involved in undecylprodigiosin biosynthesis (SCO5877 to SCO5899) were repressed in the ΔargR mutant with respect to the control strain (Figure 4B), following a group 7 profile. As shown below, the coding sequence of redH, SCO5896, contains a functional ARG box (6.3 bits, Table 1).
Expression of the cpk gene cluster (SCO6268 to SCO6288) for the biosynthesis of the polyketide coelimycin P1 (Gomez-Escribano et al., 2012) was also altered in the ΔargR mutant. The cpk genes' expression decreased steadily in the control strain with time, while in the ΔargR mutant, the transcription increased to a maximum at the 49 h sampling time and then decreased. However, the complex transcription profile of these genes (group 10, Figure 2) suggests control mechanisms in addition to those due to ArgR. Transcription of genes located close to the cpk cluster, as for the γ-butyrolactone-receptor (scbR) and the genes involved in γ-butyrolactone synthesis (scbA, scbB), was also affected by the ΔargR deletion and showed the same expression profile 10 (Figure 2; Table S5). Genes of the act, red, and cpk clusters are putatively under the control of ARG boxes (Table S4).
Secondary metabolism genes with expression altered in the ΔargR mutant include SCO7700 and SCO7701, which are involved in methylisoborneol biosynthesis, and eshA (SCO7699), a regulator of secondary metabolism (Saito et al., 2003, 2006); all of these show the expression profile of group 2. The whiE genes (SCO5314-5320), related to the synthesis of the TW95a pigment (Kelemen et al., 1998), are strongly upregulated in the ΔargR mutant (Table S5). A less pronounced effect (group 2, Figure 2) was observed in SCO1206 to SCO1208 genes for the synthesis of the tetrahydroxynaphtalene pigment (Table S5). The geosmine biosynthesis gene SCO6073 was underexpressed in the mutant at late times (49 to 66 h, Table S5). A secondary metabolite, ectoine, confers protection against osmotic stress and stabilizes proteins at high temperature and extreme pH to the cells (Bursy et al., 2008; Kol et al., 2010). The ectoine biosynthesis gene cluster (SCO1864 to SCO1867) was weakly overexpressed (1.5 to 3-fold) in the ΔargR mutant, showing the profile of group 3 (Table S5). A DNA fragment from the SCO1863-SCO1864 intergenic region was retarded in vitro by the ArgR protein (Table 1).
Transcriptional Analysis of Genes Involved in Differentiation, Sporulation, and Gas Vesicle Formation
Clear expression differences were found in genes involved in hydrophobic cover formation (rodlins and chaplins), sporulation (ram, whi), cell wall glycan biosynthesis (cwg) and gas vesicle formation (gvp) (Table 2).
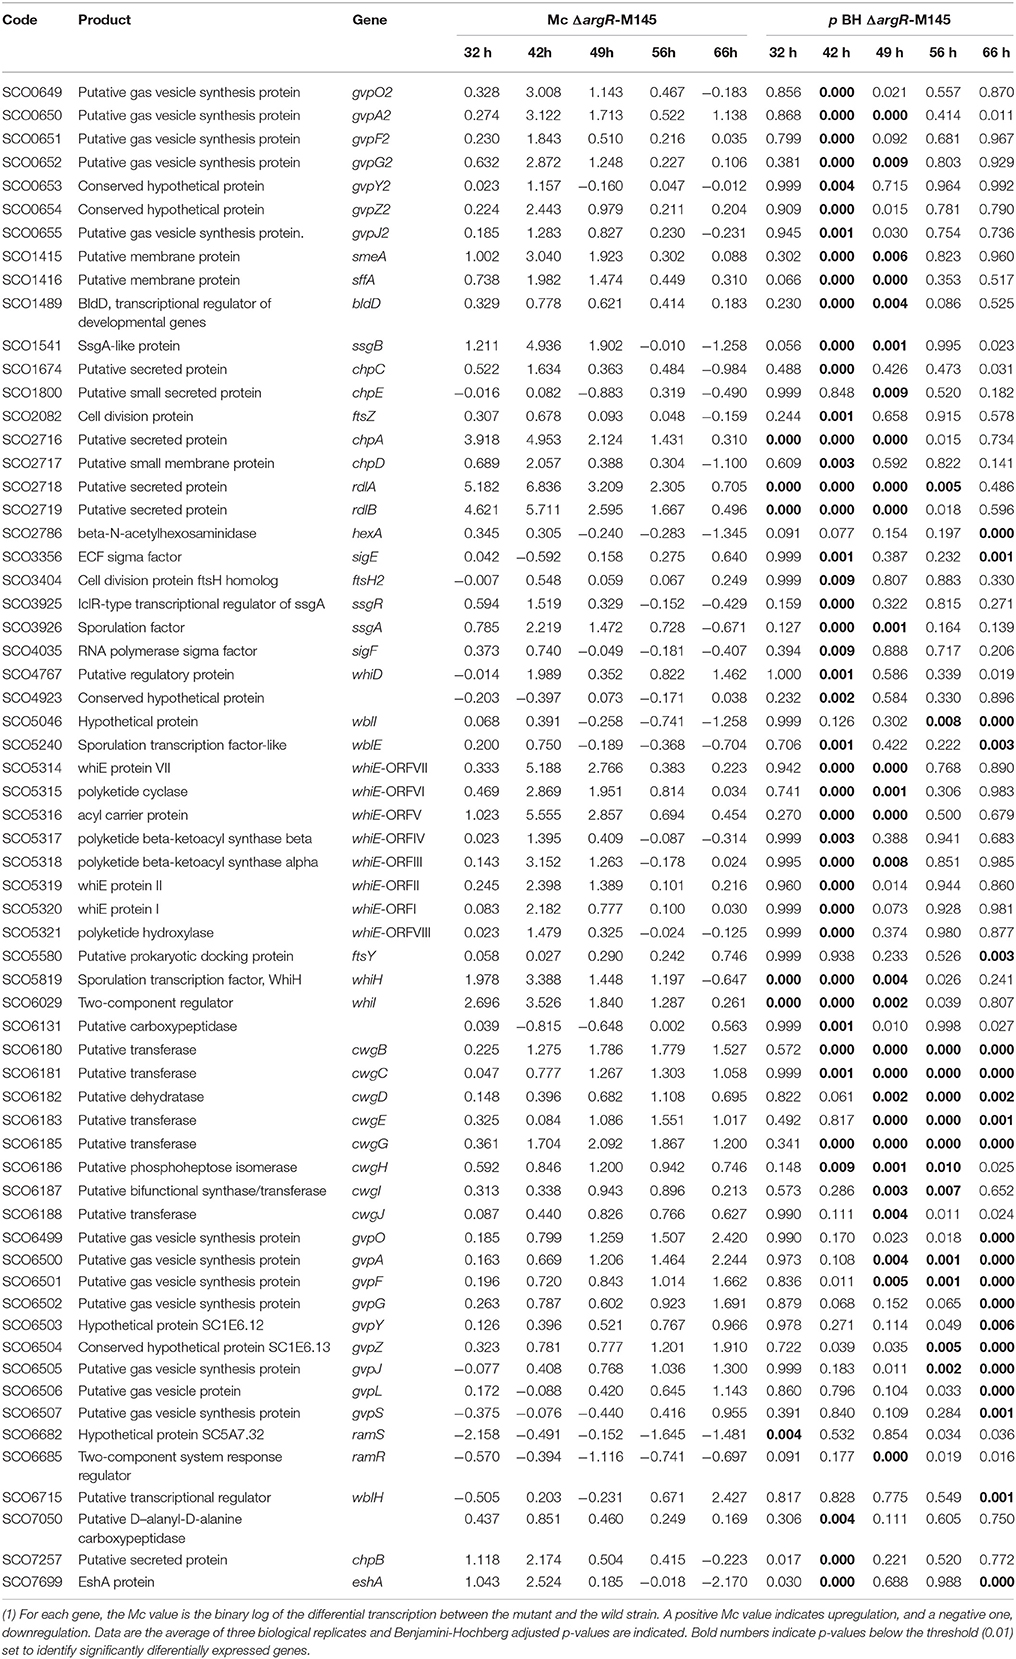
Table 2. Genes related to morphology differentially expressed in S. coelicolor M145 and S. coelicolor ΔargR (1).
Genes for Rodlins and Chaplins
The rodlet layer formed by chaplins and rodlins (Claessen et al., 2004) is partially responsible for the hydrophobicity in aerial hyphae and spores. The genes encoding chaplins (chpA, chpB, chpC, chpD, and chpG) and rodlins (rdlA and rdlB) were upregulated in the ΔargR mutant. This overexpression was particularly high in the exponential growth phase (Table 2). The chpA, rdlB, and rdlA gene expression increased 30-, 52-, and 114-fold, respectively, at 42 h (Figure 5, upper panels), while chpC and chpB were less affected (4.5-fold increase, Table 2).
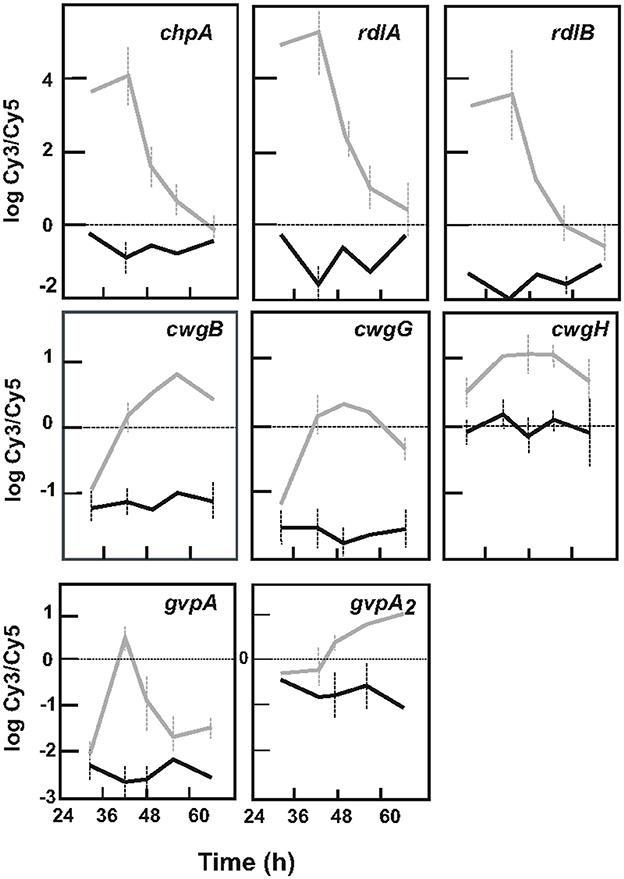
Figure 5. Expression of genes related to differentiation in S. coelicolor M145 and S. coelicolor ΔargR. (Upper panels) Expression profile of genes encoding chaplins (chpA as model) and rodlins (rdlA, rdlB). (Middle panels) Expression profile of cwg genes. Expression of cwgB, cwgG, and cwgH are shown as model. (Lower panels) Expression of genes for gas vesicles: gvpA and gvpA2 are shown as model of genes for gas vesicle clusters I and II. S. coelicolor M145 genes (black lines), S. coelicolor ΔargR genes (gray lines). Standard deviation is represented by discontinuous bars.
Cwg Genes
The cwg cluster (SCO6179 to SCO6190) is tentatively involved in glycan cell wall synthesis (Hong et al., 2002). All cwg genes were overexpressed (1.3 to 4.3-fold) in the ΔargR mutant (Figure 5, middle panels).
Genes for Gas Vesicles
Two independent gene clusters involved in gas vesicle formation (gvp genes) were present in the S. coelicolor M145 genome. Both clusters showed low and relatively constant expression along the developmental time course in the control strain. However, in cultures of S. coelicolor ΔargR, all gvp genes were overexpressed. Cluster I gene expression (SCO0649-SCO0657) slowly increased and peaked at 42 h, as shown for the model gene gvpA (Figure 5, lower left panel). Transcription for genes in cluster II (SCO6499-SCO6508) increased along with time in the mutant, showing 2- to 4-fold higher expression than in the control strain in the stationary phase; as a prototype gene of cluster II, gvpA2 expression is shown in Figure 5 (right lower panel).
Genes Related to Spore Formation and Differentiation
All whi genes were involved in sporulation and aerial hyphae formation (Davis and Chater, 1992), with the exception of whiJ and whiA, which were significantly upregulated by the absence of ArgR (Table 2). The whiD, whiI, and whiH genes (Figure 6, upper panels) and the eight whiE genes (orfI to orfVIII), which are involved in the formation of the spore pigment (Kelemen et al., 1998) (Figure 6, lower panels), were most overexpressed in the mutant. The ARG box located in the whiB promoter region (Ri 9.4 bits, Table 1) was demonstrated to bind ArgR in previous DNA band-shift studies (Pérez-Redondo et al., 2012), and several whi genes are under the predicted control of ARG boxes (Table S4).
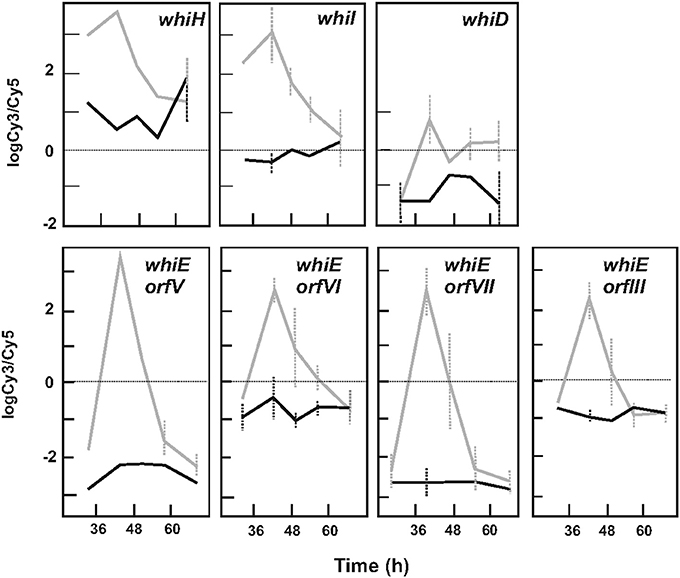
Figure 6. Expression profile of whi genes in S. coelicolor M145 and S. coelicolor ΔargR. (Upper panels) Expression of whiH, whiI, and whiD genes. (Lower panels) Expression of whiE cluster genes. The whiE-orfV, orfVI, orfVII, and orfIII are shown as models. S. coelicolor M145 genes (black lines), S. coelicolor ΔargR genes (gray lines). Standard deviation is represented by discontinuous bars.
The ramR gene, which encodes an orphan response regulator related to the SapB peptide and aerial mycelium formation (San Paolo et al., 2006), was weakly down-regulated in the ΔargR mutant (Table S5). The transcription of genes for key sporulation regulatory proteins, such as ssgR, ssgA, ssgB, and smeA-sffA (van Wezel et al., 2000a; Traag et al., 2004; Ausmees et al., 2007; Willemse et al., 2011), were all upregulated in the mutant (Table 2).
Other genes related to morphological differentiation had smaller, but significant, differences in expression between the parental and ΔargR mutant strains. These were the developmental transcriptional regulator bldD (Elliot et al., 2001), which presents functional ARG boxes upstream of its coding sequence (Pérez-Redondo et al., 2012); wblH, a target of WhiA (Bush et al., 2013); and ftsZ, a key protein of cell division (van Wezel et al., 2000b; Bush et al., 2013). All weakly increased w their expression at the first three sampling times (Table S5). Also upregulated in the ΔargR mutant were hexA, encoding for an N-acetylhexosaminidase involved in glycan degradation (Mark et al., 1998); SCO4923, putatively involved in septum formation; SCO7050, for a D,D-carboxypeptidase-like protein; and SCO7699, reported to be involved in sporulation (Table 2).
Analysis of S. coelicolor M145 and ΔargR Mutant Differentiation
The mycelium from liquid cultures of the ΔargR mutant showed a dark, brownish pigment, which was not observed in the S. coelicolor M145 mycelium (compare Figure 7A with Figure 7E). Morphological differentiation was analyzed in liquid cultures using confocal microscopy. The most important difference between S. coelicolor M145 and the ΔargR mutant was the presence of nucleoid segregation (Figure 7G), and the formation of round segments (Figure 7H) with an average length of 0.9 μm ± 0.1 in the ΔargR mutant, resembling the segmentation observed during sporulation in solid cultures. Hypha segmentation began at 27 h of culture and affected 4.3% ± 0.1 of the hyphae (Figure S1).
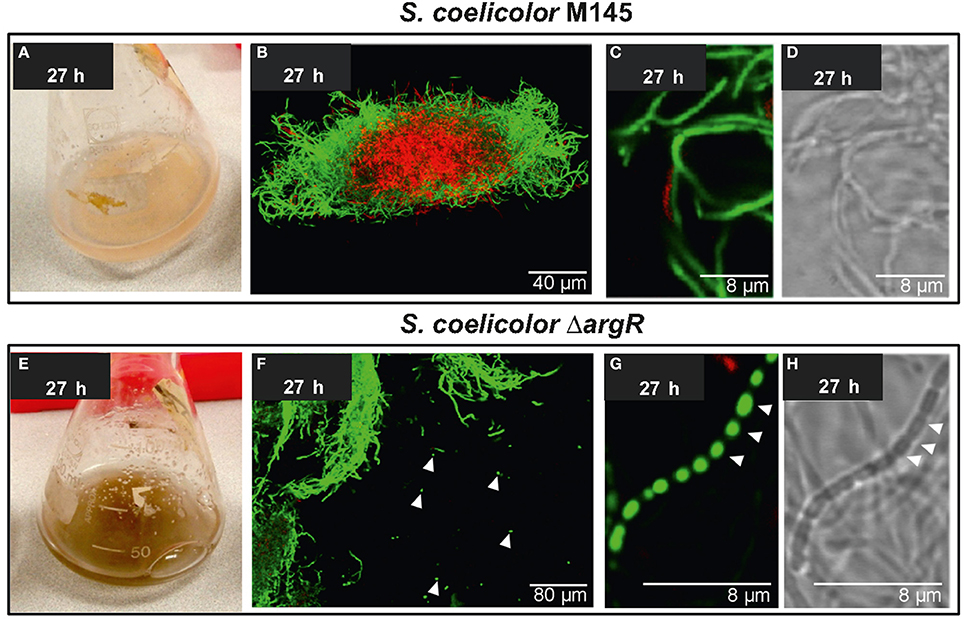
Figure 7. Analysis of differentiation of S. coelicolor M145 and S. coelicolor ΔargR. Streptomyces coelicolor M145 (upper panels) and Streptomyces coelicolor ΔargR (lower panels). (A,E) Macroscopic differences in color between control and mutant strain. (B–D, F–H) Confocal laser-scanning fluorescence microscopy analysis (SYTO9/PI staining) of strains growing in liquid MG medium. (D,H) correspond to interference contrast mode images. Arrowheads indicate spore-like structures.
Validation of Transcriptomic Data by qRT-PCR
Transcriptomic data were validated using qRT-PCR at two developmental time points for thirteen of the genes related to differentiation and secondary metabolism: whiH, rdlB, SCO1588, cwgB, chpA, whiE-orfV, gypO, pyrB, ramR, glnII, scbR, redW, and actV1 (Figure 8). The expression levels of 14 additional genes from all the expression profiles shown in Figure 1 were also validated (Figure S2). The correlation between the qRT-PCR and microarray results for the 27 genes was very good, with an R2 value of 0.926 (Figure 8), confirming the reliability of the transcriptomic data.
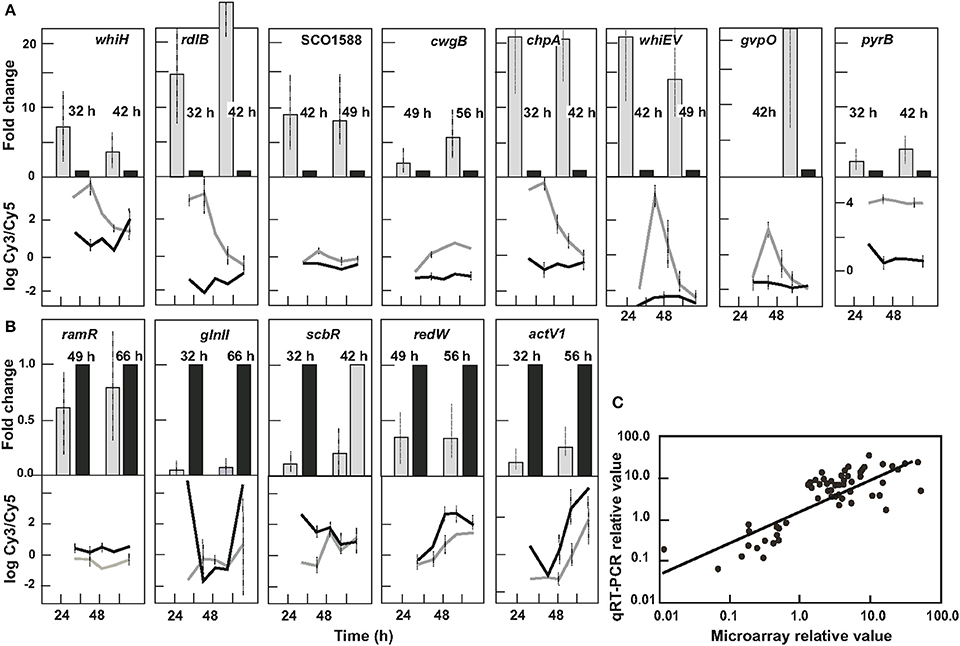
Figure 8. Validation by qRT-PCR of microarray data, corresponding to genes involved in primary metabolism, secondary metabolism, and differentiation. (A) Validation of genes overexpressed in ΔargR mutant. (B) Validation of genes underexpressed in ΔargR mutant. The expression is presented in relation to the control strain, taken as 1. Upper panel indicate gene name and culture time at which qRT-PCR was performed. Corresponding lower panel shows gene profile of the microarray study. Black bars and black lines correspond to control strain S. coelicolor M145. Gray bars and gray lanes correspond to S. coelicolor ΔargR. (C) qPCR vs. microarray: Scatter plot correlating to transcriptomic changes as measured by microarray analysis and qRT-PCR of all genes validated. R2 was 0.926.
Discussion
The differences in the transcriptomes of S. coelicolor M145 and the ΔargR mutant strain were previously studied at a single developmental time point (Pérez-Redondo et al., 2012). The current studies were extended by analyzing five different developmental stages in the culture.
The existence of ARG boxes in ArgR controlled genes suggests a modulator role of ArgR in the transcription. The information content (Ri) of the operators formed by a single ARG box, listed in Table 1, ranged from 1.2 bit (afsR) to 14.5 bit (SCO4293). The presence of one or two ARG boxes, the distance between them, the Ri value, and their location in relation to other regulatory signals, may account for different ArgR binding affinities and allow fine-tuned regulation of the expression of the controlled genes. ARG boxes were predicted in the genome using the new model (Table S4). Those sites, if functional, might account for the altered transcription in the ΔargR mutant. Alternatively, in the absence of an ArgR binding site, the regulatory role of ArgR in the expression would be indirect.
This study demonstrates that ArgR is a pleiotropic regulator, which in S. coelicolor represses more than the genes for arginine and pyrimidine biosynthesis (Cunin et al., 1983; Larsen et al., 2008). A total of 1,544 genes out of the 7,721 analyzed were significantly deregulated at least once according to the microarray experiment (Table S5). Forty-five genes were always overexpressed (e.g., at 5 time points) in the ArgR mutant (Table S5), which suggests that the ArgR protein exerts a tight control over their transcription. Most of them, 29 out of these 45 genes (64%) had the profile of group 1 (Figure 2), including the 15 genes related to arginine and pyrimidine biosynthesis. The other 16 genes did not fit any of the 10 groups determined by maSigPro. The function of many of these 29 genes is unknown, although SCO6824-SCO6827 resembles a polyketide synthesis gene cluster and sigM (SCO7314) has been reported to be involved in osmotic stress control (Lee et al., 2005). ArgR direct control over some of these 45 deregulated genes was demonstrated by binding to functional ARG boxes located upstream of SCO1086, pyrA, pyrB, pyrR, bldD, argH, argC, arcB, argG, and sigM (Table 1), and non-tested, but predicted ARG boxes could account for the control of SCO2864-SCO2869, SCO6205-SCO6206, SCO6824-SCO6827 genes (Table S4). However, most of the deregulated genes (1499) were over- or under-expressed at one, two, three or four time points, indicating a ArgR relaxed control and/or interaction with other regulators. The nitrogen metabolism genes are controlled in S. coelicolor by GlnR, the global regulator of nitrogen assimilation, by NnaR (Amin et al., 2012) and also by PhoP, the global regulator of phosphate metabolism (Rodríguez-García et al., 2009; Sola-Landa et al., 2013). We found that, in addition, some nitrogen metabolism genes (glnII, amtB, glnK, glnD) are regulated by ArgR. This was a direct effect, since expression of glnR and phoP was not affected in the ΔargR mutant. Arginine is a nitrogen-rich storage compound in many organisms (Llácer et al., 2008), and the discovery of ArgR binding-ARG boxes (Pérez-Redondo et al., 2012) in the glnR and amtB genes, supports a direct regulatory role for ArgR in nitrogen metabolism.
A similar situation occurs in cell wall biosynthesis genes (cwg), which were upregulated in the ΔargR mutant. The cwg genes were predicted to be transcribed from the cwgA upstream promoter, which is controlled by SigE (Hong et al., 2002) in response to the signal transmitted by the two component system CseC-CseB (Paget et al., 1999). Our results suggest an additional ArgR regulation of cwg genes. Expression of genes for secondary metabolite biosynthesis was also altered in the ΔargR mutant. The act and red genes were repressed, and genes for the TW95a pigment, and coelymicin were overexpressed. The genes for ectoine biosynthesis, controlled by GlnR (Shao et al., 2015), were overexpressed at all time points.
In S. coelicolor the gvp genes for a putative regulator and gas vesicle structural proteins are located in two duplicated clusters. These gas-filled vesicles are required in aquatic organisms for flotation, but have never been found in soil-dwelling bacteria and the presence of these gene clusters (Offner et al., 1998) is surprising. In fact, disruption of the gvp gene clusters does not affect the buoyancy of Streptomyces cells in liquid cultures (van Keulen et al., 2005). An induction of gvp genes was found following exposure to high concentrations of salt, and it has been proposed that gas vesicles may counteract hyperosmotic stress. The expression of both S. coelicolor gvp clusters was upregulated in the ΔargR strain. The Gvp proteins have a very high content of arginine, glutamate, and proline, up to 42% of the protein total amino acids in GvpA2, and might have evolved in soil Actinobacteria as nitrogen storage material, which might explain the ArgR control on their biosynthesis.
Some putative ArgR binding sequences were found in these differentially expressed genes, including ARG boxes located in coding regions. The presence of binding sequences for regulatory proteins in coding sequences is not unusual; in a study of the PHO regulon in S. coelicolor, almost 70% of the PhoP-chromatin-immunoprecipitated enriched fragments, and ~50% of the bioinformatically located PHO boxes, were located in coding sequences (Allenby et al., 2012).
DNA band-shift studies using ArgR protein identified 24 regions containing ARG boxes (Pérez-Redondo et al., 2012). Here, we show additional DNA fragments bound by ArgR in vitro (Figure 1A). However, other DNA fragments tested with putative ARG boxes showed no band retardation on EMSA (Table S3). The lack of binding in sequences putatively involved in regulation is not rare. The presence of ARG boxes might not be sufficient indicator of affinity binding in vitro. In fact, Sola-Landa et al. (2008) selected, with very stringent criteria, 20 promoters containing PHO boxes but were able to confirm the functionality of only 40% of them using an in vitro gel-shift assay. A lack of binding may derive from low Ri boxes but also depends on the correct spatial configuration of the DNA in the fragment used, the in vivo requirement of additional accessory proteins or cofactors that increase the affinity binding of the regulatory protein, and/or the requirement of in vivo modifications of the binding regulator (Wade et al., 2007). This is the case for RocR and AhrC cooperation in Bacillus to activate expression of arginine catabolism genes (Gardan et al., 1997) or the cooperation of the regulatory proteins FarR and ArgR in corynebacteria, to control argB expression and intracellular ornithine levels (Lee et al., 2011).
The relationship between ArgR and hyphae differentiation remained unexplored. As detailed above, S. coelicolor ΔargR mutants showed a spectacular phenotype in liquid cultures, resulting in the formation of spore-like chains. Microscopy analysis displayed the division and separation of nucleoids and the physical strangulation of hypha, forming chains of individual round segments in mutant liquid cultures, two principal events associated with sporulation (Figure 7). While sporulation in liquid cultures has occasionally been described in other Streptomyces strains (Lee and Rho, 1993; Rho and Lee, 1994; Rueda et al., 2001), in S. coelicolor it is very unusual and has only been reported in flask cultures submitted to either nutritional downshift or Ca2+supplementation (Daza et al., 1989), in S. coelicolor strains overexpressing ssgA (van Wezel et al., 2000a), and recently, in 2-L bioreactors (Rioseras et al., 2014). The signals triggering sporulation in Streptomyces hyphae (the upper parts of the aerial mycelia in solid cultures; the border of the mycelial pellets in liquid cultures) remain poorly characterized. Our results suggest that the arginine metabolism can contribute to modulate sporulation.
The differentiation signals activating sporulation and secondary metabolism are not completely known, especially in liquid cultures (Salerno et al., 2013). This work suggests that ArgR contributes to the regulation of these processes blocking sporulation in liquid cultures of the parental strain. In addition, this phenotype correlates with the overexpression in the ΔargR mutant of genes involved in hydrophobic cover formation, differentiation, and sporulation (e.g., chaplins, rodlins, most whi genes, ramR, ssgR, ssgA, smeA-sffA). Several possible ARG boxes were associated with the whi genes, suggesting a direct interaction with ArgR. In the case of rodlin and chaplin genes, no putative regulatory sequences were bioinformatically detected, indicating possible indirect regulation through other genes. Small but significant differences were found for some genes related to sporulation, such as sigF (Kelemen et al., 1996), or to hyphae septation, such as ftsZ and ftsH2, but not for other genes involved in the formation of the cytokinetic Z ring (ftsW, ftsI, ftsQ), (Grantcharova et al., 2003). No significant differences were found for other genes, such as rodlin and chaplin genes, genes related to aerial mycelium formation (ramCSAB) (Keijser et al., 2002; O'Connor and Nodwell, 2005), hyphae elongation or cellular division (whiA, crgA) (Flärdh et al., 1999). The regulatory genes differentially expressed in the ΔargR mutant with respect to the S. coelicolor parental strain are potential regulators of sporulation-like processes detected in liquid cultures. Further work is necessary to achieve a deeper characterization of the biochemical mechanism behind activation of sporulation in liquid cultures.
In summary, this work demonstrates that the ArgR protein is more pleiotropic than other bacterial ArgRs, affecting the expression of 1544 genes and triggering a sporulation-like process under the growth conditions used in this work. A new weight matrix was developed for the identification of novel ARG boxes, and a database containing the expression data of genes differentially expressed in the ΔargR mutant was generated.
Author Contributions
PL, AR-G, and AM: conceived and designed research. AB, RP-R, RÁ-Á, and PY: performed research. AR-G: did the bioinformatics studies. PY and AM: did the differentiation studies. PL: wrote the manuscript.
Funding
Grant BIO2013-34723 from the Spanish Ministry of Science and Innovation to PL. Work in the AM's laboratory was funded by the European Research Council (ERC Starting Grant; Strp-differentiation 280304) and by the Spanish Ministry of Economy and Competitiveness (Grant BIO2015-65709-R).
Conflict of Interest Statement
The authors declare that the research was conducted in the absence of any commercial or financial relationships that could be construed as a potential conflict of interest.
Acknowledgments
We greatly appreciate Juan F. Martín for the valuable discussions on the experimental work and suggestions for the manuscript. We appreciate the help of Springer Nature Authors Service to improve the language of the article, of María Teresa López-García in solving practical issues in the laboratory, and also the collaboration with DISMED SA.
Supplementary Material
The Supplementary Material for this article can be found online at: https://www.frontiersin.org/articles/10.3389/fmicb.2018.00361/full#supplementary-material
References
Allenby, N. E. E., Laing, E., Bucca, G., Kierzek, A. M., and Collin, C. P. (2012). Diverse control of metabolism and other cellular processes in Streptomyces coelicolor by the PhoP transcription factor: genome-wide identification of in vivo targets. Nucleic Acid Res. 40, 9543–9556. doi: 10.1093/nar/gks766
Amin, R., Reuther, J., Bera, A., Wohlleben, W., and Mast, Y. (2012). A novel GlnR target gene, is involved in nitrite assimilation in Streptomyces coelicolor. Microbiology. 158, 1172–1182. doi: 10.1099/mic.0.054817-0.
Ausmees, N., Wahlstedt, H., Bagchi, S., Elliot, M. A., Buttner, M. J., and Flärdh, K. (2007). A small membrane protein with multiple functions in Streptomyces sporulation including targeting of a SpoIIIE/FtsK-like protein to cell division septa. Mol. Microbiol. 65, 1458–1473. doi: 10.1111/j.1365-2958.2007.05877.x
Bailey, T. L., Bodén, M., Buske, F. A., Frith, M., Grant, C. E., Clementi, L., et al. (2009). MEME SUITE: tools for motif discovery and searching. Nucleic Acids Res. 37, W202–W208. doi: 10.1093/nar/gkp335
Bentley, S. D., Chater, K. F., Cerde-o-Tárraga, A. M., Challis, G. L., Thomson, N. R., James, K. D., et al. (2002). Complete genome sequence of the model actinomycete Streptomyces coelicolora A3(2). Nature 417, 141–147. doi: 10.1038/417141a
Botas, A. (2013). Regulación del Metabolismo en Streptomyces: Control por ArgR, Ph.D. thesis, University of León.
Bursy, J., Kuhlmann, A. U., Pittelkow, M. H., Jebbar, M., Pierik, A. J., and Bremer, E. (2008). Synthesis and uptake of the compatible solutes ectoine and 5-hydroxyectoine by Streptomyces coelicolor A3(2) in response to salt and heat stresses. Appl. Environ Microbiol. 74, 7286–7296. doi: 10.1128/AEM.00768-08
Bush, M. J., Bibb, M. J., Chandra, G., Findlay, K. C., and Buttner, M. J. (2013). Genes required for aerial growth, cell division, and chromosome segregation are targets of WhiA before sporulation in Streptomyces venezuelae. mBio 24, e00684–e00613. doi: 10.1128/mBio.00684-13
Buttner, M. J., Chater, K. F., and Bibb, M. J. (1990). Cloning, disruption, and transcriptional analysis of three RNA polymerase sigma factor genes of Streptomyces coelicolor A3(2). J. Bacteriol. 172, 3367–3378. doi: 10.1128/jb.172.6.3367-3378.1990
Claessen, D., Stokroos, I., Deelstra, H. J., Penninga, N. A., Bormann, C., Salas, J. A., et al. (2004). The formation of the rodlet layer of streptomycetes is the result of the interplay between rodlins and chaplins. Mol. Microbiol. 53, 433–443. doi: 10.1111/j.1365-2958.2004.04143.x
Conesa, A., Nueda, M. J., Ferrer, A., and Talon, M. (2006). maSigPro: a method to identify significantly differential expression profiles in time-course microarray experiments. Bioinformatics 22, 1096–1102. doi: 10.1093/bioinformatics/btl056
Cunin, R., Eckhardt, T., Piette, J., Boyen, A., Piérard, A., and Glansdorff, N. (1983). Molecular basis for modulated regulation of gene expression in the arginine regulon of Escherichia coli K-12. Nucleic Acid Res. 11, 5007–5018. doi: 10.1093/nar/11.15.5007
Davis, N. K., and Chater, K. F. (1992). The Streptomyces coelicolor whiB gene encodes a small transcription factor-like protein dispensable for growth but essential for sporulation. Mol. Gen. Genet. 232, 351–358. doi: 10.1007/BF00266237
Daza, A., Martín, J. F., Domínguez, A., and Gil, J. A. (1989). Sporulation of several species of Streptomyces in submerged cultures after nutritional downshift. J. Gen. Microbiol. 135, 2483–2491. doi: 10.1099/00221287-135-9-2483
Dion, M., Charlier, D., Wang, H., Gigot, D., Savchenko, A., Hallet, J. N., et al. (1997). The highly thermostable arginine repressor of Bacillus stearothermophilus: gene cloning and repressor-operator interactions. Mol. Microbiol. 25, 385–398. doi: 10.1046/j.1365-2958.1997.4781845.x
Doull, J. L., and Vining, L. C. (1989). Nutritional control of actinorhodin production by Streptomyces coelicolorA3 (2): suppresive effects of nitrogen and phosphate. Appl. Microbiol. Biotechnol. 32, 449–454. doi: 10.1007/BF00903781
Elliot, M. A., Bibb, M. J., Buttner, M. J., and Leskiw, B. K. (2001). BldD is a direct regulator of key developmental genes in Streptomyces coelicolor A3(2). Mol. Microbiol. 40, 257–269. doi: 10.1046/j.1365-2958.2001.02387.x
Fischer, M., Alderson, J., van Keulen, G., White, J., and Sawers, R. G. (2010). The obligate aerobe Streptomyces coelicolor A3(2) synthesizes three active respiratory nitrate reductases. Microbiology 156, 3166–3179. doi: 10.1099/mic.0.042572-0
Flärdh, K., Findlay, K. C., and Chater, K. F. (1999). Association of early sporulation geneswith suggested developmental decision points in Streptomyces coelicolor A3(2). Microbiology 145, 2229–2243. doi: 10.1099/00221287-145-9-2229
Gardan, R., Rapoport, G., and Débarbouillè, M. (1997). Role of the transcriptiomal activator RocR in the arginine-degradation pathway of Bacillus subtilis. Mol. Microbiol. 24, 825–837. doi: 10.1046/j.1365-2958.1997.3881754.x
Gomez-Escribano, J. P., Song, L., Fox, D. J., Yeo, V., Bibb, M. J., and Challis, G. L. (2012). Structure and biosynthesis of the unusual polyketide alkaloid coelimycin P1, a metabolic product of the cpk gene cluster of Streptomyces coelicolor M145. Chem. Sci. 3, 2716–2720. doi: 10.1039/c2sc20410j
Grandori, R., Lavie, T. A., Pflumm, M., Tian, G., Nierbach, H., Maas, W. K., et al. (1995). The DNA binding domain of the hexameric arginine repressor. J. Mol. Biol. 254, 150–162. doi: 10.1006/jmbi.1995.0607
Grant, C. E., Bailey, T. L., and Noble, W. S. (2011). FIMO: scanning for occurrences of a given motif. Bioinformatics 27, 1017–1018. doi: 10.1093/bioinformatics/btr064
Grantcharova, N., Ubhayasekera, W., Mowbray, S. L., McCormick, J. R., and Flärdh, K. (2003). A missense mutation in ftsZ differentially affects vegetative and developmentally controlled cell division in Streptomyces coelicolor A3(2). Mol. Microbiol. 47, 645–656. doi: 10.1046/j.1365-2958.2003.03334.x
Hong, H. J., Paget, M. S., and Buttner, M. J. (2002). A signal transduction system in Streptomyces coelicolor that activates the expression of a putative cell wall glycan operon in response to vancomycin and other cell wall-specific antibiotics. Mol. Microbiol. 44, 1199–1211. doi: 10.1046/j.1365-2958.2002.02960.x
Keijser, B. J., van Wezel, G. P., Canters, G. W., and Vijgenboom, E. (2002). Developmental regulation of the Streptomyces lividans ram genes: involvement of RamR in regulation of the ramCSAB operon. J. Bacteriol. 184, 4420–4429. doi: 10.1128/JB.184.16.4420-4429.2002
Kelemen, G. H., Brian, P., Flärdh, K., Chamberlin, L., Chater, J. F., and Buttner, M. J. (1998). Developmental regulation of transcription of whiE, a locus specifying the polyketide spore pigment in Streptomyces coelicolorA3(2). J. Bacteriol. 180, 2515–2521.
Kelemen, G. H., Brown, G. L., Kormanec, J., Potúckov,á, L., Chater, K. F., and Buttner, M. J. (1996). The positions of the sigma-factor genes, whiG and sigF, in the hierarchy controlling the development of spore chains in the aerial hyphae of Streptomyces coelicolor A3(2). Mol. Microbiol. 21, 593–603. doi: 10.1111/j.1365-2958.1996.tb02567.x
Kieser, T., Bibb, M. J., Buttner, M. J., Chater, K. F., and Hopwood, D. A. (2000). Practical Streptomyces Genetics. Norwich: John Innes Foundation.
Kol, S., Merlo, M. E., Scheltema, R. A., de Vries, M., Vonk, R. J., Kikkert, N. A., et al. (2010). Metabolomic characterization of the salt stress response in Streptomyces coelicolor. Appl. Environ. Microbiol. 76, 2574–2581. doi: 10.1128/AEM.01992-09
Larsen, R., van Hijum, S. A., Martinussen, J., Kuipers, O. P., and Kok, J. (2008). Transcriptome analysis of the Lactococcus lactis ArgR and AhrC regulons. Appl. Environ. Microbiol. 74, 4768–4771. doi: 10.1128/AEM.00117-08
Lee, E. J., Karoonuthaisiri, N., Kim, H. S., Park, J. H., Cha, C. J., Kao, C. M., et al. (2005). A master regulator σB governs osmotic and oxidative response as well as differentiation via a network of sigma factors in Streptomyces coelicolor. Mol. Microbiol 57, 1252–1264. doi: 10.1111/j.1365-2958.2005.04761.x
Lee, K. J., and Rho, Y. T. (1993). Characteristics of spores formed by surface and submerged cultures of Streptomyces albidoflavus SMF301. J. Gen. Microbiol. 139, 3131–3137. doi: 10.1099/00221287-139-12-3131
Lee, S. Y., Park, J.-M., Lee, J. H., Chang, S.-T., Park, J.-S., Kim, Y.-H., et al. (2011). Interaction of transcriptional repressor ArgR with the transcriptional regulator FarR at the argB promoter region in Corynebacterium glutamicum. Appl. Environ. Microbiol. 77, 711–718. doi: 10.1128/AEM.01610-10
Livak, K. J., and Schmittgen, T. D. (2001). Analysis of relative gene expression data using real time quantitative PCR and the 2−ΔΔCt. Methods. 25, 402–408. doi: 10.1006/meth.2001.1262
Llácer, J. L., Fita, I., and Rubio, V. (2008). Arginine and nitrogen storage. Curr. Opin. Struct. Biol. 18, 673–681. doi: 10.1016/j.sbi.2008.11.002
López-García, T., Santamarta, I., and Liras, P. (2010). Morphological differentiation and clavulanic acid formation are affected in a Streptomyces clavuligerus adpA-deleted mutant. Microbiology 156, 2354–2365. doi: 10.1099/mic.0.035956-0
Lu, C.-D., Yang, Z., and Li, W. (2004). Transcriptome analysis of the ArgR regulon in Pseudomonas aeruginosa. J. Bacteriol. 186, 3855–3861. doi: 10.1128/JB.186.12.3855-3861.2004
Manteca, A., Alvarez, R., Salazar, N., Yagüe, P., and Sánchez, J. (2008). Mycelium differentiation and antibiotic production in submerged cultures of Streptomyces coelicolor. Appl. Environ. Microbiol. 74, 3877–3886. doi: 10.1128/AEM.02715-07
Manteca, A., Claessen, D., López-Iglesias, C., and Sánchez, J. (2007). Aerial hyphae in surface cultures of Streptomyces lividans and Streptomyces coelicolor originate from viable segments surviving an early programmed cell death event. FEMS Microbiol. Lett. 274, 118–125. doi: 10.1111/j.1574-6968.2007.00825.x
Mark, B. L., Wasney, G. A., Salo, T. J., Khan, A. R., Cao, Z., Robbins, P. W., et al. (1998). Structural and functional characterization of Streptomyces plicatus β-N-acetylhexosaminidase by comparative molecular modeling and site-directed mutagenesis. J. Biol. Chem. 273, 19618–19624. doi: 10.1074/jbc.273.31.19618
Nishijyo, T., Park, S. M., Lu, C. D., Itoh, Y., and Abdelal, A. T. (1998). Molecular characterization and regulation of an operon encoding system for transport of arginine and ornithine and the ArgR regulatory protein in Pseudomonas aeruginosa. J. Bacteriol. 180, 5559–5566.
O'Connor, T. J., and Nodwell, J. R. (2005). Pivotal roles for the receiver domain in the mechanism of action of the response regulator RamR of Streptomyces coelicolor. J. Mol. Biol. 351, 1030–1047. doi: 10.1016/j.jmb.2005.06.053
Offner, S., Ziese, U., Wanner, G., Typke, D., and Pfeifer, F. (1998). Structural studies of halobacterial gas vesicles. Microbiology 144, 1331–1134. doi: 10.1099/00221287-144-5-1331
Paget, M. S., Leibovitz, E., and Buttner, M. J. (1999). A putative two-component signal transduction system regulates sigmaE, a sigma factor required for normal cell wall integrity in Streptomyces coelicolor A3(2). Mol. Microbiol. 33, 97–107. doi: 10.1046/j.1365-2958.1999.01452.x
Pérez-Redondo, R., Rodríguez-García, A., Botas, A., Santamarta, I., Martín, J. F., and Liras, P. (2012). ArgR of Streptomyces coelicolor is a versatile regulator. PLoS ONE 7:e32697. doi: 10.1371/journal.pone.0032697
Rho, Y. T., and Lee, K. J. (1994). Kinetic characterization of sporulation in Streptomyces albidoflavus SMF301 during submerged culture. Microbiology 1140, 2061–2065. doi: 10.1099/13500872-140-8-2061
Rioseras, B., López-García, M. T., Yagüe, P., Sánchez, J., and Manteca, A. (2014). Mycelium differentiation and development of Streptomyces coelicolor in lab-scale bioreactors: programmed cell death, differentiation, and lysis are closely linked to undecylprodigiosin and actinorhodin production. Bioresour. Technol. 151, 191–198. doi: 10.1016/j.biortech.2013.10.068
Rodríguez-García, A., Ludovice, M., Martín, J. F., and Liras, P. (1997). Arginine boxes and the argR gene in Streptomyces clavuligerus: evidence for a clear regulation of the arginine pathway. Mol. Microbiol. 25, 219–228. doi: 10.1046/j.1365-2958.1997.4511815.x
Rodríguez-García, A., Sola-Landa, A., Apel, K., Santos-Beneit, F., and Martín, J. F. (2009). Phosphate control over nitrogen metabolism in Streptomyces coelicolor: direct and indirect negative control of glnR, glnA, glnII and amtB expression by the response regulator PhoP. Nucleic Acids Res. 37, 3230–3242. doi: 10.1093/nar/gkp162
Rueda, B., Miguélez, E. M., Hardisson, C., and Manzanal, M. B. (2001). Mycelial differentiation and spore formation by Streptomyces brasiliensis in submerged culture. Can. J. Microbiol. 47, 1042–1047. doi: 10.1139/w01-109
Saito, N., Matsubara, K., Watanabe, M., Kato, F., and Ochi, K. (2003). Genetic and biochemical characterization of EshA, a protein that forms large multimers and affects developmental processes in Streptomyces griseus. J. Biol. Chem. 278, 5902–5911. doi: 10.1074/jbc.M208564200
Saito, N., Xu, J., Hosaka, T., Okamoto, S., Aoki, H., Bibb, M. J., et al. (2006). EshA accentuates ppGpp accumulation and is conditionally required for antibiotic production in Streptomyces coelicolor A3(2). J. Bacteriol. 188, 4952–4961. doi: 10.1128/JB.00343-06
Salerno, P., Persson, J., Bucca, G., Laing, E., Ausmees, N., Smith, C. P., et al. (2013). Identification of new developmentally regulated genes involved in Streptomyces coelicolor sporulation. BMC Microbiol. 13:28. doi: 10.1186/1471-2180-13-281
San Paolo, S., Huang, J., Cohen, S. N., and Thompson, C. J. (2006). rag genes: novel components of the Ram regulon that trigger morphological differentiation in Streptomyces coelicolor. Mol. Microbiol. 61, 1167–1186. doi: 10.1111/j.1365-2958.2006.05304.x
Schneider, T. D. (1997). Information content of individual genetic sequences. J. Theor. Biol. 189, 427–441. doi: 10.1006/jtbi.1997.0540
Shao, Z., Deng, W., Li, S., He, J., Ren, S., Huang, W., et al. (2015). GlnR-mediated regulation of ectABCD transcription expands the role of the GlnR regulon to osmotic stress management. J. Bacteriol. 197, 3041–3047. doi: 10.1128/JB.00185-15
Smith, M. C. M., Czaplewski, L., North, A. K., Baumberg, S., and Stockley, P. G. (1989). Sequences required for regulation of arginine biosynthesis promoters are conserved between Bacillus subtilis and Escherichia coli. Mol. Microbiol. 3, 23–28. doi: 10.1111/j.1365-2958.1989.tb00099.x
Smyth, G. K. (2004). Linear models and empirical Bayes methods for assessing differential expression in microarray experiments. Stat. Appl. Genet. Mol. Biol. 3, 1–25. doi: 10.2202/1544-6115.1027
Sola-Landa, A., Rodríguez-García, A., Amin, R., Wohlleben, W., and Martín, J. F. (2013). Competition between the GlnR and PhoP regulators for the glnA and amtB promoters in Streptomyces coelicolor. Nucleic Acids Res. 41, 1767–1782. doi: 10.1093/nar/gks1203
Sola-Landa, A., Rodríguez-García, A., Apel, A. K., and Martín, J. F. (2008). Target genes and structure of the direct repeats in the DNA-binding sequences of the response regulator PhoP in Streptomyces coelicolor. Nucleic Acids Res. 36, 1358–1368. doi: 10.1093/nar/gkm1150
Song, H., Wang, H., Gigot, D., Dimova, D., Sakanyan, V., Glansdorff, N., et al. (2002). Transcription regulation in thermophilic bacteria: high resolution contact probing of Bacillus stearothermophilus and Thermotoga neapolitana arginine repressor-operator interactions. J. Mol. Biol. 315, 255–274. doi: 10.1006/jmbi.2001.5236
Soutar, A., and Baumberg, S. (1996). Implication of a repression system, homologous to those of other bacteria, in the control of arginine biosynthesis genes in Streptomyces coelicolor. Mol. Gen. Genet. 251, 245–251.
Stirling, C. J., Szatmari, G., Stewart, G., Smith, M. C., and Sherratt, D. J. (1988). The arginine repressor is essential for plasmid-stabilizing site-specific recombination at the ColE1 cer locus. EMBO J. 7, 4389–4395.
Tian, G., Lim, D., Carey, J., and Maas, W. K. (1992). Binding of the arginine repressor of Escherichia coli K12 to its operator sites. J. Mol. Biol. 226, 387–397. doi: 10.1016/0022-2836(92)90954-I
Traag, B. A., Kelemen, G. H., and van Wezel, G. P. (2004). Transcription of the sporulation gene ssgA is activated by the IclR-type regulator SsgR in a whi-independent manner in Streptomyces coelicolor A3(2). Mol. Microbiol. 53, 985–1000. doi: 10.1111/j.1365-2958.2004.04186.x
van Duyne, G. D., Ghosh, G., Maas, W. K., and Sigler, P. B. (1996). Structure of the oligomerization and L-arginine binding domain of the arginine repressor of Escherichia coli. J. Mol. Biol. 256, 377–391. doi: 10.1006/jmbi.1996.0093
van Keulen, G., Hopwood, D. A., Dijkhuizen, L., and Sawers, R. G. (2005). Gas vesicles in actinomycetes: old buoys in novel habitats? Trends Microbiol. 13, 350–354. doi: 10.1016/j.tim.2005.06.006
van Wezel, G. P., van der Meulen, J., Kawamoto, S., Luiten, R. G., Koerten, H. K., and Kraal, B. (2000a). ssgA is essential for sporulation of A3(2) and affects hyphal development by stimulating septum formation. J. Bacteriol. 182, 5653–5662. doi: 10.1128/JB.182.20.5653-5662.2000
van Wezel, G. P., van der Meulen, J., Taal, E., Koerten, H., and Kraal, B. (2000b). Effects of increased and deregulated expression of cell division genes on the morphology and on antibiotic production of streptomycetes. Antonie van Leeuwenhoek 78, 269–276. doi: 10.1023/A:1010267708249
Wade, J. T., Struhl, K., Busby, S. J., and Grainger, D. C. (2007). Genomic analysis of protein-DNA interactions in bacteria: insights into transcription and chromosome organization. Mol. Microbiol. 65, 21–26. doi: 10.1111/j.1365-2958.2007.05781.x
Willemse, J., Borst, J. W., de Waal, E., Bisseling, T., and van Wezel, G. P. (2011). Positive control of cell division: FtsZ is recruited by SsgB during sporulation of Streptomyces. Gen. Develop. 25, 89–99. doi: 10.1101/gad.600211
Xu, M., Rao, Z., Yang, J., Xia, H., Dou, W., Jin, J., et al. (2012). Heterologous and homologous expression of the arginine biosynthetic argC~H cluster from Corynebacterium crenatum for improvement of (L)-arginine production. J. Ind. Microbiol. Biotechnol. 39, 495–502. doi: 10.1007/s10295-011-1042-4
Yagüe, P., Rodríguez-García, A., López-García, M. T., Rioseras, B., Martín, J. F., Sánchez, J., et al. (2014). Transcriptomic analysis of liquid non-sporulating streptomyces coelicolor cultures demonstrates the existence of a complex differentiation comparable to that occurring in solid sporulating cultures. PLoS ONE 9:e86296. doi: 10.1371/journal.pone.0086296
Keywords: ArgR, arginine, ARG box, S. coelicolor, transcriptomics, sporulation, antibiotics
Citation: Botas A, Pérez-Redondo R, Rodríguez-García A, Álvarez-Álvarez R, Yagüe P, Manteca A and Liras P (2018) ArgR of Streptomyces coelicolor Is a Pleiotropic Transcriptional Regulator: Effect on the Transcriptome, Antibiotic Production, and Differentiation in Liquid Cultures. Front. Microbiol. 9:361. doi: 10.3389/fmicb.2018.00361
Received: 07 September 2017; Accepted: 15 February 2018;
Published: 01 March 2018.
Edited by:
Dirk Tischler, Freiberg University of Mining and Technology, GermanyReviewed by:
Andreas Burkovski, University of Erlangen-Nuremberg, GermanyErhard Bremer, University of Marburg, Germany
Copyright © 2018 Botas, Pérez-Redondo, Rodríguez-García, Álvarez-Álvarez, Yagüe, Manteca and Liras. This is an open-access article distributed under the terms of the Creative Commons Attribution License (CC BY). The use, distribution or reproduction in other forums is permitted, provided the original author(s) and the copyright owner are credited and that the original publication in this journal is cited, in accordance with accepted academic practice. No use, distribution or reproduction is permitted which does not comply with these terms.
*Correspondence: Paloma Liras, paloma.liras@unileon.es