Association of serum lipids with inflammatory bowel disease: a systematic review and meta-analysis
 Hongxin Chen
 Weiyang Li1,2†
  Hong Shen
- 1Department of Gastroenterology, Affiliated Hospital of Nanjing University of Chinese Medicine, Nanjing, China
- 2The First School of Clinical Medicine, Nanjing University of Chinese Medicine, Nanjing, China
Background: Serum lipid levels seem to be abnormal in Inflammatory bowel disease (IBD). However, the specific manifestation of abnormal serum lipid levels in IBD are heterogeneous among studies and have not been sufficiently determined yet.
Methods: PubMed, EMBASE, and Cochrane Library databases were searched. Serum lipid levels were compared between IBD patients and Health individuals, Crohn’s (CD) and ulcerative colitis (UC), active and inactive, mild and non-mild patients, respectively. Meta-analyses were performed by using a random-effect model. Weight mean difference (WMD) with 95% confidence intervals (CIs) were calculated.
Results: Overall, 53 studies were included. Compared with healthy controls, IBD patients had significantly lower TC (WMD = −0.506, 95%CI = −0.674 to −0.338, p < 0.001), HDL-c (WMD = −0.122, 95%CI = −0.205 to −0.039, p = 0.004), and LDL-c (WMD = −0.371, 95%CI = −0.547 to −0.194, p < 0.001) levels. CD groups had a significantly lower TC (WMD = −0.349, 95%CI = −0.528 to −0.170, p < 0.0001) level as compared to UC groups. Active IBD and non-mild UC groups had significantly lower TC (WMD = −0.454, 95%CI = −0.722 to −0.187, p = 0.001) (WMD =0.462, 95%CI = 0.176 to 0.748, p = 0.002) and LDL-c (WMD = −0.225, 95%CI = −0.445 to −0.005, p = 0.045) (WMD =0.346, 95%CI = 0.084–0.609, p = 0.010) levels as compared to inactive IBD and mild UC groups, respectively.
Conclusion: The overall level of serum lipids in IBD patients is lower than that of healthy individuals and is negatively associated with disease severity.
Systematic review registration: https://www.crd.york.ac.uk/prospero/, identifier: CRD42022383885.
1. Introduction
Inflammatory bowel disease (IBD), including Crohn’s disease (CD) and ulcerative colitis (UC), is a chronic disease that mainly causes inflammation of the gastrointestinal tract (1). Its global prevalence is more than 0.3%, and the incidence and prevalence are still increasing worldwide (2). The specific pathogenesis of IBD remains unclear, but it seems to be a disruption of intestinal homeostasis caused by complex interactions among susceptible genes, inappropriate diet and immune response, and environmental risk factors (3, 4).
In this study, serum lipids mainly include total cholesterol (TC), high density lipoprotein cholesterol (HDL-c), low density lipoprotein cholesterol (LDL-c), and triglyceride (TG) (5). Normally, the main function of serum lipids is to maintain the body’s energy metabolism, synthesize cell membranes, steroid hormones, and bile acids. When autoimmunity and chronic inflammation occur in the human body, lipoprotein metabolism will be impaired and altered, causing various changes in serum lipid profiles (6–8). For example, systemic lupus erythematosus, a chronic inflammatory disease, is characterized by the presence of proinflammatory cytokines and anti-lipoprotein lipase antibodies, leading to a characteristic “lupus pattern” of lipoproteins, which mainly manifested by elevated TG and decreased HDL-c levels (6, 9, 10). Furthermore, abnormal serum lipid levels can stimulate the release of inflammatory mediators, aggravate inflammation, and promote disease progression (11). Additionally, when inflammation involves the intestine, it may affect the body’s absorption and metabolism of lipids, resulting in malabsorption of nutrients and fats, which in turn affect serum lipids metabolism (12). IBD, as a chronic, autoimmune, and inflammatory disease, may also have its own unique characteristics of serum lipid changes. However, in the current study, there is heterogeneity in the results of serum lipid levels in IBD patients. Some studies found that patients with IBD had low serum lipid levels than those without (12–14). By contrast, other studies found that patients with IBD had a high TG or HDL-c level than those without (15–17). More notably, no one meta-analysis has yet explored their association. Therefore, we have comprehensively collected relevant data and conducted a meta-analysis to analyze the correlation between serum lipids and IBD, aiming to explore the unique serum lipid profile of IBD.
2. Methods
The meta-analysis was performed based on the Preferred Reporting Items for Systematic Reviews and Meta-Analyses (PRISMA) statement. The PRISMA checklist is shown in Supplementary material 1.
2.1. Registration
The meta-analysis was registered in PROSPERO with a registration number of CRD42022383885.
2.2. Literature search
PubMed Medline, Embase, and Cochrane Library were searched. Searched items are listed in Supplementary material 2. The last search was performed on March 7, 2023. There was no language limitation.
2.3. Selection criteria
All studies regarding the data of serum lipids in IBD, CD, and UC were included. Exclusion criteria were as follows: (1) duplicated studies; (2) reviews and meta-analyses; (3) case reports; (4) guidelines, consensus, or reports; (5) experimental or animal studies; (6) irrelevant papers; (7) comments, letters, or notes; (8) participants with dyslipidemia; (9) combine with comorbidities; (10) overlapping participants among studies; and (11) absence of relevant data.
2.4. Outcomes of interest
The primary outcome should be explored differences in the manifestation of serum lipid levels between IBD and healthy controls, which included IBD versus healthy controls; UC versus healthy controls; and CD versus healthy controls, respectively. The secondary outcomes should be explored differences in the manifestation of serum lipid levels by disease type and severity, respectively.
2.5. Data extraction
The following data were extracted from the included studies: first author, publication year, region, type of publication, study design, enrollment period, type and severity of IBD, number and age of participants in case and control groups, and the levels of TC, HDL-c, LDL-c, and TG at baseline.
2.6. Study quality assessment
The quality of case–control and cohort studies was assessed by the Newcastle-Ottawa Scale (NOS), which includes 3 parts (i.e., Selection, Comparability, and exposure) and 8 questions with the highest score of 9 stars. A score of 0–3, 4–6, and 7–9 represents low, moderate, and high quality, respectively. The quality of cross-sectional studies was assessed with 11 items formulated by the Agency for Healthcare Research and Quality (AHRQ), which are answered with “yes,” “no,” or “unclear.” The maximum AHRQ score is 11. A score of 0–3, 4–7, and 8–11 represents low, moderate, and high quality, respectively.
2.7. Disease assessment
According to included studies, CD activity was assessed mainly according to Crohn’s Disease Activity Index scores (16, 18–22) or Harvey-Bradshaw scores (23, 24), and UC activity and severity were assessed mainly according to the modified Mayo score (25) or Truelove-Witts Severity Index (18, 20, 23, 26) or the simple clinical colitis activity index (16).
2.8. Statistical analysis
The meta-analysis was performed by the Review Manager 5.2 (Cochrane collaboration, the Nordic Cochrane Centre, Copenhagen, Denmark) and STATA 12.0 (Stata Corp, College Station, Texas, United States). A random-effect model was employed. p-value < 0.05 was considered statistically significant. Continuous variables will be expressed as weight mean difference (WMD) with 95% confidence intervals (CIs). If continuous variables will be expressed as median with range or interquartile, we will use the Box-Cox method to convert them to mean with standard deviation (27). The Cochrane Q test and I2 statistics were employed to assess the heterogeneity. I2 > 50% and/or p < 0.1 were considered to have statistically significant heterogeneity. Publication bias was performed with Egger test. p < 0.1 was considered as a statistically significant publication bias. Subgroup analyses were conducted according to IBD types (UC or CD). The meta-regression analyses and sensitivity analyses were used to explore the sources of heterogeneity. Covariates used for meta-regression analyses included study design (case–control vs. cross-sectional vs. cohort), publication year (before 2010 vs. after 2010), region (Asia vs. Europe vs. America vs. Oceania), sample size (≤100 vs. >100), and whether age and gender were matched between patients with and without IBD (matched vs. unmatched). Leave-one-out sensitivity analyses were assessed by sequentially omitting a single study in turn.
3. Results
3.1. Study selection
Overall, the initial search identified 3,235 studies from the PubMed, EMBASE, and Cochrane Library databases, and 2 study from hand-searching. Finally, 53 studies were included (Figure 1).
Figure 1. A flowchart of study inclusion.
3.2. Study characteristics
Characteristics of the included studies were shown in Table 1. Among them, 24 studies were case–control studies, 4 studies were cohort studies, and 25 were cross-sectional studies. All of them were published between 1979 and 2022. In addition, 17 studies were performed in Asia (13, 14, 19, 20, 25, 26, 33–36, 43, 47, 51–53, 59, 60), 30 in Europe (15–18, 21, 24, 28–32, 37, 39–42, 44, 46, 48, 50, 55–58, 61–66), 5 in America (22, 23, 38, 45, 54), and 1 in Oceania (49).
Table 1. Characteristics of included studies regarding serum lipid levels in inflammatory bowel disease.
3.3. Study quality
Among the case–control and cohort studies, 8 and 20 were of moderate and high quality, respectively (Supplementary Table S1). Among the cross-sectional studies, 22 and 3 were of moderate and high quality, respectively (Supplementary Table S2).
3.4. Meta-analysis of serum lipid levels between IBD versus healthy controls
3.4.1. Total cholesterol level
Thirty-six studies reported the data regarding the TC level. Meta-analysis demonstrated that IBD groups had a significantly lower level of TC than healthy control groups (WMD = −0.506, 95%CI = −0.674 to −0.338, p < 0.001) (Figure 2). The heterogeneity was significant (I2 = 96.2%, p < 0.001). Sensitivity analysis did not find the source of heterogeneity (Supplementary Figure S1A). Meta-regression analyses found that the source of heterogeneity might be the sample size (Supplementary Table S3).

Figure 2. Forest plots showing the TC level between IBD and healthy controls.
In the subgroup analyses of IBD types, 17 and 14 studies reported the data regarding the TC level in CD groups and healthy control groups, and UC groups and healthy control groups, respectively. Compared with the control group, the level of TC was also significantly lower in both CD and UC group (WMD = −0.844, 95%CI = −1.121 to −0.567, p < 0.001) (WMD = −0.490, 95%CI = −0.775 to −0.205, p = 0.001) (Supplementary Figures S2A, S4A). The heterogeneity was significant (I2 = 93.3%, p < 0.001) (I2 = 85.0%, p < 0.001). Sensitivity analysis did not find the source of heterogeneity (Supplementary Figures S3A, S5A). In UC groups versus healthy control groups, but not CD groups versus healthy control groups, meta-regression analyses found that the source of heterogeneity might be the sample size (Supplementary Table S3).
3.4.2. High density lipoprotein cholesterol level
Twenty-nine studies reported the data regarding the HDL-c level. Meta-analysis demonstrated that IBD groups had a significantly lower level of HDL-c than healthy control groups (WMD = −0.122, 95%CI = −0.205 to −0.039, p = 0.004) (Figure 3). The heterogeneity was significant (I2 = 94.9%, p < 0.001). Sensitivity analysis and meta-regression did not find the source of heterogeneity (Supplementary Figure S1B; Supplementary Table S3).
Figure 3. Forest plots showing the HDL-c level between IBD and healthy controls.
In the subgroup analyses of IBD types, 12 and 12 studies reported the data regarding the HDL-c level in CD groups and healthy control groups, and UC groups and healthy control groups, respectively. Compared with control groups, the level of HDL-c was also significantly lower in both CD and UC groups (WMD = −0.193, 95%CI = −0.305 to −0.081, p = 0.001) (WMD = −0.100, 95%CI = −0.172 to −0.027, p = 0.007) (Supplementary Figures S2B, S4B). The heterogeneity was significant (I2 = 93.8%, p < 0.001) (I2 = 68.3%, p < 0.0001). Sensitivity analysis and meta-regression analyses did not find the source of heterogeneity (Supplementary Figures S3B, S5B; Supplementary Table S3).
3.4.3. Low density lipoprotein cholesterol level
Twenty-nine studies reported the data regarding the LDL-c level. Meta-analysis demonstrated that IBD groups had a significantly lower level of LDL-c than healthy control groups (WMD = −0.371, 95%CI = −0.547 to −0.194, p < 0.001) (Figure 4). The heterogeneity was significant (I2 = 95.1%, p < 0.001). Sensitivity analysis and meta-regression did not find the source of heterogeneity (Supplementary Figure S1C; Supplementary Table S3).
Figure 4. Forest plots showing the LDL- c level between IBD and healthy controls.
In the subgroup analyses of IBD types, 11 and 11 studies reported the data regarding the LDL-c level in CD groups and healthy control groups, and UC groups and healthy control groups, respectively. Compared with control groups, the level of LDL-c was also significantly lower in both CD and UC groups (WMD = −0.550, 95%CI = −0.768 to −0.333, p < 0.001) (WMD = −0.386, 95%CI = −0.646 to −0.127, p = 0.003) (Supplementary Figures S2C, S4C). The heterogeneity was significant (I2 = 92.4%, p < 0.001) (I2 = 86.2%, p < 0.0001). Sensitivity analysis and meta-regression analyses did not find the source of heterogeneity (Supplementary Figures S3C, S5C; Supplementary Table S3).
3.4.4. Triglyceride level
Thirty-three studies reported the data regarding the TG level. Meta-analysis demonstrated that IBD groups had a lower level of TG than healthy control groups, but there was no significant difference between the two groups (WMD = −0.077, 95%CI = −0.185 to 0.031, p = 0.161) (Figure 5). The heterogeneity was significant (I2 = 91.4%, p < 0.0001). Sensitivity analysis and meta-regression did not find the source of heterogeneity (Supplementary Figure S1D; Supplementary Table S3).

Figure 5. Forest plots showing the TG level between IBD and healthy controls.
In the subgroup analyses of IBD types, 11 and 11 studies reported the data regarding the TG level in CD groups and healthy control groups, and UC groups and healthy control groups, respectively. Compared with control groups, the level of TG was significantly lower in CD groups (WMD = −0263, 95%CI = −0.426 to −0.101, p = 0.001), but not UC groups (WMD = −0.074, 95%CI = −0.267 to 0.119, p = 0.452) (Supplementary Figures S2D, S4D). The heterogeneity was significant (I2 = 92.2%, p < 0.0001) (I2 = 82.7%, p < 0.0001). Sensitivity analysis and meta-regression analyses did not find the source of heterogeneity (Supplementary Figures S3D, S5D; Supplementary Table S3).
3.5. Meta-analysis of serum lipid levels between CD versus UC
3.5.1. Total cholesterol level
Twenty-one studies reported the data regarding the TC level. Meta-analysis demonstrated that CD groups had a lower level of TC than UC groups (WMD = −0.349, 95%CI = −0.528 to −0.170, p < 0.0001) (Figure 6A). The heterogeneity was significant (I2 = 86.2%, p < 0.0001). Sensitivity analysis did not find the source of heterogeneity (Supplementary Figure S6A; Supplementary Table S3). Meta-regression analyses found that the source of heterogeneity might be the region and study design (Supplementary Table S3).
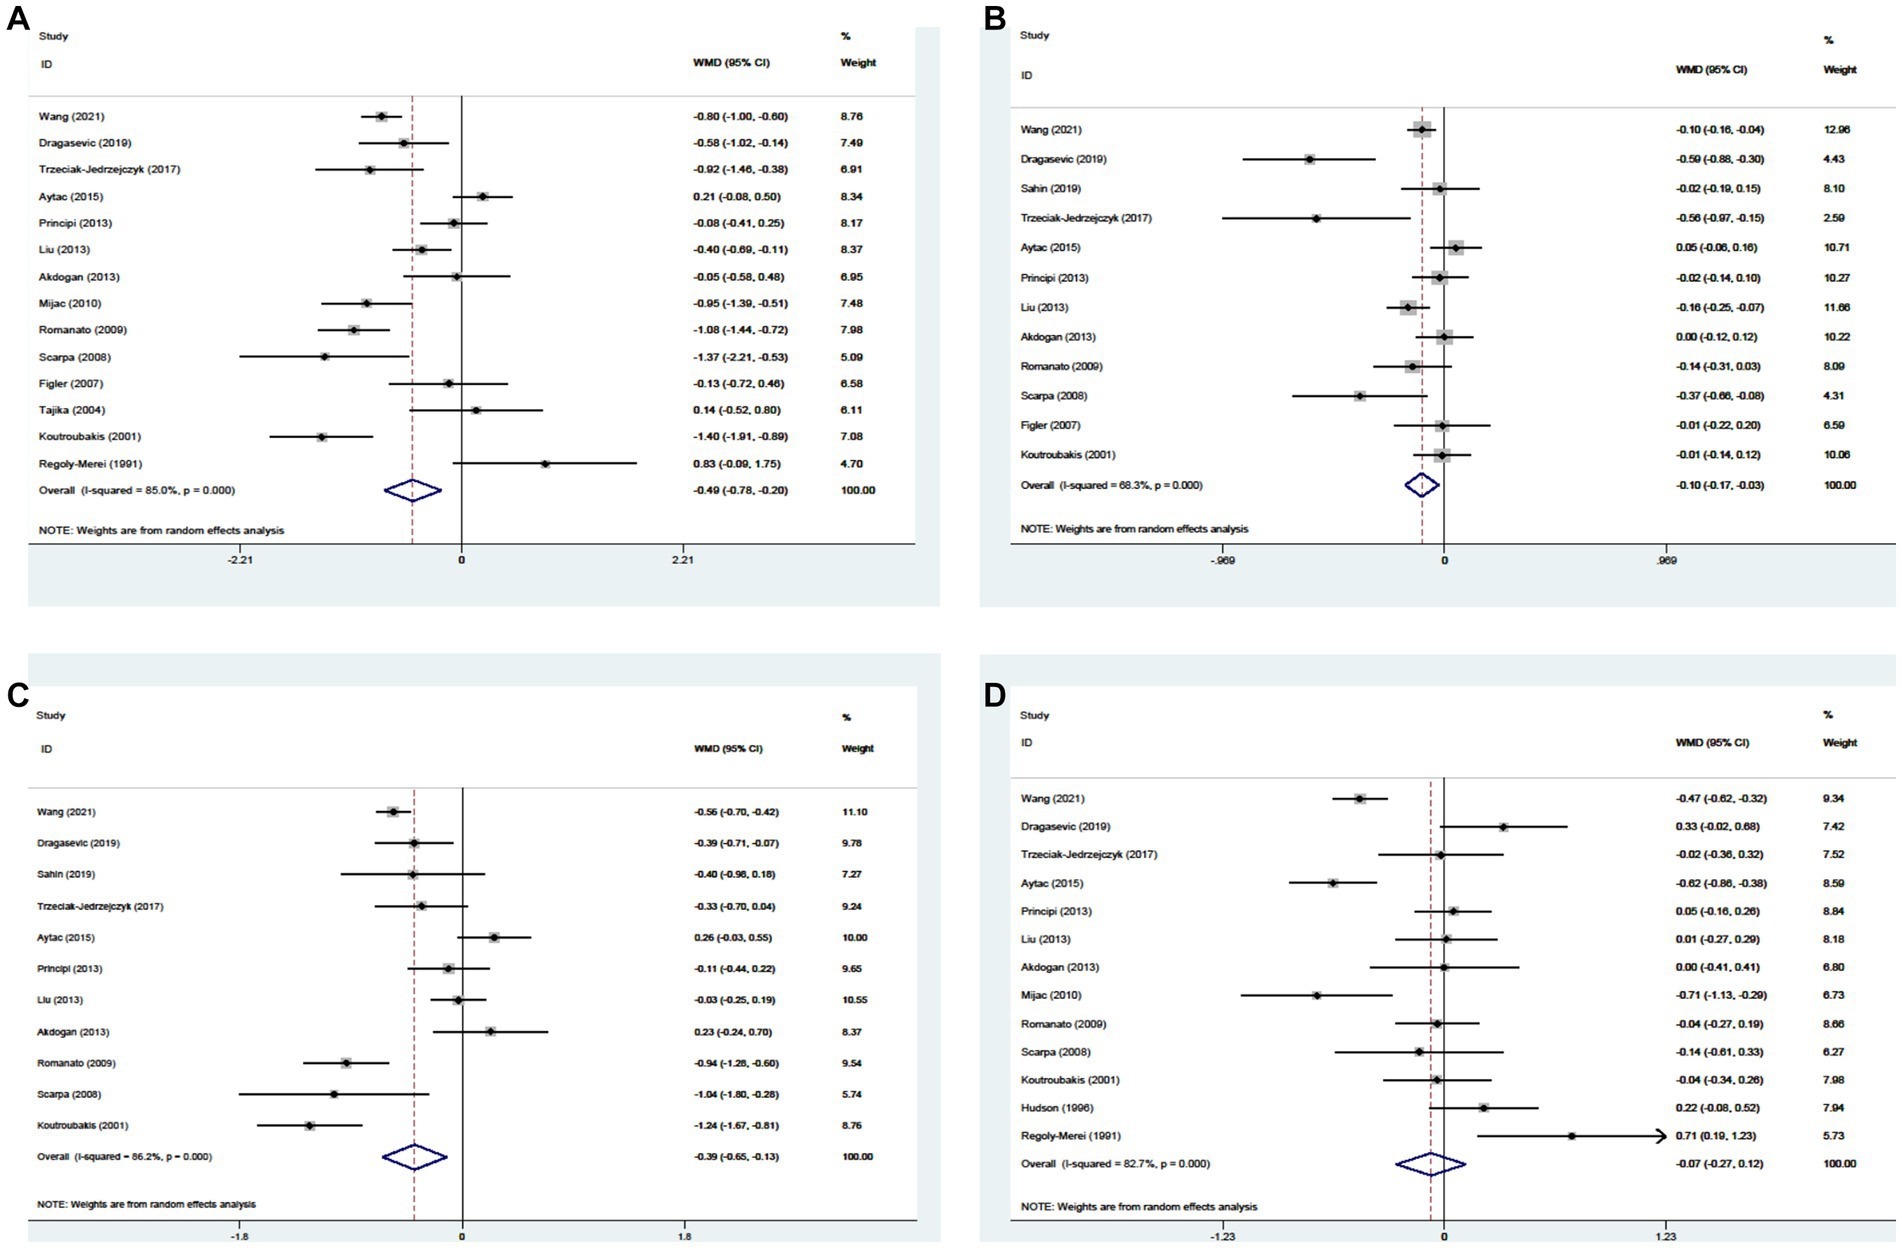
Figure 6. Forest plots showing the levels of TC (A), HDL-c (B), LDL-c (C), and TG (D) between CD and UC.
3.5.2. High density lipoprotein cholesterol level
Fifteen studies reported the data regarding the HDL-c level. Meta-analysis demonstrated that the HDL-c level was not significantly different between CD groups and UC groups (WMD = −0.024, 95%CI = −0.068 to 0.020, p = 0.285) (Figure 6B). The heterogeneity was significant (I2 = 50.1%, p = 0.014). Sensitivity analysis did not find the source of heterogeneity (Supplementary Figure S6B). Meta-regression analyses found that the source of heterogeneity might be the public year (Supplementary Table S3).
3.5.3. Low density lipoprotein cholesterol level
Thirteen studies reported the data regarding the LDL-c level. Meta-analysis demonstrated that the LDL-c level was not significantly different between CD groups and UC groups (WMD = −0.097, 95%CI = −0.297 to 0.103, p = 0.344) (Figure 6C). The heterogeneity was significant (I2 = 88.5%, p < 0.00C01). Sensitivity analysis and meta-regression analyses did not find the source of heterogeneity (Supplementary Figure S6C; Supplementary Table S3).
3.5.4. Triglyceride level
Eighteen studies reported the data regarding the TG level. Meta-analysis demonstrated that the TG level was not significantly different between CD groups and UC groups (WMD = 0.014, 95%CI = −0.077 to 0.105, p = 0.760) (Figure 6D). The heterogeneity was significant (I2 = 78.2%, p < 0.0001). Sensitivity analysis and meta-regression analyses did not find the source of heterogeneity (Supplementary Figure S6D; Supplementary Table S3).
3.6. Meta-analysis of serum lipid levels and disease activity
3.6.1. Active IBD versus inactive IBD
There were 5, 4, 4, and 4 studies reported the data regarding the TC, HDL-c, LDL-c, and TG levels, respectively. Compared with inactive IBD groups, active IBD groups had significantly lower levels of TC (WMD = -0.454, 95%CI = −0.722 to −0.187, p = 0.001) and LDL-c (WMD = −0.225, 95%CI = −0.445 to −0.005, p = 0.045), while the levels of HDL-c (WMD = −0.248, 95%CI = −0.542 to 0.047, p = 0.099) and TG (WMD = −0.129, 95%CI = −0.273 to 0.015, p = 0.080) were lower, but there were no statistically different (Table 2). There was no significant heterogeneity among studies in TC (I2 = 0%; p = 0.421), LDL-c (I2 = 0%; p = 0.740), and TG (I2 = 0%; p = 0.868) levels, but not HDL-c level (I2 = 87.6%; p < 0.0001). It is inappropriate to conduct sensitivity analysis and meta-regression analyses to explore the sources of heterogeneity since less than 10 studies were included.

Table 2. Meta-analyses of serum lipid levels and disease activity.
3.6.2. Active CD versus active UC
Two studies reported the data regarding the TC, HDL-c, LDL-c, and TG levels Compared with active UC groups, active CD groups had a significantly lower level of LDL-c (WMD = −0.393, 95%CI = −0.666 to −0.121, p = 0.005). Although there were no significant differences in TC (WMD = -0.311, 95%CI = −0.648 to 0.026, p = 0.071), HDL-c (WMD = −0.075, 95%CI = −0.196 to 0.046, p = 0.226), and TG (WMD =0.077, 95%CI = −0.148 to 0.302, p = 0.502) levels between active CD groups and active UC groups, active CD groups had lower TC and HDL-c levels, and active UC groups had a lower TG level (Table 2). There was no significant heterogeneity among studies in LDL-c (I2 = 0.7%; p = 0.316), TC (I2 = 0%; p = 0.435), HDL-c (I2 = 0%; p = 0.891), and TG (I2 = 26.3%; p = 0.244) levels. It is inappropriate to conduct sensitivity analysis and meta-regression analyses to explore the sources of heterogeneity since only two studies were included.
3.6.3. Inactive CD versus inactive UC
There were 2, 2, 1, and 1 studies reported the data regarding the TC, HDL-c, LDL-c, and TG levels, respectively. Compared with inactive UC groups, inactive CD groups had a significantly lower level of TC (WMD = −0.629, 95%CI = −0.966 to −0.291, p < 0.0001). Although there was no significant difference in HDL-c (WMD = −0.059, 95%CI = −0.176 to 0.058, p = 0.324) level between inactive CD groups and inactive UC groups, inactive CD groups had a lower HDL-c level (Table 2). There was no significant heterogeneity among studies in TC (I2 = 0%; p = 0.683) and HDL-c (I2 = 0%; p = 0.378) levels. Only one study recorded data on LDL-c and TG levels, and we found that LDL-c seemed to be lower inactive CD groups (2.59 ± 0.77 mmol/L vs. 2.76 ± 0.64 mmol/L), and TG level seemed to be lower in inactive UC groups (1.01 ± 0.28 mmol/L vs. 0.91 ± 0.41 mmol/L).
3.6.4. Mild active UC versus non-mild active UC
There were 2, 1, 2, and 1 studies reported the data regarding the TC, HDL-c, LDL-c, and TG levels, respectively. Compared with mild active UC groups, non-mild active UC groups had significantly lower levels of TC (WMD =0.462, 95%CI = 0.176 to 0.748, p = 0.002) and LDL-c (WMD =0.346, 95%CI = 0.084 to 0.609, p = 0.010) (Table 2). There was no significant heterogeneity among studies in TC (I2 = 0%; p = 0.504) and LDL-c (I2 = 0%; p = 0.647) levels. Only one study recorded data on HDL-c and TG levels, and we found that HDL-c level seemed to be lower in non-mild UC groups (1.23 ± 0.29 mmol/L vs. 1.05 ± 0.33 mmol/L), and TG level seemed to be no different between the two groups (1.43 ± 1.04 mmol/L vs.1.44 ± 0.98 mmol/L).
3.7. Publication bias
Publication bias was reported in Supplementary Table S4.
4. Discussion
The current systematic review and meta-analysis of 53 studies comprehensively explored the association between IBD and serum lipid levels. We found that the levels of TC, HDL-c, and LDL-c were significantly lower in IBD patients than those without. In the subgroup analyses of IBD types, we found the same findings in UC patients, but CD patients still had a significantly lower level of TG than healthy controls. In addition, we found that CD patients had a significantly lower TC level than UC patients, and active IBD and non-mild UC patients had significantly lower levels of TC and LDL-c levels than inactive IBD and mild UC patients, respectively.
Our study has several major features in the study design and statistical analysis. First, our study is the first systematic review and meta-analysis to explore the association between serum lipids and IBD. Second, subgroup analyses were planned to further explore the association between IBD types and serum lipids. Third, the selection of the population included in our meta-analysis was rational and rigorous. Specifically, we excluded studies that identified patients with comorbidities and those that specially excluded patients with dyslipidemia, which is important to eliminate the influence of these potential confounders on the reliability of our findings. Fourth, in some of the included studies, continuous data were expressed as median with range or inter quartile range. In order to perform mete-analysis, we transformed such data into means with standard deviations by Box-Cox method (27), which has been proven to be superior to all existing methods.
The association of serum lipids with IBD can be explained by the following considerations. The first one is HDL-c. Normally, Apolipoprotein AI (Apo-AI) is considered as the main apolipoprotein of HDL (67). When inflammation occurs in the body, the inflammatory factors interleukin (IL)-1, IL-6, and tumor necrosis factor-α will induce the liver to synthesize a large amount of serum amyloid A (SAA), and the SAA released into the blood quickly binds to HDL, competitively replacing Apo-AI to become the main apolipoprotein of HDL (68). SSA-containing HDL is cleared more rapidly from the circulation than normal HDL and is preferentially taken up by macrophages rather than hepatocytes, thereby decrease the HDL-c level (69, 70). Moreover, in adipose tissue, glycoproteins on the surface of adipocyte membranes can bind to SAA, causing HDL to remain in adipose tissue, reducing the concentration of plasma HDL, and ultimately leading to a lower HDL-c level in IBD patients (71). More importantly, HDL has been proven to have immunomodulatory effects (72). In cellular immunity, major histocompatibility complex (MHC) class II molecules, which play an important role in antigen presentation and signal transduction, are located in lipid-rich microdomains in antigen-presenting cells, and its number is critical for T cell activation. Lipid rafts, which are membrane microdomains containing high concentrations of cholesterol, proteins, and sphingolipids, whose functional properties depend on their lipid composition, thus depleting cholesterol from these microdomains can downregulate several signaling pathways in immune cells and disrupt antigen presentation function. It also reduces the amount of antigen required for T cell activation by concentrating MHC–peptide complexes on the surface of antigen-presenting cells (73). HDL can promote the removal of cholesterol from peripheral cells and may decrease the level of cholesterol in lipid rafts, thereby decreasing the number of MHC class II molecules and ultimately impairing T-cell activation (74). When the HDL-c level is too low to mediate immunity, there may be increased inflammation, which is why our meta-analyses found that the level of HDL-c in IBD patients was lower than in healthy controls. The second one is LDL-c. To the best of our knowledge, LDL-c is a kind of bad cholesterol, and the lower the better. However, we found that the LDL-c level was significantly lower in IBD patients than in healthy controls, and significantly lower in patients with active IBD than in patients with inactive IBD. In other diseases (i.e., COVID-19, dialysis patients, coronary heart disease, and depression), a U-shaped association between the LDL-c level and disease development and poor prognosis has been found, despite adjustment for factors such as age, nutritional status, and statin use (75–78). This suggests that LDL-c within a certain range is not associated with the occurrence and development of the disease, where excessively low or high levels may result in aggravated the disease. Therefore, we propose a reasonable hypothesis that although LDL-c is not beneficial, a low level of LDL-c in IBD patients may also mediate inflammation and promote disease progression. In vitro and in vivo experiments found that LDL can decrease the production of lipopolysaccharide (LPS)-stimulated pro-inflammatory cytokines by binding to LPS (79). LDL receptor-deficient mice can lead to increased levels of endogenous LDL-c, which can protect them from the influence of LPS and reduce the production of pro-inflammatory factors such as tumor necrosis factor and IL-1α (80). In contrast, in hypolipidemic mice, LPS induction resulted in increased mortality, which can be reversed by administering exogenous lipoproteins to raise serum lipid levels to within the physiological range (81). In addition, Coenzyme Q10, an endogenous antioxidant, is a component of LDL (82). It has been reported to inhibit the arachidonic acid metabolic pathway and the formation of various prostaglandins (83). When the level of LDL-c is too low, the level of Coenzyme Q10 may also be reduced, resulting in increased inflammation. The third one is TC. The mechanism by which inflammation lowers cholesterol levels is still unclear. Some mechanistic studies using human hepatoma HepG2 cells found that IL-1 can inhibit cholesterol synthesis and decrease cholesterol and Apo-B secretion, and IL-6 can increase cholesterol synthesis but decrease even more cholesterol secretion (84, 85). Compared with healthy individuals, there is no doubt that the levels of these inflammatory cytokines are higher in patients with IBD (44). Furthermore, during inflammation, the levels of TC and LDL-c decrease maybe due to the increase of small dense LDL-c and are more profoundly observed in diseases with more severe underlying inflammation (12). In plasma, there is active lipid exchange occurring between various lipoproteins, including TC transfer from LDL to very low-density lipoprotein (VLDL) and TG transfer from VLDL to LDL. When the level of TG in LDL increases beyond a certain threshold, LDL will be hydrolyzed by liver lipase to remove TG, resulting in smaller LDL particles and decreased TC content, forming small dense LDL-c. It is important to note that the total amount and synthesis of LDL remain unaltered in this process. Thus, the levels of LDL-c and TC decrease (86). Current studies revealed that in subtypes of LDL, small dense LDL is more susceptible to oxidation and possess pro-inflammatory effects (84, 86). The level of small dense LDL may be positively correlated with inflammation, indicating that a higher level of small dense LDL is associated with more severe inflammation (87). Admittedly, the degree of inflammation in active IBD and non-mild active UC is significantly heavier than those in patients with inactive IBD and mild active UC, respectively, so the level of small dense LDL may be higher in the active IBD and non-mild active UC. This may be one of the reasons why the levels of TC and LDL-c in active IBD and non-mild active UC are lower than those in patients with inactive IBD and mild active UC, respectively. However, due to the lack of relevant study and this is only a hypothesis based on the literature. Last, IBD is a chronic inflammatory disease involving the gastrointestinal tract, which can lead to intestinal absorption dysfunction. Therefore, the decreased levels of HDL-c, LDL-c, and TC may indicate a malnourished status in patients with IBD (12).
In our meta-analysis, we also found that the level of TC was significantly lower in CD patients than in UC patients, and the level of TG was significantly lower in CD patients than in healthy controls. A possible reason for these results is that CD more often involves in the small intestine. The terminal ileum is primarily responsible for the absorption of bile acids. When the absorption of small intestine is dysfunctional, a large amount of bile acids and cholesterol can be excreted with stools, which may decrease in lipid profiles (54). Moreover, the small intestine is also one of the main pathways for the production of TG. In small intestine, bile acids are bound to dietary triacylglycerols to facilitate their hydrolysis into free fatty acids and monoacylglycerols, which are then synthesized into TG in the endoplasmic reticulum (88). As mentioned before, CD mainly involves the small intestine, and then TG production will decrease, resulting in a lower level of TG in CD patients than in healthy controls.
The limitations need to be acknowledged. First, the definitions of disease activity and severity were not completely equal. Second, most of the included studies had a small sample size and were conducted at a single center. Third, the previous treatment strategies for patients may be inconsistent among studies, and we could not extract relevant data. Fourth, the heterogeneity among studies were significant, despite sensitivity analyses and meta-regression analyses. Fifth, there is a lack of detailed information on race or ethnicity, which may hinder the exploration of the relationship between serum lipids and IBD in different races or ethnic groups.
In conclusion, the serum lipid levels of IBD patients are lower than that of healthy controls, and active and non-mild IBD patients appear to have lower lipid levels than those in remission and mild patients, respectively. More well-designed prospective studies are needed to confirm our findings, and experimental studies are still needed to elucidate the underlying mechanisms in the future.
Data availability statement
The original contributions presented in the study are included in the article/Supplementary material, further inquiries can be directed to the corresponding authors.
Author contributions
HC reviewed and searched the literature, wrote the protocol, collected the data, performed the statistical analysis and quality assessment, interpreted the data, and drafted the manuscript. WL, JH, FX, and YL checked the data, discussed the findings, and gave critical comments. HS and LZ conceived the work, reviewed, searched the literature, wrote the protocol, performed the statistical analysis, interpreted the data, and revised the manuscript. All authors contributed to the article and approved the submitted version.
Funding
This work was supported by the Jiangsu Provincial Medical Innovation Center.
Conflict of interest
The authors declare that the research was conducted in the absence of any commercial or financial relationships that could be construed as a potential conflict of interest.
Publisher’s note
All claims expressed in this article are solely those of the authors and do not necessarily represent those of their affiliated organizations, or those of the publisher, the editors and the reviewers. Any product that may be evaluated in this article, or claim that may be made by its manufacturer, is not guaranteed or endorsed by the publisher.
Supplementary material
The Supplementary material for this article can be found online at: https://www.frontiersin.org/articles/10.3389/fmed.2023.1198988/full#supplementary-material
Abbreviations
IBD, inflammatory bowel disease; CD, Crohn’s disease; UC, ulcerative colitis; TC, total cholesterol; HDL-c, high density lipoprotein; LDL-c, low density lipoprotein cholesterol; TG, triglyceride; NOS, Newcastle-Ottawa scale; AHRQ, Agency for Healthcare Research and Quality; WMD, weight mean difference; CIs, confidence intervals; IL, inflammatory factors interleukin; Apo-AI, apolipoprotein AI; SAA, serum amyloid A; MHC, major histocompatibility complex; LPS, lipopolysaccharide; VLDL, very low density lipoprotein.
References
1. Bisgaard, TH, Allin, KH, Keefer, L, Ananthakrishnan, AN, and Jess, T. Depression and anxiety in inflammatory bowel disease: epidemiology, mechanisms and treatment. Nat Rev Gastroenterol Hepatol. (2022) 19:717–26. doi: 10.1038/s41575-022-00634-6
2. Ng, SC, Shi, HY, Hamidi, N, Underwood, FE, Tang, W, Benchimol, EI, et al. Worldwide incidence and prevalence of inflammatory bowel disease in the 21st century: a systematic review of population-based studies. Lancet. (2017) 390:2769–78. doi: 10.1016/S0140-6736(17)32448-0
3. Adolph, TE, Meyer, M, Schwärzler, J, Mayr, L, Grabherr, F, and Tilg, H. The metabolic nature of inflammatory bowel diseases. Nat Rev Gastroenterol Hepatol. (2022) 19:753–67. doi: 10.1038/s41575-022-00658-y
4. Song, Y, Zhao, Y, Ma, Y, Wang, Z, Rong, L, Wang, B, et al. Biological functions of NLRP3 inflammasome: a therapeutic target in inflammatory bowel disease. Cytokine Growth Factor Rev. (2021) 60:61–75. doi: 10.1016/j.cytogfr.2021.03.003
5. Sadat Masjedi, M, Mohammadi Pour, P, Shokoohinia, Y, and Asgary, S. Effects of flaxseed on blood lipids in healthy and dyslipidemic subjects: a systematic review and Meta-analysis of randomized controlled trials. Curr Probl Cardiol. (2022) 47:100931. doi: 10.1016/j.cpcardiol.2021.100931
6. de Carvalho, JF, Bonfá, E, and Borba, EF. Systemic lupus erythematosus and “lupus dyslipoproteinemia”. Autoimmun Rev. (2008) 7:246–50. doi: 10.1016/j.autrev.2007.11.016
7. Kim, SY, Yu, M, Morin, EE, Kang, J, Kaplan, MJ, and Schwendeman, A. High-density lipoprotein in lupus: disease biomarkers and potential therapeutic strategy. Arthritis Rheumatol. (2020) 72:20–30. doi: 10.1002/art.41059
8. Borba, EF, Carvalho, JF, and Bonfá, E. Mechanisms of dyslipoproteinemias in systemic lupus erythematosus. Clin Dev Immunol. (2006) 13:203–8. doi: 10.1080/17402520600876945
9. Coelewij, L, Waddington, KE, Robinson, GA, Chocano, E, McDonnell, T, Farinha, F, et al. Serum metabolomic signatures can predict subclinical atherosclerosis in patients with systemic lupus erythematosus. Arterioscler Thromb Vasc Biol. (2021) 41:1446–58. doi: 10.1161/ATVBAHA.120.315321
10. Lu, L, Hu, C, Zhao, Y, He, L, Zhou, J, Li, H, et al. Shotgun Lipidomics revealed altered profiles of serum lipids in systemic lupus erythematosus closely associated with disease activity. Biomol Ther. (2018) 8:105. doi: 10.3390/biom8040105
11. Liu, Z, Tang, H, Liang, H, Bai, X, Zhang, H, Yang, H, et al. Dyslipidaemia is associated with severe disease activity and poor prognosis in ulcerative colitis: a retrospective cohort study in China. Nutrients. (2022) 14:3040. doi: 10.3390/nu14153040
12. Soh, H, Im, JP, Han, K, Park, S, Hong, SW, Moon, JM, et al. Crohn's disease and ulcerative colitis are associated with different lipid profile disorders: a nationwide population-based study. Aliment Pharmacol Ther. (2020) 51:446–56. doi: 10.1111/apt.15562
13. Wang, D, Zhao, XJ, Cui, XF, Li, LZ, and Zhang, HJ. Correlation of serum lipid profile and disease activity in patients with inflammatory bowel disease. Zhonghua Nei Ke Za Zhi. (2021) 60:834–6. doi: 10.3760/cma.j.cn112138-20200930-00847
14. Lu, J, Yu, F, Huang, J, Yu, H, Li, F, Le, Z, et al. Hypocholesterolemia and inflammatory biomarkers act as predictors of severe vitamin D deficiency in patients with Crohn's disease: a clinical analysis of 862 patients in China. Front Nutr. (2022) 9:806887. doi: 10.3389/fnut.2022.806887
15. Schulte, DM, Paulsen, K, Türk, K, Brandt, B, Freitag-Wolf, S, Hagen, I, et al. Small dense LDL cholesterol in human subjects with different chronic inflammatory diseases. Nutr Metab Cardiovasc Dis. (2018) 28:1100–5. doi: 10.1016/j.numecd.2018.06.022
16. Ripollés Piquer, B, Nazih, H, Bourreille, A, Segain, JP, Huvelin, JM, Galmiche, JP, et al. Altered lipid, apolipoprotein, and lipoprotein profiles in inflammatory bowel disease: consequences on the cholesterol efflux capacity of serum using Fu5AH cell system. Metabolism. (2006) 55:980–8. doi: 10.1016/j.metabol.2006.03.006
17. Hernández-Camba, A, Carrillo-Palau, M, Ramos, L, de Armas-Rillo, L, Vela, M, Arranz, L, et al. Apolipoprotein C3 is downregulated in patients with inflammatory bowel disease. Clin Transl Gastroenterol. (2022) 13:e00500. doi: 10.14309/ctg.0000000000000500
18. Mańkowska-Wierzbicka, D, Karczewski, J, Swora-Cwynar, E, Dobrowolska, A, and Stelmach-Mardas, M. The clinical importance of 21-day combined parenteral and enteral nutrition in active inflammatory bowel disease patients. Nutrients. (2019) 11:2246. doi: 10.3390/nu11092246
19. Qin, G, Tu, J, Liu, L, Luo, L, Wu, J, Tao, L, et al. Serum albumin and C-reactive protein/albumin ratio are useful biomarkers of Crohn’s disease activity. Med Sci Monit. (2016) 22:4393–400. doi: 10.12659/MSM.897460
20. Aytac, E, Buyuktas, D, Baysal, B, Atar, M, Yildiz, M, Baca, B, et al. Visual evoked potentials and pulse wave velocity in inflammatory bowel disease. Turk J Gastroenterol. (2015) 26:15–9. doi: 10.5152/tjg.2015.4349
21. Hrabovský, V, Zadák, Z, Bláha, V, Hyšpler, R, Karlík, T, Martínek, A, et al. Cholesterol metabolism in active Crohn's disease. Wien Klin Wochenschr. (2009) 121:270–5. doi: 10.1007/s00508-009-1150-6
22. Levy, E, Rizwan, Y, Thibault, L, Lepage, G, Brunet, S, Bouthillier, L, et al. Altered lipid profile, lipoprotein composition, and oxidant and antioxidant status in pediatric Crohn disease. Am J Clin Nutr. (2000) 71:807–15. doi: 10.1093/ajcn/71.3.807
23. De Fatima, AE, and Bodanese, LC. Evaluation of lipid profile in patients with inflammatory bowel disease. Sci Med. (2016) 26:1–9. doi: 10.15448/1980-6108.2016.2.22964
24. Van Leuven, SI, Hezemans, R, Levels, JH, Snoek, S, Stokkers, PC, Hovingh, GK, et al. Enhanced atherogenesis and altered high density lipoprotein in patients with Crohn's disease. J Lipid Res. (2007) 48:2640–6. doi: 10.1194/jlr.M700176-JLR200
25. Li, X, Liu, X, Song, Y, et al. Expression and clinical significance of NLRP1 and NLRP3 in colonic tissues of patients with ulcerative colitis. J Xi'an Jiaotong Univ. (2021) 42:75–80, 112. doi: 10.7652/jdyxb202101014
26. Liu, W, Liu, X, Yu, X, Tao, Y, and Yang, G. Correlation between active ulcerative colitis and protein, lipid metabolisms. Chin Jo Gastroenterol. (2013) 18:738–40. doi: 10.3969/j.issn.1008-7125.2013.12.008
27. McGrath, S, Zhao, X, Steele, R, Thombs, BD, and Benedetti, A. Estimating the sample mean and standard deviation from commonly reported quantiles in meta-analysis. Stat Methods Med Res. (2020) 29:2520–37. doi: 10.1177/0962280219889080
28. Sleutjes Am, J, Roeters van Lennep, JE, Kavousi, M, Aribas, E, Van Der Woude, CJ, and De Vries, AC. Increased risk of cardiovascular disease and high risk profiles compatible with metabolic syndrome in patients with inflammatory bowel disease: a cross-sectional analysis of matched cohorts. J Crohn's Colitis. (2022) 16:i586. doi: 10.1093/ecco-jcc/jjab232.805
29. Carrillo-Palau, M, Hernández-Camba, A, Hernández Alvarez-Buylla, N, Ramos, L, Alonso-Abreu, I, Hernández-Pérez, A, et al. Insulin resistance is not increased in inflammatory bowel disease patients but is related to non-alcoholic fatty liver disease. J Clin Med. (2021) 10:3062. doi: 10.3390/jcm10143062
30. Vrdoljak, J, Vilović, M, Živković, PM, Tadin Hadjina, I, Rušić, D, Bukić, J, et al. Mediterranean diet adherence and dietary attitudes in patients with inflammatory bowel disease. Nutrients. (2020) 12:1–14. doi: 10.3390/nu12113429
31. Brnić, D, Martinovic, D, Zivkovic, PM, Tokic, D, Tadin Hadjina, I, Rusic, D, et al. Serum adropin levels are reduced in patients with inflammatory bowel diseases. Sci Rep. (2020) 10:9264. doi: 10.1038/s41598-020-66254-9
32. Dragasevic, S, Stankovic, B, Kotur, N, Sokic-Milutinovic, A, Milovanovic, T, Lukic, S, et al. Metabolic syndrome in inflammatory bowel disease: association with genetic markers of obesity and inflammation. Metab Syndr Relat Disord. (2019) 18:31–8. doi: 10.1089/met.2019.0090
33. Sahin, M, Bobusoglu, O, Yetim, A, and Ates, F. Paraoxonase-1 and arylesterase levels in patients with ulcerative colitis. Arab J Gastroenterol. (2019) 20:14–8. doi: 10.1016/j.ajg.2019.01.009
34. Qiao, Y, Zhou, M, Shen, J, and Ran, Z. Bioelectrical impedance analysis for body composition and nutritional status in hospitalized patients with inflammatory bowel disease. Chin J Gastroenterol. (2019) 24:5–9.
35. Iwakawa, H, Fukui, T, Fukuwatari, T, Bamba, S, Sasaki, M, Tsujikawa, T, et al. Blood concentrations and renal clearance of water-soluble vitamins in outpatients with ulcerative colitis. Biomed Rep. (2019) 10:202–10. doi: 10.3892/br.2019.1191
36. Kang, EA, Han, K, Chun, J, Soh, H, Park, S, Im, JP, et al. Increased risk of diabetes in inflammatory bowel disease patients: a Nationwide population-based study in Korea. J Clin Med. (2019) 8:343. doi: 10.3390/jcm8030343
37. Aarestrup, J, Jess, T, Kobylecki, CJ, Nordestgaard, BG, and Allin, KH. Cardiovascular risk profile among patients with inflammatory bowel disease: a population-based study of more than 100 000 individuals. J Crohns Colitis. (2019) 13:319–23. doi: 10.1093/ecco-jcc/jjy164
38. Trejo-Vazquez, F, Garza-Veloz, I, Villela-Ramirez, GA, Ortiz-Castro, Y, Mauricio-Saucedo, P, Cardenas-Vargas, E, et al. Positive association between leptin serum levels and disease activity on endoscopy in inflammatory bowel disease: a case-control study. Exp Ther Med. (2018) 15:3336–44. doi: 10.3892/etm.2018.5835
39. Szczeklik, K, Mach, T, Cibor, D, Owczarek, D, Sapa, J, Papież, M, et al. Correlation of Paraoxonase-1 with the severity of Crohn's disease. Molecules. (2018) 23:2063. doi: 10.3390/molecules23102603
40. Grzybowska-Chlebowczyk, U, Wysocka-Wojakiewicz, P, Jasielska, M, Cukrowska, B, Więcek, S, Kniażewska, M, et al. Oxidative and antioxidative stress status in children with inflammatory bowel disease as a result of a chronic inflammatory process. Mediat Inflamm. (2018) 2018:1–7. doi: 10.1155/2018/4120973
41. Trzeciak-Jędrzejczyk, A, Makosiej, R, Kolejwa, M, Głowacka, E, and Czkwianianc, E. The role of adhesion molecules in inflammatory bowel disease in children. Assessment of the possible risk of cardiovascular complications. Przeglad Gastroenterol. (2017) 12:181–5. doi: 10.5114/pg.2017.70480
42. Cappello, M, Licata, A, Calvaruso, V, Bravatà, I, Aiello, A, Torres, D, et al. Increased expression of markers of early atherosclerosis in patients with inflammatory bowel disease. Eur J Intern Med. (2017) 37:83–9. doi: 10.1016/j.ejim.2016.10.004
43. Üstün, Y, Kilincalp, S, Çoban, Ş, Coşkun, Y, Yüksel, İ, Ongun, A, et al. Evaluation of early atherosclerosis markers in patients with inflammatory bowel disease. Med Sci Monit. (2016) 22:3943–50. doi: 10.12659/MSM.898160
44. Pac-Kożuchowska, E, Krawiec, P, Mroczkowska-Juchkiewicz, A, Pawłowska-Kamieniak, A, and Kominek, K. Inflammatory and lipid-associated markers of cardiovascular diseases in children with first exacerbation of inflammatory bowel disease. Med Sci Monit. (2016) 22:1534–9. doi: 10.12659/MSM.896116
45. Koutroumpakis, E, Ramos-Rivers, C, Regueiro, M, Hashash, JG, Barrie, A, Swoger, J, et al. Association between long-term lipid profiles and disease severity in a large cohort of patients with inflammatory bowel disease. Dig Dis Sci. (2016) 61:865–71. doi: 10.1007/s10620-015-3932-1
46. Aguilar-Tablada, TC, Navarro-Alarcón, M, Granados, JQ, Sánchez, CS, Rufián-Henares, JÁ, and Nogueras-Lopez, F. Ulcerative colitis and Crohn’s disease are associated with decreased serum selenium concentrations and increased cardiovascular risk. Nutrients. (2016) 8:780. doi: 10.3390/nu8120780
47. Wada, Y, Hisamatsu, T, Naganuma, M, Matsuoka, K, Okamoto, S, Inoue, N, et al. Risk factors for decreased bone mineral density in inflammatory bowel disease: a cross-sectional study. Clin Nutr. (2015) 34:1202–9. doi: 10.1016/j.clnu.2015.01.003
48. Theocharidou, E, Tellis, CC, Mavroudi, M, Soufleris, K, Gossios, TD, Giouleme, O, et al. Lipoprotein-associated phospholipase A2 and arterial stiffness evaluation in patients with inflammatory bowel diseases. J Crohns Colitis. (2014) 8:936–44. doi: 10.1016/j.crohns.2014.01.016
49. Fan, F, Galvin, A, Fang, L, White, DA, Moore, XL, Sparrow, M, et al. Comparison of inflammation, arterial stiffness and traditional cardiovascular risk factors between rheumatoid arthritis and inflammatory bowel disease. J Inflamm. (2014) 11:29. doi: 10.1186/s12950-014-0029-0
50. Principi, M, Mastrolonardo, M, Scicchitano, P, Gesualdo, M, Sassara, M, Guida, P, et al. Endothelial function and cardiovascular risk in active inflammatory bowel diseases. J Crohns Colitis. (2013) 7:e427–33. doi: 10.1016/j.crohns.2013.02.001
51. Akdoğan, RA, Durakoğlugil, ME, Kocaman, SA, Çiçek, Y, Durakoğlugil, T, Ergül, E, et al. Increased pulse wave velocity and carotid intima-media thickness in patients with ulcerative colitis. Dig Dis Sci. (2013) 58:2293–300. doi: 10.1007/s10620-013-2634-9
52. Yorulmaz, E, Adali, G, Yorulmaz, H, Ulasoglu, C, Tasan, G, and Tuncer, I. Metabolic syndrome frequency in inflammatory bowel diseases. Saudi J Gastroenterol. (2011) 17:376–82. doi: 10.4103/1319-3767.87177
53. Kuwabara, A, Nakase, H, Tsuji, H, Shide, K, Chiba, T, Inagaki, N, et al. Fat restriction is associated with impaired quality of life in patients with ulcerative colitis and Crohn's disease. Ulcers. (2011) 2011:1–5. doi: 10.1155/2011/594532
54. Sappati Biyyani, RSR, Putka, BS, and Mullen, KD. Dyslipidemia and lipoprotein profiles in patients with inflammatory bowel disease. J Clin Lipidol. (2010) 4:478–82. doi: 10.1016/j.jacl.2010.08.021
55. Mijac, DD, Janković, GL, Jorga, J, and Krstić, MN. Nutritional status in patients with active inflammatory bowel disease: prevalence of malnutrition and methods for routine nutritional assessment. Eur J Intern Med. (2010) 21:315–9. doi: 10.1016/j.ejim.2010.04.012
56. ROMANATO, G, SCARPA, M, ANGRIMAN, I, FAGGIAN, D, RUFFOLO, C, MARIN, R, et al. Plasma lipids and inflammation in active inflammatory bowel diseases. Aliment Pharmacol Ther. (2009) 29:298–307. doi: 10.1111/j.1365-2036.2008.03886.x
57. Scarpa, M, Romanato, G, Manzato, E, Ruffolo, C, Marin, R, Basato, S, et al. Restorative proctocolectomy for ulcerative colitis: impact on lipid metabolism and adipose tissue and serum fatty acids. J Gastrointest Surg. (2008) 12:279–87. doi: 10.1007/s11605-007-0380-z
58. Figler, M, Gasztonyi, B, Cseh, J, Horváth, G, Kisbenedek, AG, Bokor, S, et al. Association of n-3 and n-6 long-chain polyunsaturated fatty acids in plasma lipid classes with inflammatory bowel diseases. Br J Nutr. (2007) 97:1154–61. doi: 10.1017/S0007114507682956
59. Yılmaz, S, Bayan, K, Tüzün, Y, Batun, S, and Altıntaş, A. A comprehensive analysis of 12 thrombophilic mutations and related parameters in patients with inflammatory bowel disease: data from Turkey. J Thromb Thrombolysis. (2006) 22:205–12. doi: 10.1007/s11239-006-9032-5
60. Tajika, M, Matsuura, A, Nakamura, T, Suzuki, T, Sawaki, A, Kato, T, et al. Risk factors for vitamin D deficiency in patients with Crohn's disease. J Gastroenterol. (2004) 39:527–33. doi: 10.1007/s00535-003-1338-x
61. Koutroubakis, IE, Malliaraki, N, Vardas, E, Ganotakis, E, Margioris, AN, Manousos, ON, et al. Increased levels of lipoprotein (a) in Crohn's disease: a relation to thrombosis? Eur J Gastroenterol Hepatol. (2001) 13:1415–9. doi: 10.1097/00042737-200112000-00004
62. Hudson, M, Chitolie, A, Hutton, RA, Smith, MS, Pounder, RE, and Wakefield, AJ. Thrombotic vascular risk factors in inflammatory bowel disease. Gut. (1996) 38:733–7. doi: 10.1136/gut.38.5.733
63. Hakala, K, Vuoristo, M, and Miettinen, TA. Serum cholestanol, cholesterol precursors and plant sterols in different inflammatory bowel diseases. Digestion. (1996) 57:83–9. doi: 10.1159/000201318
64. Regöly-Mérei, A, Ferencz, A, Frenkl, R, Gergely, A, Zajkás, G, and Antal, M. Effect of fat and retinol loading on serum triglyceride and retinol levels in patients with ulcerative colitis. Nahrung. (1991) 35:21–6. doi: 10.1002/food.19910350106
65. Rutgeerts, P, Ghoos, Y, Vantrappen, G, and Fevery, J. Biliary lipid composition in patients with nonoperated Crohn's disease. Dig Dis Sci. (1986) 31:27–32. doi: 10.1007/BF01347906
66. Johansson, C, Rössner, S, Walldius, G, and Kollberg, B. Dyslipoproteinaemia after ileal resection in Crohn's disease. Digestion. (1979) 19:77–85. doi: 10.1159/000198327
67. Kisilevsky, R, and Manley, PN. Acute-phase serum amyloid a: perspectives on its physiological and pathological roles. Amyloid. (2012) 19:5–14. doi: 10.3109/13506129.2011.654294
68. Webb, NR. High-density lipoproteins and serum amyloid a (SAA). Curr Atheroscler Rep. (2021) 23:7. doi: 10.1007/s11883-020-00901-4
69. Banka, CL, Yuan, T, de Beer, MC, Kindy, M, Curtiss, LK, and de Beer, FC. Serum amyloid a (SAA): influence on HDL-mediated cellular cholesterol efflux. J Lipid Res. (1995) 36:1058–65. doi: 10.1016/S0022-2275(20)39863-1
70. Artl, A, Marsche, G, Pussinen, P, Knipping, G, Sattler, W, and Malle, E. Impaired capacity of acute-phase high density lipoprotein particles to deliver cholesteryl ester to the human HUH-7 hepatoma cell line. Int J Biochem Cell Biol. (2002) 34:370–81. doi: 10.1016/S1357-2725(01)00132-7
71. Han, CY, Tang, C, Guevara, ME, Wei, H, Wietecha, T, Shao, B, et al. Serum amyloid a impairs the anti-inflammatory properties of HDL. J Clin Invest. (2016) 126:266–81. doi: 10.1172/JCI83475
72. Catapano, AL, Pirillo, A, Bonacina, F, and Norata, GD. HDL in innate and adaptive immunity. Cardiovasc Res. (2014) 103:372–83. doi: 10.1093/cvr/cvu150
73. Anderson, HA, and Roche, PA. MHC class II association with lipid rafts on the antigen presenting cell surface. Biochim Biophys Acta. (2015) 1853:775–80. doi: 10.1016/j.bbamcr.2014.09.019
74. Norata, GD, Pirillo, A, Ammirati, E, and Catapano, AL. Emerging role of high density lipoproteins as a player in the immune system. Atherosclerosis. (2012) 220:11–21. doi: 10.1016/j.atherosclerosis.2011.06.045
75. Johannesen, CDL, Langsted, A, Mortensen, MB, and Nordestgaard, BG. Association between low density lipoprotein and all cause and cause specific mortality in Denmark: prospective cohort study. BMJ. (2021) 372:n422. doi: 10.1136/bmj.n422
76. Gong, J, Chen, Y, Jie, Y, Tan, M, Jiang, Z, Yuan, L, et al. U-shaped relationship of low-density lipoprotein cholesterol with risk of severe COVID-19 from a Multicenter pooled analysis. Front Cardiovasc Med. (2021) 8:604736. doi: 10.3389/fcvm.2021.604736
77. Wu, X, Zhou, L, Zhan, X, Wen, Y, Wang, X, Feng, X, et al. Low-density lipoprotein cholesterol and mortality in peritoneal Dialysis. Front Nutr. (2022) 9:910348. doi: 10.3389/fnut.2022.910348
78. Tedders, SH, Fokong, KD, McKenzie, LE, Wesley, C, Yu, L, and Zhang, J. Low cholesterol is associated with depression among US household population. J Affect Disord. (2011) 135:115–21. doi: 10.1016/j.jad.2011.06.045
79. Feng, Q, Wei, WQ, Chaugai, S, Leon, BGC, Mosley, JD, Leon, DAC, et al. Association between low-density lipoprotein cholesterol Levels and risk for Sepsis among patients admitted to the hospital with infection. JAMA Netw Open. (2019) 2:e187223. doi: 10.1001/jamanetworkopen.2018.7223
80. Netea, MG, Demacker, PN, Kullberg, BJ, Boerman, OC, Verschueren, I, Stalenhoef, AF, et al. Low-density lipoprotein receptor-deficient mice are protected against lethal endotoxemia and severe gram-negative infections. J Clin Invest. (1996) 97:1366–72. doi: 10.1172/JCI118556
81. Feingold, KR, Funk, JL, Moser, AH, Shigenaga, JK, Rapp, JH, and Grunfeld, C. Role for circulating lipoproteins in protection from endotoxin toxicity. Infect Immun. (1995) 63:2041–6. doi: 10.1128/iai.63.5.2041-2046.1995
82. Pallotti, F, Bergamini, C, Lamperti, C, and Fato, R. The roles of coenzyme Q in disease: direct and indirect involvement in cellular functions. Int J Mol Sci. (2021) 23:128. doi: 10.3390/ijms23010128
83. Lelli, JL, Drongowski, RA, Gastman, B, Remick, DG, and Coran, AG. Effects of coenzyme Q10 on the mediator cascade of sepsis. Circ Shock. (1993) 39:178–87.
84. Khovidhunkit, W, Kim, MS, Memon, RA, Shigenaga, JK, Moser, AH, Feingold, KR, et al. Effects of infection and inflammation on lipid and lipoprotein metabolism: mechanisms and consequences to the host. J Lipid Res. (2004) 45:1169–96. doi: 10.1194/jlr.R300019-JLR200
85. Ettinger, WH, Varma, VK, Sorci-Thomas, M, Parks, JS, Sigmon, RC, Smith, TK, et al. Cytokines decrease apolipoprotein accumulation in medium from hep G2 cells. Arterioscler Thromb. (1994) 14:8–13. doi: 10.1161/01.ATV.14.1.8
86. Jin, X, Yang, S, Lu, J, and Wu, M. Small, dense low-density lipoprotein-cholesterol and atherosclerosis: relationship and therapeutic strategies. Front Cardiovasc Med. (2021) 8:804214. doi: 10.3389/fcvm.2021.804214
87. Feingold, KR, and Grunfeld, C. (2000) The effect of inflammation and infection on lipids and lipoproteins. In: KR Feingold, B Anawalt, MR Blackman, A Boyce, G Chrousos, and E Corpas, et al. (Eds.) Endotext. South Dartmouth, MA: MDText.com.
Keywords: inflammatory bowel disease, Cronh’s disease, ulcerative disease, serum lipids, meta-analysis
Citation: Chen H, Li W, Hu J, Xu F, Lu Y, Zhu L and Shen H (2023) Association of serum lipids with inflammatory bowel disease: a systematic review and meta-analysis. Front. Med. 10:1198988. doi: 10.3389/fmed.2023.1198988
Edited by:
Yan Chun Li, The University of Chicago, United StatesReviewed by:
Evanthia Tourkochristou, University of Patras, GreeceFederica Rubbino, Humanitas Research Hospital, Italy
Copyright © 2023 Chen, Li, Hu, Xu, Lu, Zhu and Shen. This is an open-access article distributed under the terms of the Creative Commons Attribution License (CC BY). The use, distribution or reproduction in other forums is permitted, provided the original author(s) and the copyright owner(s) are credited and that the original publication in this journal is cited, in accordance with accepted academic practice. No use, distribution or reproduction is permitted which does not comply with these terms.
*Correspondence: Hong Shen, shenhong999@njucm.edu.cn; Lei Zhu, zhulei5100@njcm.edu.cn
†These authors have contributed equally to this work