Determination of Thermal Expansion, Defect Formation Energy, and Defect-Induced Strain of α-U Via ab Initio Molecular Dynamics
 Benjamin Beeler
 Khadija Mahbuba
 Yuhao Wang
 Andrea Jokisaari2
- 1Department of Nuclear Engineering, North Carolina State University, Raleigh, NC, United States
- 2Idaho National Laboratory, Idaho Falls, ID, United States
- 3Department of Nuclear Engineering and Radiological Sciences, University of Michigan, Ann Arbor, MI, United States
Uranium (U) is often alloyed with molybdenum (Mo) or zirconium (Zr) in order to stabilize its high-temperature body-centered cubic phase for use in nuclear reactors. However, in all metallic fuel forms, the α phase of U remains in some fraction. This phase decomposition due to temperature or compositional variance can play an outsized role on fuel performance and microstructural evolution. Relatively little is known about fundamental point defect properties in α-U at non-zero temperatures, from either computational or experimental studies. This work performs the first thorough evaluation of the α phase of U via ab initio molecular dynamics (AIMD). A number of thermophysical properties are calculated as a function of temperature, including equilibrium lattice parameters, thermal expansion, and heat capacity. These results indicate a two-region behavior, with the transition at 400 K. The thermal expansion/contraction in the a/b direction occurs rapidly from 100 up to 400 K, after which a more linear and gradual change in the lattice constant takes place. The volumetric expansion matches experiments quantitatively, but the individual lattice constant expansion only matches experiments qualitatively. Point defect formation energies and induced lattice strains are also determined as a function of temperature, providing insight on defect populations and the fundamentals of irradiation growth in α-U. Interstitials induce significantly more strain than vacancies, and the nature of that strain is highly dependent on the individual lattice directions. The direction of point defect-induced lattice strain is contrary to the irradiation growth behavior of α-U. This work shows that isolated point defects cannot be the primary driving force responsible for the significant irradiation-induced growth of α-U observed experimentally.
1 Introduction
Uranium (U) is an actinide element exhibiting delocalized f-electrons that exists in three solid phases: α (face-centered orthorhombic), β (tetragonal with a 30 atom unit cell) and γ (body-centered cubic) (Yoo et al., 1998). Below 935 K, U exists in the α phase (Söderlind, 1998). Although uranium is alloyed with Mo or Zr in order to stabilize the preferred body-centered cubic phase at lower temperatures, most notably for nuclear fuel applications, the α phase persists either in decomposed phase regions (as in the case of U-Mo fuel) or in the low-temperature periphery of the fuel slug (as in the case of U-Zr type fuel). Because of its unique crystal structure, α-U exhibits anisotropic material properties, for example, thermal expansion (Lloyd and Barrett, 1966) and elastic constants (Fisher and McSkimin, 1958). One relevant behavior is the anisotropic irradiation growth of α-U (Leggett et al., 1963), which can lead to the tearing along grain boundaries and the formation of crystallographically aligned pores. These porosities are believed to form due to the interaction of lattice defects and stresses induced by irradiation and a temperature gradient and result in significant volume changes of α-U (Paine and Kittel, 1958; Leggett et al., 1963). A full understanding of the relationship between point defects, lattice strains, and the generation of pores, has not been established either experimentally or via computational methods. However, a number of computational studies have been performed into fundamental properties of uranium (Jokisaari, 2020).
Density functional theory (DFT) is an essential part of computational materials science, addressing a variety of problems in materials design and processing on a fundamental level. Several examinations of U via DFT have been performed on its orthorhombic and body-centered cubic (bcc) structures. (Taylor 2008) used a projector augmented wave (PAW) pseudo-potential to calculate the lattice constants of α-U and γ-U along with the bulk modulus of both phases and the surface energy of a single surface in α-U. (Xiang et al., 2008) also utilized a PAW pseudo-potential to perform an analysis of lattice constants in the α and γ phases, as well as an analysis of defects in γ-U. Beeler, et al. calculated the lattice constants and elastic constants of α, β, and γ-U (Beeler et al., 2013), in addition to the point defect properties in both α and γ-U (Beeler et al., 2010). (Huang and Wirth, 2011; Huang and Wirth ,2012) calculated intrinsic and extrinsic point defect formation energies and migration barriers in α-U. These DFT investigations showed a general, if imperfect, agreement with the experimental bulk moduli, lattice and elastic constants, and vacancy formation energy (Barrett et al., 1963; Matter et al., 1980; Yoo et al., 1998).
Key areas lacking from the DFT-based literature on α-U include an analysis of temperature-dependent bulk properties, including thermal expansion and heat capacity, and temperature-dependent defect properties. Extrapolation of 0 K properties to compare to elevated temperature experiments can be ill-advized, particularly for complex crystal structures or for point defects. However, ab initio molecular dynamics (AIMD) allows for quantum mechanical-based calculations to be performed at non-zero temperatures. AIMD has been utilized to study a variety of systems including liquid phase diffusion in Al-Si (Manga and Poirier, 2018), the adsorption energy of Fe on TiN surfaces (Wang et al., 2010), NaCl dissolution in water (Timko et al., 2010) and finite temperature phonon dispersion curves in bcc Zr and bcc (Li Hellman et al., 2011). Hood et al. (2008) have previously utilized AIMD to study the equation of state of U and the variation in density of states for the liquid phase of U at two unique temperatures. Hood, et al. utilized a unique pseudo-potential that was presented in that same manuscript (Hood et al., 2008). Söderlind et al. (2012) utilized self-consistent ab initio lattice dynamics (SCAILD) to study the high-temperature stabilization of the γ-U phase by calculating phonon modes at 1,100 K. There have been several investigations of the free energy via the temperature-dependent effective potential (TDEP) technique (Hellman et al. 2013; Bouchet and Bottin, 2017; Kruglov et al., 2019; Castellano et al., 2020; Ladygin et al., 2020), and one recent AIMD investigation into the defect formation energies in γ-U at high temperatures (Beeler et al., 2020). Despite numerous investigations into metallic uranium, AIMD has not been deployed to study temperature-dependent properties of α-U, such as thermal expansion or defect formation energies.
In this work, AIMD simulations are performed to calculate the equilibrium volume of α-U as a function of temperature. Utilizing these equilibrium volumes, the three lattice constants of α-U are determined, yielding anisotropic thermal expansion calculations. Additionally, point defect formation energies for interstitials and vacancies are calculated as a function of temperature. The lattice strain from the introduction of these point defects is calculated, providing insight into the fundamental stages of irradiation growth. This is the first AIMD investigation of point defects in α-U.
2 Materials and Methods
Systems are investigated using the Vienna ab initio Simulation Package (VASP) (Kresse and Hafner, 1993; Kresse and Hafner, 1994; (Kresse and Fürthmuller, 1996a; Kresse and Fürthmuller, 1996b). The projector augmented wave (PAW) method (Blöchl, 1994; Kresse and Joubert, 1999) is utilized within the density functional theory (Hohenberg and Kohn, 1964; Kohn and Sham 1965) framework. Calculations are performed using the Perdew-Burke-Ernzerhof (PBE) (Perdew et al., 1996; Perdew et al., 1997) generalized gradient approximation (GGA) density functional implementation for the description of the exchange-correlation. A uranium PAW pseudo-potential with the 6s26p65f36d17s2 valence electronic configuration and a core represented by [Xe, 5d, 4f] is utilized. Methfessel and Paxton’s smearing method (Methfessel and Paxton 1989) of the first order is used with a width of 0.1 eV to determine the partial occupancies for each wavefunction. A (Monkhorst and Pack, 1976) 1 × 1 × 1 k-point mesh was utilized for Brillouin zone sampling. Uranium is assumed to be non-magnetic, in accordance with both experiments (Lide, 2000) and previous simulations (Beeler et al., 2013), and as such calculations are non-spin-polarized. The Hubbard U term is not applied to the f electrons, in accordance with previous computational studies that utilized DFT on α-U (Taylor, 2008; Huang and Wirth, 2011; Huang and Wirth, 2012; Beeler et al., 2013). The precision is set to normal and the energy cutoff is increased to 300 eV. The electronic self-consistent loop exit criterion is set to 10−4 and the precision for projectors in real space is increased to −10−4. A 180 atom supercell (5 × 3 × 3 unit cells) is utilized for all simulations. Such a supercell is sufficiently large to preclude defect-defect interactions (Huang and Wirth, 2011). Dynamics were carried out in the NpT ensemble with Parinello-Rahman dynamics and a Langevin thermostat to control temperature. The temperature range investigated is from 100 to 800 K, in increments of 100 K, to span nearly the entire range of stability of the α phase of U. The Langevin friction coefficient for both the atomic and lattice degrees-of-freedom was set to 5 ps−1, with a fictitious mass for the lattice degrees of freedom of 500 amu. The timestep is set to 2.0 fs, and the initial structures are equilibrated at the target temperature for 8 ps. The trajectories of the total supercell energy, pressure, and individual lattice vectors are analyzed as a function of timestep to ensure that an equilibrated state has been reached and each of these quantities is oscillating around a given value, with the pressure oscillating around zero. Subsequently, the simulations are further equilibrated for 2000 timesteps (4 ps) for the determination of equilibrium properties. In order to obtain average properties over the ab initio molecular dynamics simulation, the energies and lattice constants for the final 1500 timesteps (3 ps) are extracted and averaged. To ensure statistical significance of the results, ten unique simulations are performed for each simulation setup. An example trajectory of the individual supercell lattice constants as a function of time at 300 K is shown in Figure 1. The standard deviation in the a, b, and c equilibrium lattice constants from this single simulation are 0.01, 0.02, and 0.01 Å, respectively. It should be emphasized that this was a single simulation, and ten such simulations were performed to obtain the averaged equilibrium structures and energies. Error bars are excluded from figures in the results that pertain to lattice constants, due to the small deviations observed in the dataset.
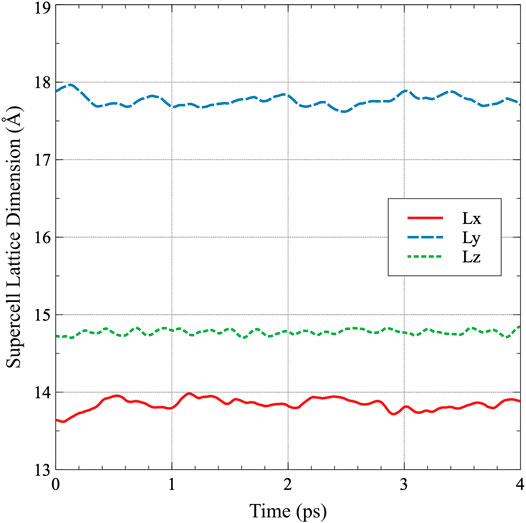
FIGURE 1. The supercell lattice dimensions as a function of time for α-U. Each dimension is averaged over the final 3 ps to obtain the average lattice constant in the simulation.
The thermal expansion is calculated both for individual lattice constants, and as a volume averaged value, viaEq. 1:
where α is the thermal expansion, and L is the length of the individual lattice constant or averaged lattice constant (cube root of the volume) at a given temperature, and L0 is the reference length at a given temperature. The formation energy of point defects is calculated viaEq. 2:
where E* is the energy of a system with a defect (with n ± atoms), n is the number of atoms in the defect-free system and E0 is the energy of a defect-free system with n atoms. Eq. 2 utilizes (n + 1) for interstitials and (n−1) for vacancies. The molar heat capacity is determined from Eq. 3:
where H is the enthalpy (potential plus kinetic energy), T is the temperature, and it is emphasized that this is determined for a constant pressure, which in these simulations is zero pressure. The total heat capacity is a sum of the lattice (Eq. 3) and the electronic components of the heat capacity. The electronic heat capacity coefficient (
3 Results
3.1 Equilibrium Properties of α-U
The equilibrium lattice constants at 300 K were calculated to be: a = 2.78 Å, b = 5.91 Å, and c = 4.93 Å. These results compare very favorably to the experimental literature [a = 2.85Å, b = 5.87Å, and c = 4.96Å (Lawson et al., 1988)], with the largest deviation observed for the a lattice constant at a magnitude of approximately 2.5%. Some deviation is not unexpected, as it has been shown that DFT calculations do not always exactly match the experimental findings, particularly for the lattice constant. However, these results are in accordance with previously computational investigations of α-U performed at 0 K, when thermal expansion is taken into account (Huang and Wirth, 2011; (Beeler et al., 2013). The complete data for equilibrium lattice constants as calculated in this work is included in Supplementary Table A1.
The normalized lattice constants as a function of temperature are shown in Figure 2. Each lattice constant is normalized to its determined value at 100 K, which is the lowest temperature analyzed. Thermal expansion occurs in both the a and c directions, while thermal contraction occurs in the b direction, as has been previously experimentally observed (Touloukian et al., 1975). The recommended directional linear thermal expansion curves from (Touloukian et al., 1975) are included as a comparison in Figure 3. Touloukian summarized 48 individual experiments on both single and polycrystalline samples and provided a recommended tabular fit for each a, b, c, and volumetric thermal expansion. These experiments did not all necessarily quantify their uncertainty, however, Touloukian stated that the recommended values are considered accurate to within ± 5%. The data in Figure 3 utilizes 300 K as the reference point for both the AIMD data and the experimental data, and as such, the change in length at 300 K is zero. It can be observed that the AIMD predicted thermal expansion in the a direction is significantly greater than that determined from experiment. Similarly, the amount of contraction in the b direction predicted from AIMD is significantly greater than that observed in experiments. However, the c direction exactly matches the linear thermal expansion determined from experiments. Qualitatively, all of the behaviors are identical, with the a and b directions expressing a more extreme expansion/contraction behavior. The source of the deviations from experiment is currently unknown. A comparison of the elastic constants calculated at 0 K (Beeler et al., 2013)compared to the experimentally determined elastic constants (Fisher and McSkimin, 1958) yielded no obvious discrepancies that would point to the specific observed trends in the thermal expansion as a function of temperature. The DFT-predicted elastic constants generally overestimate the experimental elastic constants, including all of C11, C22, C33, and the bulk modulus, and do not imply the existence of exaggerated swelling/contraction in the a/b directions.
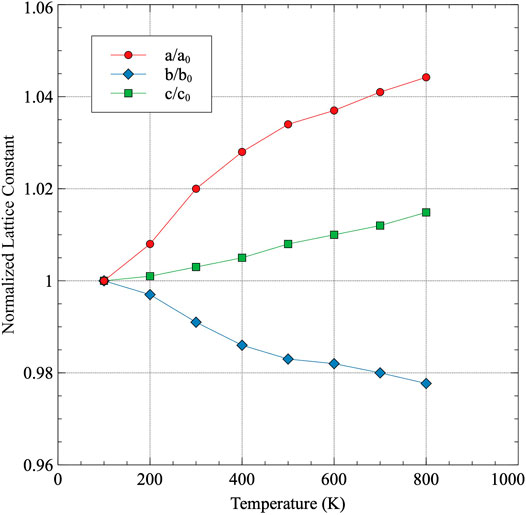
FIGURE 2. The normalized lattice constants as a function of temperature for α-U. Each lattice constant is normalized to its value at 100 K.
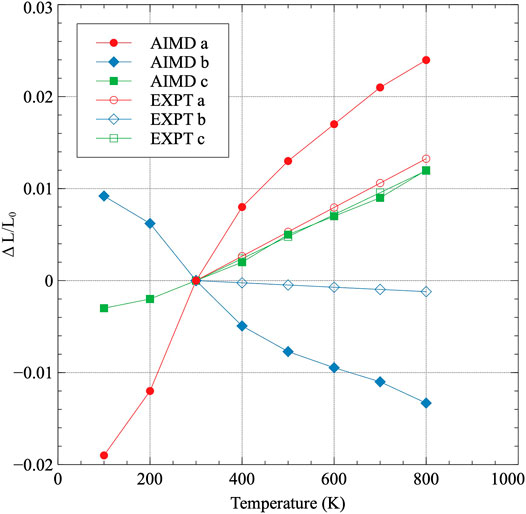
FIGURE 3. The linear thermal expansion coefficient for each lattice constant in α-U. Thermal expansion is normalized to 300 K, which is the lowest temperature in the experimental data Touloukian et al. (1975).
The volume-averaged linear thermal expansion is calculated and compared to a different set of experimental results from (Touloukian et al., 1975) in Figure 4. The volume-averaged linear thermal expansion utilizes the cube-root of the volume at each temperature of interest. Interestingly, the data from AIMD nearly exactly matches the experimental results for volumetric-averaged linear thermal expansion, with only slight deviations presenting above 600 K. Thus, despite the differences in the individual components of thermal expansion in α-U, which are somewhat substantial, the cumulative effect on total volume expansion reproduces the experimental observations.
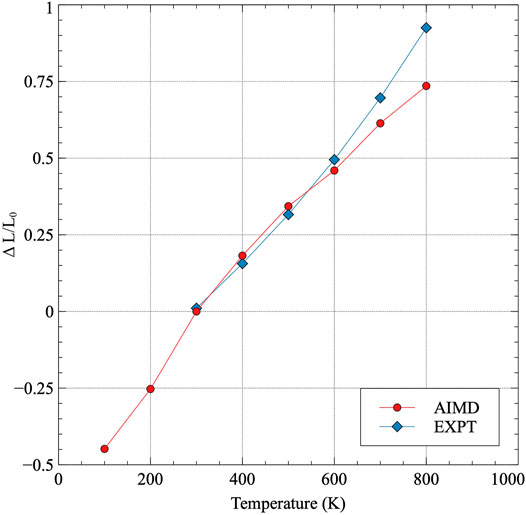
FIGURE 4. Volume-averaged linear thermal expansion in α-U. Thermal expansion is taken with respect to 300 K and compared to experimental results Touloukian et al. (1975).
The total constant pressure heat capacity is determined from a summation of Eq. 3 and the electronic heat capacity contribution as determined by experiments, and is plotted in Figure 5. The complete heat capacity data as calculated in this work is included in Supplementary Table A2. Data points are shown at intermediate temperatures, as the formalism in Eq. 3 assumes effectively a constant value of Cp over the temperature range. Thus, utilizing data points at 100 and 200 K, for example, yields a value of Cp at 150 K in this work. Experimental data is only reported for room temperature and upwards, and the agreement with the AIMD is generally excellent. The maximum deviation is observed at 750 K, where the AIMD results under-predict the magnitude of Cp by approximately 11%. At lower temperatures, the deviation can be less than 5%. Thus, while the magnitude of the heat capacity is generally the same, it appears that the experimentally observed heat capacity is more sensitive to temperature, showing a total change from 250 to 750 K of 17 J/mol-K, while AIMD only predicts an increase of 11 J/mol-K over this temperature range. Sources of error between the experimental measurements and computational calculations can include impurities in the material, effects from underlying microstructure, defect concentrations, inaccuracies in the fundamental computational theories, etc. Thus, while there is not exact agreement over the entire temperature range, the correlation between the AIMD results and experiment is considered quite good.
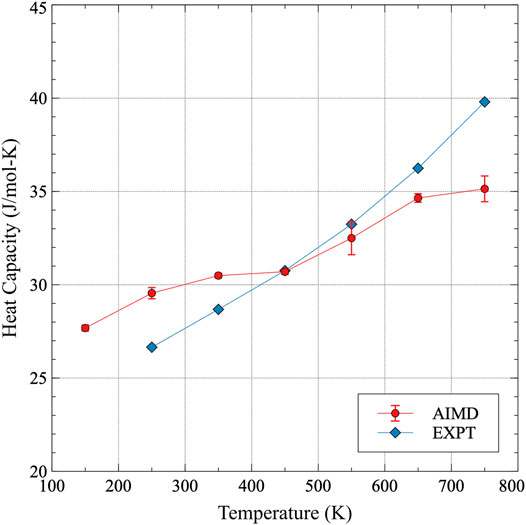
FIGURE 5. The constant pressure heat capacity of α-U from 100 to 800 K. Results from this work are compared to experimental results from Konings and Benes (2010). Error bars indicate twice the standard error of the AIMD dataset.
3.2 Point Defects in α-U
The point defect formation energy of interstitials and vacancies in α-U is shown in Figure 6 and included in Supplementary Table A3. The defect formation energy for both types of defects tends to slightly decrease with increasing temperature until approximately 400 K. Above 400 K, an increase in the defect formation energy with increasing temperature is observed. The relative magnitudes of the defect formation energies with respect to one another are near-constant across the entire temperature range investigated, with the average interstitial formation energy (3.4 eV) about 2.3 times the average vacancy formation energy (1.46 eV). Error bars shown in Figure 6 are twice the standard error, where the standard error for formation energies is defined as
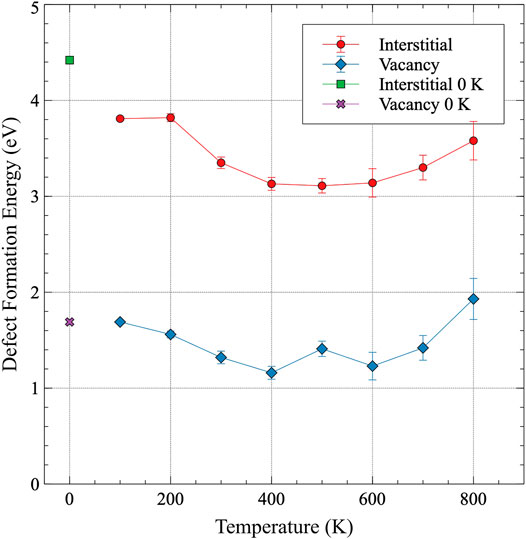
FIGURE 6. The formation energy of an interstitial and a vacancy in α-U as a function of temperature. The defect formation energies from previous DFT work are included for comparison Huang and Wirth (2011).
where
The introduction of a defect and relaxation in an NpT ensemble allows for the analysis of volume changes due to individual point defects. These volume changes are reported as a function of temperature in Figure 7, with error bars included as twice the standard deviation of the dataset. The defect-induced strains are also included in Supplementary Table A4. For interstitials, there exist two distinct regimes in the defect-induced strain environment, with 400 K serving as the demarcation temperature. Below 400 K, strain is relatively large and positive (lattice expansion) in the a direction, and relatively large and negative (lattice compression) for the b direction. The magnitudes of those strains decrease with increasing temperature up to 400 K, above which they maintain a relatively fixed value, with some statistical fluctuation. It is unknown whether the deviation at 600 K is due to some distinct behavioral changes, or is simply the result of thermal noise. However, data points at 600 K generally remain within the general trend of the dataset. The c lattice constant exhibits very slight positive strain across the entire temperature range, with no obvious changes in behavior. For vacancies, the general magnitude of the strain is significantly less than that observed for interstitials, with the maximum strain of −0.5% observed at 800 K for the b lattice constant. While it is more difficult to discern trends in the vacancy strain as a function of temperature, several pieces of information can be readily extracted. The c lattice constant displays no observed strain from vacancies at any temperature. For the a and b lattice constants, opposite trends present themselves above 400 K, in that the a lattice constant strain increases with increasing temperature and the b lattice constant strain decreases with increasing temperature. In a general sense, the strain behavior of defects is as expected, in that interstitials yield a lattice expansion, while vacancies produce lattice contraction. However, the manner in which those volumetric averages are produced is quite complex and is significantly temperature-dependent.
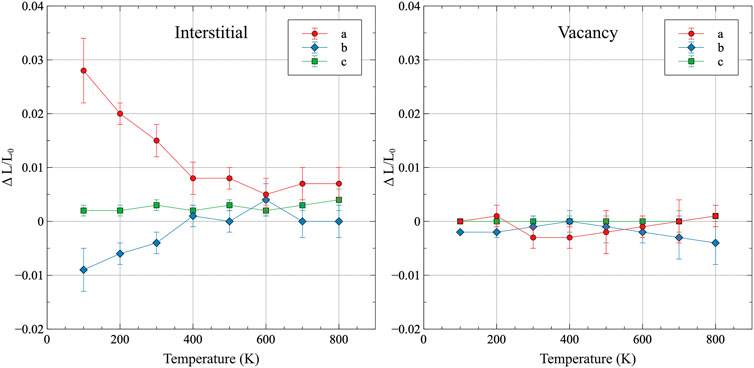
FIGURE 7. The lattice strain induced from an interstitial or vacancy in α-U as a function of temperature, taken with respect to the equilibrium volume at that given temperature. Error bars indicate twice the standard deviation of the dataset.
4 Discussion
This work indicates several lattice and volume effects that are strongly dependent upon the temperature of the system. Excepting the heat capacity, all of these calculated properties seem to indicate two regions of behavior, one below 400 K and one above 400 K. Also, it should be re-emphasized that the heat capacity utilized an experimental data point for the determination of the electronic heat capacity. Thus, from the purely computationally obtained data, there are differences in lattice constant, defect-induced lattice strain, and defect formation energy, in these two temperature regimes. To briefly summarize, thermal expansion/contraction in the a/b direction occurs rapidly from 100 up to 400 K, after which a more linear and gradual change in the lattice constant takes place. Defect formation energies decrease in magnitude up to 400 K, above which they tend to slightly increase. Defect lattice strains for interstitials decrease/increase in the a/b direction up to 400 K, above which they maintain essentially the same magnitude. A similar trend in defect lattice strains for vacancies is present, but the magnitude is significantly less and potentially swamped by thermal fluctuations, and thus the statistical certainty of the finding is reduced.
In an attempt to identify underlying changes in the atomic and electronic structure as a function of temperature, two additional analyses were performed. The first was a coordination analysis, in which the radial distribution function (rdf) was constructed for a snapshot of the equilibrated α-U structure at 100, 400, and 800 K. If a modification in the bond lengths is occurring that can yield differences in structure, such a modification would present itself as peak shifts in the rdf. This coordination analysis is presented in Figure 8, but yielded no discernible trends, and the general bond length and peak broadening confirm what is observed in Figures 2, 3 outlining thermal expansion. Specifically, there is general peak broadening with temperature, and the second nearest neighbor peak (in the b direction) slightly shifts toward a smaller distance. The second analysis involved the electronic density of states (DOS). If the character of valence electrons participating in the bonding is changing as a function of temperature, the electronic DOS would identify such changes, and the electronic DOS is known to slightly change as a function of the phase of uranium Beeler et al. (2013). The electronic DOS was calculated, and only minimal variation in the electronic structure was observed as a function of temperature. There was no indication that two regions of electronic structure behavior exist for the α phase. Due to the lack of identifiable structure variation as a function of temperature, likely due to statistical noise in the sampling. These results are not displayed here, as the DOS can be obtained from the literature Hood et al. (2008), Beeler et al. (2013). The underlying cause of the apparent two-region behavior is unclear and warrants further computational investigation, in addition to experimental studies on high-purity uranium to either confirm or refute the findings in this work. It should be emphasized that these results are statistically significant, but are still susceptible to inherent errors in the modeling methodology, such as the inability for DFT to predict the lattice and elastic constants of α-U with sufficient accuracy at 0 K.
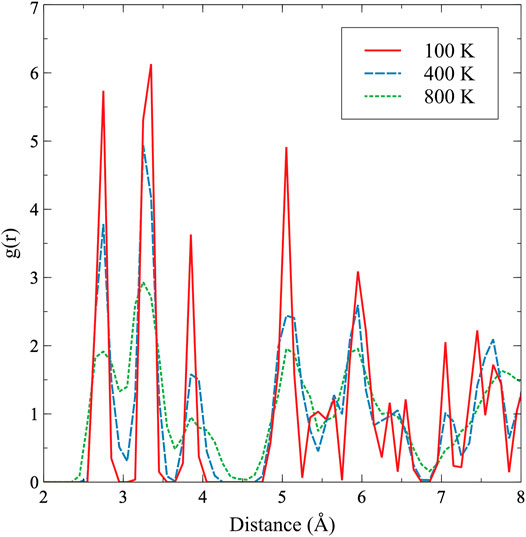
FIGURE 8. The radial distribution function in α-U at 100, 400, and 800 K.
This work has identified that individual point defects can produce somewhat significant lattice strain, but it is unknown if such point defects could be responsible for experimentally observed macroscopic shape change. Comparison of the calculated direction of the defect-induced strains to the experimental literature on irradiation growth provides contradictory information. Paine and Kittel (1958) and Loomis and Gerber (1968) both investigated dimensional change of single-crystal uranium under irradiation. Their findings were in general agreement with one another, and showed a contraction of the bulk crystal in the a direction, an expansion in the b direction, and no change in the c direction. While the AIMD results of point defect-induced strains presented here agree with the lack of dimensional change in the c direction, exactly the opposite behavior is observed in Figure 7 for the a and b directions. This work showed that interstitials are the dominant strain inducers, producing expansion in the a direction and contraction in the b direction. Due to the relatively large induced strains from interstitials, it is expected that these types of point defects would display strongly anisotropic diffusion. Given that isolated point defects lead to the opposite trends from those observed experimentally, it is possible that defect clusters or defect loops display different strain behaviors than individual point defects, and are the features responsible for irradiation growth in α-U. Such research is beyond the scope of AIMD, which is currently sufficiently computationally expensive to exclude the possibility of analysis of extended defects. Thus, classical molecular dynamics simulations can be performed and validated against the work presented here. Ideally, in addition to further computational studies, the experimental results from over 60 years ago should be reproduced and modern characterization methods applied to extract fundamental defect populations, densities, and orientations.
5 Conclusion
In this study, AIMD simulations were performed to calculate temperature-dependent properties of the α phase of U from 100 to 800 K. The thermal expansion of each lattice constant was analyzed and compared to the experimental literature. Although the general direction of thermal expansion corresponded to the experimental findings (positive in a and c, negative in b), the magnitudes of coefficient of thermal expansion for the a and b directions was greater than that observed experimentally. However, the volumetric expansion corresponded nearly exactly to the experimental findings in the literature. The heat capacity was calculated as a function of temperature and showed a general agreement with experimental results, although the computationally determined heat capacity was slightly less sensitive to temperature. Variation in point defect formation energies was determined, with an average interstitial formation energy of 3.40 eV, and an average vacancy formation energy of 1.46 eV, over the entire temperature range. Lattice strains resulting from point defects were determined, showing that interstitials induce significantly more strain than vacancies, and the nature of that strain is highly dependent on the individual lattice directions, where the a direction expands and the b contracts due to the introduction of an interstitial. Finally, all of these results seem to indicate a two-region behavior, with the transition at 400 K. The thermal expansion/contraction in the a/b direction occurs rapidly from 100 up to 400 K, after which a more linear and gradual change in the lattice constant takes place. Defect formation energies decrease in magnitude up to 400 K, above which they tend to slightly increase. Defect lattice strains for interstitials decrease/increase in the a/b direction up to 400 K, above which they maintain essentially the same magnitude. Coordination and electronic structure investigations provided no insight into the possible cause of this potential transition in behavior.
This work has shown that isolated point defects cannot be the primary driving force responsible for the significant irradiation-induced growth of α-U observed experimentally. This work can be utilized as the basis for mesoscale simulations that take into account defect populations, defect diffusion, and defect strain behaviors. It is emphasized that additional computational work utilizing classical molecular dynamics on extended defects should be performed, in addition to experimental irradiation and characterization, to further elucidate the underlying phenomena governing the interactions of point defects with the α-U crystal structure.
Copyright
Figures, tables, and images will be published under a Creative Commons CC-BY license and permission must be obtained for use of copyrighted material from other sources (including re-published/adapted/modified/partial figures and images from the internet). It is the responsibility of the authors to acquire the licenses, to follow any citation instructions requested by third-party rights holders, and cover any supplementary charges.
Data Availability Statement
The raw data supporting the conclusions of this article will be made available by the authors, without undue reservation.
Author Contributions
BB: Conceptualization, Methodology, Software, Validation, Formal analysis, Writing-original draft; KM: Methodology, Conceptualization, Writing - Review and Editing; YW: Writing - Review and Editing, Conceptualization, Methodology; AJ: Supervision, Writing - Review and Editing, Conceptualization.
Funding
This work is supported through the INL Laboratory Directed Research and Development (LDRD) Program under DOE Idaho Operations Office Contract DE-AC07-05ID14517. This manuscript has been authored by Battelle Energy Alliance, LLC with the U.S. Department of Energy. The publisher, by accepting the article for publication, acknowledges that the U.S. Government retains a nonexclusive, paid-up, irrevocable, worldwide license to publish or reproduce the published form of this manuscript, or allow others to do so, for U.S. Government purposes. This research made use of the resources of the High-Performance Computing Center at Idaho National Laboratory, which is supported by the Office of Nuclear Energy of the U.S. Department of Energy and the Nuclear Science User Facilities under Contract No. DE-AC07-05ID14517.
Conflict of Interest
This study received funding from Battelle Energy Alliance, LLC. The funder was not involved in the study design, collection, analysis, interpretation of data, the writing of this article or the decision to submit it for publication.
The authors declare that the research was conducted in the absence of any commercial or financial relationships that could be construed as a potential conflict of interest.
Supplementary Material
The Supplementary Material for this article can be found online at: https://www.frontiersin.org/articles/10.3389/fmats.2021.661387/full#supplementary-material
References
Barrett, C. S., Mueller, M. H., and Hitterman, R. L. (1963). Crystal Structure Variations in Alpha Uranium at Low Temperatures. Phys. Rev. 129, 625–629. doi:10.1103/physrev.129.625
Beeler, B., Andersson, D., Jiang, C., and Zhang, Y. (2020). Ab Initio molecular Dynamics Investigation of point Defects in Gamma-U. J. Nucl. Mater. 545, 152714. doi:10.1016/j.jnucmat.2020.152714
Beeler, B., Deo, C., Baskes, M., and Okuniewski, M. (2013). First Principles Calculations of the Structure and Elastic Constants of α, β and γ Uranium. J. Nucl. Mater. 433, 143–151. doi:10.1016/j.jnucmat.2012.09.019
Beeler, B., Good, B., Rashkeev, S., Deo, C., Baskes, M., and Okuniewski, M. (2010). First Principles Calculations for Defects in U. J. Phys. Condens. Matter 22, 505703. doi:10.1088/0953-8984/22/50/505703
Blöchl, P. E. (1994). Projector Augmented-Wave Method. Phys. Rev. B 50, 17953–17979. doi:10.1103/physrevb.50.17953
Bouchet, J., and Bottin, F. (2017). High-temperature and High-Pressure Phase Transitions in Uranium. Phys. Rev. B 95, 054113. doi:10.1103/physrevb.95.054113
Castellano, A., Bottin, F., Dorado, B., and Bouchet, J. (2020). Thermodynamic Stabilization of γ-u-mo Alloys: Effect of Mo Content and Temperature. Phys. Rev. B 101, 184111. doi:10.1103/physrevb.101.184111
Fisher, E. S., and McSkimin, H. J. (1958). Adiabatic Elastic Moduli of Single Crystal Alpha‐Uranium. J. Appl. Phys. 29, 1473–1484. doi:10.1063/1.1722972
Hellman, O., Abrikosov, I. A., and Simak, S. I. (2011). Lattice Dynamics of Anharmonic Solids from First Principles. Phys. Rev. B 84, 180301. doi:10.1103/physrevb.84.180301
Hellman, O., Steneteg, P., Abrikosov, I., and Simak, S. (2013). Temperature Dependent Effective Potential Method for Accurate Free Energy Calculations of Solids. Phys. Rev. B 87, 104111. doi:10.1103/physrevb.87.104111
Hohenberg, P., and Kohn, W. (1964). Inhomogeneous Electron Gas. Phys. Rev. 136, B864–B871. doi:10.1103/physrev.136.b864
Hood, R., Yang, L., and Moriarty, J. (2008). Quantum Molecular Dynamics Simulations of Uranium at High Pressure and Temperature. Phys. Rev. B 78, 024116. doi:10.1103/physrevb.78.024116
Huang, G.-Y., and Wirth, B. D. (2012). First-principles Study of Bubble Nucleation and Growth Behaviors in α U-Zr. J. Phys. Condens. Matter 24, 415404. doi:10.1088/0953-8984/24/41/415404
Huang, G.-Y., and Wirth, B. D. (2011). First-principles Study of Diffusion of Interstitial and Vacancy in α U-Zr. J. Phys. Condens. Matter 23, 205402. doi:10.1088/0953-8984/23/20/205402
Jokisaari, A. M. (2020). Irradiation-induced Internal Stresses in Polycrystalline α-uranium: a Mesoscale Mechanical Approach. Comput. Mater. Sci. 176, 109545. doi:10.1016/j.commatsci.2020.109545
Kohn, W., and Sham, L. J. (1965). Self-consistent Equations Including Exchange and Correlation Effects. Phys. Rev. 140, A1133–A1138. doi:10.1103/physrev.140.a1133
Konings, R., and Benes, O. (2010). The Thermodynamic Properties of the F-Elements and Their Compounds. I. The Lanthanide and Actinide Metals. J. Phys. Chem. Reference Data 39, 043102. doi:10.1063/1.3474238
Kresse, G., and Furthmüller, J. (1996a). Efficiency of Ab-Initio Total Energy Calculations for Metals and Semiconductors Using a Plane-Wave Basis Set. Comput. Mater. Sci. 6, 15–50. doi:10.1016/0927-0256(96)00008-0
Kresse, G., and Furthmüller, J. (1996b). Efficient Iterative Schemes Forab Initiototal-Energy Calculations Using a Plane-Wave Basis Set. Phys. Rev. B 54, 11169–11186. doi:10.1103/physrevb.54.11169
Kresse, G., and Hafner, J. (1993). Ab Initiomolecular Dynamics for Liquid Metals. Phys. Rev. B 47, 558–561. doi:10.1103/physrevb.47.558
Kresse, G., and Hafner, J. (1994). Ab Initiomolecular-Dynamics Simulation of the Liquid-Metal-Amorphous-Semiconductor Transition in Germanium. Phys. Rev. B 49, 14251–14269. doi:10.1103/physrevb.49.14251
Kresse, G., and Joubert, D. (1999). From Ultrasoft Pseudopotentials to the Projector Augmented-Wave Method. Phys. Rev. B 59, 1758–1775. doi:10.1103/physrevb.59.1758
Kruglov, I., Yanilkin, A., Oganov, A., and Korotaev, P. (2019). Phase Diagram of Uranium from Ab Initio Calculations and Machine Learning. Phys. Rev. B 100, 174104. doi:10.1103/physrevb.100.174104
Ladygin, V. V., Korotaev, P. Y., Yanilkin, A. V., and Shapeev, A. V. (2020). Lattice Dynamics Simulation Using Machine Learning Interatomic Potentials. Comput. Mater. Sci. 172, 109333. doi:10.1016/j.commatsci.2019.109333
Lawson, A. C., Olsen, C. E., Richardson, J. W., Mueller, M. H., and Lander, G. H. (1988). Structure of β-uranium. Acta Crystallogr. Sect B 44, 89–96. doi:10.1107/s0108768187009406
Leggett, R., Bierlein, T., and Mastel, B. (1963). Irradiation Behavior of High Purity Uranium. Tech. Rep. HW-79559. Hanford Laboratories. doi:10.21236/ad0427126
Lide, D. (2000). Handbook of Chemistry and Physics: A Ready-Reference Book Chemical and Physical Data. CRC Press.
Lloyd, L. T., and Barrett, C. S. (1966). Thermal Expansion of Alpha Uranium. J. Nucl. Mater. 18, 55–59. doi:10.1016/0022-3115(66)90095-x
Loomis, B. A., and Gerber, S. B. (1968). Length and Electrical Resistivity Changes of Neutron Irradiated Uranium. Phil. Mag. 18, 539–553. doi:10.1080/14786436808227459
Manga, V., and Poirier, D. (2018). Ab Initio molecular Dynamics Simulation of Self-Diffusion in Al–Si Binary Melts. Model. Simul. Mater. Sci. Eng. 26, 065006. doi:10.1088/1361-651x/aacdbc
Marchidan, D. I., and Ciopec, M. (1976). Enthalpy of Uranium to 1500 K by Drop Calorimetry. The J. Chem. Thermodynamics 8, 691–701. doi:10.1016/0021-9614(76)90021-5
Matter, H., Winter, J., and Triftshäuser, W. (1980). Investigation of Vacancy Formation and Phase Transformations in Uranium by Positron Annihilation. J. Nucl. Mater. 88, 273–278. doi:10.1016/0022-3115(80)90283-4
Methfessel, M., and Paxton, A. T. (1989). High-precision Sampling for Brillouin-Zone Integration in Metals. Phys. Rev. B 40, 3616–3621. doi:10.1103/physrevb.40.3616
Monkhorst, H. J., and Pack, J. D. (1976). Special Points for Brillouin-Zone Integrations. Phys. Rev. B 13, 5188–5192. doi:10.1103/physrevb.13.5188
Paine, S., and Kittel, J. (1958). Preliminary Analysis of Fisson-Induced Dimensional Changes in Single Cryatals of Ranium. Tech. Rep. ANL-5676. Argonne National Laboratory. doi:10.2172/4282942
Perdew, J. P., Burke, K., and Ernzerhof, M. (1996). Generalized Gradient Approximation Made Simple. Phys. Rev. Lett. 77, 3865–3868. doi:10.1103/physrevlett.77.3865
Perdew, J. P., Burke, K., and Ernzerhof, M. (1997). Generalized Gradient Approximation Made Simple [Phys. Rev. Lett. 77, 3865 (1996)]. Phys. Rev. Lett. 78, 1396 doi:10.1103/physrevlett.78.1396
Schachinger, L., and Lamprecht, I. (1989). Heat Capacity of Uranium Metal at Low Temperatures. A Reminiscence. Thermochim. Acta 151, 203–217. doi:10.1016/0040-6031(89)85350-x
Söderlind, P., Grabowski, B., Yang, L., Landa, A., Bjorkman, T., Souvatis, P., et al. (2012). High-temperature Phonon Stabilization of ! -uranium from Relativistic First-Principles Theory. Phys. Rev. B 85, 060301. doi:10.1103/physrevb.85.060301
Söderlind, P. (1998). Theory of the crystal Structures of Cerium and the Light Actinides. Adv. Phys. 47, 959–998. doi:10.1080/000187398243492
Taylor, C. (2008). Evaluation of First-Principles Techniques for Obtaining Materials Parameters of Alpha Uranium and the (001) Alpha Uranium Surface. Phys. Rev. B 77, 094119. doi:10.1103/physrevb.77.094119
Timko, J., Bucher, D., and Kuyucak, S. (2010). Dissociation of Nacl in Water from Ab Initio Molecular Dynamics Simulations. J. Chem. Phys. 132, 114510. doi:10.1063/1.3360310
Touloukian, Y., Kirby, R., Taylor, R., and Desai, P. (1975). , Vol. 12. Thermophysical Properties of Matter - Thermal Expansion: Metallic Elements and Alloys. IFI/Plenu.
Wang, C., Dai, Y., Gao, H., Ruan, X., Wang, J., and Sun, B. (2010). Ab Initio molecular Dynamics Study of Fe Adsorption on Tin (001) Surface. Mater. Trans. 51, 2005–2008. doi:10.2320/matertrans.m2010244
Xiang, S., Huang, H., and Hsiung, L. M. (2008). Quantum Mechanical Calculations of Uranium Phases and Niobium Defects in γ-uranium. J. Nucl. Mater. 375, 113–119. doi:10.1016/j.jnucmat.2007.11.003
Keywords: alpha uranium, ab initio molecular dynamics, point defects, lattice strain, fuel swelling
Citation: Beeler B, Mahbuba K, Wang Y and Jokisaari A (2021) Determination of Thermal Expansion, Defect Formation Energy, and Defect-Induced Strain of α-U Via ab Initio Molecular Dynamics. Front. Mater. 8:661387. doi: 10.3389/fmats.2021.661387
Received: 07 February 2021; Accepted: 04 May 2021;
Published: 10 June 2021.
Edited by:
Shijun Zhao, City University of Hong Kong, ChinaReviewed by:
Thomas Hammerschmidt, Ruhr University Bochum, GermanyCopyright © 2021 Beeler, Mahbuba, Wang and Jokisaari. This is an open-access article distributed under the terms of the Creative Commons Attribution License (CC BY). The use, distribution or reproduction in other forums is permitted, provided the original author(s) and the copyright owner(s) are credited and that the original publication in this journal is cited, in accordance with accepted academic practice. No use, distribution or reproduction is permitted which does not comply with these terms.
*Correspondence: Benjamin Beeler, bwbeeler@ncsu.edu