The Effect of Crystal Mismatch on the Thermoelectric Performance Enhancement of Nano Cu2Se
 Yunus Demirci1
  Bejan Hamawandi
 Muhammet S. Toprak
- 1Department of Electrical-Electronics Engineering, Istanbul University Cerrahpasa, Istanbul, Turkey
- 2Department of Applied Physics, KTH Royal Institute of Technology, Stockholm, Sweden
- 3Department of Physics, Istanbul University, Istanbul, Turkey
In the past decades, Cu2−xSe compounds have attracted great attention due to the inclusion of non-toxic and abundant elements, besides having a promising thermoelectric (TE) performance. In this work, we investigated the effect of a crystal mismatch of a nanoinclusion phase on the TE properties of Cu2−xSe. Nano-Cu2Se was synthesized using microwave assisted thermolysis, while the p-type skutterudite, Fe3.25Co0.75Sb12 (FeCoSb), compound was synthesized using a chemical alloying route. Nano-Cu2Se, and (nano-Cu2Se)1−x(nano-FeCoSb)x composites, where x = 0.05 and 0.1, were prepared via mechanical alloying followed by Spark Plasma Sintering process. Structural properties were evaluated by PXRD and SEM analysis, while the high temperature transport properties were examined via electrical conductivity, Seebeck coefficient, and thermal conductivity measurements in the temperature range of 300–800 K. Powder X-ray diffraction (PXRD) confirmed a single phase of nano Cu2Se, while the samples with FeCoSb inclusion consist of two phases as Cu2Se and CoSb3. SEM micrographs of all samples show that Cu2Se has randomly oriented grains with different sizes. Cu2Se samples with a FeCoSb inclusion show a rather different structure. In these samples, a rod-shaped FeCoSb phase, with a size varying between 20 and 100 nm, showed an inhomogeneous distribution in the structure and stacked between the Cu2Se layers. Transport data indicate that crystal mismatch between Cu2Se and FeCoSb has a strong effect on the TE transport properties. Electrical conductivity decreases but Seebeck coefficient enhances with nano FeCoSb inclusion. Total thermal conductivity was suppressed by 30% and ZT value enhanced by 15% with 5% nano FeCoSb inclusion at 750 K, likely due to a decrease in the electronic contribution of the thermal conductivity. Structural and transport data show that small amount of nanoinclusion of FeCoSb has a beneficial effect on the TE performance of nano Cu2Se at temperatures below 800 K.
Introduction
In an effort to reduce global warming, which results from the burning of fossil fuels, various alternative energy sources have been identified. Thermoelectric (TE) materials and devices are one of the promising alternatives and sustainable energy sources which can convert heat energy directly into electrical power. TE materials-based technologies have been incorporated into space missions and are now gaining more attention for terrestrial applications. For more than a decade, this technology has not been used in a large scale, this is because of its inherent low conversion efficiency (Bell, 2008; Snyder et al., 2008; Julian Goldsmid, 2009). This conversion efficiency is proportional to the efficiency of the TE material, which can be determined by a factor called figure of merit Z. Its dimensionless form is given as ZT = S2σT/κ, consisting of the Seebeck coefficient (S), the electrical conductivity (σ), absolute temperature (T), and the thermal conductivity κ (= κL + κe, where κe is electronic and κL is the lattice contribution to thermal conductivity). A good TE material should have a high power factor (S2σ) and a low thermal conductivity (Bell, 2008; Snyder et al., 2008; Julian Goldsmid, 2009). In an attempt to get a higher ZT > 2, an extrinsic semiconductor with good electronic properties (high charge carrier mobility) is generally selected and various methods that will reduce the thermal conductivity as much as possible are being explored. Several approaches have been used to increase the efficiency of TE materials. Such approaches include the Phonon Glass Electron Crystal paradigm (Rowe, 2006; Beekman et al., 2015), the formation of bulk nano-composites (Hsu et al., 2004; Poudel et al., 2008), the use of band resonant states to enhance the density of states (Heremans et al., 2008), the composition and temperature induced band convergence (Pei et al., 2011; Liu et al., 2012), using materials with extreme inharmonicity of lattice vibrations (Morelli et al., 2008), ultra-fast solidification techniques (Li et al., 2009), and the Phonon Liquid Electron Crystal (PLEC) (Liu et al., 2012; Yu et al., 2012) concept. The PLEC concept is an extension of Phonon Glass Electron Crystal and the principle is to eliminate transverse phonon vibrations in the process of heat transfer. The PLEC concept could be successfully applied to copper-based chalcogenides (Ballikaya et al., 2013).
Cu2−xSe compound is a known superionic compound that has inherently low thermal conductivity. In the superionic phase, cations exhibit liquid-like diffusivity and the disordered nature results in a low lattice thermal conductivity usually (<1 W/m−K) (Liu et al., 2012; Yu et al., 2012; Ballikaya et al., 2013; Tafti et al., 2016). Cu2−xSe based chalcogenides have gained more attention not only because of their extremely low thermal conductivity but also due to their constituent elements (Cu and Se), which are considered benign and are found in abundance in comparison to many other TE material compositions, especially those containing Pb, Sb, As (Tafti et al., 2016). Cu2−xSe exists in two phases, a low temperature α phase and a high temperature β phase. The transition from the low temperature to high temperature phase occurs at ∼400 K. Se atoms in a Cu2−xSe compound are located at FCC sites in the two phases and Cu atoms are coherent and localized in α phase but disordered in β phase (Liu et al., 2012). In spite of Cu-based chalcogenides having promising TE performance, large scale application has been hindered by the reliability issues where diffusive Cu ions are prone to electro-migration; this issue has to be addressed.
Several strategies have been developed to enhance the ZT and the chemical stability of Cu2−xSe over a wide temperature range, include tuning of bonding energy (Zhao et al., 2017), developing nanocomposites (Butt et al., 2016; Nunna et al., 2017), chemical doping via transition metals, alkaline, halogen or chalcogenide elements (Peng et al., 2016), and nanoscale incorporation of other elements and compounds (Ballikaya et al., 2019b). Zhao et al. (2017) and Nunna et al. (2017) showed the possibility to obtain ultra-high ZT values in Cu2Se by incorporating carbon fibers, or carbon nanotubes. Various studies have proved that structural and TE transport properties of Cu2−xSe can be modified with a variety of nano-inclusions, and the synthesis route (Tafti et al., 2016; Ballikaya et al., 2019a; Ballikaya et al., 2019b; Hamawandi et al., 2020). Cu2−xSe have been synthesized via various methods such as solid-state reaction (Ballikaya et al., 2013), solvo-thermal synthesis (Tafti et al., 2016), melting and annealing (Ballikaya et al., 2019a), high-pressure high-temperature synthesis (Xue et al., 2019), colloidal synthesis (Forster et al., 2017), and arc melting (Butt et al., 2019). In spite of many works reported earlier, the crystal mismatch of guest and host phases on transport properties of Cu2−xSe has not been studied in detail. In our previous work, we reported chemical synthesis process and TE properties of nanostructured Cu1.8Se and Cu2Se (Hamawandi et al., 2020). Here, we intend to study the effects of crystal mismatch, using p-type nano-skutterudite inclusion, on the structural and transport properties of nanostructured Cu2Se.
Experimental Methods
Sample Synthesis
Preparation of Nanoscale Cu2−xSe Powders
“Nano Cu2−xSe” powders were prepared via a microwave (MW) assisted thermolysis method. High purity copper acetate [Cu (CO2CH3)2·H2O], selenium powder (Se > 99.5) and the organic solvent oleic acid (C18H34O2), 1-Octadecene (C18H36, ODE), and trioctylphosphine [P(C8H17)3, TOP], methanol and hexane (C6H14) were used. The precursor mixture was prepared by adding a stoichiometric amount of copper acetate and Se powder in a MW glass tube with 4 ml of ODE and 8 ml of oleic acid 2 ml of TOP was added in the tube, and then the tube was sealed with silicone septa caps and degassed with several purges of nitrogen followed by vacuum to prevent TOP oxidation. The mixture was stirred for 2 min via MW Synthesizer (Biotage® Initiator) and then heated for 5 min at the synthesis temperature of 250°C using MW power of 400 W. The product was washed several times with methanol and hexane and left in vacuum oven to dry for 3 h at 60°C, thus obtaining dried powder of Cu2Se. More details on the chemical synthesis process and structural properties of nanostructured Cu2Se can be found in our previous reports (Tafti et al., 2016; Hamawandi et al., 2020).
Preparation of Nanoscale FeCoSb (Fe3.25Co0.75Sb12) Powders
Precursor for p-type skutterudite nano-FeCoSb powder was prepared by chemical alloying route, using the procedure developed and reported earlier (Tafti et al., 2014). The process includes co-precipitation of constituent elements in an intimately mixed oxalate form, which are then thermochemically treated to obtain the final skutterudite phase. In a typical process cobalt chloride (CoCl2·6H2O), iron chloride (FeCl2·4H2O) and antimony chloride (SbCl3) solutions were prepared as stocks. 0.3 M ammonium oxalate (C2H8N2O4) was used as the precipitating agent. Thermodynamic modeling was used to determine the pH window to co-precipitate the constituents with the desired stoichiometry (see Reference Tafti et al., 2014 for further details). The metal ion solution and the precipitating agent were added to the reaction chamber simultaneously. The reaction pH was kept at two and the process was carried out at room temperature. After the precipitation process, the powders were washed, filtered and dried at 60°C overnight. The powders were then calcined at 350°C for 3 h to obtain their oxide form. Finally, to obtain the stoichiometric nano FeCoSb, powders were thermochemically treated at 450°C for 3 h in a rotating tube furnace under hydrogen gas.
Sample Compaction
Cu2Se nanopowders were directly compacted, whereas (nano-Cu2Se)1−x(nano-FeCoSb)x solid solutions were mechanically ground for 1 h in a Planetary Ball Mill (Optosense), then compacted under Argon gas. All powders were loaded into separate 12.6 mm diameter cylindrical dies for compaction using a spark plasma sintering (SPS) system. Then samples were densified at 450°C for 15 min under 50 MPa pressure, cut into disc and rectangular bar shapes for high temperature transport property measurements.
Structural Analysis
The phase identity and purity were verified using powder X-ray diffraction (PXRD) (RigakuUltima IV diffractometer). Scanning electron microscopy (Hitachi S3200 SEM) was used for a detailed microstructural analysis of all the samples.
Transport Properties
Transport property measurements were carried out in the temperature range of 300–800 K. The Seebeck coefficient and electrical conductivity were measured concurrently using Ulvac ZEM-3. The total thermal conductivity κ was calculated according to κ = D.ρ.Cp, where D is the thermal diffusivity, Cp is the specific heat capacity and ρ is the bulk density. Thermal diffusivity was measured using a LFA1000 laser-based apparatus from Linseis Corporation. Specific heat was measured by a Differential Scanning Calorimeter (Linseis PT1000), and the density obtained from Archimedes’ method, reaching about 95–97% of the theoretical density. The typical error bar expected in the Seebeck coefficient and electrical conductivity is ±4%, while it is ±6% for the thermal conductivity.
Results and Discussion
Structural Data
Phase purity of samples were determined by Powder X-Ray Diffraction (PXRD). Figure 1 shows the PXRD pattern obtained from nano-Cu2Se, nano-FeCoSb, and (Nano-Cu2Se)0.95–(Nano-FeCoSb)0.05.
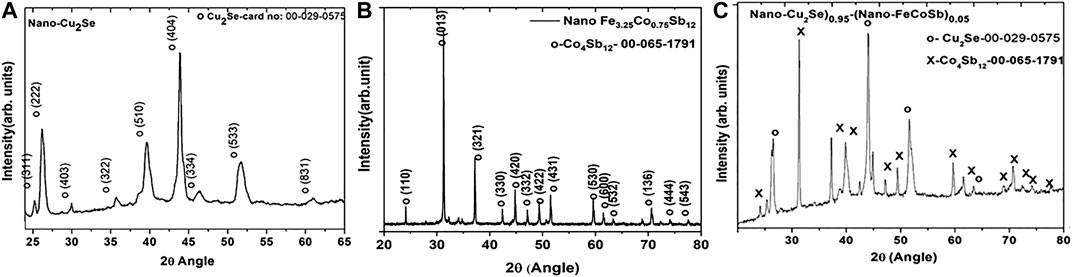
FIGURE 1. PXRD patterns of: (A) nano-Cu2Se, (B) nano-FeCoSb, and (C) as-milled nano-Cu2Se-%5 Nano FeCoSb.
Figure 1A shows the PXRD pattern of nano-Cu2Se with orthorhombic crystal structure ((ICDD PDF card no: 00-029–0575)), while the PXRD pattern of nano-FeCoSb (Fe3.25Co0.75Sb12),displayed in Figure 1B, indicates that all peaks are consistent with the main structure of skutterudite—CoSb3 (ICDD PDF card no: 00-065–1791). The crystal structure of nano-Cu2Se is rather different from the bulk Cu2Se (Ballikaya et al., 2013). This is likely because the crystal structure of Cu2−xSe strongly depends on the position and deficiency of Cu atoms in structure (Tafti et al., 2014). Figure 1C displays the PXRD pattern of (nano-Cu2Se)0.95–(nano-FeCoSb)0.05, where the presence of two distinct phases, as Cu2Se and CoSb3 can be clearly observed. This may be a trace of the crystal mismatch between nano-Cu2Se and nano-FeCoSb. Similar PXRD pattern was obtained for Cu2Se sample with 2% nano FeCoSb inclusion (data not shown). The diffraction intensity of the minority FeCoSb phase is as strong as the host Cu2Se phase. The crystal structure of these two phases are different; FeCoSb has a larger unit cell with 32 atoms per cell, where Cu2Se has 18 atoms per cell (Uher, 2016). The higher atomic density per unit cell for the skutterudite system may lead to a higher diffraction peak intensity. However, an important contributor to the observed effect could also be the material preparation route, where the FeCoSb skutterudite phase has been reduced by gas-solid reaction at elevated temperature (450°C), therefore exhibiting a higher crystallinity. The crystallinity difference between the Cu2Se phase and FeCoSb phase can also be seen from the broadening of the diffraction peaks. In the case of Cu2Se, observed broad diffraction peaks are ascribed to its lower crystallinity as a result of the adapted solution synthesis route.
A more detailed microstructural property evaluation was performed by SEM-EDS analysis. Fractural structure of nano-Cu2Se is displayed in Figure 2 at different magnifications. As seen, nano-Cu2Se has a highly layered texture crystalline structure that is consistent with the literature (Li et al., 2009; Liu et al., 2012; Yu et al., 2012; Ballikaya et al., 2013; Tafti et al., 2016). Its grain size is in the range from 10 nm to 1 μm. In order to further analyze the phase purity element concentration of nano-Cu2Se, back-scattered electron (BSE) analysis and elemental mapping were performed.
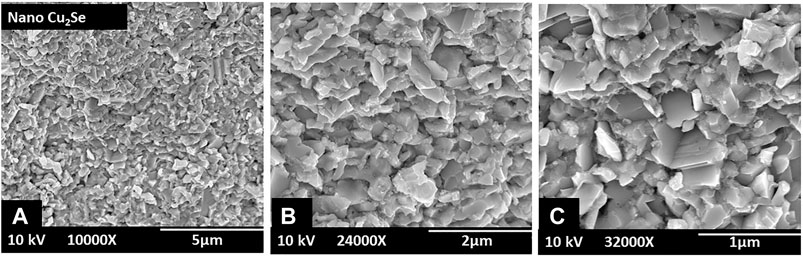
FIGURE 2. Fractural nano-Cu2Se SEM micrographs at different magnifications.
Figure 3 confirms the phase purity of Cu2Se and homogeny distribution of Cu and Se elements in the structure. Figure 4 shows SEM micrographs of (nano-Cu2Se)0.95-(nano-FeCoSb)0.05 sample. It clearly reveals that there are two distinct phases as skutterudutie (FeCoSb) and copper chalcogenides (Cu2Se) in this sample, which is consistent with the PXRD pattern. SEM micrographs of (nano-Cu2Se)0.95-(nano-FeCoSb)0.05 indicates that FeCoSb phase distributed non-uniformly within the structure and form rod shape clusters that are stacked between Cu2Se layers. Non-uniform distribution of FeCoSb might be due to two possible scenarios. The first one may be the difference in surface energy between FeCoSb and Cu2Se phases. In other words, small size particles have higher surface energy that resist to combine to form larger grains (Ching and Pan, 2007). Rod shaped FeCoSb nanoparticles might, therefore, resist to combine with larger Cu2Se particles. The other scenario is the agglomeration of FeCoSb, which may be due to ball milling time and energy not being sufficient for the de-agglomeration of FeCoSb phase for a homogeneous incorporation into the Cu2Se phase. In order to further investigate the structural properties of Cu2Se sample with FeCoSb inclusion, a surface SEM-BSE analysis and elemental mapping were performed.
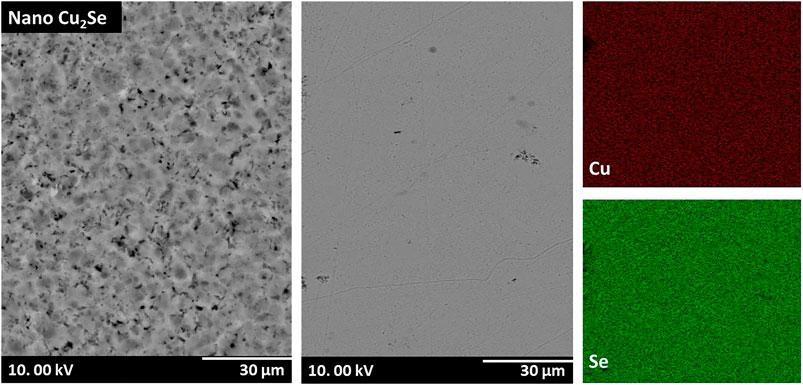
FIGURE 3. Surface SEM-BSE micrographs and elemental mapping of nano-Cu2Se.
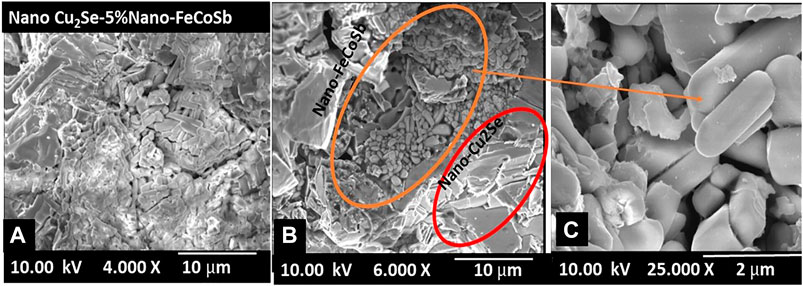
FIGURE 4. Fractural SEM micrographs of (nano-Cu2Se)0.95(nano-FeCoSb)0.05 at different magnifications.
Surface-SEM-BSE micrograph of (nano-Cu2Se)0.95(nano-FeCoSb)0.05 in Figure 5 confirms two different phases as observed from fractural SEM and PXRD patterns. Agglomeration and non-uniform distribution of FeCoSb were clearly observed and it is confirmed with color mapping of the elements. The effect of the observed microstructure of samples on the TE transport properties is presented below.
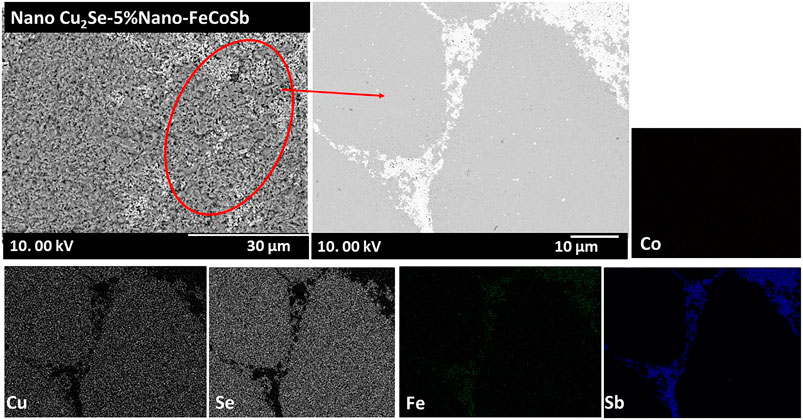
FIGURE 5. Surface SEM-BSE micrographs and elemental mapping of (nano-Cu2Se)0.95(nano-FeCoSb)0.05 sample. White color font shows FeCoSb phases while gray phase is the Cu2Se.
Transport Properties
All the transport measurements were carried out in the temperature range of 300–800 K. The temperature dependent electrical conductivity is presented in Figure 6. Electrical conductivity decreases with increasing temperature for all samples, which is a typical behavior of highly doped semiconductors. The highest electrical conductivity was obtained in Cu2Se and the electrical conductivity is suppressed with increasing content of nano-FeCoSb. This may be due to the decrease in charge carrier density with FeCoSb content, or strong scattering of the charge carriers by the grain boundaries. Regarding the second scenario, the decrease in electrical conductivity is thought to be caused by the crystal mismatch between Cu2Se and FeCoSb phase. As Kim and Majumdar (2006) and Mingo et al. (2009) stated in their work, if there is no homogeneous distribution of nano-phases and there is no coherent interface with small band offsets between the host and incorporated nano-phases, then charge carrier scattering is much stronger. Therefore, we believe that crystal mismatch between FeCoSb and Cu2Se, and agglomeration of FeCoSb phase in the structure might have caused large interfaces to form in the grain boundary regions, which is thought to cause strong scattering of charge carriers.
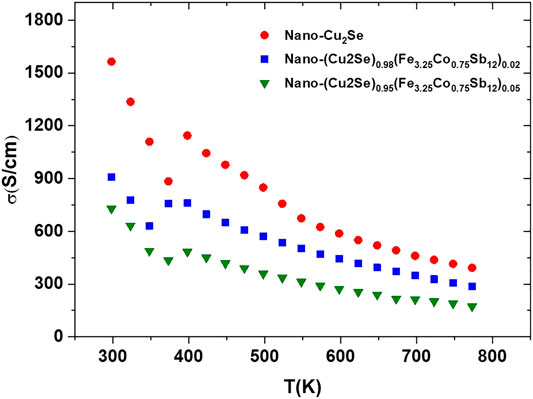
FIGURE 6. Electrical conductivity vs. temperature for nano-Cu2Se (nano-Cu2Se)0.95(nano-FeCoSb)0.05 and (nano-Cu2Se)0.98(nano-FeCoSb)0.02 samples.
Positive sign of the Seebeck coefficient in Figure 7 indicates that holes are the main charge carriers in all samples. The temperature dependent Seebeck coefficient shows generally opposite trend of the temperature dependent electrical conductivity. It seems that the Seebeck coefficient increases with increasing content of FeCoSb, which is also either due to decreasing charge carrier density, or strong scattering of charge carriers (Uher, 2016; Kim and Majumdar, 2006). The peak observed around 400 K in both the electrical conductivity and the Seebeck coefficient vs. temperature is a signature of well-known structural α-β structural transition in Cu2Se materials as described earlier (Liu et al., 2012). Heat capacity (Cp) measurement is a useful, indirect method to detect structural changes in a material. All samples reveal a clear signature of a phase transition around 400 K (Figure 8). Upon nano FeCoSb inclusion, Cp decreases in comparison to pure nano-Cu2Se (Figure 8). The intensity of a phase transition peak is related to the energy difference between the two phases, and it also reflects the chemical stability of compound (Brown, 2015; Ballikaya et al., 2019b). In other words, compounds that have small peak during phase transition are more stable thermally and chemically in comparison to those with a higher peak intensity. Therefore, it may be concluded that the thermal stability of these samples also increases with increasing nano FeCoSb content (Brown, 2015; Olvera et al., 2017).
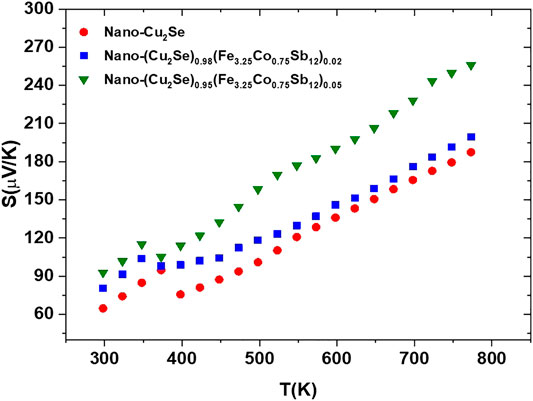
FIGURE 7. Temperature dependent Seebeck coefficient of nano-Cu2Se (nano-Cu2Se)0.95(nano-FeCoSb)0.05 and (nano-Cu2Se)0.98(nano-FeCoSb)0.02 samples.
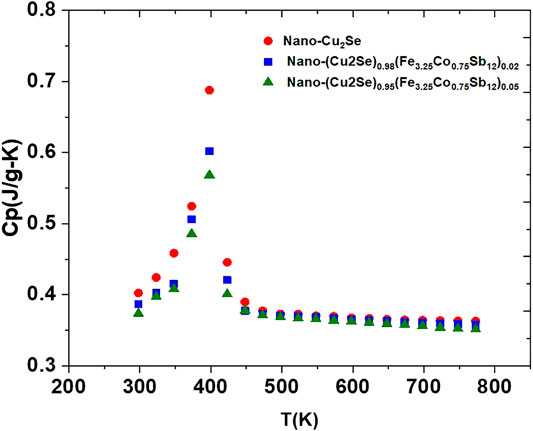
FIGURE 8. The heat capacity, Cp, vs. temperature for nano-Cu2Se (nano-Cu2Se)0.95(nano-FeCoSb)0.05 and (nano-Cu2Se)0.98(nano-FeCoSb)0.02 samples.
The total thermal conductivity for all the samples as a function of temperature is shown in Figure 9. The thermal conductivity is suppressed with increasing nano-FeCoSb content. In order to further understand this issue, the electronic and lattice part of the thermal conductivity were evaluated separately. Wiedemann-Franz law was used to calculate the lattice contribution to the thermal conductivity (κL) of all the samples by deducting the electronic term (
where r is the charge carrier scattering parameter, kB the Boltzmann constant, e the electron charge, and Fn(ξ) is the Fermi integral given by
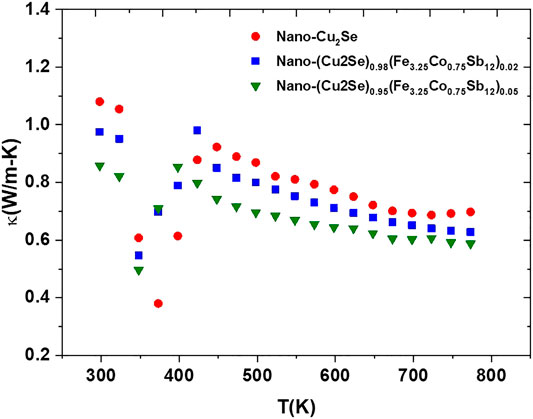
FIGURE 9. The total thermal conductivity vs. temperature for nano-Cu2Se (nano-Cu2Se)0.95(nano-FeCoSb)0.05 and (nano-Cu2Se)0.98(nano-FeCoSb)0.02 samples.
Here, ξ is the reduced Fermi energy that can be calculated from the Seebeck coefficient, S and the scattering parameter r according to
It is assumed that the system is highly degenerate, and scattering was dominated by acoustic phonons. The temperature dependent Lorenz number is estimated as 2.21 to 1.55 × 10⁻⁸ V2/K2 in the temperature range of 300–800 K for the analyzed samples. Temperature dependent κe values in the temperature range of 300–800 K are shown in Figure 10.
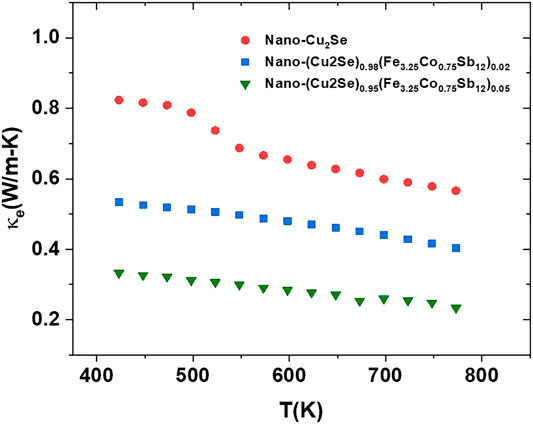
FIGURE 10. Electronic part of thermal conductivity for nano-Cu2Se (nano-Cu2Se)0.95(nano-FeCoSb)0.05 and (nano-Cu2Se)0.98(nano-FeCoSb)0.02 samples after the phase transition (400–873 K).
As clearly seen, the highest κe values belong to Cu2Se, which is due to its higher electrical conductivity. The κe decreases with increasing content of FeCoSb phase. This is also associated with decrease in the electrical conductivity. When electronic conductivity value of samples at 400 and 873 K are compared, it can be seen that the gap between maximum and minimum values is 40, 30, and 50% for pure nano Cu2Se samples, and samples with 2 and 5% FeCoSb inclusion, respectively. This indicates that the electronic thermal conductivity plays a rather effective role in the reduction of thermal conductivity of nano-Cu2Se, and samples with 2 and 5% FeCoSb inclusion. The temperature dependent lattice thermal conductivities of samples are shown in Figure 11.
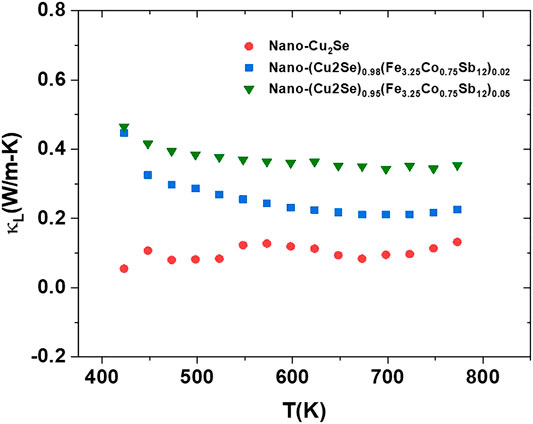
FIGURE 11. The lattice thermal conductivity, κL, vs. temperature for nano-Cu2Se (nano-Cu2Se)0.95(nano-FeCoSb)0.05 and (nano-Cu2Se)0.98(nano-FeCoSb)0.02 samples.
A minimum lattice thermal conductivity value of 0.19 W/mK was obtained in nano-Cu2Se. This might be because this sample has a highly textured structure, consisting of a large number of smaller grains (Hicks and Dresselhaus, 1993; Hori and Shiomi, 2019). As it is known, there are three different phonon modes that contribute to the thermal conductivity in solids which are low, medium, and high frequency. Among these, low frequency phonons have higher contribution in lattice thermal conductivity due to their larger mean free path (Hicks and Dresselhaus, 1993; Hori and Shiomi, 2019). Micro-nano size grain is responsible for low and medium frequency phonon scattering. This might be the dominant reason for observing lower lattice thermal conductivity in nano-Cu2Se.
The power factor (PF) is calculated using electrical conductivity combined with the Seebeck coefficient. The PF vs. temperature plot for all the samples is given in Figure 12. The maximum power factor of 14 µW/(mK2) at 800 K was achieved for Cu2Se sample, due to its higher electrical conductivity and relatively high Seebeck coefficient.
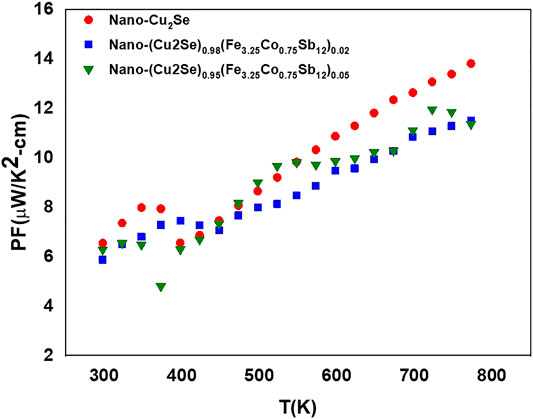
FIGURE 12. Power factor (PF) function of temperature for nano-Cu2Se (nano-Cu2Se)0.95(nano-FeCoSb)0.05 and (nano-Cu2Se)0.98(nano-FeCoSb)0.02 samples.
The temperature dependent figure of merit for all samples are presented in Figure 13. The ZT values of all samples are higher than some of the reported ZT values for bulk and nanostructured Cu2−xSe samples over 900 K (Liu et al., 2012; Yu et al., 2012; Ballikaya et al., 2013; Oztan et al., 2020). The maximum ZT value reached ∼1.6 at 750 K for the (nano-Cu2Se)0.95(nano-FeCoSb)0.05 sample which is one of the highest ZT values for Cu2Se reported at this temperature. This indicates that it is possible to further enhance the ZT value with optimization of nano-FeCoSb content and its distribution within the nano-Cu2Se phase.
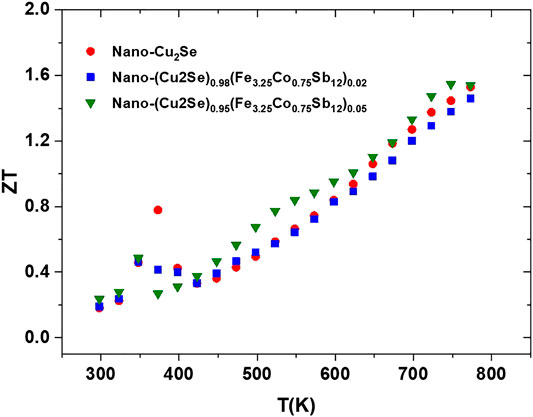
FIGURE 13. The ZT value of samples as function of temperature for nano-Cu2Se (nano-Cu2Se)0.95(nano-FeCoSb)0.05, and (nano-Cu2Se)0.98(nano-FeCoSb)0.02 samples.
Conclusion
Nano-Cu2Se and p-type skutterudite Fe3.25Co0.75Sb12 compounds were synthesized successfully by using microwave assisted thermolysis and chemical alloying route, respectively. Their solid solutions (Cu2Se with 2 and 5% nano-FeCoSb) were prepared via mechanical alloying followed by SPS process. Detailed structural analyses of all samples were performed by SEM-EDS, PXRD, and transport properties were evaluated via Seebeck coefficient, electrical conductivity and thermal conductivity measurements. SEM-EDS pattern with PXRD analysis of samples shows Cu2Se and Fe3.25Co0.75Sb12 have a single phase while the FeCoSb included sample consists of two phases from FeCoSb and Cu2Se. The micro-structure of the (Nano-Cu2Se)1−x(Nano FeCoSb)x sample showed that rod shape nano FeCoSb was distributed non-uniformly and formed clusters that stacked between Cu2Se layers. Transport data indicated that electrical conductivity decreased with inclusion of nano-FeCoSb. This is attributed to strong scattering of charge carriers on grain boundaries originated from crystal mismatch between Cu2Se and FeCoSb. Thermal conductivity evaluation shows electronic thermal conductivity plays a major role in the reduction of thermal conductivity with FeCoSb inclusions. The maximum ZT value reached ∼1.6 at 750 K with %5 FeCoSb inclusion, which is ∼%15 higher than nano-Cu2Se (ZT∼1.4 at 750 K) at this temperature. This is one of the highest ZT values reported for Cu2−xSe at this temperature. Structural and transport data show that nano FeCoSb incorporation in Cu2Se has a beneficial effect on the TE performance up to 800 K, and it may be possible to further enhance it with the optimization of concentration and distribution of nano-FeCoSb phase within Cu2Se.
Data Availability Statement
The original contributions presented in the study are included in the article/Supplementary Material, further inquiries can be directed to the corresponding authors.
Author Contributions
YD, AY, and SB drafted the manuscript; SB, BH, and MT conceptualized; YD, AY, and BH conducted the experiment, SB and MT reviewed the manuscript.
Funding
This work is supported by the Scientific and Technological Research Council of Turkey (TUBITAK) under the Project Number 216M254 and Scientific Research Projects Coordination Unit of Istanbul University with Project Numbers of 35577 and 32641. This work was supported in part by the Swedish Energy Agency (Energimyndigheten, 43521-1) and Swedish Research Council (VR, 2018-03462).
Conflict of Interest
The authors declare that the research was conducted in the absence of any commercial or financial relationships that could be construed as a potential conflict of interest.
References
Ballikaya, S., Chi, H., Salvador, J. R., and Uher, C. (2013). Thermoelectric properties of Ag-doped Cu2Se and Cu2Te. J. Mater. Chem. 1, 12478–12484. doi:10.1039/c3ta12508d
Ballikaya, S., Oner, Y., Temel, T., Ozkal, B., Bailey, T. P., Toprak, M. S., et al. (2019a). Thermoelectric and thermal stability improvements in Nano-Cu2 Se included Ag2 Se. J. Solid State Chem. 273, 122–127. doi:10.22226/2410-3535-2013-2-87-90
Ballikaya, S., Sertkol, M., Oner, Y., Bailey, T. P., and Uher, C. (2019b). Fracture structure and thermoelectric enhancement of Cu2Se with substitution of nanostructured Ag2Se. Phys. Chem. Chem. Phys. 21 (25), 13569–13577. doi:10.2991/iceesd-18.2018.319
Beekman, M., Morelli, D., and Nolas, G. (2015). Better thermoelectrics through glass-like crystals. Nat. Mater. 14, 1182–1185. doi:10.1088/1674-1056/abbbf5
Bell, L. E. (2008). Cooling, heating, generating power, and recovering waste heat with thermoelectric systems. Science 321 (5895), 1457–1461. doi:10.1134/1.1513855
Brown, D. (2015). Enhanced thermoelectric performance at the superionic phase transitions of mixed ion-electron conducting materials. Dissertation (Ph.D.) California Institute of Technology. doi:10.7907/Z9B56GNM
Butt, S., Farooq, M. U., Mahmood, W., Salam, S., Sultan, M., Basit, M. A., et al. (2019). One-step rapid synthesis of Cu2Se with enhanced thermoelectric properties. J. Alloys Compd. 786, 557–564. doi:10.1002/chin.199817023
Butt, S., Xu, W., Farooq, M. U., Ren, G. K., Zhang, Q., Zhu, Y., et al. (2016). Enhanced thermoelectricity in high-temperature β-phase copper (I) selenides embedded with Cu2Te nanoclusters. ACS Appl. Mater. Interfaces 8 (24), 15196–15204.
Ching, H. N., and Pan, J. (2007). Sintering of particles of different sizes. Acta Mater. 55, 813–824. doi:10.1557/proc-1166-n03-26
Forster, J. D., Lynch, J. J., Coates, N. E., Liu, J., Jang, H., Zaia, E., et al. (2017). Solution processed Cu2Se nanocrystal films with bulk like thermoelectric performance. Sci. Rep. 7 (1), 1–7. doi:10.1021/acsami.9b01718.s001
Hamawandi, B., Ballikaya, S., Rasander, M., Halim, J., Vinciguerra, L., Rosen, J., et al. (2020). Composition tuning of nanostructured binary copper selenides through rapid chemical synthesis and their thermoelectric property evaluation. Nanomaterials 10, 854. doi:10.1021/acsaem.0c01525.s001
Heremans, J. P., Jovovic, V., Toberer, E. S., Saramat, A., Kurosaki, K., Charoenphakdee, A., et al. (2008). Enhancement of thermoelectric efficiency in PbTe by distortion of the electronic density of state. Science. 321(5888), 554–557. doi:10.1021/acsaem.9b01016.s001
Hicks, L. D., and Dresselhaus, M. S. (1993). Effect of quantum-well structures on the thermoelectric figure of merit. Phys. Rev. B. 47 (19), 12727. doi:10.1109/ict.1996.553525
Hori, T., and Shiomi, J. (2019). Tuning phonon transport spectrum for better thermoelectric materials. Sci. Technol. Adv. Mater. 20 (1), 10–25. doi:10.1557/proc-281-821
Hsu, K. F., Loo, S., Goo, F., Chen, W., Dyck, J. S., Uher, C., et al. (2004). Cubic AgPbmSb: bulk thermoelectric materials with high figure of merit. Science 303 (5659), 818–821. doi:10.1557/proc-452-261
Kim, W., and Majumdar, A. (2006). Phonon scattering cross section of polydispersed spherical nanoparticles. J. Appl. Phys. 99 (8), 084306. doi:10.1103/physrevb.47.12727
Li, H., Tang, X., Zhang, Q., and Uher, C. (2009). High performance InxCeyCo4Sb12 thermoelectric materials with in situ forming nanostructured InSb phase. Appl. Phys. Lett. 94 (10), 102114. doi:10.1134/1.1500470
Liu, H., Shi, X., Xu, F., Zhang, L., Zhang, W., Chen, L., et al. (2012). Copper ion liquid-like thermoelectrics. Nat. Mater. 11 (5), 422–425. doi:10.1109/ict.1997.667182
Liu, W., Tan, X., Yin, K., Liu, H., Tang, X., Shi, J., et al. (2012). Convergence of conduction bands as a means of enhancing thermoelectric performance of n-type Mg2Si1-xSnx solid solutions. Phys. Rev. Lett. 108 (16), 166601. doi:10.1557/proc-545-369
Mingo, N., Hauser, D., Kobayashi, N. P., Plissonnier, M., and Shakouri, A. (2009). Nanoparticle-in-Alloy approach to efficient thermoelectrics: silicides in SiGe. Nano Lett. 9 (2), 711–715. doi:10.1109/ict.1999.843472
Morelli, D. T., Jovovic, V., and Heremans, J. P. (2008). Intrinsically minimal thermal conductivity in cubic I–V–VI2 semiconductors. Phys. Rev. Lett. 101 (3), 035901. doi:10.1103/physrevb.53.r10493
Nunna, R., Qiu, P., Yin, M., Chen, H., Hanus, R., Song, Q., et al. (2017). Ultrahigh thermoelectric performance in Cu2Se-based hybrid materials with highly dispersed molecular CNTs. Enery. Environ. Sci. 10 (9), 1928–1935. doi:10.1039/c7ee01737e
Olvera, A., A Moroz, N., Sahoo, P., Ren, P., P Bailey, T., Page, A., et al. (2017). Partial indium solubility induces chemical stability and colossal thermoelectric figure of merit in Cu2Se. Energy Environ. Sci. 10 (7), 1668–1678. doi:10.1021/acsami.9b01718.s001
Oztan, C. Y., Hamawandi, B., Zhou, Y., Ballikaya, S., Toprak, M. S., Leblanc, R., et al. (2020). Thermoelectric performance of Cu2Se doped with rapidly synthesized gel-like carbon dots. J. Alloys Compd. 13, 157916. doi:10.1016/j.jallcom.2020.157916
Pei, Y., Shi, X., LaLonde, A., Wang, H., Chen, L. D., and Snyder, G. J. (2011). Convergence of Electronic bands for high performance bulk thermoelectrics. Nature 473 (7345), 66–69. doi:10.1021/acsaem.0c01525.s001
Peng, P., Gong, Z. N., Liu*, F. S., Huang, M. J., Ao, W. Q., Li, Y., et al. (2016). Structure and thermoelectric performance of β-Cu2Se doped with Fe, Ni, Mn, In, Zn or Sm. Intermetallics 75, 72–78. doi:10.1021/acsami.9b08699.s001
Poudel, B., Hao, Q., Ma, Y., Lan, Y., Minnich, A., Yu, B., et al. (2008). High thermoelectric performance of nanostructured bismuth antimony telluride bulk alloys. Science. 320 (5876), 634–638. doi:10.1007/978-981-13-2889-3_20
Rowe, D. M. Editor (2006). Thermoelectrics handbook: macro to nano. Boca Raton: CRC/Taylor & Francis.
Snyder, G. J., Toberer, E. S., and Snyder, G. J. (2008). Complex thermoelectric materials. Nat. Mater. 7, 105–114. doi:10.1016/j.matlet.2019.05.009
Tafti, M. Y., Ballikaya, S., Khachatourian, A. M., Noroozi, M., Saleemi, M., Han, L., et al. (2016). Promising bulk nanostructured Cu2Se thermoelectrics: via high throughput and rapid chemical synthesis. RSC Adv. 6, 111457–111464. doi:10.2991/iceesd-18.2018.319
Tafti, M. Y., Saleemi, M., Toprak, M. S., Johnsson, M., Jacquot, A., Jagle, M., et al. (2014). Fabrication and characterization of nanostructured thermoelectric FexCo1-xSb3. Open Chem. 1, 629. doi:10.1021/acsaem.9b01537.s001
Uher, C. (2016). Material aspect of thermoelectricity. Boca Raton, FL: CRC Press, Taylor and Francis.
Xue, L., Zhang, Z., Shen, W., Ma, H., Zhang, Y., Fang, C., et al. (2019). Thermoelectric performance of Cu2Se bulk materials by high-temperature and high-pressure synthesis. J. Mater. 5 (1), 103–110. doi:10.2172/1223723
Yu, B., Liu, W., Chen, S., Wang, H., Wang, H., Chen, G., et al. (2012). Thermoelectric properties of copper selenide with ordered selenium layer and disordered copper layer. Nanomater. Energy 1 (3), 472–478. doi:10.2172/1561264
Keywords: thermoelectric effect, microwave assisted thermolysis, nano Cu2Se, nano Fe325Co075Sb12, crystal mismatch, thermal conductivity
Citation: Demirci Y, Yusuf A, Hamawandi B, Toprak MS and Ballikaya S (2021) The Effect of Crystal Mismatch on the Thermoelectric Performance Enhancement of Nano Cu2Se. Front. Mater. 7:581138. doi: 10.3389/fmats.2020.581138
Received: 07 July 2020; Accepted: 24 November 2020;
Published: 14 January 2021.
Edited by:
Zhenhai Xia, University of North Texas, United StatesReviewed by:
Mohd Faizul Mohd Sabri, University of Malaya, MalaysiaMehmet Fevzi Köseoglu, Pamukkale University, Turkey
Copyright © 2021 Demirci, Yusuf, Hamawandi, Toprak and Ballikaya. This is an open-access article distributed under the terms of the Creative Commons Attribution License (CC BY). The use, distribution or reproduction in other forums is permitted, provided the original author(s) and the copyright owner(s) are credited and that the original publication in this journal is cited, in accordance with accepted academic practice. No use, distribution or reproduction is permitted which does not comply with these terms.
*Correspondence: Muhammet S. Toprak, toprak@kth.se; Sedat Ballikaya, ballikaya@istanbul.edu.tr