Correlation Between Ionic Mobility and Plastic Flow Events in NaPO3-NaCl-Na2SO4 Glasses
 Bruno Poletto Rodrigues1,2*
  Rene Limbach1
  Gabriel Buzatto de Souza3 Heike Ebendorff-Heidepriem2
  Lothar Wondraczek1,4
- 1Otto Schott Institute of Materials Research, Friedrich Schiller University of Jena, Jena, Germany
- 2School of Physical Sciences, Institute of Photonics and Advanced Sensing, The University of Adelaide, Adelaide, SA, Australia
- 3Vitreous Materials Laboratory, Federal University of Sao Carlos, Sao Carlos, Brazil
- 4Center of Energy and Environmental Chemistry, Friedrich Schiller University of Jena, Jena, Germany
We report on the evolution of the mechanical and electrical properties of sodium metaphosphate glasses with addition of sodium sulfate or sodium chloride. The addition of these two sodium salts converts the medium-range order of our glasses from 2D phosphate chains to a mixed 1D + 2D network similar to ionic glasses, while the short-range order of the phosphate units remains unaffected. Replacing the phosphate units by chloride ion monotonically decreases the glass transition temperature, but enhances the Young's modulus and moderately increases the ionic conductivity. On the other hand, the sulfate group decreases the glass transition temperature as well, though the Young's modulus remains constant, while the ionic conductivity strongly increases. The changes in conductivity are related to the enhancement of the ionic mobility in these glasses, which in turn affect the size and distribution of the plastic events taking place during indentation-driven deformation.
Introduction
Unlike silicate and borosilicate glasses, phosphate glasses are mainly explored for specialty applications, such as laser gain media, hermetic seals, nuclear waste immobilization, and biomaterials (Brow, 2000). Another potential application is their use as solid electrolytes for ion-conducting solid state batteries (Jun et al., 1990; Kim et al., 2015) due to their high ionic conductivity at room temperature ranging from 10−5 to 10−3 S.cm−1 (Martin and Angell, 1986). For the latter, it has been observed that further significant enhancement can be achieved by the dissolution of ionic salts such as halides, sulfides, and sulfates into the glassy matrix (Martin, 1991). However, the mechanism of incorporation is not the same for all salts; usually sulfide and fluoride salts depolymerize the phosphate chain backbone by reacting with the bridging oxygens to form chain terminating P-F or P-S bonds (Brow et al., 1992; Cutroni et al., 1992; Saunders et al., 1996; Kartini et al., 2004), while the other halides and sulfates occupy the interstitial spaces in-between the phosphate chains, increasing the inter-chain spacing and keeping the short-range structure largely untouched (Malugani et al., 1982; Scotti et al., 1992; Kartini et al., 2002; Da et al., 2011; Sirotkin et al., 2012; Kabi and Ghosh, 2014; Möncke et al., 2014; Thieme et al., 2015; Le et al., 2017). Therefore, sulfate/halide-phosphate glassy systems are convenient model systems to study how changes in the bonding and geometry of the first coordination shell of the modifier ions impact the ensemble's properties.
Selecting the NaPO3-NaCl-Na2SO4 ternary system is convenient since both the Cl− and anions occupy the free volume available between the phosphate chains as they are incorporated into the glass network, while leaving the phosphate chains largely intact. These glasses also allow for a comparison between the behavior of Na+ cations when only coordinated by non-bridging oxygens or when in a mixed halide and oxyanion environment, thus providing an interesting control group to whether the mechanical and electrical properties are more sensitive to changes in the overall packing density (where both the Cl− and should behave similarly, when taking their respective sizes into account) or to the chemistry of the anions coordinating the cationic modifier (where the NaPO3 and the sulfate bearing glasses should be comparable, while the sodium chloride glasses should behave differently).
Materials and Methods
Glasses with nominal compositions of (100–x)NaPO3-xNaCl and (100–x)NaPO3-(x/2)Na2SO4 with x = 0, 10, 20, 30, 40, 50 were prepared from mixtures of reagent grade (NH4)2HPO4, (NH4)2SO4, Na2CO3, and NaCl (Sigma Aldrich, purity > 99%) in the appropriate proportions. The powder mixtures were homogenized in a mortar and melted in Al2O3 crucibles for 1 h at 1,000 K. Melt droplets were splat-quenched between two stainless steel plates and several disks of about 1 mm thickness and 10 mm diameter were produced from each glass melt. The resulting quenched glasses were homogeneous, colorless, and transparent, with the exception of the 50NaPO3-50NaCl sample, which fully crystallized during casting. The density ρ of the as-prepared glasses was determined by the Archimedes' method in distilled water and via He pycnometry (Quantachrome Ultrapyc 1200e, Anton Paar GmbH). The glass transition temperature Tg was determined from the onset of the endothermic event observed in the differential scanning calorimetry (DSC, Netzsch STA 499F1). All DSC measurements were performed in a flowing N2 atmosphere at a constant heating rate of 20 K/min using powdered samples of 20 mg mounted in platinum crucibles. Except for the thermal analysis, all experiments were carried out in laboratory air under ambient conditions.
The elastic properties were analyzed using a piezoelectric transducer operating at frequencies of 8 to 12 MHz (Echometer 1077, Karl Deutsch GmbH & Co KG). Values of the longitudinal cL and transversal cT sound wave velocities were derived from the corresponding sound wave propagation times and the exact thickness of the co-planar, optically-polished glass plates. On that basis the shear G, bulk K, and Young's moduli E as well as the Poisson's ratio ν were calculated by means of the following equations:
The mechanical properties were further analyzed through instrumented indentation testing using a nanoindenter (G200, Agilent Inc.), equipped with a three-sided Berkovich diamond indenter tip (Synton-MDP Inc.), and operating in the continuous stiffness measurement mode (CSM). The tip area function and instruments frame compliance were calibrated prior to the first experiments on a fused silica reference glass sample of known elastic properties (Corning Code 7980, Corning Inc.). On every glass specimen, 15 indentations with a maximum penetration depth of h = 2 μm were created at a constant strain-rate of = 0.05 s−1 (defined as the loading rate dP/dt divided by the actual load P). The load-displacement curves recorded by the nanoindenter were subsequently analyzed following the method proposed by Oliver and Pharr (1992), where the hardness H is estimated from the load divided by the projected contact area of the indenter tip Ac:
and the values of E are derived from the combined elastic response of the diamond indenter used (Ei = 1,141 GPa, νi = 0.07) and the material tested (Johnson, 1985):
with the reduced elastic modulus Er (Pharr et al., 1992):
Here, the parameter S denotes the contact stiffness as determined from the slope of the load-displacement curve at the onset of unloading. By operating in the CSM mode, the contact stiffness (or harmonic stiffness) can be recorded also during the monotonic load increase, which allows for the parallel determination of E and H as a function of the indenter displacement (Li and Bhushan, 2002; Pharr et al., 2009). For this purpose, the continuously increasing load-displacement signal was superimposed by a small oscillation of the indenter tip (f = 45 Hz, Δh = 2 nm). The values of E and H were finally averaged between the upper 10% and lower 20% of each indentation depth profile.
The strain-rate sensitivity m was analyzed in nanoindentation strain-rate jump test, as described in detail elsewhere (Limbach et al., 2014). On each glass specimen, ten strain-rate jump tests with strain-rates of 0.05; 0.007; and 0.001 s−1 (in descending order) were performed, and the values of m were derived from the slope of the logarithmic plot of the hardness against the indentation strain-rate [defined as the displacement rate dh/dt divided by the total penetration depth (Shen et al., 2012)]:
where for materials with a depth-independent hardness value (Lucas and Oliver, 1999). The thermal drift rates are below 0.05 s−1 for the nanoindentation experiments. To avoid possible interactions between the residual stress fields, adjacent indentations were spaced by distances of 50 μm (Hay, 2009).
A structural analysis was carried out by Raman spectroscopy. Raman spectra were collected in the range of 150 to 1,300 cm−1, using a 488 nm Ar-laser as excitation source (Renishaw in Via Raman microscope). Each spectra was averaged over 20 consecutive measurements, corrected for baseline and thermal population (Shuker and Gammon, 1970) and normalized by the intensity of the peak at ~1,140 cm−1.
The ionic conductivity was analyzed by impedance spectroscopy (Novocontrol Alpha-A analyzer and a Novotherm Temperature Control System), in the frequency range from 10−1 to 106 Hz and at temperatures between 303 and 423 K. A thin gold layer was deposited on the surface of each sample by means of a sputtering system (Anatech Hummer 10.2), operating for 300 s at an average current of 20 mA. In order to extract the glass properties from the experimental data, the setup was modeled with a single parallel RC element representing the bulk glass as an ideal solid electrolyte (Hodge et al., 1976; Almond and West, 1983) in series with a constant-phase element (CPE) representing the gold electrodes (Barsoukov and Macdonald, 2005). The total impedance of this circuit is given by Barsoukov and Macdonald (2005), Lvovich (2012):
where i is the imaginary number, ω = 2πf is the angular frequency, R and C are the parameters of the RC element, and Q and α are the CPE parameters. From Equation (9), the dc conductivity σdc of each sample can be evaluated by:
where l and A are the sample thickness and area, respectively. The temperature dependence of the conductivity is given by the Arrhenius-scaling of both the number of effective charge carriers n(T) and the frequency of successful atomic hops Γ(T) (Tuller et al., 1980; Hairetdinov et al., 1994; Rodrigues et al., 2011):
where σ0 is the conductivity pre-exponential term, nc is the number density of ions, Γ0 is the attempt frequency, R is the universal gas constant, and the parameters Eσ, En, and Em are the activation energies of conductivity, charge carrier creation, and mobility, respectively. The activation energies are related via the following equation (Souquet, 1981; Ngai and Moynihan, 1998; Bandara and Mellander, 2011; Rodrigues et al., 2019):
Results
Raman Spectroscopy
Raman spectra of the NaPO3-Na2SO4 and NaPO3-NaCl glasses (Figures 1, 2, respectively) show that the phosphate network is generally unaffected by the addition of NaCl and Na2SO4, as the main features at approximately 680 and 1,140 cm−1 [associated with the symmetric stretching modes νs(P-O-P) and νs(PO2) of Q2 species, respectively (Hudgens et al., 1998; Velli et al., 2005; Konidakis et al., 2011)], remain relatively unchanged. In the Raman spectra of the NaPO3-Na2SO4 glasses in Figure 1, the appearance of a peak at ~1,000 cm−1 is assigned to the symmetric stretching νs(SO) (Da et al., 2011; Thieme et al., 2015) and it increases in intensity with increasing Na2SO4 concentration. The spectra of the NaPO3-NaCl glasses (Figure 2) are more complex. A slight shift of the νs(Q2) to lower wavenumbers is observed with increasing NaCl content, in conjunction with the appearance of shoulders at ~1,100 and ~750 cm−1, consistent with the phosphorus tetrahedron and bridging oxygen symmetric stretching vibrations of the Q1 unit (Da et al., 2011; Thieme et al., 2015; Kapoor et al., 2017). The vibrations at ~1,000 and 1,050 cm−1 can be assigned to chain-terminating Q1 units (Brow et al., 1995; Brow, 2000; Da et al., 2011), while the broad envelope centered at around 340 cm−1 is due to network bending vibrations (Brow et al., 1995; Hudgens et al., 1998; Velli et al., 2005). These observations indicate that the addition of NaCl progressively depolymerizes the glass network, forming shorter phosphate chains, which is in accordance with previous observations from MD simulations of LiPO3-LiCl glasses (Rao and Seshasayee, 2004). However, earlier studies have revealed that metaphosphate glasses are in general characterized by low degrees of network polymerization, with the reported average chain size of NaPO3 glasses ranging from 3.5 to 9 phosphate units (Westman and Gartaganis, 1957; Brow, 2000). Considering that the NaPO3 glass presently investigated already consists of relatively small chains, the effect of depolymerisation is assumed to be of secondary importance.
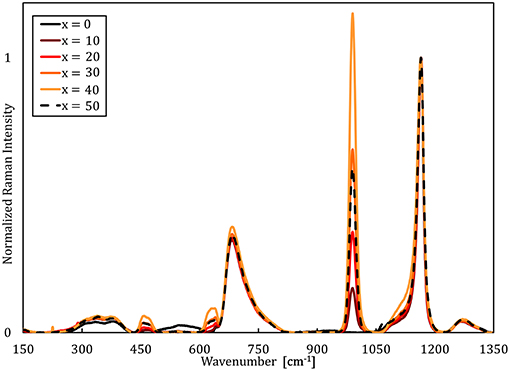
Figure 1. Normalized Raman spectra for the (100–x)NaPO3-(x/2)Na2SO4 glasses.
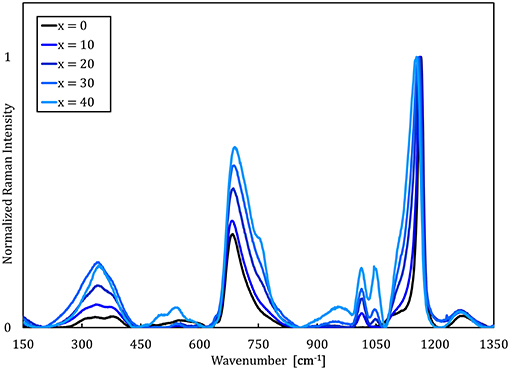
Figure 2. Normalized Raman spectra for the (100–x)NaPO3-xNaCl glasses.
Thermal and Mechanical Characterization
Selected physical properties of the NaPO3-Na2SO4 and NaPO3-NaCl glasses examined in this study are listed in Tables 1, 2, respectively. As expected, the addition of Na2SO4 and NaCl leads to a decrease in both the glass transition temperature (Figure 3) and molar volume, illustrating the overall weakening of the glass network and the more efficient packing due to the presence of Cl− and SO groups occupying the interstitial spaces in-between the phosphate chains, similar to the effect of AgI in AgPO3 glasses (Novita et al., 2009; Rodrigues and Wondraczek, 2013; Limbach et al., 2014). The mechanical properties show very different compositional trends (Figures 4, 5): the addition of Na2SO4 leads to a slight decrease of the Young's modulus, while the strain-rate sensitivity and Poisson's ratio remain almost constant; on the other hand, the addition of NaCl induces a significant increase in the Young's modulus, while the strain-rate sensitivity decreases and the Poisson's ratio remains almost the same within the limits of error.
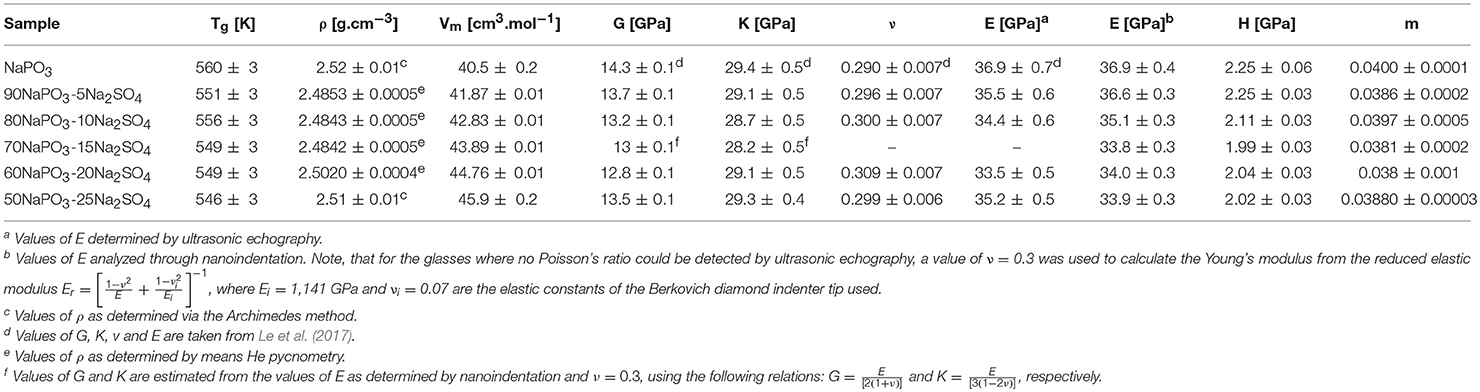
Table 1. Physical properties of the (100–x)NaPO3- (x/2)Na2SO4 glasses.
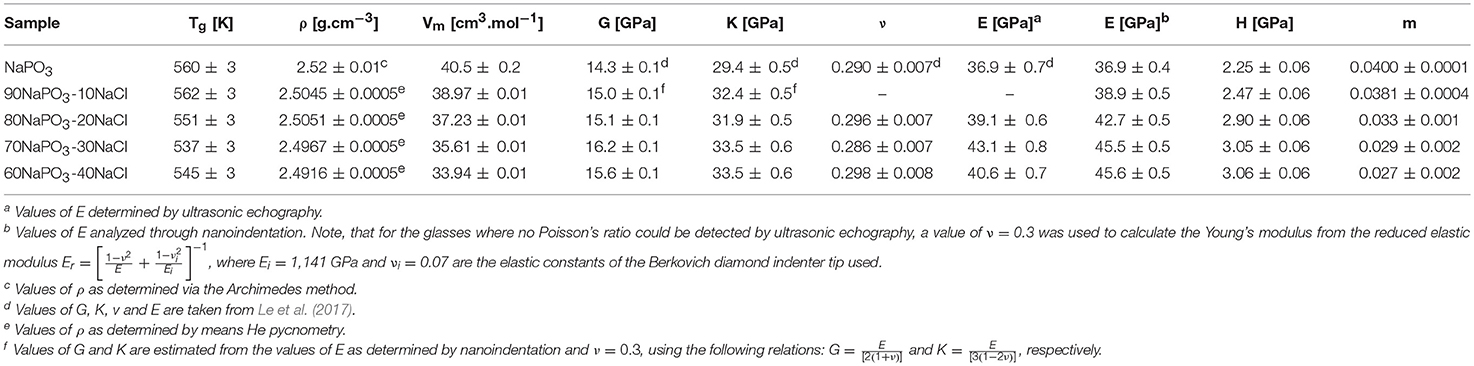
Table 2. Physical properties of the (100–x)NaPO3-xNaCl glasses.
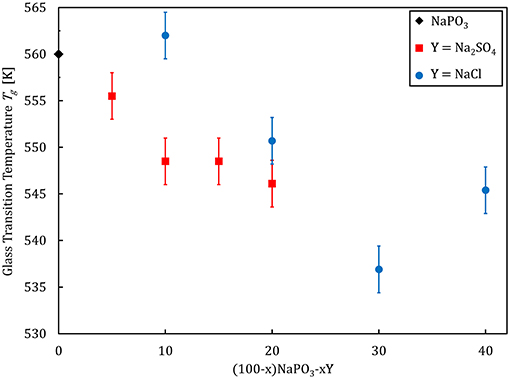
Figure 3. Glass transition temperature as a function of composition for (100–x)NaPO3-xY (with Y = Na2SO4, NaCl) glasses.
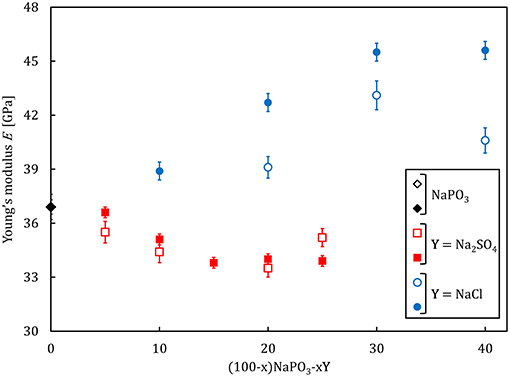
Figure 4. Young's modulus, as determined by ultrasonic echography (empty symbols) and nanoindentation (filled symbols), respectively, as a function of composition for (100–x)NaPO3-xY (with Y = Na2SO4, NaCl) glasses.
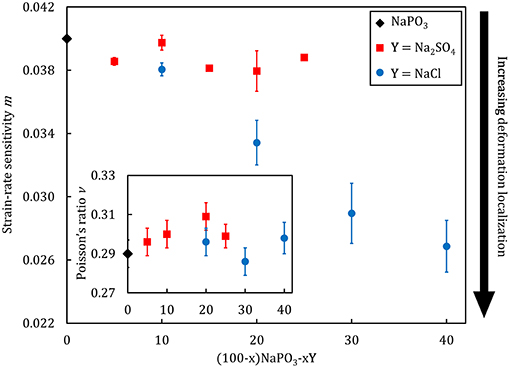
Figure 5. Strain-rate sensitivity as a function of composition for (100–x)NaPO3-xY (with Y = Na2SO4, NaCl) glasses. The inset displays the compositional dependence of the Poisson's ratio.
According to the elastic models of glass-forming liquids (Dyre, 2006), the instantaneous elastic properties measured at laboratory time-scales can be used as probes for the individual “flow events” and molecular rearrangements which undergo some sort of transition through an energy barrier. The most classic of such relations is given by the Maxwell relation τ = η·G, which links the macroscopic shear modulus to the microscopic relaxation time τ through the shear viscosity η (Perez, 1994). In a more refined sense the same arguments are used when calculating the elastic constants in MD simulation boxes from the derivative of the energy landscape as a function of strain (Pedone et al., 2008a,b; Jabraoui et al., 2016). Drawing parallels between “traditional” glass systems and simple Lennard-Jones glass models, Heuer and Spiess argued that the glass transition should be given by:
where kg is a constant (~0.014 for glassy noble gases and ~0.011 for “traditional” glassy systems), is the average effective mass, and ca is the acoustic sound velocity, defined as the square on the ratio between the bulk modulus and the density (Heuer and Spiess, 1994). With glass transition temperature and the acoustic sound velocity as easily accessible parameters, Equation (15) provides a convenient route to study the mechanism governing the glass transition. The proportionality constant includes information regarding the “elementary unit” undergoing an activated transition, which enables the whole system to evolve from a frozen-in state toward a supercooled liquid. Figure 6 illustrates the compositional dependence of the calculated average effective mass, expressed as the factor . The average effective mass remains upon the addition of Na2SO4, but it decreases when NaCl is added. This result suggests that the “elementary unit” in NaPO3-Na2SO4 glasses remains largely unchanged when the phosphate groups are substituted by sulfate groups, as the molar mass of a PO and a SO tetrahedra are very similar (94.93 g.mol−1 as compared to 96.03 g.mol−1). On the other hand, the average effective mass decreases with NaCl addition due to the much smaller mass of the chloride ions (35.45 g.mol−1).
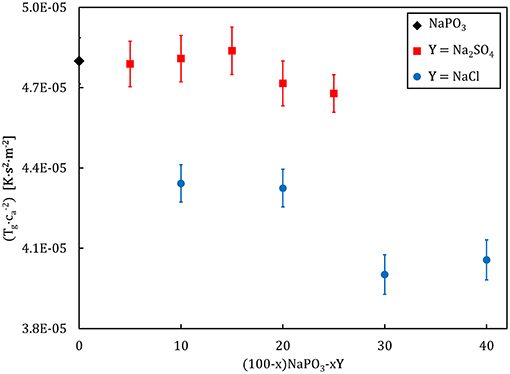
Figure 6. Compositional dependence of the average effective mass, gauged by , for (100–x)NaPO3-xY (with Y = Na2SO4, NaCl) glasses.
The values of the Poisson's ratio and strain-rate sensitivity corroborate this interpretation. The Poisson's ratio, defined as the negative of the ratio between the transverse contraction strain and the longitudinal extension strain along the loading axis, is directly linked to the structural arrangements at short- and medium-range length scales in glasses, as evident from its interrelation to the packing density and network dimensionality (Rouxel, 2006, 2007; Rouxel et al., 2008a,b; Greaves et al., 2011). As our structural analysis have demonstrated, the phosphate network characteristic remains largely unchanged upon the addition of increasing amounts of Na2SO4 and NaCl salts. Accordingly, the overall network dimensionality also remains constant, as it is roughly composed of spherical elements (Na+, SO, Cl− ions) packed around short phosphate chains. This is consistent with the observed relative invariance of the Poisson's ratio (Figure 5), where values of 0.3 are expected for glasses with a mixed 1D + 2D network structure (Rouxel, 2007). The slightly higher values of the Poisson's ratio which we observe for the sulfate-substituted glasses might originate from the significantly higher polarizability of the sulfate ion, leading to lower local order, and therefore, decreased structural dimensionality. For metallic glasses, the strain-rate sensitivity is an indicator for the tendency toward a localization of the plastic flow, and lower values are in general associated with more heterogeneous, localized plastic flow events (Spaepen, 1977; Limbach et al., 2017). This is consistent with the experimental data from Figures 5, 6, demonstrating that the plastic flow event distribution and average effective mass remains constant for the NaPO3-Na2SO4 glasses, while the incrementally lower average effective mass in the NaPO3-NaCl glasses lead to a stronger localization of the plastic flow. Structural heterogeneities at short- and medium-range length scales are thought to be characteristic of the glassy state (Queiroz and Sestak, 2010; Hong et al., 2011), and their presence is an important factor controlling the mechanical properties of MD simulations (Tsamados et al., 2009; Rodney et al., 2011; Mantisi et al., 2012), colloidal glasses (Kawasaki et al., 2007; Schall et al., 2007; Rahmani et al., 2014; Varnik et al., 2014), metallic glasses (Fan et al., 2014; Hufnagel et al., 2016), and oxide glasses (Limbach et al., 2015; Benzine et al., 2018).
Impedance Spectroscopy
An example of the Nyquist plots graphed from the experimental impedance analysis of the 90NaPO3-10NaCl glass is presented in Figure 7. The graph displays the temperature dependence of the semicircles, together with the fits from the model Equation (9). Figure 8 shows the real part of the complex conductivity as a function of frequency for the NaPO3 glass at four different temperatures. It also illustrates that our glasses obey the Nernst-Einstein relation (Sidebottom, 2009; Bandara and Mellander, 2011; Sangoro and Kremer, 2012):
where λ is a characteristic length so that λ2 is approximately equal to the mean square displamentent, e is the elementary charge (Bhattacharya and Ghosh, 2004), g′ is a geometric factor, k is Boltzmann's constant, and n(T) and Γ(T) are given by Equations (12,13), respectively. Since fH, as defined by the Jonscher power-law, (Almond et al., 1983, 1984; Popov et al., 2012; Singh et al., 2016), is directly related to the timescales of ionic hopping (Marple et al., 2018), Γ(T) equals fH(T) and therefore Equation (16) can be rewritten as:
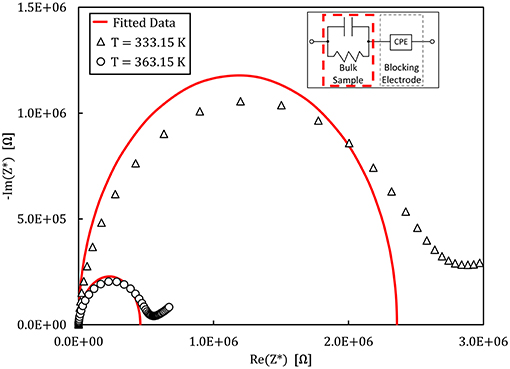
Figure 7. Nyquist plot of the complex impedance measured for the 90NaPO3-10NaCl glass at different temperatures. The empty symbols show the experimental data and the continuous line is the fit to the equivalent circuit shown in the inset.
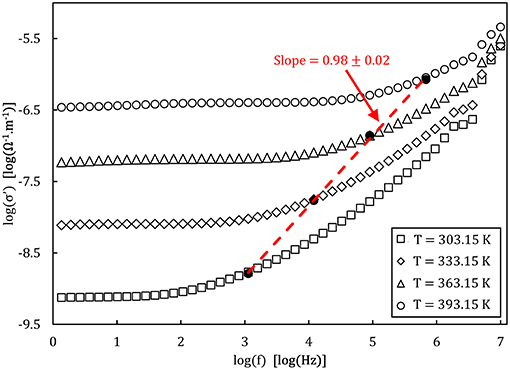
Figure 8. Bode plot of the real part of the complex conductivity measured for the NaPO3 glass at different temperatures. The empty symbols show the experimental data while the filled symbols represent the onset of AC conductivity . The dashed line represents the linear fit of the onset frequencies.
From which the linear relation between log(σdc) and log(fH) with a slope of unity is recovered.
Analysis of the activation energies show that for these glasses, En ≪ Em < Eσ as can be seen in Figure 9, and thus the ionic conductivity is determined mainly by the ionic mobility. More specifically, the mobility of the sodium cation, as previous studies have shown that for sulfate- and chloride-containing alkali metaphosphate glasses the contributions of the anions is negligible (Sokolov et al., 2003; Bhide and Hariharan, 2007; Rao et al., 2009; Hraiech and Ferid, 2013). Despite that, charge carrier formation does play a non-negligible role in this glass system, as illustrated by the Walden plot of the conductivity data in Figure 10, where it is clear that the NaPO3-NaCl-Na2SO4 glasses show a broad distribution, covering over two orders of magnitude along the log(σdc.T) axis for each measured frequency, suggesting that the addition of sodium chloride and sodium sulfate enhances the number of effective charge carriers. However, calculation of the number of charge carriers n(T) at 323 K from experimental activation energy values shows that both sodium salts seem to have the inverse effect: when considering the end-members of our compositions, the number density of charge carriers decreases non-linearly from 6.3 × 10²¹ ions.cm−3 for NaPO3 to 5.0 × 10²¹ ions.cm−3 for 60NaPO3-40NaCl and to 4.6 × 10²¹ ions.cm−3 for 50NaPO3-25Na2SO4, respectively. Normalizing these numbers by the sodium number density derived from experimental density data, the ratio of charge carriers to the total sodium ion density decreases from 0.42 for NaPO3 to 0.28 for 60NaPO3-40NaCl and to 0.34 for 50NaPO3-25Na2SO4, respectively. This result, in conjunction with the fact that the linear regression of the NaPO3-NaCl-Na2SO4 data in the Walden plot is significantly higher than one, indicates that both the average distance between ions and the Haven ratio (Rodrigues et al., 2019) exhibit non-trivial compositional and/or temperature dependences. Moreover, this also implies that the improved ionic conductivity is based on an even stronger increase in ionic mobility, as it has to compensate the parallel reduction in the number of charge carriers. Referring again to the end-members of the two glass series, the experimental data shows that the addition of NaCl causes an increase of about one order of magnitude in the ionic mobility, while the addition of Na2SO4 results in an enhancement of approximately three orders of magnitude (see inset in Figure 14).
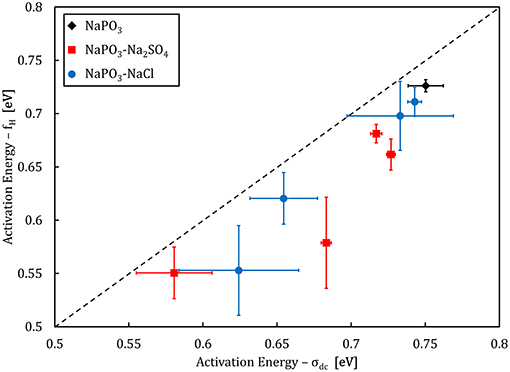
Figure 9. Activation energy of the onset frequency fH compared to the activation energy of dc conductivity σdc. The dashed line illustrates a 1:1 ratio.
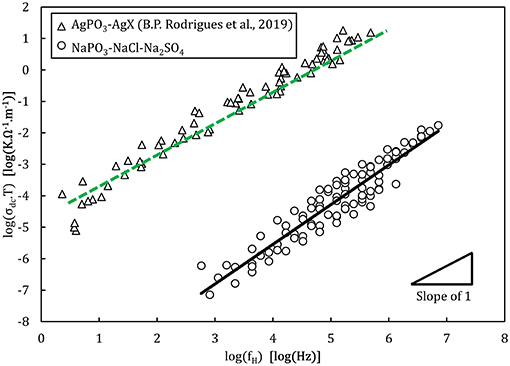
Figure 10. Walden plot presenting the conductivity data of the NaPO3-NaCl-Na2SO4 glasses in comparison with the AgPO3-AgX glass system (Rodrigues et al., 2019). The lines show the linear regressions of the experimental data, with a slope of 1.2 ± 0.1 for the NaPO3-NaCl-Na2SO4 glasses and of 1.08 ± 0.02 for AgPO3-AgX glasses. The regression was performed between 104 and 106 Hz where experimental data is available for all samples, to avoid biasing the result.
Discussion
Some of the terminology used to discuss the mechanical properties in this report originates from the concept of shear-transformation zones (STZ), i.e., the cooperative rearrangement of a group of atoms. While STZs are mostly used to describe the fundamental processes governing the plasticity of metallic glasses, the STZ theory has also been used to describe general glassy dynamics (Bouchbinder and Langer, 2009a,b,c, 2011). By definition, STZs are localized flow events marking the irreversible transition between the inherent structures of the energy landscape as the glassy system is subjected to mechanical stress or strain (Bouchbinder and Langer, 2011). Therefore, it is possible to draw a parallel between the atomic motion during plastic deformation and ionic conductivity, since both result from the activation of extremely localized, atomic-level rearrangements by external stimuli. While the atomic motion related to a STZ originates from the stress gradient and the strain bias, the ionic jumps which manifest in the electric conductivity are driven by the applied voltage.
The energy barrier density (in J.m−3), which determines the STZ formation is given by Liu et al. (2010):
where γc = 0.0267 and ξ = 3 are constants from the cooperative shear model (Johnson and Samwer, 2005). The Figures 11, 12 show a comparison between the energy barrier density for STZ formation and the barrier densities for ionic mobility Ξμ and charge carrier formation Ξn, respectively. Interestingly, the energy barrier densities for mobility and STZ formation scale linearly for the NaPO3-Na2SO4-NaCl system, while the relations between the energy density barrier of charge carrier formation and STZ formation depend on the added salt: the NaPO3-NaCl glasses follow a positive linear trend, while the NaPO3-Na2SO4 glasses show a broad distribution of ionic mobility energy barriers within a somewhat narrow distribution of STZ energy barrier densities. These results suggest that the plastic deformation in NaPO3-NaCl glasses is strongly coupled to the motion of the sodium cations, while the NaPO3-Na2SO4 glasses deform in a more homogeneous way, requiring the rearrangement of the sulfate and phosphate groups that are part of the glass network. In conjunction with the data from Figures 5, 6, we obtain a consistent picture of how the addition of NaCl shifts the structural units responsible for plastic deformation from the covalently-bonded phosphate network to the strongly ionic interchain Na+-Cl− “tissue.” The addition of sodium sulfate, on the other hand, barely affects the average effective mass of the “elementary unit” (Figure 6) and its distribution (Figure 5). The strongly changing ionic mobility energy barrier density in relation to the relatively constant SZT formation energy barrier density suggests a larger degree of cooperative motion involved in the diffusion of sodium ions, which is consistent with our impedance measurements.
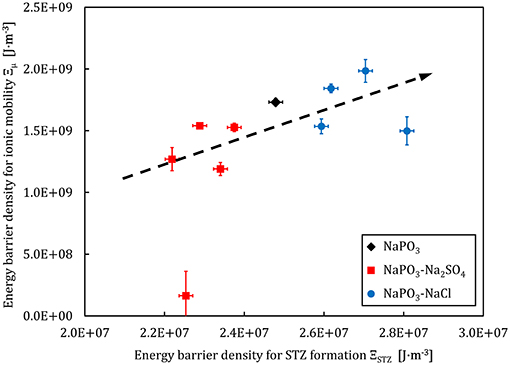
Figure 11. Ionic mobility energy barrier density and the STZ formation energy barrier density derived from experimental data for the NaPO3-NaCl-Na2SO4 glass system. The dashed line is a guide to the eye.
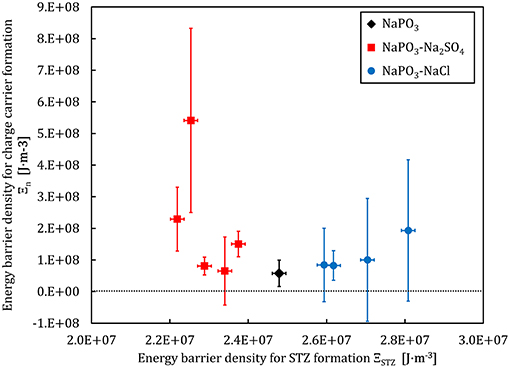
Figure 12. Charge carrier formation energy barrier density and the STZ formation energy barrier density derived from experimental data for the NaPO3-NaCl-Na2SO4 glass system.
Considering the growing influence of the sodium cation and its environment on the mechanical properties, we arrive at the conclusion that ionic glasses with 1D + 2D mixed networks are created upon the progressive addition of Na2SO4 and NaCl, where the respective constituents can be approximated as quasi-spheres that interact mainly via electrostatic forces. As opposite to traditional oxide glasses with covalent network structures, these electrostatic forces are longer ranging and less directional. This in turn allows us to interpret the indentation deformation of the NaPO3-Na2SO4-NaCl glasses in analogy to the mechanical behavior of metallic glasses and charged colloidal suspensions, which are characterized by spherical structural units, arranged as densely packed clusters bound via long-range, non-directional forces (Tokuyama, 1998; Pan et al., 2008; Varnik et al., 2014; Ma, 2015). The indentation deformation in such systems typically comprise the activation of flow units involving a collection of simultaneously operating STZs (Limbach et al., 2017). The volume of these flow units can be estimated by Pan et al. (2008):
where C′is a constant related to the cooperative shear model (Johnson and Samwer, 2005). Since all experiments were performed under isothermal conditions, the factor (k·T)/C′ is constant for all glasses and consequently, we can utilize the factor (m·H)−1 as a measure for the compositional dependence of the volume of the flow units (Figure 13). As Na2SO4 is added, an increase in (m·H)−1 is observed. On the other hand, NaCl incorporation initially results in a decrease of (m·H)−1 down to a minimum at x = 20. Further addition of NaCl causes (m·H)−1 to rapidly increase.
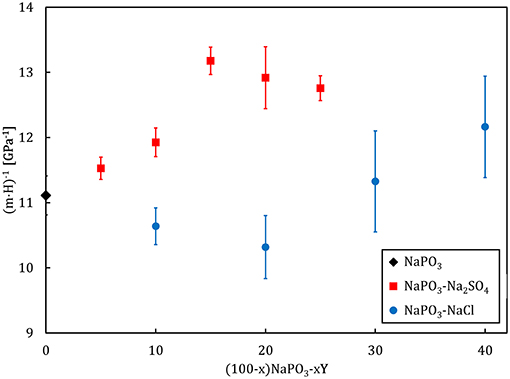
Figure 13. Compositional dependence of the flow event volume, gauged by (m · H)−1, for the NaPO3-NaCl-Na2SO4 glass system.
The effect of sulfate addition follows the slight decrease in the average effective mass of each “elementary unit” of plastic flow (Figure 6) as the deformation homogeneity remains constant, as reflected by the marginal changes in the strain-rate sensitivity of the NaPO3-Na2SO4 glasses (Figure 5). However, the addition of NaCl illustrates the more complex scenario of the changing topological structures controlling the plastic deformation. Starting from NaPO3, the addition of NaCl continuously increases the mobility of the phosphate chains. This is accompanied by a decreasing volume of the flow events and a lower strain-rate sensitivity, which indicates that the plastic deformation becomes more and more localized around the most mobile phosphate chains. At ~20 mol% NaCl, the interchain Na+-Cl− “tissue” reaches a critical threshold and starts to concentrate the flow events, causing the phosphate chains to stop being the controlling factor. Further, addition of NaCl continuously decreases the glass transition temperature and the strain-rate sensitivity but increases the volume of the flow units since the fraction of the ionic interchain “tissue” also increases. Analogous behavior can be found on several physical properties of inorganic glass systems with marked compositional-dependent transitions in the glass topology (Vaills et al., 2005; Micoulaut and Phillips, 2007; Micoulaut, 2008), e.g., in (100–x)AgPO3-xAgI system at x ~ 20 (Micoulaut et al., 2009; Novita et al., 2009).
The dependence of the volume of flow events on interactions beyond the short-range scale is exemplified in the direct correlation to the effective ionic mobility (calculated for T = 323 K), illustrated in Figure 14. The ionic mobility contains information on the correlated motion of ions through the Haven ratio (Murch, 1982; Murch and Dyre, 1989), which the Impedance analysis suggests exhibits a non-trivial compositional dependence (Figure 10). These results relate back to the increased tendency for a localization of the plastic deformation upon the addition of NaCl (Figure 5), reflecting the smaller STZ volumes and lower ionic mobility in relation to the sodium metaphosphate. On the other hand, the addition of Na2SO4 strongly increases the ionic mobility, leading to larger STZ volumes but no change in the localization of deformation, also in line with recent results from Raman measurements of the Boson peak in indented SiO2 (Benzine et al., 2018).
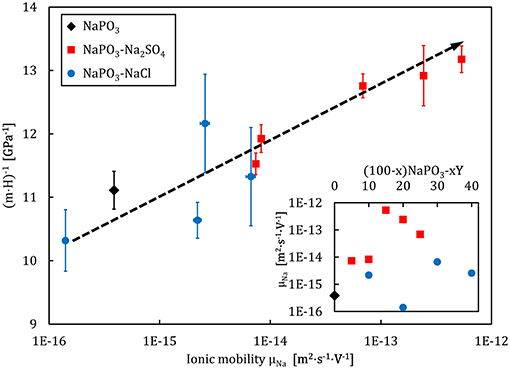
Figure 14. Flow event volume, gauged by (m · H)−1, as a function of the logarithm of ionic mobility (at T = 323 K) for the NaPO3-NaCl-Na2SO4 glass system. The dashed line is a guide to the eye. The inset shows the compositional dependence of the ionic mobility.
Conclusions
In this work we have shown an interesting correlation between the atomic motions governing the ionic conductivity and the plastic deformation in sodium metaphosphate glasses containing sodium sulfate and sodium chloride, respectively. In summary, the structure and physical properties of melt-quenched NaPO3-NaCl-Na2SO4 glasses were characterized. The addition of sulfate and halide salts was found to maintain the phosphate network largely untouched, while the coordination sphere around the Na+ cations changes, whereas the medium-range order evolves from 2D phosphate chains to a heterogeneous 1D + 2D mixed network. The addition of NaCl enhances the Young's modulus and results in a stronger localization of the plastic flow, while the addition of Na2SO4 on the other hand, keeps the Young's modulus and the homogeneity of the plastic flow events basically constant. Due to the similar atomic masses of the PO and SO tetrahedra, the average effective mass of the “elementary unit” remains constant as well. Impedance measurements show a moderate increase in ionic conductivity as a result of the enhanced mobility of the Na+ cation, while the number density of charge carriers decreases with the addition of the two sodium salts. We observed a smaller STZ volume in glasses with less mobile ions and a more localized deformation, whereas higher ionic mobilities at similar localization degrees imply a larger STZ volume. This reflects in lower average effective masses for the elementary units of deformation, as the plastic flow events are concentrated in a smaller volume and become more dependent on the movement of the lighter ions. A higher Na+ mobility increases the average displacement of the ions, leading to stronger cooperative motions, and a larger volume of the flow units.
Data Availability
The datasets generated for this study are available on request to the corresponding author.
Author Contributions
All authors listed have made a substantial, direct and intellectual contribution to the work, and approved it for publication.
Funding
The financial support of the German Science Foundation through its priority program SPP 1594 (project number WO 1220/14-1), the European Research Council under the EU's Horizon 2020 research and innovation program (ERC grant UTOPES, grant agreement number 681652), and the Australian Research Council (grant number DP170104367) are gratefully acknowledged.
Conflict of Interest Statement
The authors declare that the research was conducted in the absence of any commercial or financial relationships that could be construed as a potential conflict of interest.
References
Almond, D. P., Duncan, G. K., and West, A. R. (1983). The determination of hopping rates and carrier concentrations in ionic conductors by a new analysis of ac conductivity. Solid State Ion. 8, 159–164. doi: 10.1016/0167-2738(83)90079-6
Almond, D. P., Hunter, C. C., and West, A. R. (1984). The extraction of ionic conductivities and hopping rates from a.c. conductivity data. J. Mater. Sci. 19, 3236–3248. doi: 10.1007/BF00549810
Almond, D. P., and West, A. R. (1983). Impedance and modulus spectroscopy of “real” dispersive conductors. Solid State Ion. 11, 57–64. doi: 10.1016/0167-2738(83)90063-2
Bandara, T. M. W. J., and Mellander, B.-E. (2011). “Evaluation of mobility , diffusion coefficient and density of charge carriers in ionic liquids and novel electrolytes based on a new model for dielectric response,” in Ionic Liquids: Theory, Properties, New Approaches, ed A. Kokorin (Rijeka: Intech), 384–407. doi: 10.5772/15183
Barsoukov, E., and Macdonald, J. R. (eds.). (2005). Impedance Spectroscopy: Theory, Experiment, and Applications, 2nd Edn. Hoboken, NJ: Wiley-Interscience. doi: 10.1002/0471716243
Benzine, O., Bruns, S., Pan, Z., Durst, K., and Wondraczek, L. (2018). Local deformation of glasses is mediated by rigidity fluctuation on nanometer scale. Adv. Sci. 5:1800916. doi: 10.1002/advs.201800916
Bhattacharya, S., and Ghosh, A. (2004). Conductivity spectra in fast ion conducting glasses: Mobile ions contributing to transport process. Phys. Rev. B 70:172203. doi: 10.1103/PhysRevB.70.172203
Bhide, A., and Hariharan, K. (2007). Sodium ion transport in NaPO3-Na2SO4 glasses. Mater. Chem. Phys. 105, 213–221. doi: 10.1016/j.matchemphys.2007.04.044
Bouchbinder, E., and Langer, J. S. (2009a). Non-equilibrium thermodynamics of amorphous materials. II: effective-temperature theory. Phys. Rev. E 80:31132. doi: 10.1103/PhysRevE.80.031132
Bouchbinder, E., and Langer, J. S. (2009b). Non-equilibrium thermodynamics of driven amorphous materials. I. Internal degrees of freedom and volume deformation. Phys. Rev. E 80:31131. doi: 10.1103/PhysRevE.80.031131
Bouchbinder, E., and Langer, J. S. (2009c). Non-equilibrium thermodynamics of driven amorphous materials. III. Shear-transformation-zone plasticity. Phys. Rev. E 80:31133. doi: 10.1103/PhysRevE.80.031133
Bouchbinder, E., and Langer, J. S. (2011). Shear-transformation-zone theory of linear glassy dynamics. Phy. Rev. E 83:61503. doi: 10.1103/PhysRevE.83.061503
Brow, R. K. (2000). Review: the structure of simple phosphate glasses. J. Non Cryst. Solids 263–264, 1–28. doi: 10.1016/S0022-3093(99)00620-1
Brow, R. K., Osborne, Z. A., and Kirkpatrick, R. J. (1992). A multinuclear MAS NMR study of the short-range structure of fluorophosphate glass. J. Mater. Res. 7, 1892–1899. doi: 10.1557/JMR.1992.1892
Brow, R. K., Tallant, D. R., Myers, S. T., and Phifer, C. C. (1995). The short-range structure of zinc polyphosphate glass. J. Non Cryst. Solids 191, 45–55. doi: 10.1016/0022-3093(95)00289-8
Cutroni, M., Magistris, A., and Villa, M. (1992). Dynamics and structure of (Ag2S)x(AgPO3)1-x glasses studied by ultrasounds and 31P NMR. Solid State Ion. 53–56, 1232–1236. doi: 10.1016/0167-2738(92)90318-J
Da, N., Grassme, O., Nielsen, K. H., Peters, G., and Wondraczek, L. (2011). Formation and structure of ionic (Na, Zn) sulfophosphate glasses. J. Non Cryst. Solids 357, 2202–2206. doi: 10.1016/j.jnoncrysol.2011.02.037
Dyre, J. C. (2006). The glass transition and elastic models of glass-forming liquids. Rev. Mod. Phys. 78, 953–972. doi: 10.1103/RevModPhys.78.953
Fan, Y., Iwashita, T., and Egami, T. (2014). How thermally activated deformation starts in metallic glass. Nat. Commun. 5:5083. doi: 10.1038/ncomms6083
Greaves, G. N., Greer, A. L., Lakes, R. S., and Rouxel, T. (2011). Poisson's ratio and modern materials. Nat. Mater. 10, 823–837. doi: 10.1038/nmat3134
Hairetdinov, E. F., Uvarov, N. F., Patel, H. K., and Martin, S. W. (1994). Estimation of the free-charge-carrier concentration in fast-ion conducting Na2S-B2S3 glasses from an analysis of the frequency-dependent conductivity. Phy. Rev. B 50, 13259–13266. doi: 10.1103/PhysRevB.50.13259
Hay, J. (2009). Introduction to instrumented indentation testing. Exp. Tech. 33, 66–72. doi: 10.1111/j.1747-1567.2009.00541.x
Heuer, A., and Spiess, H. W. (1994). Universality of the glass transition temperature. J. Non Cryst. Solids 176, 294–298. doi: 10.1016/0022-3093(94)90090-6
Hodge, I. M., Ingram, M. D., and West, A. R. (1976). Impedance and modulus spectroscopy of polycrystalline solid electrolytes. J. Electroanal. Chem. 74, 125–143. doi: 10.1016/S0022-0728(76)80229-X
Hong, L., Novikov, V. N., and Sokolov, A. P. (2011). Is there a connection between fragility of glass forming systems and dynamic heterogeneity/cooperativity? J. Non Cryst. Solids 357, 351–356. doi: 10.1016/j.jnoncrysol.2010.06.071
Hraiech, S., and Ferid, M. (2013). Synthesis, electrical and dielectric properties of (Na2O)0.5-(P2O5)0.5 glass. J. Alloys Compd. 577, 543–549. doi: 10.1016/j.jallcom.2013.06.168
Hudgens, J. J., Brow, R. K., Tallant, D. R., and Martin, S. W. (1998). Raman spectroscopy study of the structure of lithium and sodium ultraphosphate glasses. J. Non Cryst. Solids 223, 21–31. doi: 10.1016/S0022-3093(97)00347-5
Hufnagel, T. C., Schuh, C. A., and Falk, M. L. (2016). Deformation of metallic glasses: recent developments in theory, simulations, and experiments. Acta Mater. 109, 375–393. doi: 10.1016/j.actamat.2016.01.049
Jabraoui, H., Vaills, Y., Hasnaoui, A., Badawi, M., and Ouaskit, S. (2016). Effect of sodium oxide modifier on structural and elastic properties of silicate glass. J. Phys. Chem. B 120, 13193–13205. doi: 10.1021/acs.jpcb.6b09664
Johnson, K. L. (1985). Contact Mechanics. Cambridge: Cambridge University Press. doi: 10.1017/CBO9781139171731
Johnson, W. L., and Samwer, K. (2005). A universal criterion for plastic yielding of metallic glasses with a (T/Tg)2/3 temperature dependence. Phys. Rev. Lett. 95:195501. doi: 10.1103/PhysRevLett.95.195501
Jun, L., Portier, J., Tanguy, B., Videau, J. J., Allal, M. A., Morcos, J., et al. (1990). Application of silver conducting glasses to solid state batteries and sensors. Active Passive Electr. Comp. 14, 81–94. doi: 10.1155/1990/82403
Kabi, S., and Ghosh, A. (2014). Ion dynamics in glassy ionic conductors: scaling of mean square displacement of mobile ions. Europhys. Lett. 108:36002. doi: 10.1209/0295-5075/108/36002
Kapoor, S., Loennroth, N., Youngman, R. E., Rzoska, S. J., Bockowski, M., Jensen, L. R., et al. (2017). Pressure-driven structural depolymerization of zinc phosphate glass. J. Non Cryst. Solids 469, 31–38. doi: 10.1016/j.jnoncrysol.2017.04.011
Kartini, E., Kennedy, S. J., Itoh, K., Kamiyama, T., Collins, M. F., and Suminta, S. (2004). Anion effect on the structure of Ag2S-AgPO3 superionic glasses. Solid State Ion. 167, 65–71. doi: 10.1016/j.ssi.2003.12.021
Kartini, E., Kennedy, S. J., Sakuma, T., Itoh, K., Fukunaga, T., Collins, M. F., et al. (2002). Structural , thermal and electrical properties of AgI-Ag2S-AgPO3 superionic glasses. J. Non Cryst. Solids 312–314, 628–632. doi: 10.1016/S0022-3093(02)01782-9
Kawasaki, T., Araki, T., and Tanaka, H. (2007). Correlation between dynamic heterogeneity and medium-range order in two-dimensional glass-forming liquids. Phys. Rev. Lett. 99:215701. doi: 10.1103/PhysRevLett.99.215701
Kim, J. G., Son, B., Mukherjee, S., Schuppert, N., Bates, A., Kwon, O., et al. (2015). A review of lithium and non-lithium based solid state batteries. J. Power Sources 282, 299–322. doi: 10.1016/j.jpowsour.2015.02.054
Konidakis, I., Varsamis, C. P. E., and Kamitsos, E. I. (2011). Effect of synthesis method on the structure and properties of AgPO3-based glasses. J. Non Cryst. Solids 357, 2684–2689. doi: 10.1016/j.jnoncrysol.2011.03.013
Le, Q. H., Palenta, T., Benzine, O., Griebenow, K., Limbach, R., Kamitsos, E. I., et al. (2017). Formation, structure and properties of fluoro-sulfo-phosphate poly-anionic glasses. J. Non Cryst. Solids 477, 58–72. doi: 10.1016/j.jnoncrysol.2017.09.043
Li, X., and Bhushan, B. (2002). A review of nanoindentation continuous stiffness measurement technique and its applications. Mater. Char. 48, 11–36. doi: 10.1016/S1044-5803(02)00192-4
Limbach, R., Kosiba, K., Pauly, S., Kuehn, U., and Wondraczek, L. (2017). Serrated flow of CuZr-based bulk metallic glasses probed by nanoindentation: role of the activation barrier, size and distribution of shear transformation zones. J. Non Cryst. Solids 459, 130–141. doi: 10.1016/j.jnoncrysol.2017.01.015
Limbach, R., Rodrigues, B. P., Moencke, D., and Wondraczek, L. (2015). Elasticity, deformation and fracture of mixed fluoride-phosphate glasses. J. Non Cryst. Solids 430, 99–107. doi: 10.1016/j.jnoncrysol.2015.09.025
Limbach, R., Rodrigues, B. P., and Wondraczek, L. (2014). Strain-rate sensitivity of glasses. J. Non Cryst. Solids 404, 124–134. doi: 10.1016/j.jnoncrysol.2014.08.023
Liu, Y. H., Wang, K., Inoue, A., Sakurai, T., and Chen, M. W. (2010). Energetic criterion on the intrinsic ductility of bulk metallic glasses. Scr. Mater. 62, 586–589. doi: 10.1016/j.scriptamat.2009.12.042
Lucas, B. N., and Oliver, W. C. (1999). Indentation power-law creep of high-purity indium. Metal. Mater. Transact. A 30, 601–610. doi: 10.1007/s11661-999-0051-7
Lvovich, V. F. (2012). Impedance Spectroscopy–Applications to Electrochemical and Dielectric Phenomena. Hoboken, NJ: John Wiley & Sons. doi: 10.1002/9781118164075
Malugani, J. P., Mercier, R., Fahys, B., and Robert, G. (1982). Ionic conductivity of and Raman spectroscopy investigation binary oxosalts (1-x)AgPO3-xAg2SO4 glasses. J. Solid State Chem. 45, 309–316. doi: 10.1016/0022-4596(82)90176-1
Mantisi, B., Tanguy, A., Kermouche, G., and Barthel, E. (2012). Atomistic response of a model silica glass under shear and pressure. Eur. Phys. J. B 85:304. doi: 10.1140/epjb/e2012-30317-6
Marple, M. A. T., Avila-Paredes, H., Kim, S., and Sen, S. (2018). Atomistic interpretation of the ac-dc crossover frequency in crystalline and glassy ionic conductors. J. Chem. Phys. 148:204507. doi: 10.1063/1.5026685
Martin, S. W. (1991). Ionic conduction in phosphate glasses. J. Am. Ceramic Soc. 74, 1767–1784. doi: 10.1111/j.1151-2916.1991.tb07788.x
Martin, S. W., and Angell, C. A. (1986). DC and AC conductivity in wide composition range Li2O-P2O5 glasses. J. Non Cryst. Solids 83, 185–207. doi: 10.1016/0022-3093(86)90067-0
Micoulaut, M. (2008). Constrained interactions, rigidity, adaptative networks, and their role for the description of silicates. Am. Mineral. 93, 1732–1748. doi: 10.2138/am.2008.2903
Micoulaut, M., Malki, M., Novita, D. I., and Boolchand, P. (2009). Fast-ion conduction and flexibility and rigidity of solid electrolyte glasses. Phys. Rev. B 80:184205. doi: 10.1103/PhysRevB.80.184205
Micoulaut, M., and Phillips, J. C. (2007). Onset of rigidity in glasses: from random to self-organized networks. J. Non Cryst. Solids 353, 1732–1740. doi: 10.1016/j.jnoncrysol.2007.01.078
Möncke, D., Sirotkin, S., Stavrou, E., Kamitsos, E. I., and Wondraczek, L. (2014). Partitioning and structural role of Mn and Fe ions in ionic sulfophosphate glasses. J. Chem. Phys. 141:224509. doi: 10.1063/1.4903191
Murch, G. E. (1982). The Nernst-Einstein equation in high-defect-content solids. Philos. Magazine A 45, 685–692. doi: 10.1080/01418618208236198
Murch, G. E., and Dyre, J. C. (1989). Correlation effects in ionic conductivity. Crit. Rev. Solid State Mater. Sci. 15, 345–365. doi: 10.1080/10408438908243739
Ngai, K. L., and Moynihan, C. T. (1998). The dynamics of mobile ions in ionically conducting glasses and other materials. Mater. Res. Soc. Bull. 23, 51–56. doi: 10.1557/S0883769400031006
Novita, D. I., Boolchand, P., Malki, M., and Micoulaut, M. (2009). Elastic flexibility, fast-ion conduction, boson and floppy modes in AgPO3-AgI glasses examined in Raman scattering, infrared reflectance, modulated differential scanning calorimetry, ac electrical conductivity and molar volume experiments. J. Phys.Condensed Matter. 21:205106. doi: 10.1088/0953-8984/21/20/205106
Oliver, W. C., and Pharr, G. M. (1992). An improved technique for determining hardness and elastic modulus using load and displacement sensing indentation experiments. J. Mater. Res. 7, 1564–1583. doi: 10.1557/JMR.1992.1564
Pan, D., Inoue, A., Sakurai, T., and Chen, M. W. (2008). Experimental characterization of shear transformation zones for plastic flow of bulk metallic glasses. Proc. Natl. Acad. Sci. U.S.A. 105, 14769–14772. doi: 10.1073/pnas.0806051105
Pedone, A., Malavasi, G., Cormack, A. N., Segre, U., and Menziani, M. C. (2008a). Elastic and dynamical properties of alkali-silicate glasses from computer simulations techniques. Theor. Chem. Acc. 120, 557–564. doi: 10.1007/s00214-008-0434-7
Pedone, A., Malavasi, G., Menziani, M. C., Segre, U., and Cormack, A. N. (2008b). Role of magnesium in soda-lime glasses: insight into structural, transport, and mechanical properties through computer simulations. J. Phys. Chem. C 112, 11034–11041. doi: 10.1021/jp8016776
Perez, J. (1994). Theories of liquid-glass transition. J. Food Eng. 22, 89–114. doi: 10.1016/0260-8774(94)90027-2
Pharr, G. M., Oliver, W. C., and Brotzen, F. R. (1992). On the generality of the relationship among contact stiffness, contact area and elastic modulus during indentation. J. Mater. Res. 7, 613–617. doi: 10.1557/JMR.1992.0613
Pharr, G. M., Strader, J. H., and Oliver, W. C. (2009). Critical issues in making small-depth mechanical property measurements by nanoindentation with continuous stiffness measurement. J. Mater. Res. 24, 653–666. doi: 10.1557/jmr.2009.0096
Popov, I. I., Nigmatullin, R. R., Khamzin, A. A., and Lounev, I. V. (2012). Conductivity in disordered structures: verification of the generalized Jonscher's law on experimental data. J. Phys. 394:12026. doi: 10.1088/1742-6596/394/1/012026
Queiroz, C. A., and Sestak, J. (2010). Aspects of the non-crystalline state. Phys. Chem. Glasses 51, 165–172.
Rahmani, Y., Koopman, R., Denisov, D., and Schall, P. (2014). Visualizing the strain evolution during the indentation of colloidal glasses. Phys. Rev. E 89:12304. doi: 10.1103/PhysRevE.89.012304
Rao, R. P., and Seshasayee, M. (2004). Molecular dynamics simulation of ternary glasses Li2O-P2O5-LiCl. Solid State Commun. 131, 537–542. doi: 10.1016/j.ssc.2004.06.019
Rao, R. P., Tho, T. D., and Adams, S. (2009). Lithium ion transport pathways in xLiCl-(1-x)(0.6Li2O-0.4P2O5) glasses. J. Power Sources 189, 385–390. doi: 10.1016/j.jpowsour.2008.07.089
Rodney, D., Tanguy, A., and Vandembroucq, D. (2011). Modeling the mechanics of amorphous solids at different length scale and time scale. Model. Simul. Mater. Sci. Eng. 19:83001. doi: 10.1088/0965-0393/19/8/083001
Rodrigues, A. C., Nascimento, M. L., Bragatto, C. B., and Souquet, J. L. (2011). Charge carrier mobility and concentration as a function of composition in AgPO3-AgI glasses. J. Chem. Phys. 135:234504. doi: 10.1063/1.3666835
Rodrigues, B. P., Ebendorff-Heidepriem, H., and Wondraczek, L. (2019). Decoupling mobility and charge carrier concentration in AgR-AgPO3 glasses (R = Cl, Br, I). Solid State Ion. 334, 99–104. doi: 10.1016/j.ssi.2019.02.009
Rodrigues, B. P., and Wondraczek, L. (2013). Medium-range topological constraints in binary phosphate glasses. J. Chem. Phys. 138:244507. doi: 10.1063/1.4810868
Rouxel, T. (2006). Elastic properties of glasses: a multiscale approach. Comptes Rendus Mecanique 334, 743–753. doi: 10.1016/j.crme.2006.08.001
Rouxel, T. (2007). Elastic properties and short-to medium-range order in glasses. J. Am. Ceramic Soc. 90, 3019–3039. doi: 10.1111/j.1551-2916.2007.01945.x
Rouxel, T., Ji, H., Hammouda, T., and Moréac, A. (2008a). Poisson's ratio and the densification of glass under high pressure. Phys. Rev. Lett. 100:225501. doi: 10.1103/PhysRevLett.100.225501
Rouxel, T., Ji, H., Keryvin, V., Hammouda, T., and Yoshida, S. (2008b). Poisson's ratio and the glass network topology–relevance to high pressure densification and indentation behavior. Adv. Mater. Res. 39–40, 137–146. doi: 10.4028/www.scientific.net/AMR.39-40.137
Sangoro, J. R., and Kremer, F. (2012). Charge transport and glassy dynamics in ionic liquids. Acc. Chem. Res. 45, 525–532. doi: 10.1021/ar2001809
Saunders, G. A., Metcalfe, R. D., Cutroni, M., Federico, M., and Piccolo, A. (1996). Elastic and anelastic properties, vibrational anharmonicity, and fractal bond connectivity of superionic glasses. Phys. Rev. B 53, 5287–5300. doi: 10.1103/PhysRevB.53.5287
Schall, P., Weitz, D. A., and Spaepen, F. (2007). Structural rearrangements that govern flow in colloidal glasses. Science 318, 1895–1899. doi: 10.1126/science.1149308
Scotti, S., Villa, M., Mustarelli, P., and Cutroni, M. (1992). Structure, conductivity and acoustic attenuation in (Ag2SO4)x(AgPO3)1-x. Solid State Ion. 53–56, 1237–1244. doi: 10.1016/0167-2738(92)90319-K
Shen, L., Cheong, W. C. D., Foo, Y. L., and Chen, Z. (2012). Nanoindentation creep of tin and aluminium: a comparative study between constant load and constant strain rate methods. Mater. Sci. Eng. A 532, 505–510. doi: 10.1016/j.msea.2011.11.016
Shuker, R., and Gammon, R. W. (1970). Raman-scattering selection-rule breaking and the density of states in amorphous materials. Phys. Rev. Lett. 25, 222–225. doi: 10.1103/PhysRevLett.25.222
Sidebottom, D. L. (2009). Understanding ion motion in disordered solids from impedance spectroscopy scaling. Rev. Mod. Phys. 81, 999–1014. doi: 10.1103/RevModPhys.81.999
Singh, D. P., Shahi, K., and Kar, K. K. (2016). Superlinear frequency dependence of AC conductivity and its scaling behavior in xAgI-(1-x)AgPO3 glass superionic conductors. Solid State Ion. 287, 89–96. doi: 10.1016/j.ssi.2016.01.048
Sirotkin, S., Meszaros, R., and Wondraczek, L. (2012). Chemical stability of ZnO-Na2O-SO3-P2O5 glasses. Int. J. Appl. Glass Sci. 3, 44–52. doi: 10.1111/j.2041-1294.2011.00076.x
Sokolov, I. A., Valova, N. A., Tarlakov, Y. P., and Pronkin, A. A. (2003). Electrical properties and the structure of glasses in the Li2SO4-LiPO3 system. Glass Phys. Chem. 29, 548–554. doi: 10.1023/B:GPAC.0000007930.11101.ee
Souquet, J. L. (1981). Electrochemical properties of ionically conductive glasses. Solid State Ion. 5, 77–82. doi: 10.1016/0167-2738(81)90198-3
Spaepen, F. (1977). A microscopic mechanism for steady state inhomogeneous flow in metallic glasses. Acta Metal. 25, 407–415. doi: 10.1016/0001-6160(77)90232-2
Thieme, A., Moencke, D., Limbach, R., Fuhrmann, S., Kamitsos, E. I., and Wondraczek, L. (2015). Structure and properties of alkali and silver sulfophosphate glasses. J. Non Cryst. Solids 410, 142–150. doi: 10.1016/j.jnoncrysol.2014.11.029
Tokuyama, M. (1998). Theory of slow dynamics in highly charged colloidal suspensions. Phys. Rev. E 58, R2729–R2732. doi: 10.1103/PhysRevE.58.R2729
Tsamados, M., Tanguy, A., Goldenberg, C., and Barrat, J. L. (2009). Local elasticity map and plasticity in a model Lennard-Jones glass. Phys. Rev. E 80:26112. doi: 10.1103/PhysRevE.80.026112
Tuller, H. L., Button, D. P., and Uhlmann, D. R. (1980). Fast ion transport in oxide glasses. J. Non Cryst. Solids 40, 93–118. doi: 10.1016/0022-3093(80)90096-4
Vaills, Y., Qu, T., Micoulaut, M., Chaimbault, F., and Boolchand, P. (2005). Direct evidence of rigidity loss and self-organization in silicate glasses. J. Phys. 17, 4889–4896. doi: 10.1088/0953-8984/17/32/003
Varnik, F., Mandal, S., Chikkadi, V., Denisov, D., Olsson, P., Vågberg, D., et al. (2014). Correlations of plasticity in sheared glasses. Phys. Rev. E 89:40301. doi: 10.1103/PhysRevE.89.040301
Velli, L. L., Varsamis, C. P. E., Kamitsos, E. I., Moencke, D., and Ehrt, D. (2005). Structural investigation of metaphosphate glasses. Phys. Chem. Glasses 46, 178–181.
Keywords: phosphate glasses, nanoindentation, shear transformation zones, impedance spectroscopy, ionic mobility
Citation: Poletto Rodrigues B, Limbach R, Buzatto de Souza G, Ebendorff-Heidepriem H and Wondraczek L (2019) Correlation Between Ionic Mobility and Plastic Flow Events in NaPO3-NaCl-Na2SO4 Glasses. Front. Mater. 6:128. doi: 10.3389/fmats.2019.00128
Received: 14 March 2019; Accepted: 15 May 2019;
Published: 04 June 2019.
Edited by:
Takayuki Komatsu, Nagaoka University of Technology, JapanReviewed by:
Jean-Pierre Guin, University of Rennes 1, FranceHirokazu Masai, National Institute of Advanced Industrial Science and Technology (AIST), Japan
Copyright © 2019 Poletto Rodrigues, Limbach, Buzatto de Souza, Ebendorff-Heidepriem and Wondraczek. This is an open-access article distributed under the terms of the Creative Commons Attribution License (CC BY). The use, distribution or reproduction in other forums is permitted, provided the original author(s) and the copyright owner(s) are credited and that the original publication in this journal is cited, in accordance with accepted academic practice. No use, distribution or reproduction is permitted which does not comply with these terms.
*Correspondence: Bruno Poletto Rodrigues, bruno.polettorodrigues@adelaide.edu.au