Confinement Effect of Concrete-Filled Steel Tube Columns With Infill Concrete of Different Strength Grades
 Liusheng He
 Siqi Lin
 Huanjun Jiang
- 1State Key Laboratory of Disaster Reduction in Civil Engineering, Tongji University, Shanghai, China
- 2Department of Disaster Mitigation for Structures, Tongji University, Shanghai, China
- 3Department of Architecture, Kanagawa University, Yokohama, Japan
Concrete-filled steel tube (CFST) columns are increasingly used in composite construction. Under axial compression, the steel tube will sustain partial axial force and meanwhile provides the confinement to the infill concrete. The high axial strength capacity of CFST columns is largely related to the confinement provided by the steel tube. Extensive studies on CFST columns have been conducted. Nevertheless, how to quantify the efficiency of confinement effect in CFST columns using concrete with different strength grades is still missing. To address this issue, a series of compressive loading tests on CFST columns were conducted in present study. The variable parameters studied include concrete strength and diameter-to-thickness ratio of the steel tube. Six CFST stub columns in total were designed and tested under uniaxial compression. Axial strength, stress state in the steel tube, confined concrete strength and confining pressure acting on the infill concrete were carefully investigated. Test results show that the confinement factor (defined as the ratio of the nominal strength of empty steel tube to that of the unconfined concrete) is the most dominant factor influencing the confinement effect, and a larger confinement factor gives higher confinement effect. The low-strength concrete exhibits better performance of ductility and confinement compared with the high-strength concrete. The index of equivalent confining pressure was used to quantify the level of passive confinement provided by the steel tube in CFST columns. Based on the test results, a method to quickly quantify the confining pressure provided by the steel tube was proposed.
Introduction
Concrete-filled steel tube (CFST) columns are increasingly used in the construction of highrise buildings which require high strength and large working space especially at lower stories. As compared to reinforced concrete columns, existence of the exterior steel tube not only bears a portion of axial load but also most importantly provides confinement to the infill concrete. With the confinement provided by the steel tube, axial strength of the infill concrete can be largely enhanced. Also, the restraining effect of the infill concrete can prevent or at least delay the local buckling of the steel tube. This interaction between the infill concrete and steel tube together contributes to the high strength and good ductility.
Within the domain of researches focusing on confined concrete, there were basically two categories according to the way how the confinement was applied, active confining and passive confining. In the study of actively confined concrete, the confining pressure was either initially increased to a target value and then kept constant or increased from zero to the target value and then kept constant (Imran and Pantazopoulou, 1996; Lim and Ozbakkaloglu, 2015; Zhao et al., 2018). In active confining, a significant level of confining pressure is applied to the concrete from the very beginning. While in CFST columns, the steel tube provides confinement to the infill concrete in a passive way. At very small axial shortening, there is basically no confining pressure applied to the infill concrete because of the larger Poisson's ratio of the steel than that of concrete. The confining stress from the steel tube develops slowly even when the concrete stress reaches 80% of its unconfined compressive strength (Kinoshita et al., 1994). Also, with the increase of axial shortening, the efficiency of confinement degrades after the steel tube enters into the inelastic outward buckling. Therefore, the confinement of the passively confined concrete as in CFST columns is different from that in the actively confined concrete. Nevertheless, many compressive strength models for the confined concrete adopt the results of actively confined concrete (Mander et al., 1988; Attard and Setunge, 1996). Meanwhile, among many types, CFST columns using circular steel tubes are considered more effective in obtaining high compressive strength and ductility. In the previous study on circular CFST columns, primary research focuses include diameter-to-thickness ratio of the steel tube (Sakino et al., 2004; Han et al., 2005; Gupta et al., 2007; Abed et al., 2013), concrete strength (Giakoumelis and Lam, 2004; Yu et al., 2007; Lam and Gardner, 2008), bond behavior between steel tube and concrete (Xue et al., 2012; Liao et al., 2013; Tao et al., 2016; Chen et al., 2017), etc. Many studies conclude that the confinement effect from the exterior steel tube to the infill concrete is the key parameter in CFST columns and various means to enhance the confinement effect have been reported (Hu et al., 2011; Ho and Lai, 2013; Lai and Ho, 2015; He et al., 2018; Shen et al., 2019). The level of confinement in active confining is quite straightforward and the confining pressure can be directly adopted as a direct index in quantification. However, different from active confining, the confining pressure in CFST columns is not constant. So far, there is still less work available yet regarding the quantification of the confinement effect in CFST columns.
This paper aims to quantify the passive confinement effect in CFST columns. To address this, a series of CFST column specimens with infill concrete of different strength grades were designed and uniaxially compressed. Axial strength, stress state of steel tube and development and quantification of confinement effect were carefully investigated.
Stress State of Steel Tube
For CFST columns under axial compression, the axial load N is sustained by both the steel tube (σz) and infill concrete (σcc), as shown in Figure 1. The stress component σθ of the steel tube is the source for the lateral confining pressure σr applied to the infill concrete. With the existence of σr, the concrete compressive strength is largely enhanced. In the actively confined concrete, the confined concrete strength, fcc, can be estimated by the following equation (Mander et al., 1988):
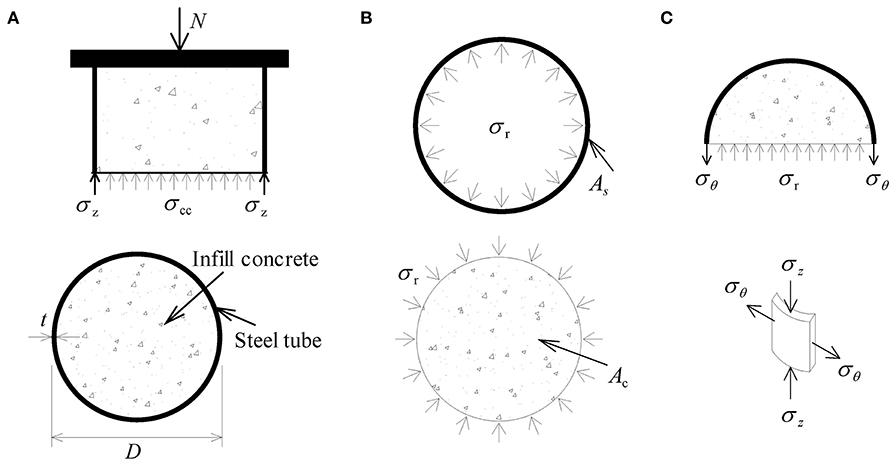
Figure 1. Stress state: (A) axial direction; (B) steel tube and infill concrete; (C) free body diagram.
where fc is the compressive strength of unconfined concrete; k is a confinement coefficient, the value of which depends on the infill concrete; and σr is the lateral confining pressure.
The value of the confinement coefficient k is often taken as 4.1 after the work by Richart et al. (1928). Though k should be a function of the concrete mix, its value is not much different for stronger or weaker concrete (Imran and Pantazopoulou, 1996).
In CFST columns, the lateral confining pressure can be calculated according to the force equilibrium condition of the cross section. As it can be seen from Figure 1C, the equilibrium of σr and σsθ gives
where D is the external diameter of the steel tube, and t is the steel tube thickness.
Once the hoop stress in the steel tube is obtained, the confining pressure provided by the steel tube to the infill concrete can be estimated.
Rewriting Equation 2 gives
Compressive strength of the infill concrete can be obtained by subtracting the force undertook by the steel tube from the overall axial strength of the column as follows.
where fcc is the compressive stress of the infill concrete; N is the axial load; As and Ac are the cross-sectional area of steel tube and concrete, respectively; and σz is the axial stress in the steel tube.
For the thin-walled steel tube, the von Mises yield criterion can be applied. Under both axial stress component σz and the hoop stress component σθ, the equivalent stress σe can be determined as follows.
In this study, elastic-perfectly plastic model is assumed for the tube steel. By comparing the equivalent stress σe with the yield stress, the steel tube can be identified to being yielding or not. The stress state of the steel tube can be calculated using the strain increment method (Hu et al., 2011). In the elastic range, the stress state is calculated by the generalized Hooke law:
where σz and σθ are the axial stress and hoop stress, respectively; εz and εθ are the axial strain and hoop strain, respectively; Es is the elastic modulus; ϑ is Poisson's ratio of the steel tube; and i is the present strain increment number.
For the elastic-plastic range, the stress increments are calculated from strain increments by the following equation:
where sx and sθ are the deviatoric strain and stress, respectively.
After obtaining the axial and hoop stresses of the steel tube based upon the measured axial and hoop strains at each loading step and the above equations, the confined concrete strength can be estimated according to Equation 4.
Experimental Program
Test Specimens
All specimens were designed to have a same length-to-diameter ratio of 3 to ensure stub column behavior. Table 1 gives the summary of the six specimens designed. Basically, they can be divided into two groups, Specimens 1–4 are in Group 1 with a tube diameter of 165.2 mm and thickness of 3.7 mm, and Specimens 5 and 6 in Group 2 use a tube diameter of 230 mm and thickness of 2.3 mm. The concrete was commercial ready-mixed concrete with normal mixing and curing techniques. The concrete strength of Specimens in Group 1 used four grades, with cylinder (with a diameter of 100 mm and height of 200 mm) compressive strengths of 29.5, 43.5, 58.0, and 81.6 N/mm2, respectively; Specimens in Group 2 used two grades of concrete, with cylinder compressive strengths of 32.0 and 64.0 N/mm2, respectively. All steel tubes were cold-formed carbon steel and seam welded by machine welding. To get the basic mechanical property of the steel material, three coupons were randomly cut from the steel tube and were tested according to standard procedures (Davis, 2004). The yield strengths of the steel tube were found to be 366.0 MPa for Group 1, and 360.8 MPa for Group 2, respectively. Before casting the infill concrete, the inner surface of the steel tube was smeared with a thin layer of grease to reduce the friction between the steel tube and concrete.
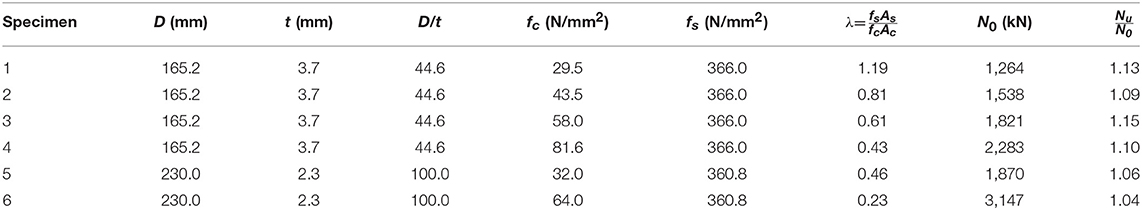
Table 1. Summary of test specimens.
Test Setup and Instrumentation
All specimens were subjected to monotonic axial compression exerted by a universal testing machine with a maximum capacity of 5,000 kN. At two end surfaces of the CFST column, two steel plates with a thickness of 50 mm were used to ensure even axial compression. Monotonic axial loading with displacement control was applied. For displacement control, axial shortening, the relative displacement between the top and bottom steel plates, was recorded and used as the actual compressive deformation. Two linear variable differential transducers (LVDTs) with a stroke of 50 mm was installed in parallel with the longitudinal axis of specimens to measure the axial shortening, as shown in Figure 2. To measure the strain state of the steel tubes, two bidirectional strain gauges were installed on the external surface of the steel tube at the mid-height.
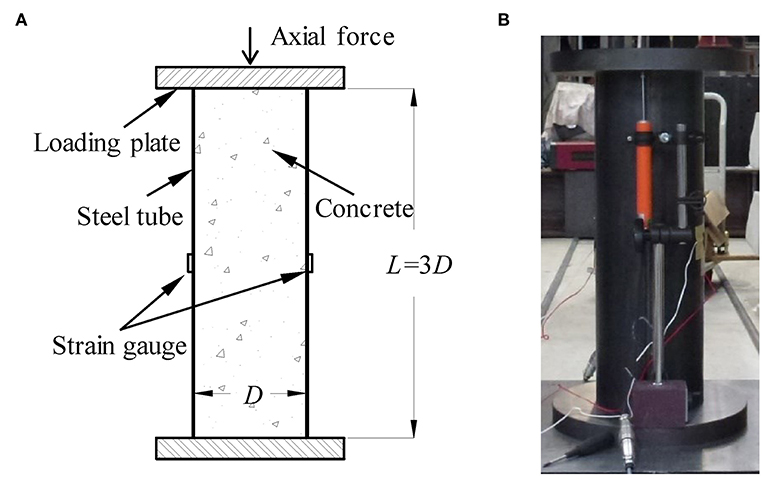
Figure 2. Test setup: (A) diagram; (B) photograph in test.
Test Results and Discussions
All specimens were centrally compressed. The compression loading was stopped when either the maximum axial shortening reached 5% of column length or axial strength dropped sharply.
General Observation
All loadings went smooth without brittle deformation observed. Figure 3 shows the final failure mode of all six specimens. All of them experienced similar failure mode, such as the outward buckling of the steel tube at both ends at large axial shortening and continuous expansion at the mid-height. For Specimens 4 and 6 using high-strength infill concrete, cylinder compressive strength of 81.6 and 64.0 N/mm2 respectively, exhibited clear sign of concrete crushing at the mid-height, which indicated the brittle characteristic of the high-strength concrete.
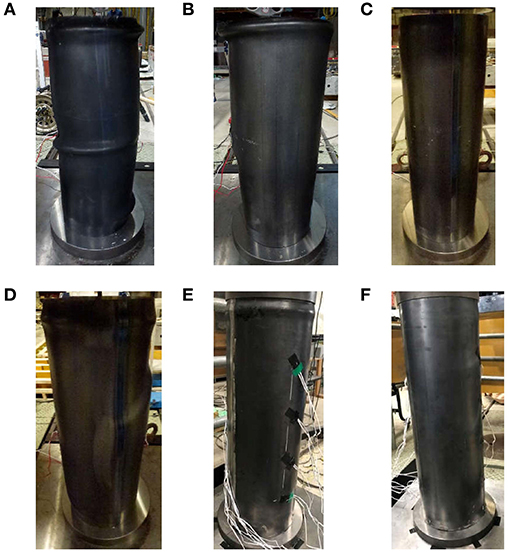
Figure 3. Failure modes: (A) specimen 1; (B) specimen 2; (C) specimen 3; (D) specimen 4; (E) specimen 5; (F) specimen 6.
Axial Strength Capacity
In order to compare the results, the nominal axial strength of CFT columns is defined as N0 = fsAs + fcAc, where fs is steel tube yield strength; As is the sectional area of steel tube; fc is concrete cylinder compressive strength; and Ac is the sectional area of concrete.
Figure 4 shows the measured axial load vs. compressive deformation for all specimens. The ordinate is the normalized axial strength, defined as the measured axial load N divided by the nominal axial strength N0, and the abscissa of axial shortening is the ratio of axial displacement measured by LVDTs to the height of columns. The most obvious difference in the load-deformation curves is the post-peak behavior. Only Specimen 1 demonstrated hardening behavior while the rest specimens showed more or less softening. Specimen 6 showed the sharpest decrease of strength beyond the peak strength and its deformability was the worst with the maximum axial displacement of only about 1% of the column length. Its axial strength dropped to less than half of the peak strength almost right after reaching the peak strength. Such a sudden decrease of axial strength needs to be avoided in view of collapse resistance capacity of the building. For specimens in both Group 1 and Group 2, low-strength concrete demonstrated less post-peak strength decrease than high-strength concrete. The width-to-thickness ratio of specimens in Group 2 is much larger than that of specimens in Group 1. While there is no clear difference in the shape of axial load-deformation curve, which means the width-to-thickness of the steel tube is not the controlling parameter for the post-peak behavior. As listed in the last column of Table 1, there is no much difference among the maximum normalized axial strength () for all the specimens, with the value of ranging between 1.04 and 1.15.
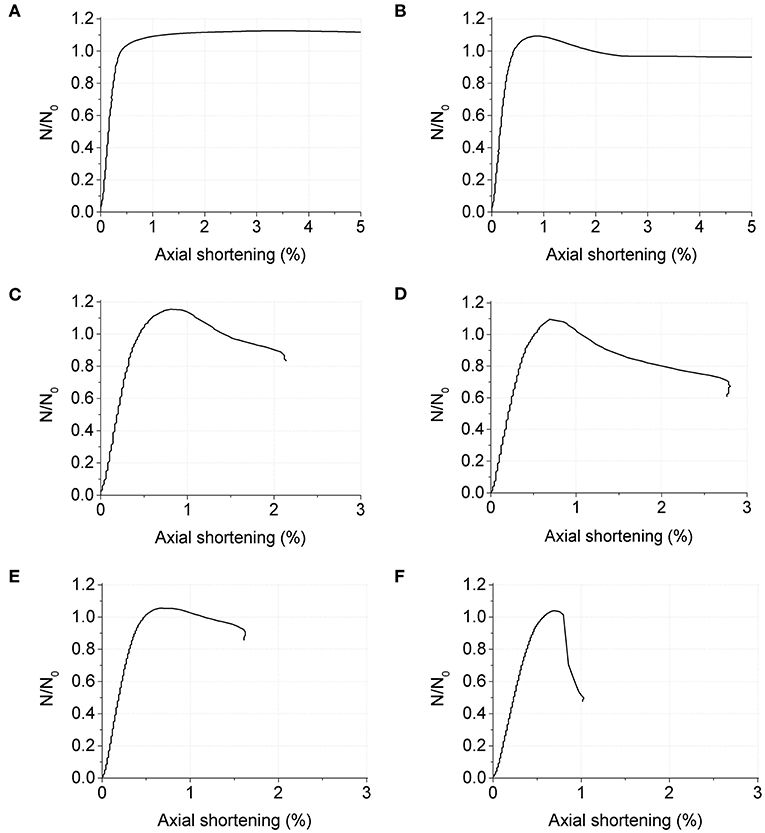
Figure 4. Axial load-deformation curves: (A) fc = 29.5, λ = 1.19; (B) fc = 43.5, λ = 0.81; (C) fc = 58.0, λ = 0.61; (D) fc = 81.6, λ = 0.43; (E) fc = 32.0, λ = 0.46; (F) fc = 64.0, λ = 0.23.
Strain State of Steel Tube and Calculated Stress
As introduced in the section of instrumentation, both the axial and hoop strains in the steel tube were measured by electrical strain gauges. The recorded strain readings were given in Figure 5. The ordinate of “nominal axial stress” was the ratio of axial load divided by the whole sectional area. With the increase of axial load, both the axial and hoop strains in the steel tube increased. In the linear branch, the absolute value of axial strain was about 3 times that of the hoop strain. Beyond the peak strength, Specimen 1 exhibited the most stable development of both axial strain and hoop strain, and Specimen 6 showed the most abrupt decrease of axial strain and hoop strain.
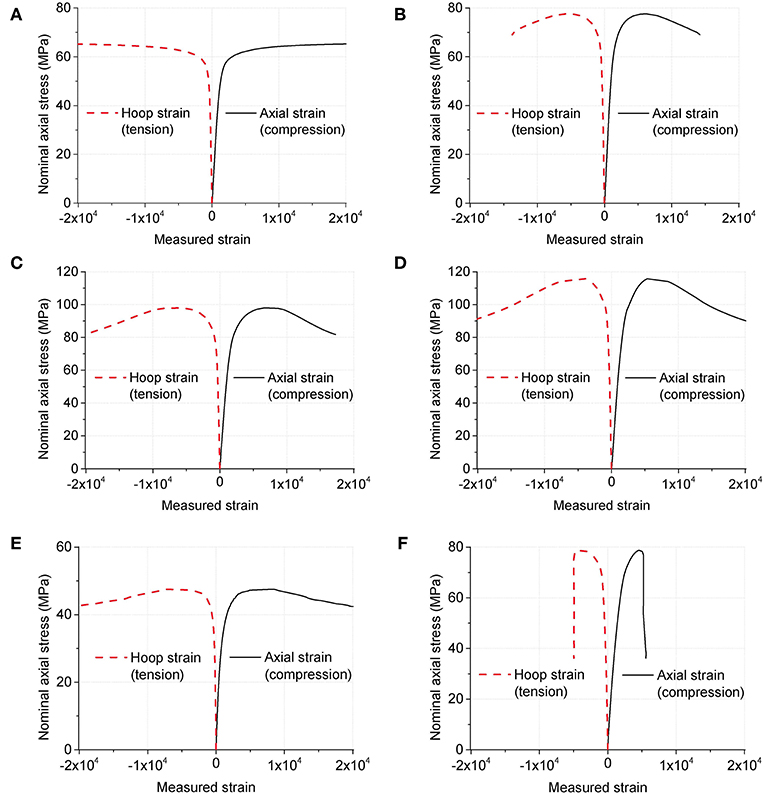
Figure 5. Recorded strain data: (A) fc = 29.5, λ = 1.19; (B) fc = 43.5, λ = 0.81; (C) fc = 58.0, λ = 0.61; (D) fc = 81.6, λ = 0.43; (E) fc = 32.0, λ = 0.46; (F) fc = 64.0, λ = 0.23.
Substituting the recorded strain data into Equations 6 and 7 gives the axial stress σz and hoop stress σθ of the steel tube, as shown in Figure 6. It is clear that the axial stress component was much larger than the hoop stress component. For instance, at an axial shortening of 0.5%, the axial stress in the steel tube of Specimen 1 was about 4 times the hoop stress; for Specimen 6, the ratio was about 25. In view of providing confinement to the infill concrete through the hoop stress component, the steel tube is far from being fully used.
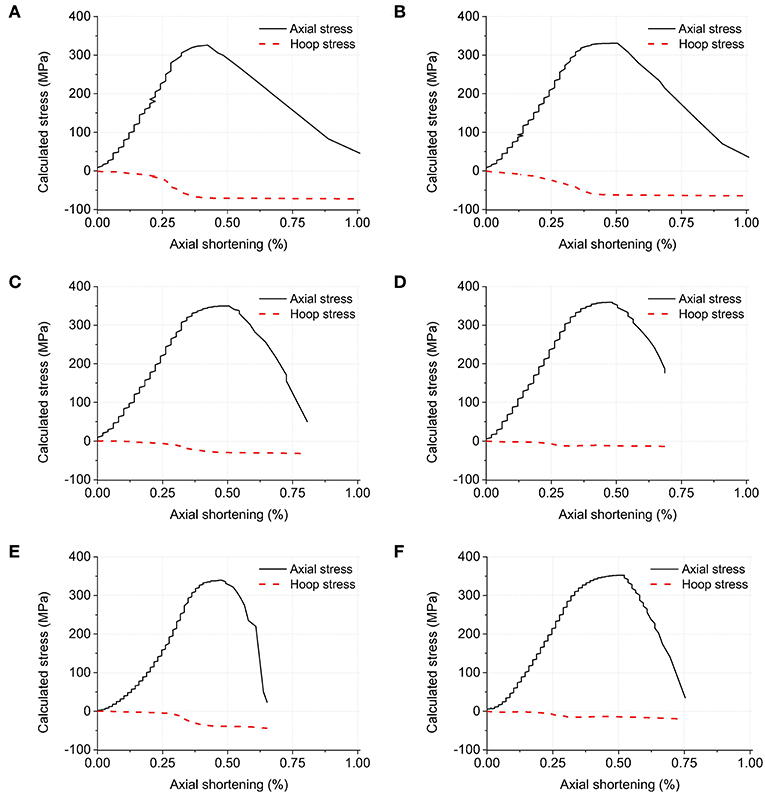
Figure 6. Calculated stress data: (A) fc = 29.5, λ = 1.19; (B) fc = 43.5, λ = 0.81; (C) fc = 58.0, λ = 0.61; (D) fc = 81.6, λ = 0.43; (E) fc = 32.0, λ = 0.46; (F) fc = 64.0, λ = 0.23.
Confinement Effect
The improved compressive strength of CFST columns is ascribed to the confinement provided by the steel tube to the infill concrete. The confinement effect is usually quantified by the confinement factor λ, expressed by in which As and Ac are the cross-sectional area of steel tube and concrete; and fs and fc are the strength of steel and concrete, respectively.
As described in a previous session, the maximum normalized axial strength () for specimens with different λ values was not much different for all the specimens. However, after the reaching of the maximum axial strength, the post-peak behavior was closely related to the value of λ. Specimens with a larger λ showed better ductility, which also answered the hardening or softening behavior in the axial load-deformation curves. For Specimens 4 and 5 having similar confinement factor, Specimen 5 using low strength concrete exhibited smaller decrease of axial strength. For instance, nominal axial strength deceased to 0.95 for Specimen 5 at an axial shortening of 1.5%, while 0.79 for Specimen 4 using high strength concrete. Further loading of Specimen 5 was terminated after a drift ratio of 1.6% due to the malfunction of LVDT sensor rather than the sharp decrease of strength as in other specimens. Smaller strength decrease can be expected in CFST columns using low strength concrete. Specimen 6 with the smallest value of λ demonstrated the most serious strength degradation beyond the peak strength.
It is also can be seen from Figure 6 that the value of λ influenced the ratio of axial stress to hoop stress of the steel tube. For the four specimens with the same overall dimensions in Group 1, the smaller the value of λ was, the larger the ratio became. For instance, at an axial shortening of 0.5%, the ratios were 4.2, 5.6, 12.0, and 29.0 for Specimens 1, 2, 3, and 4, respectively. The two specimens in Group 2 had the similar pattern. According to Equation 3, the hoop stress component is the source for confinement. The smaller ratio between axial stress and hoop stress meant larger hoop stress and thus larger confinement. However, the strength grade of infill concrete also had an influence on the value of confinement. For Specimens 4 and 5 having a similar value of λ, the ratio of Specimen 5 using low strength concrete was about one third of that of Specimen 4, which indicated that the confinement in CFST columns using low strength infill concrete was greater.
After obtaining the axial stress and hoop stress in the steel tube, the confining pressure applied by the exterior steel tube to the infill concrete can be calculated according to Equation 3; the confined concrete strength can be calculated according to Equation 4. Figure 7 shows the relationship between the confined concrete strength and confining pressure, with the abscissa being the normalized confined concrete strength defined by the ratio between the confined concrete strength and unconfined concrete strength. It is clear that the confining pressure is not constant in CFST columns. The confining pressure increased from zero to a nearly constant value eventually. The confined concrete strength increased with the increase of confining pressure. The larger the value of λ is, the larger the confining pressure, which is consistent with the previous discussion.
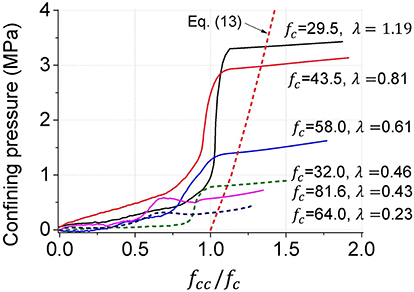
Figure 7. Relationship between confined concrete strength and confining pressure.
For actively confined concrete with constant confining pressure, the relationship between the compressive strength and confining pressure can be given by the following equation (Zhao et al., 2018):
To quantify the level of confinement effect in passively confined CFST columns, Equation 13 can be adopted as an equivalent method. The level of confinement effect in CFST columns can be estimated by the equivalent confining pressure which gives the same confined concrete strength in the actively confined concrete. Equation 13 was also plotted in Figure 7 in dashed line. The intersections were the equivalent confining pressure for each specimen. Figure 8 gives the relationship between the confinement factor λ and equivalent confining pressure σreq. From a regression analysis, the equivalent confining pressure in CFST columns can be roughly estimated as follows.
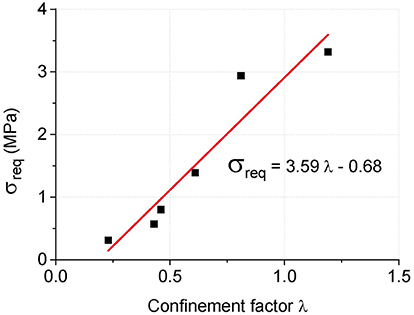
Figure 8. Equivalent confining pressure.
The mean and coefficient of variance of the ratio of estimation according to Equation (14) to tested values are 1.0209 and 0.3255, respectively.
To this end, knowing the confinement factor of a CFST column, the level of confinement effect can be quickly estimated.
Conclusions
This study worked on the confinement effect in CFST columns and a method to quantify the equivalent confining pressure applied to the infill concrete by the steel tube was developed. The major findings are summarized as follows:
(1) The confinement factor was verified as the key parameter for the axial load carrying capacity. Basically, a larger confinement factor gave smaller post-peak axial strength decrease and larger ductility. With the similar confinement factor, the low-strength concrete exhibited less strength decrease.
(2) The confinement factor was directly related to the level of confining pressure provided by the steel tube to the infill concrete. The strength grade of infill concrete also influenced the confining pressure and CFST columns using low-strength infill concrete showed greater confining pressure.
(3) The stress state of the steel tube and the confined concrete strength were analyzed. To quantify the confinement level in CFST columns, the concept of confining pressure in actively confined concrete was adopted and an index of equivalent confining pressure was proposed. An equation capable of quickly estimating the passive confining pressure in CFST columns was proposed.
Data Availability
All datasets generated for this study are included in the manuscript and/or the supplementary files.
Author Contributions
LH supervised the research and wrote the first draft manuscript. SL analyzed test data. HJ reviewed and revised the manuscript, and approved the submitted version. All the authors participated in discussion of the research.
Funding
The authors are grateful for the support from National Key Research and Development Program of China under Grant No. 2017YFC1500701 and Program of Shanghai Academic Research Leader under Grant No. 18XD1403900.
Conflict of Interest Statement
The authors declare that the research was conducted in the absence of any commercial or financial relationships that could be construed as a potential conflict of interest.
References
Abed, F., AlHamaydeh, M., and Abdalla, S. (2013). Experimental and numerical investigations of the compressive behavior of concrete filled steel tubes (CFSTs). J. Constr. Steel Res. 80, 429–439. doi: 10.1016/j.jcsr.2012.10.005
Attard, M., and Setunge, S. (1996). Stress-strain relationship of confined and unconfined concrete. ACI Mater J. 93, 432–442.
Chen, Y., Feng, R., Shao, Y., and Zhang, X. (2017). Bond-slip behaviour of concrete-filled stainless steel circular hollow section tubes. J. Constr. Steel Res. 130, 248–263. doi: 10.1016/j.jcsr.2016.12.012
Giakoumelis, G., and Lam, D. (2004). Axial capacity of circular concrete-filled tube columns. J. Constr. Steel Res. 60, 1049–1068. doi: 10.1016/j.jcsr.2003.10.001
Gupta, P. K., Sarda, S. M., and Kumar, M. S. (2007). Experimental and computational study of concrete filled steel tubular columns under axial loads. J. Constr. Steel Res. 63, 182–193. doi: 10.1016/j.jcsr.2006.04.004
Han, L. H., Yao, G. H., and Zhao, X. L. (2005). Tests and calculations for hollow structural steel (HSS) stub columns filled with self-consolidating concrete (SCC). J. Constr. Steel Res. 61, 1241–1269. doi: 10.1016/j.jcsr.2005.01.004
He, L., Zhao, Y., and Lin, S. (2018). Experimental study on axially compressed circular CFST columns with improved confinement effect. J. Constr. Steel Res. 140, 74–81. doi: 10.1016/j.jcsr.2017.10.025
Ho, J. C. M., and Lai, M. H. (2013). Behaviour of uni-axially loaded CFST columns confined by tie bars. J. Constr. Steel Res. 83, 37–50. doi: 10.1016/j.jcsr.2012.12.014
Hu, Y. M., Yu, T., and Teng, J. G. (2011). FRP-confined circular concrete-filled thin steel tubes under axial compression. J. Compos. Constr. 15, 850–860. doi: 10.1061/(ASCE)CC.1943-5614.0000217
Imran, I., and Pantazopoulou, S. (1996). Experimental study of plain concrete under triaxial stress. ACI Mater. J. 93, 589–601.
Kinoshita, M., Kotsovos, M. D., and Pavlovic, M. N. (1994). Behavior of concrete under passive confinement. J. Mater. Conc. Struct. Pavements 502, 131–142.
Lai, M. H., and Ho, J. C. M. (2015). Effect of continuous spirals on uni-axial strength and ductility of CFST columns. J. Constr. Steel Res. 104, 235–249. doi: 10.1016/j.jcsr.2014.10.007
Lam, D., and Gardner, L. (2008). Structural design of stainless steel concrete filled columns. J. Constr. Steel Res. 64, 1275–1282. doi: 10.1016/j.jcsr.2008.04.012
Liao, F. Y., Han, L. H., and Tao, Z. (2013). Behaviour of CFST stub columns with initial concrete imperfection: analysis and calculations. Thin Walled Struct. 70, 57–69. doi: 10.1016/j.tws.2013.04.012
Lim, J., and Ozbakkaloglu, T. (2015). Investigation of the influence of the application path of confining pressure: tests on actively confined and FRP-confined concretes. J. Struct. Eng. 141:04014203. doi: 10.1061/(ASCE)ST.1943-541X.0001177
Mander, J. B., Priestley, M. J. N., and Park, R. (1988). Theoretical stress-strain model for confined concrete. J. Struct. Eng. 114, 1804–1826. doi: 10.1061/(ASCE)0733-9445(1988)114:8(1804)
Richart, F. E., Brandtzaeg, A., and Brown, R. L. (1928). A Study of the Failure of Concrete Under Combined Compressive Stresses. Bulletin No. 185, University of Illinois, Engineering Experimental Station, Urbana, Illinois.
Sakino, K., Nakahara, H., Morino, S., and Nishiyama, A. (2004). Behavior of centrally loaded concrete-filled steel-tube short columns. J. Struct. Eng. 130, 180–188. doi: 10.1061/(ASCE)0733-9445(2004)130:2(180)
Shen, Q., Wang, J., Wang, J., and Ding, Z. (2019). Axial compressive performance of circular CFST columns partially wrapped by carbon FRP. J. Constr. Steel Res. 155, 90–106. doi: 10.1016/j.jcsr.2018.12.017
Tao, Z., Song, T., Uy, B., and Han, L. (2016). Bond behavior in concrete-filled steel tubes. J. Constr. Steel Res. 120, 81–93. doi: 10.1016/j.jcsr.2015.12.030
Xue, J. Q., Briseghella, B., and Chen, B. C. (2012). Effects of debonding on circular CFST stub columns. J. Constr. Steel Res. 69, 64–76. doi: 10.1016/j.jcsr.2011.08.002
Yu, Z. W., Ding, F. X., and Cai, C. S. (2007). Experimental behavior of circular concrete-filled steel tube stub columns. J. Constr. Steel Res. 63, 165–174. doi: 10.1016/j.jcsr.2006.03.009
Keywords: concrete filled steel tube, confinement effect, confined concrete, active confining, passive confining
Citation: He L, Lin S and Jiang H (2019) Confinement Effect of Concrete-Filled Steel Tube Columns With Infill Concrete of Different Strength Grades. Front. Mater. 6:71. doi: 10.3389/fmats.2019.00071
Received: 27 February 2019; Accepted: 01 April 2019;
Published: 18 April 2019.
Edited by:
Zhao-Dong Xu, Southeast University, ChinaReviewed by:
Jianwei Zhang, Beijing University of Technology, ChinaDejian Shen, Hohai University, China
Copyright © 2019 He, Lin and Jiang. This is an open-access article distributed under the terms of the Creative Commons Attribution License (CC BY). The use, distribution or reproduction in other forums is permitted, provided the original author(s) and the copyright owner(s) are credited and that the original publication in this journal is cited, in accordance with accepted academic practice. No use, distribution or reproduction is permitted which does not comply with these terms.
*Correspondence: Huanjun Jiang, jhj73@tongji.edu.cn