The Structure of Amorphous and Deeply Supercooled Liquid Alumina
 Caijuan Shi1,2
  Oliver L. G. Alderman3 Diana Berman4
  Jincheng Du4 Joerg Neuefeind5 Anthony Tamalonis3
  J. K. Richard Weber2,3 Jinglin You1
  Chris J. Benmore2*
- 1State Key Laboratory of Advanced Special Steel, Shanghai Key Laboratory of Advanced Ferrometallurgy, School of Materials Science and Engineering, Shanghai University, Shanghai, China
- 2Argonne National Laboratory, X-Ray Science Division, Advanced Photon Source, Argonne, IL, United States
- 3Materials Development, Inc., Arlington Heights, IL, United States
- 4Materials Science and Engineering, University of North Texas, Denton, TX, United States
- 5Neutron Scattering Division, Oak Ridge National Laboratory, Oak Ridge, TN, United States
Liquid Al2O3 has been supercooled more than 500 K below its melting point (Tm = 2,327 K) using aerodynamic levitation and laser heating techniques. High energy synchrotron x-ray measurements were performed over a temperature range of 1,817 ≤ T (K) ≤ 2,700 and stroboscopic neutron diffraction at 1,984 and 2,587 K. The diffraction patterns have been fitted with Empirical Potential Structure Refinement (EPSR) models and compared to classical Molecular Dynamics (MD) simulation results. Both sets of models show similar trends, indicating the presence of high populations of AlO4 and AlO5 polyhedral units predominantly linked by triply shared oxygen atoms. EPSR reveals that the mean Al–O coordination number changes linearly with temperature with nAlO = 4.41 – [1.25 × 10⁻⁴] (T – Tm), with a 2.5 Å cutoff. Both EPSR and MD simulations reveal a direction of the temperature dependence of the aluminate network structure which moves further away from the glass forming ideal (nAlO = 3) during supercooling. Furthermore, we provide new experimental data and models for amorphous alumina grown by sequential infiltration synthesis of a polymer template. The amorphous solid form likely has a larger Al-O coordination number than the liquid, consistent with expectations for the hypothetical glass.
Introduction
In the deeply entrenched terminology of glass science, Al2O3 is classified as an intermediate oxide, because it can function as both a “network former” (tetrahedral Al-O species) or a “network modifier” (5- or 6-fold Al) depending on the multi-component glass composition (McMillan and Piriou, 1983; Risbud et al., 1987; Stebbins et al., 2000; Benmore et al., 2003; Mei et al., 2006, 2008; Neuville et al., 2006; Weber et al., 2008; Wilding et al., 2010). In the stable corundum crystalline form (α-Al2O3), Al occupies octahedral sites within a hexagonal close-packed arrangement of oxygen such that nAlO = 6. However, in the disordered molten state, the Al-O coordination number decreases substantially from 6, to form a predominantly corner-shared network of 4-fold tetrahedra mixed with some more highly coordinated Al (Neuville et al., 2009; Skinner et al., 2013). Nonetheless, pure Al2O3 cannot be obtained as a bulk glass, even under very fast cooling conditions (Sun, 1949; Rosenflanz et al., 2004), despite the fact that the liquid can be supercooled several hundred degrees below its melting point (Krishnan et al., 2005). Alumina can, however, be produced in amorphous forms by anodic oxidation (Lamparter and Kniep, 1997), magnetron sputtering (Lee et al., 2009, 2010; Lee and Ryu, 2017) and sequential infiltration synthesis (Berman et al., 2017).
Amorphous Al2O3 thin films have numerous applications in semiconductor, space and energy technologies, and their unique chemical durability and mechanical strength make them effective as protective films (Stierle et al., 2004; Kresse et al., 2005). Amorphous alumina has also been considered to contribute to dust around stars (Onaka et al., 1989; Miyata et al., 2000). Molten alumina is used for the controlled growth of large sapphire single crystals as laser hosts and optical materials (Cockayne et al., 1967; LaBelle, 1971; Fejer et al., 1984; Nubling and Harrington, 1997), and is important in governing the behavior of aluminum-fueled rocket motor effluents (Plastinin et al., 2001; Burt and Boyd, 2007). Knowledge of the atomic-scale structure is essential for understanding chemical and physical properties, and various experiments (Coutures et al., 1990; Massiot et al., 1990; Florian et al., 1995; Waseda et al., 1995; Ansell et al., 1997; Krishnan et al., 2005; Neuville et al., 2009; Skinner et al., 2013) and simulations (Ahuja et al., 1998; Belonoshko, 1998; Gutiérrez et al., 2000; Van Hoang, 2004, 2005; Van Hoang and Oh, 2004, 2005; Hung and Vinh, 2006; Verma et al., 2011) have been conducted to explore the structure of pure liquid alumina. The consensus indicates that the average Al-O coordination number falls in the range of 4–5, with a dominant proportion of AlO4 tetrahedra (Coutures et al., 1990; Massiot et al., 1990; Florian et al., 1995; San Miguel et al., 1998; Van Hoang, 2004; Neuville et al., 2009; Skinner et al., 2013). Interpretations of NMR (Florian et al., 1995) and XANES (Neuville et al., 2009) experiments on the one hand have suggested that liquid alumina comprises of a mixture of 4- and 6-fold coordinated Al sites undergoing rapid exchange, resulting in the average coordination number 4.5. This has led to a heterogeneous structural model (Neuville et al., 2009), in which liquid alumina is supposed to comprise of a quasi-diphasic structure composed of dense corundum clusters and a less dense AlO4 structure surrounded by octahedral vacancies. On the other hand, molecular dynamics simulations (Hemmati et al., 1999) indicate that liquid alumina consists of predominantly 5-fold coordination, with appreciable 4- and 6-fold polyhedra present. More recent work (Skinner et al., 2013) proposed an intermediate scenario, using both x-ray and neutron diffraction combined with molecular dynamics (MD) simulations, whereby liquid alumina contains mostly AlO4, but with a significant fraction of AlO5 units, and only minor fractions of AlO3 and AlO6. It is interesting to compare Skinner et al.'s model of the structure of liquid alumina with that of solid amorphous alumina, which has also been studied by x-ray, neutron diffraction (Lamparter and Kniep, 1997) and NMR (Lee et al., 2009, 2010; Lee and Ryu, 2017). In this study we find that in the amorphous forms AlO4 tetrahedra still dominate the structure, but with even more AlO5 units than in the liquid, and slightly more AlO6 octahedra.
Previous attempts to extract information on the temperature-dependent structure of molten Al2O3 are limited. Some studies (Ansell et al., 1997; Krishnan et al., 2005) measured the x-ray structure factor of normal and supercooled liquid alumina, in the temperature range of 2,000 ≤ T (K) ≤ 2,700 over a momentum transfer range 0.5 ≤ Q (Å−1) ≤ 16.0 but the results were inconclusive. To enhance the supercooling of liquid alumina, the presence of a solid container can be eliminated, which prevents heterogeneous crystal nucleation at the solid-liquid interface. In this work, aerodynamic levitation with laser heating has been combined with high-energy x-ray diffraction and stroboscopic neutron diffraction to enable measurements over extensive Q and temperature ranges, with good statistical accuracy. Empirical potential structure refinement (EPSR) (Soper, 1996, 2005) modeling is used to obtain structural models of amorphous and supercooled liquid alumina that are consistent with the neutron and x-ray measurements and to explore in detail the structural evolution with temperature. Classical molecular dynamics simulations are performed and found to provide similar results, revealing a weak but distinct structural temperature dependence of alumina in the supercooled and equilibrium liquid regimes.
Theory
In an x-ray diffraction experiment, the total structure factor S(Q) is related to the scattered intensity, I(Q), through (Keen, 2001),
where ci is the atomic fraction of element i, and fi(Q) represent independent atom (atomic) x-ray scatting form factors. C(Q) is the Compton scattering. A similar equation can be written for the case of neutrons in terms of the Q-independent coherent neutron scattering lengths. The measured S(Q) is most commonly expressed using the Faber–Ziman formalism (Faber and Ziman, 1965) as the sum of the x-ray weighted elemental partial structure factors Sij(Q) whereby,
The total pair distribution function G(r) is obtained via a sine Fourier transformation of Q.(S(Q)-1) using
where ρ is the atomic number density in atoms Å−3. A Lorch (Lorch, 1969) or other modification function M(Q) is often used to minimize the truncation oscillations generated during the Fourier transform over a finite Q-range (defined by the Qmax limit). To emphasize the longer-r correlations, the real space differential distribution function, D(r) = 4 πρr [G(r)–1] is also defined and used in this work (Susman et al., 1991).
The partial pair distribution functions, gij(r) provide the average coordination number nij(r) between distances r1 and r2 by radial integration according to Keen (2001),
Methods
Sample Synthesis
In this study, the amorphous alumina samples were grown by sequential infiltration synthesis, which involves diffusion-controlled penetration and subsequent chemisorption of inorganic molecules inside a polymer template (Berman et al., 2017; She et al., 2017). Alumina samples were grown on a silicon substrate and subsequently removed for the measurements. The film growth procedure initially involved deposition of a 1 μm thick polystyrene-b-poly-4-vinyl pyridine (PS-p4VP) block-copolymer film with 75 k-b-25 k composition, on a substrate. After swelling at 75°C for 1 h in ethanol solution, the sample was placed in an atomic layer deposition chamber. Stepwise exposure of the polymer film to vapors of trimethylaluminum (TMA) and water results in the growth of aluminum oxide structure inside the polar domain, vinyl pyridine, of the polymer matrix. The structure of the aluminum oxide, after removal of the polymer template in an oxygen atmosphere at an elevated temperature (400°C) is amorphous (She et al., 2018). For the liquid levitation experiments, single crystal corundum (Al2O3) beads of 3mm diameter and 99.99% purity were used as starting material.
High-Energy X-Ray Diffraction
X-ray diffraction measurements were made at beamline 6-ID-D of the Advanced Photon Source (Argonne, IL, USA) using an incident x-ray beam of wavelength 0.123675 Å (100.25 keV). A Perkin Elmer XRD1621 area detector was placed ~400 mm downstream of the sample. It was calibrated using a polystyrene ball coated with a CeO2 powder standard to give a Q range of 0.5–22.5 Å−1. An aerodynamic levitation and laser heating system was employed to eliminate heterogeneous nucleation at the melt-container interface and thus increasing the propensity for supercooling (Alderman et al., 2016). A droplet was obtained by melting a levitated spherical alumina bead above a conical nozzle (Nordine et al., 2000; Hennet et al., 2006) in a high purity Ar or O2 atmosphere using a 400W CO2 laser (Synrad Firestar). Diffraction patterns were collected by isothermal 120 s duration measurements, repeated in ~100 K steps cooling from 2,700 to 1,817 K. The mass of sample changed from 56.35(1) to 56.16(1) mg (a loss of 0.34%) after the series of x-ray measurements were completed. The droplet surface temperature was measured using 0.9 μm wavelength optical pyrometer (Chino IR-CAS). The pyrometer readings assumed a constant emissivity ελ of 0.92 for the wavelength range of 0.7–1.1 μm. The accuracy rating of the pyrometer is ~2% in the temperature range > 2,000°C and ~1% for temperatures 1,500–2,000°C. The x-ray beam was centered on the top 200 μm of the sample to align with the pyrometry measurement, avoid scattering from the conical levitation nozzle and minimize attenuation effects from the sample (Benmore et al., 2019). Only data from the top half of the Debye–Scherrer cone were used for analysis to avoid complex attenuation corrections of the scattered beam through the nozzle (Benmore and Weber, 2017). The diffraction data were corrected for detector dark currents using the data acquisition software QXRD (Jennings, 1997). The two-dimensional images were then corrected (Skinner et al., 2012) for polarization using Fit2D (Hammersley et al., 1996). The absorption, geometry, detector effects, and the normalization procedure were carried out using PDFgetX2 (Qiu et al., 2004).
Neutron Diffraction
X-ray and neutron diffraction measurements are sensitive to different aspects of the same structure owing to their differing scattering mechanisms. For liquid alumina, the x-ray diffraction data are more sensitive to the heavier Al correlations, while neutrons are scattered more strongly by the oxygen nuclei. To obtain more information from the three contributing pair terms Al-Al, Al-O, and O-O, both neutron and x-ray data were combined in this study. Neutron-diffraction measurements were made at the NOMAD beamline of the Spallation Neutron Source (SNS), Oak Ridge, TN, USA. Event-based stroboscopic data acquisition was carried out using the NOMAD diffractometer (Neuefeind et al., 2012) to study supercooled Al2O3. A spheroid of Al2O3 with a mass of ~30 mg and nominally 3 mm in diameter was laser heated in an aerodynamic levitator and the measured data normalized to a vanadium standard of approximately the same size and geometry at the same position. A pyrometer provided surface temperature data in a similar set up to x-ray measurements (Weber et al., 2014). The stroboscopic measurements were made during a stable and reproducible temperature cycle established between the equilibrium and the supercooled liquid (Granroth et al., 2018). The structure of liquid alumina was measured over the temperature range 1,984–2,587 K, cycling for 1 h, during which time no crystallization of alumina was observed.
Empirical Potential Structure Refinement
Structural models of supercooled liquid Al2O3 were derived from diffraction data using EPSR simulations (Soper, 1996, 2005). EPSR is a fixed-volume method which generates a disordered material structure in agreement with diffraction experiments, by employing variable interaction potentials to drive the model toward agreement with the measured scattering data. ND and XRD data were used at the temperatures 1,974 and 2,583 K, which are the mean values of ND and X-ray experiment temperature, whilst XRD data alone were used over the wider T range of those measurements 1,817–2,700 K. Initial Monte Carlo simulations were performed on 6,400 atoms within a cubic box. Temperature dependent densities are fixed by using equation 2 in (Paradis et al., 2004). These also provided reasonable starting configurations for MD simulations (section Classical Molecular Dynamics). Atoms interacted via a Lennard-Jones (12–6) potential and partial (0.5 e) charge Coulomb term, as described by Soper (Soper, 1996). The L-J parameters for O and Al were taken from Weigel et al. (2008): εO = 0.1,625 kJ mol−1, σO = 3.6 Å, qO = −e, εAl = 0.26 kJ mol−1, σAl = 1.26 Å, qAl = 1.5 e. After the initial simulation, the empirical potential term was refined to improve agreement with the scattering data, and the maximum allowed energy amplitude was set to ~30% of initial model energy. Once the goodness-of-fit parameter was minimized, structural data were collected over ensembles of more than 2,000 configurations.
It is important to note the variation in densities between amorphous alumina films obtained by different production methods, which have been found to cover a wide range between 2.66 and 3.40 g cm−3 as discussed in section Density. Given the strong correspondence between structure and density, we conducted EPSR simulations with different mass densities (see Table 3).
Classical Molecular Dynamics
To help understand the physics that underpin mechanisms of structural changes in supercooled liquid alumina, classical MD simulations were performed. Pair potentials for Al2O3 have been developed by many authors (Winkler et al., 2004; Van Hoang and Oh, 2005; Hung et al., 2006; Du and Corrales, 2007; Du et al., 2009). Of these, Du and Corrales (Du and Corrales, 2007) have reported a partial-charge model that has previously been determined to be in very good agreement with the measured x-ray and neutron diffraction results (Skinner et al., 2013). We therefore employ the Du and Corrales pair potentials in this study, which take the Buckingham form (Du and Corrales, 2007)
where r is the separation of atom pairs, zα is the charge on an ion of type α, e is the elementary charge, and Aαβ, Bαβ, and Cαβ are parameters determined by simultaneous fitting to structures and physical properties of a wide range of related crystalline materials (Massobrio et al., 2015). It has previously been noted that a problem with these pair potentials is that they can lead to unphysical attractive forces at small atomic separations (the Buckingham catastrophe) (Winkler et al., 2004; Du et al., 2009). To solve this problem, a Dαβ/r12 repulsive term was added (Skinner et al., 2013), but this has been neglected in our simulations since the differences in structure and properties introduced by it were determined to be negligible. This would not necessarily remain the case at extremes of pressure and temperature.
Classical MD simulations were performed using the DL_POLY package (Smith and Forester, 1996) on a system containing N = 6,400 atoms. The 3-dimensional models obtained from Monte Carlo simulations (see section Empirical Potential Structure Refinement) were used as starting configurations for the MD simulations, which were conducted either in the canonical (NVT) or the isothermal-isobaric (NPT) ensemble, using a Hoover-Nose thermostat or thermostat-barostat, at P = 1 atm and various temperatures. A time step of 1.0 fs was selected, with the first 25,000 steps used for equilibration, and particle trajectories typically integrated over a further 50,000 steps. Amorphous alumina was simulated by quenching from 2,700 to 300 K stepwise, in 100K steps, with an average cooling rate of 2 × 10¹² K s−1.
Density
Using an electrostatic levitation method Paradis et al. (Paradis et al., 2004) obtained a linear relation between the density and temperature of the liquid and supercooled alumina over the range 2,175 ≤ T (K) ≤ 2,435 whereby ρ(T) = 2.93 – (0.12 × 10⁻³)(T – Tm) in g cm−3 (Figure 1) with Tm = 2,327 K. The density of liquid alumina has also been determined using aerodynamic levitation to be ρ(T) = 2.79 – (0.118 × 10⁻³)(T − 2,500) (g cm−3), over the wider temperature range 2,000–3,100 K (Glorieux et al., 1999). It can be seen that the density values obtained from electrostatic levitation are systematically higher than the aerodynamic levitation measurements and are in better agreement with the values obtained from modeling neutron and x-ray diffraction data, see (Skinner et al., 2013) for further discussion. In this work we therefore chose to extend the linear relation provided by Paradis et al. (2004) to lower temperatures to analyze our experimental data.
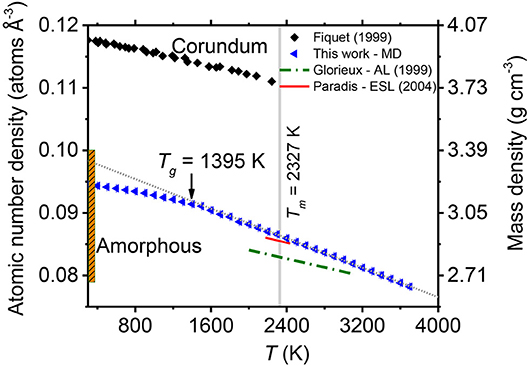
Figure 1. The temperature dependence of the density of corundum and liquid alumina. The densities of liquid and amorphous Al2O3 obtained by MD modeling in this paper are shown as blue triangles. The intersection of linear extrapolations of the density for the amorphous solid and the liquid yield the glass transition temperature of the model shown. The red (solid) and green (broken) lines show the experimental densities obtained by Paradis et al. (2004) and Glorieux et al. (1999), respectively. The experimental temperature-dependent densities of corundum are plotted as black diamonds (Fiquet et al., 1999). The vertical orange bar plots the range of room temperature densities of amorphous Al2O3 thin films (see text).
The density of amorphous alumina has been reported by several groups (Oka et al., 1979; Kniep et al., 1989; Lee et al., 1995; Wang et al., 1997; Momida et al., 2006; Gorham et al., 2014). Kniep et al. (1989) suggested that the density of pure amorphous alumina was 3.3 g cm−3. Lee et al. (1995) reported the density of alumina film deposited by magnetron techniques was 3.4 g cm−3. Momida et al. (2006) calculated the density of the amorphous structures to range from 3.02 to 3.38 g cm−3 using first-principles calculations. More recently, Gorham et al. (2014) synthesized a-Al2O3 thin films with densities ranging from 2.66 to 3.07 g cm−3. Wang et al. (1997) have calculated alumina film densities between 3.28 and 3.84 g cm−3 (with AlCl3, H2, and CO2 as the reactants), which is much denser than found by other studies in the literature. This could be attributed to heavy contaminants, such as Cl. Both due to the non-equilibrium nature, and the variable porosities and impurities of the samples, the density of amorphous alumina is not unique but ranges from 2.66 to 3.4 g cm−3, see Figure 1.
Results
The densities of supercooled and quenched Al2O3 obtained by molecular dynamics simulations in this study are compared to experimental literature values in Figure 1. The liquid structure factors and pair distribution functions obtained from the diffraction and simulation methods described above are shown for the highest and lowest temperature points in Figure 2. The temperature-dependent changes in structure are highlighted in Figures 3, 4 through the use of difference functions. Results for amorphous alumina are shown in Figures 5, 6 and 7.
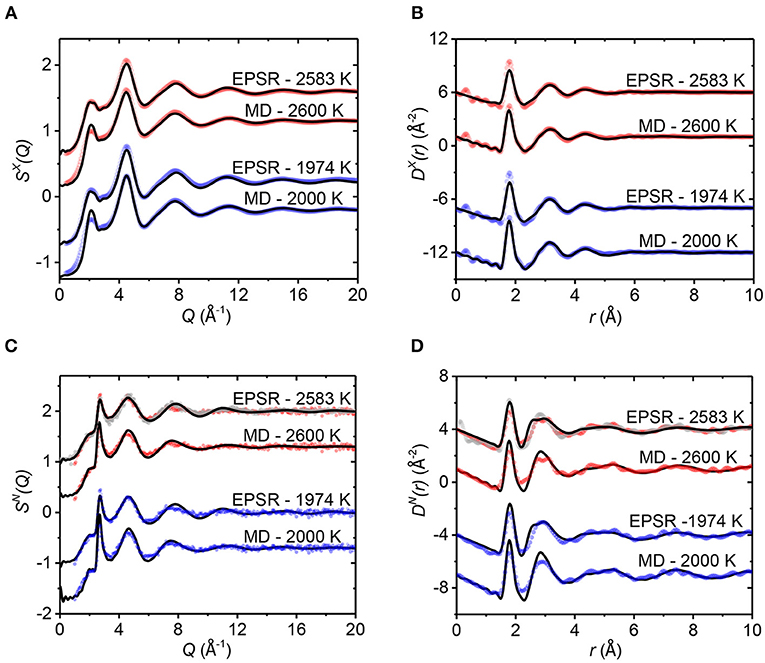
Figure 2. The x-ray (A,B) and neutron (C,D) total structure factors S(Q) (A,C) and total distribution functions D(r) (B,D), obtained with a Qmax of 20.0 Å−1. In each panel, the measured data (points) are compared to the EPSR and MD simulation results (solid black lines). Skinner et al. (2013) neutron data are plotted as gray circles for comparison. Vertical offsets have been applied for clarity.
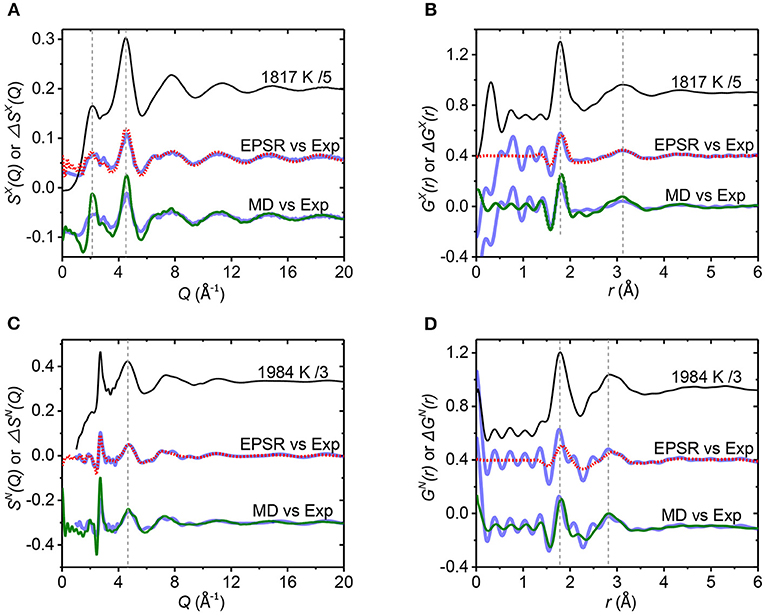
Figure 3. (A,C) show the total structure factor S(Q) at the lowest temperature measured by both x-rays (scaled by 1/5) and neutrons (scaled by 1/3), of 1,817 and 1,984 K, compared to differences, ΔSX(Q) and ΔSN(Q), between different temperatures. The total structure factors are shown as solid black lines, x-ray, and neutron difference data is shown as blue circles for 1,964–2,580 K and 1,984–2,587 K, respectively. EPSR results are displayed as dotted red lines using 1,974–2,583 K. Similarly, for the MD simulation solid green lines represent 2,000–2,600 K. (B,D) show the corresponding experimental pair distribution functions GX(r) at 1,817 K (scaled by 1/5) and GN(r) at 1,984 K (scaled by 1/3) compared to the differences ΔGX(r) and ΔGN(r). Vertical offsets have been applied for clarity.
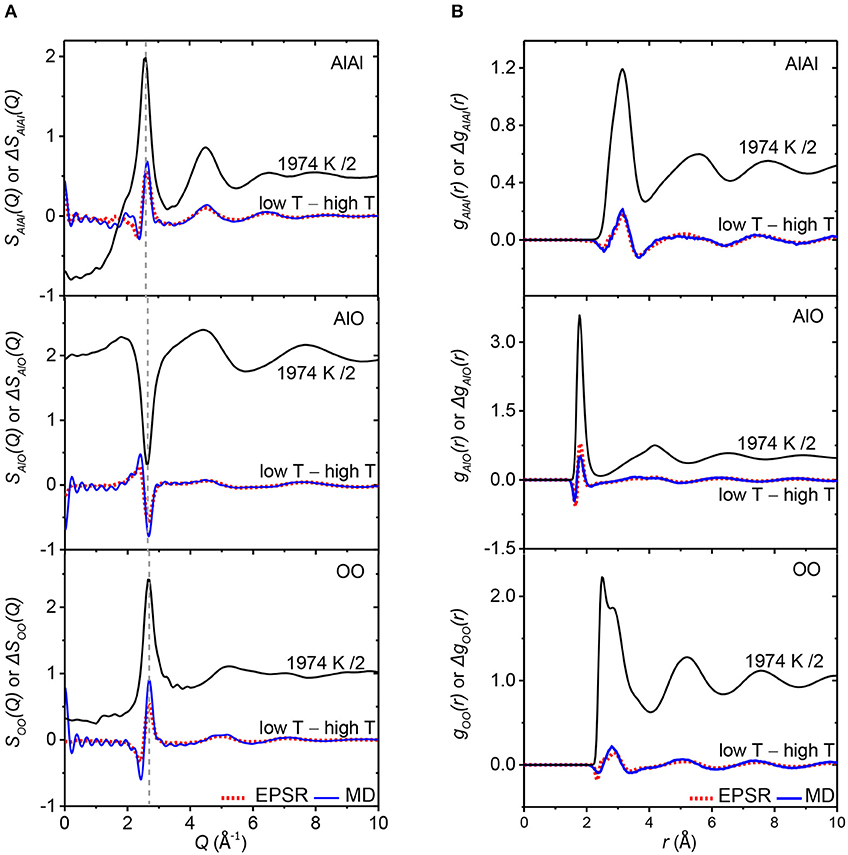
Figure 4. (A) Shows the partial structure factors Sij(Q) for the EPSR model at a temperature of 1,974 K, compared to the temperature dependent changes (cold minus hot). The difference functions for the MD model are given by the solid blue lines (2,000–2,600 K) and the EPSR models by the dotted red lines (1,974–2,583 K). Vertical offsets have been applied for clarity. Similarly, (B) shows the corresponding partial pair-distributions functions gij(r) for the 1,974 K EPSR model, compared to the temperature-dependent changes, Δgij(r).
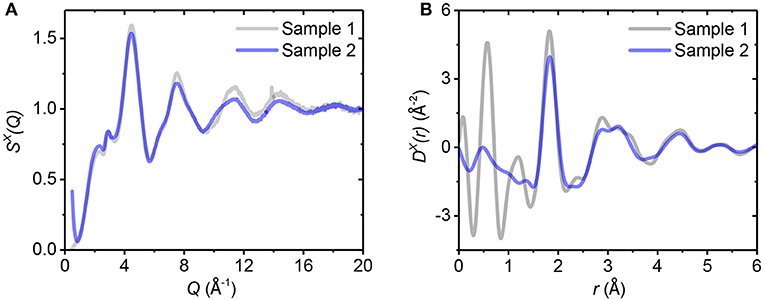
Figure 5. The (A) x-ray total structure factor S(Q) and (B) total differential distribution function D(r) for two amorphous alumina samples.
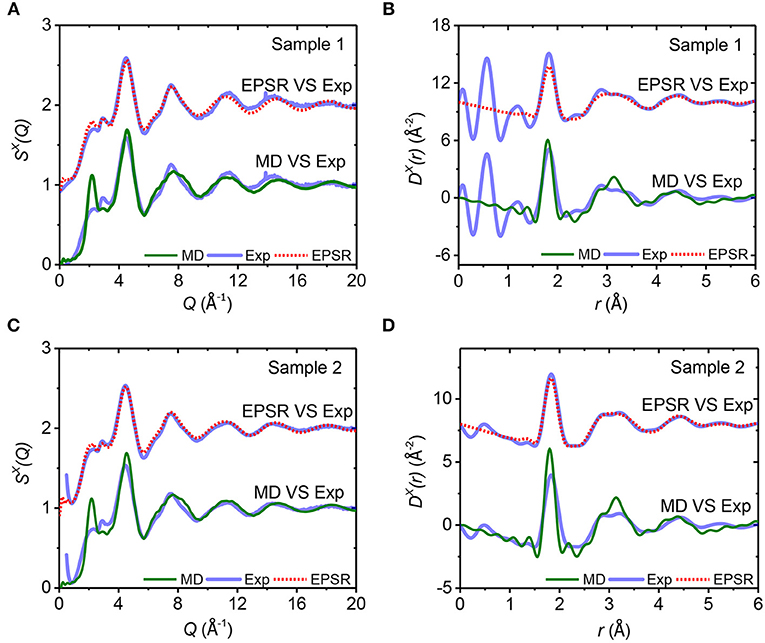
Figure 6. The x-ray total structure factors S(Q) (A,C) and total distribution functions D(r) (B,D) for amorphous alumina, obtained with a Qmax of 20.0 Å−1. In each panel, the measured data (solid blue lines) are compared to the EPSR (dotted red lines) and MD simulation results (solid green lines).
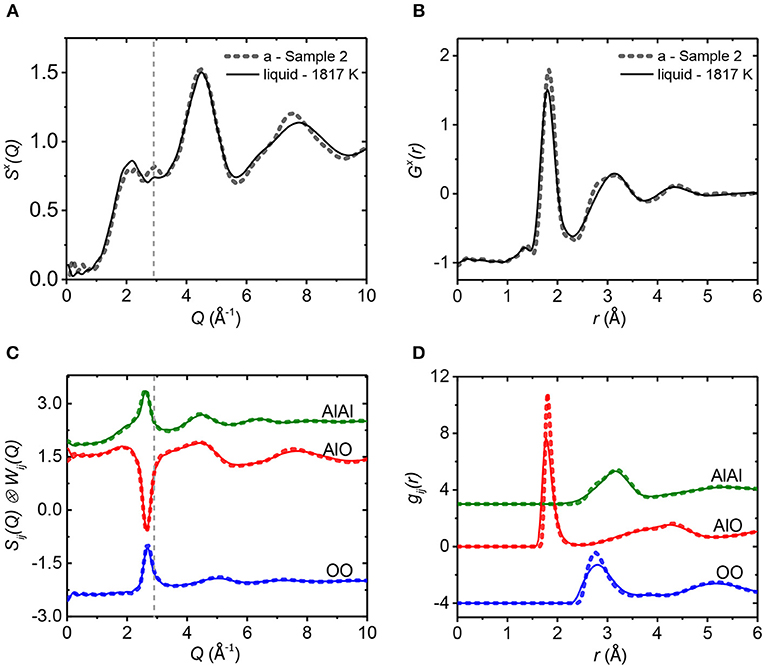
Figure 7. Comparison of amorphous Al2O3 (Sample 2, dotted lines) to supercooled liquid Al2O3 at 1,817 K (solid lines). The total (A,B) and partial (C,D) x-ray structure factors S(Q) (A,C) and pair distribution functions G(r) (B,D) from EPSR are shown. Note that the Sij(Q) in part (C) have been multiplied by the x-ray pair weighting factors, Wij(Q). Vertical offsets have been applied for clarity.
Diffraction Data and Simulations
For the EPSR models, the agreement with the x-ray S(Q)'s is within the experimental error. However, there is some slight disagreement in the region 6 < Q < 10 Å−1 with the neutron data, and correspondingly in the 2 < r < 4 Å range in real space. The MD simulation results obtained using Du and Corrales (2007) potentials are largely consistent with the measured x-ray diffraction data (see Figure 2A) except for a small difference in the x-ray first diffraction peak at 2.12 Å−1, which contains contributions from all three partials but is most pronounced in SAlAl(Q).
Figures 2A,C show the measured and modeled structure factors SX(Q) and SN(Q) for liquid alumina. The data here were measured over a wider temperature range and with an improved signal-to-noise ratio compared to previous experiments (Landron et al., 2001; Krishnan et al., 2005). The first three peak positions listed in Table 1 are in good agreement with other studies (Ansell et al., 1997; Skinner et al., 2013). The real space differential distribution functions DX(r) and DN(r), measured for liquid alumina at the temperatures of 1,974 and 2,583 K are plotted in Figures 2B,D. There is a single asymmetric peak at 1.78 Å in both DX(r) and DN(r) functions, which represents the Al-O bond length distribution.
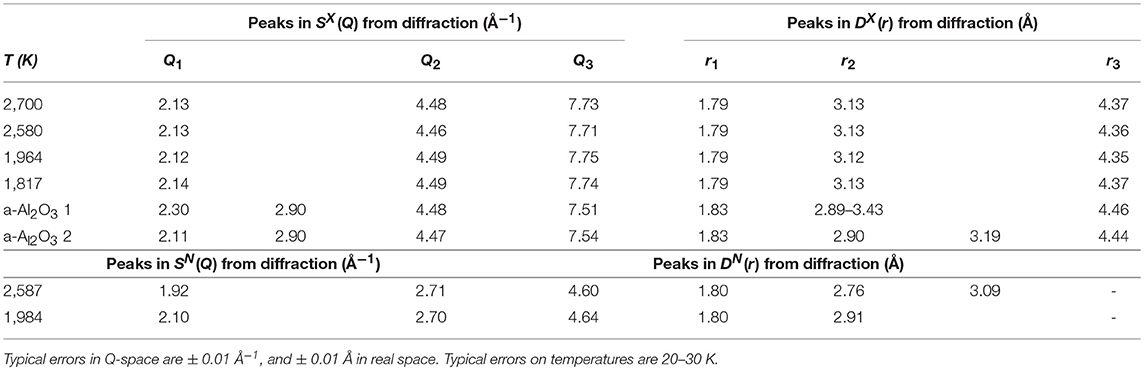
Table 1. Peak positions in both reciprocal and real space from x-ray and neutron diffraction on supercooled liquid alumina.
As the temperature decreases, the first peak sharpens and increases in intensity in real space without a significant change in position. The first Al-O peak is well-reproduced in our MD simulations of DX(r) (see Figure 2B), while the EPSR peak is slightly higher than observed in the experiment. The broad second peak in DX(r) and DN(r) represents a combination of the Al-Al and O-O correlations at 2.8 and 3.13 Å, respectively, (we refer the reader to the partial pair distribution functions shown in Figure 4). A comparison of x-ray diffraction measurements made in pure oxygen and argon atmospheres (see Figure S1) reveals negligible differences, indicating the change in oxygen partial pressure has very little effect on the bulk structure of liquid alumina. However, the Ar gas atmosphere appeared to favor deeper supercooling, down to 1,817 K, compared to only 2,148 K in pure O2 gas.
The numerical values of the peak positions from our diffraction measurements are given in Table 1. There is generally a very good agreement between our experiments, our MD simulations and with previous studies (Krishnan et al., 2005). The peak positions in real space and reciprocal space show subtle, if any, changes during cooling.
Deeply Supercooled Alumina
In order to explore the structural changes upon supercooling from the stable melt, the difference functions ΔS(Q) and ΔG(r) are plotted in Figure 3 using ΔS(Q) = Scold(Q) – Shot(Q) and ΔG(r) = Gcold(r) – Ghot(r). Analogous functions obtained from EPSR and MD simulation at the temperatures closest to the experimental ones are shown for comparison. The difference functions obtained are in good agreement, indicating that both of our models capture the same underlying structural changes upon supercooling.
To resolve the origin of the temperature-dependent differences, we plot the partial pair contributions from EPSR compared to the simulated (cold minus hot) difference functions ΔSij(Q) and ΔGij(r) in Figures 4A,B. We note that the change in the total structure factors arises from a mixture of changes in all three partial factors. A key observation is that changes occur in the Al-O partial pair distribution function, ΔgAlO(r), which corresponds to the first peak in both ΔGX(r) and ΔGN(r) at ~1.8 Å. Peaks at 3.08 and 2.88 Å in ΔgAlAl(r) and ΔgOO(r) jointly give rise to the second broad peak of ΔGX(r) and ΔGN(r).
Amorphous vs. Supercooled Liquid Alumina
Two amorphous samples were measured by x-ray diffraction and the x-ray structure factors are compared in Figure 5. There are small structural differences between the two samples, which are most likely caused by differences in sample synthesis procedure, or inhomogeneity in the thin film.
It is worth noting that the small but clearly apparent peak at Q = 2.9 Å−1 of SX(Q), which stands out in both of the amorphous samples (Figure 5A), is a feature which is barely distinguishable in the high temperature liquid (Figure 2A), but becomes increasingly apparent as a subtle feature in the supercooled liquid (Figures 2A, 3A). EPSR model fits and MD quench results for glassy alumina are compared to the experimental data in Figure 6. EPSR yields good fits which are similar for both samples. The MD model for glassy alumina has a much larger first sharp diffraction peak compared to the experimental data, a magnification of the differences seen in Figure 2A for liquid alumina.
Figure 7 compares the EPSR results for amorphous sample 2 with the supercooled liquid at 1,817 K. Figure 7C indicates that the enhanced peak at Q = 2.9 Å−1 in the amorphous solid mainly arises from a sharpening of the oxygen-related correlations Al-O and O-O. From Figure 7D, the Al-O peak at 1.8 Å shifts to higher r in amorphous alumina, which means a longer Al-O bond length and likely a larger coordination number. The O-O peak also sharpens, leading to the more pronounced shoulder of the 2nd peak in GX(r), Figure 7B. Similar results are obtained by comparison of amorphous sample 1 and the supercooled liquid at 1,817 K (see Figure S2).
Discussion
Mean Coordination Numbers
The average Al-O coordination number was obtained from the partial radial distribution functions using Equation (4) with a high-r cut off of r2 = 2.5 Å, which corresponds to the first minimum in gAlO(r). Both the MD and EPSR simulation results show that the average Al-O coordination number increases gradually with decreasing temperature (see Figure 8). The EPSR model obtained using both neutron and x-ray data as constraints, is in good agreement with the MD simulation results, while the EPSR model obtained using x-ray data alone gives a slightly lower Al-O coordination number, but within the estimated error bar of the fitted models of ± 1%.
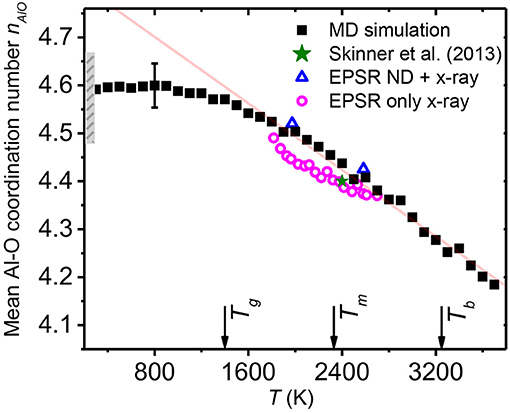
Figure 8. Temperature dependence of the average Al-O coordination numbers obtained from the MD and EPSR models with a cutoff distance r2 = 2.5 Å. The range of Al-O coordination numbers of amorphous alumina obtained from EPSR models at 300 K are plotted as a gray bar, with densities ranging from 2.99 to 3.22 g cm−3. The arrows indicate the model glass transition temperature Tg = 1,395 K and the experimental melting and boiling points, Tm = 2,327 K and Tb = 3,250 K, respectively.
EPSR and MD simulations both reveal that the mean Al-O coordination number changes linearly with temperature as nAlO = 4.41 – [1.25 × 10⁻⁴] (T – Tm) for the range 1,817 ≤ T (K) ≤ 2,700, and nAlO = 4.44 – [1.73 × 10⁻⁴] (T – Tm) for the range 1,500 ≤ T (K) ≤ 3,700, for EPSR and MD respectively. From the EPSR results, the mean Al-O coordination number nAlO changes from 4.37 at 2,700 K to 4.49 at 1,817 K, about a 2.8% variation over the experimental temperature range. At 2,378 K, the average Al-O coordination number from EPSR is 4.40, consistent with the values reported from previous diffraction work (Ansell et al., 1997; Landron et al., 2001; Hennet et al., 2002; Skinner et al., 2013). The subtlety of the changes with temperature are a clear reason why they have not been detected in previous studies covering smaller temperature ranges. It is worth mentioning that the mean coordination number shows a linear correlation with the liquid density. This is similar to titanium dioxide melts reported by Alderman et al. (2014) where it has been suggested that coordination change provides an important mechanism of thermal expansion.
Glass Transition, Density, and Thermal Expansion
The hypothetical glass transition temperature, Tg, for the Al2O3 system can be extracted from the MD simulation. Obtaining Tg from the intersection of linear extrapolations of the amorphous solid and liquid densities (Figure 1) yields Tg ≃ 1,395 K. No experimental value for Tg is available, because pure Al2O3 cannot be obtained as a bulk glass, even under fast cooling conditions (Sun, 1949; Rosenflanz et al., 2004). However, MD simulations by Van Hoang (2004) have previously reported the glass transition to be at the much higher temperature of 2,000 K. Such a high Tg is not observed in our experiments, since we have obtained a deeply supercooled liquid at 1,817 K. Nonetheless, our value for Tg ≃ 1,395 K is consistent with our experimental observations, and with the relatively large Tg values observed for high-alumina rare earth aluminate glasses (Johnson et al., 2005; Watanabe et al., 2012) (Tg > 1,100 K). Note however, that by heating a crystalline supercell to 3,700 K, a melting point of 2,800 K is found (see Figure S3), which is around 500 K higher than the experimental value of 2,327 K (Schneider, 1970). Although this method of melting point determination is subject to overestimation due to superheating, it is likely that at least part of the difference arises from the pair potentials used. This, along with the extremely rapid MD quench rate, likely both lead to overestimation of the glass transition temperature by MD.
It is worth noting that the liquid thermal expansion coefficient predicted from our MD simulations is ~65% larger than observed experimentally (Figure S4). In order to check this result we simulated the corundum (α-alumina) crystal structure and subjected it to stepwise heating to obtain the volume expansion coefficient (αV). Again αV is larger than measured experimentally by 43% at 300 K up to 64% at 2,400 K. This suggests that this is a feature of the Du and Corrales pair potentials used. Given the strong correlation between density and coordination numbers, the enhanced αV of the MD models could lead to exaggeration of the observed structural changes. This is indeed evident in the slightly smaller slope, dnAlO/dT, observed in Figure 8 for the EPSR derived models, which had densities fixed at those given by the Paradis et al. (2004) relation, with lower αV than the MD model. It is also interesting to note that our MD simulations predict a smaller αV for amorphous (glassy) alumina, as compared to crystalline corundum.
Coordination Number Distributions
The relative fractions of AlOx species (where x = 3, 4, 5, 6) and OAly species (where y = 2, 3, 4) were obtained from the EPSR and MD models. Both models show that AlO4 and AlO5 are the predominant polyhedral units in the stable melt and supercooled liquid. Figure 9A indicates the main change in structure is from the exchange of the population of AlO4 and AlO5 units upon cooling. AlO3 and AlO6 units only make up a small proportion (<10%) for the liquid below 2,700 K, which is the highest temperature probed in our diffraction measurements. The majority of oxygen atoms are found to be triply shared by these AlOx units, Figure 9B, and the number of OAl3 increases with decreasing temperature, at the expense of OAl2 bridging oxygen species. This represents a primary reason why alumina does not form a glass despite the propensity to deeply supercool. Although the Al-O coordination remains low, triply shared oxygen atoms violate Zachariasens's rule (Zachariasen, 1932) of glass formation since they reduce the flexibility of Al-O-Al bond angles and encourage denser, edge shared polyhedral structures that are prone to crystallization.
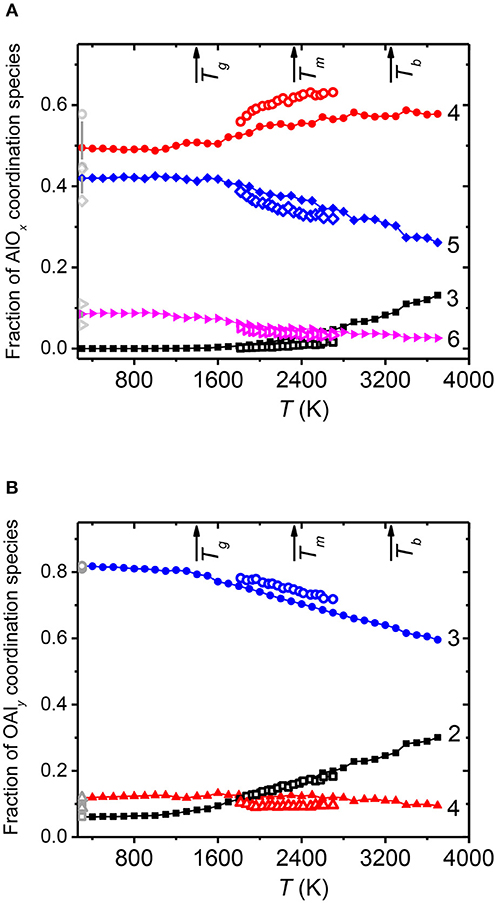
Figure 9. The temperature dependence of the distribution of (A) AlOx units (where x = 3, 4, 5, 6) and (B) OAly units (where y = 2, 3, 4) from the MD simulation (solid symbols) and EPSR models (open symbols) obtained using r2 = 2.5 Å. The corresponding AlOx and OAly distributions in amorphous alumina from EPSR models at 300 K are plotted as gray symbols, with densities of 2.99 and 3.22 g cm−3 leading to the ranges shown. The arrows indicate the glass transition temperature, Tg = 1,395 K, from the MD simulation, together with the experimental melting point, Tm = 2,327 K, and boiling point Tb = 3,250 K of Al2O3 (Taylor et al., 1992). We note that the MD model remains liquid up to the highest temperatures studied.
A pioneering study by Landron et al. (2001) measured the structure of liquid alumina at 2,500 K using neutron diffraction and EPSR was used to obtain a structural model. The authors reported a mean Al-O coordination number of 4.2(3) with a distribution given in Table 2. However, the errors on this speciation distribution are expected to be large, due to the low signal-to-noise of the neutron data, and lack of any constraints provided by x-ray diffraction. Skinner et al. (2013) reported high-quality neutron and x-ray data on liquid alumina at ~2,400 K. A simultaneous fit using Reverse Monte Carlo (RMC) yielded a structure with a mean Al-O coordination number of 4.40 (with r2 = 2.5 Å). Our EPSR model at 2,416 K gives a structure in good agreement with Skinner's model at 2,400 K (Table 2).
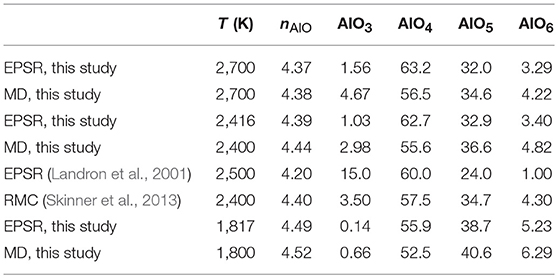
Table 2. Summary of average Al-O coordination number and speciation (%) of liquid alumina obtained using r2 = 2.5 Å.
For amorphous alumina sample 2, the structure factor obtained yielded a relatively flat low r region in D(r) below the first physical peak (due to Al-O bonds). The slope in this region of D(r) was used to estimate the sample density at 3.05(15) g cm−3 (atomic number density 0.09 Å−3) which was used during EPSR modeling. Amorphous sample 1 was modeled by EPSR using slightly lower quality x-ray diffraction data, so three different densities of 3.10 (12) g cm−3 were assumed to evaluate the errors associated with this assumption (Table 3). The result from EPSR for sample 2 using this density gives an average Al-O coordination number of 4.62, which is close to the value for glassy alumina from our classical MD simulation (density of 3.21 g cm−3). Our MD simulation result at 300 K is expected to provide an indication of how an alumina glass structure (could it be made) might look, with 49.5% AlO4, 42.0% AlO5, and 8.5% AlO6 units (Table 3), which is consistent with the results of ab initio MD simulation reported by Davis and Gutiérrez (2011). Also, both EPSR and MD simulation results of this work are similar to those measured by 27Al NMR for amorphous alumina made by sputtering techniques (Lee et al., 2009, 2010; Lee and Ryu, 2017). Lamparter and Kniep (1997) reported a much lower average Al-O coordination number than others using the RMC method, but this may be due to the considerable sulfur and H2O content of the sample, among other possible reasons.
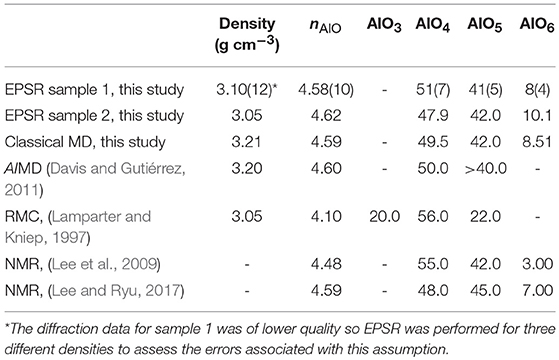
Table 3. Summary of average Al-O coordination number and speciation (%) of amorphous alumina thin films obtained using r2 = 2.5 Å.
The Al-O coordination number distributions in liquid and amorphous alumina summarized in Tables 2, 3, indicate the general conclusion that amorphous alumina has a larger mean Al-O coordination, which is consistent with the observed shift of the Al-O peak in G(r) to longer distances in the solid, see Figure 7D. The difference is mainly caused by a larger faction of AlO5, and a smaller faction of AlO4, in amorphous alumina, as compared to the liquid.
Bond Angle Distributions
Bond angle distributions play an essential role in describing the polyhedral shape and packing within the liquid structure. The Al-O-Al and O-Al-O bond angle distributions provide information on the inter- and intra-polyhedral connectivity, respectively. In Figure 10, we plot the probability B(θ)/ sinθ as a function of bond angle for both the EPSR and MD simulations using Al-O, O-O and Al-Al cutoff distances of 2.5, 3.8, and 4.1 Å, respectively. Dividing the true distributions, B(θ), by the random distribution, sinθ, accounts for the diminishing probability of 180° (or 0°) bond angles. Individual bond angle distributions corresponding to the linkages of Al5-O3-Al5, Al4-O3-Al4, Al4-O2-Al4, O3-Al5-O3, O3-Al4-O3, and O2-Al4-O2 have been described in detail in previous work by Skinner et al. (2013) and their results are applied to our analysis below.
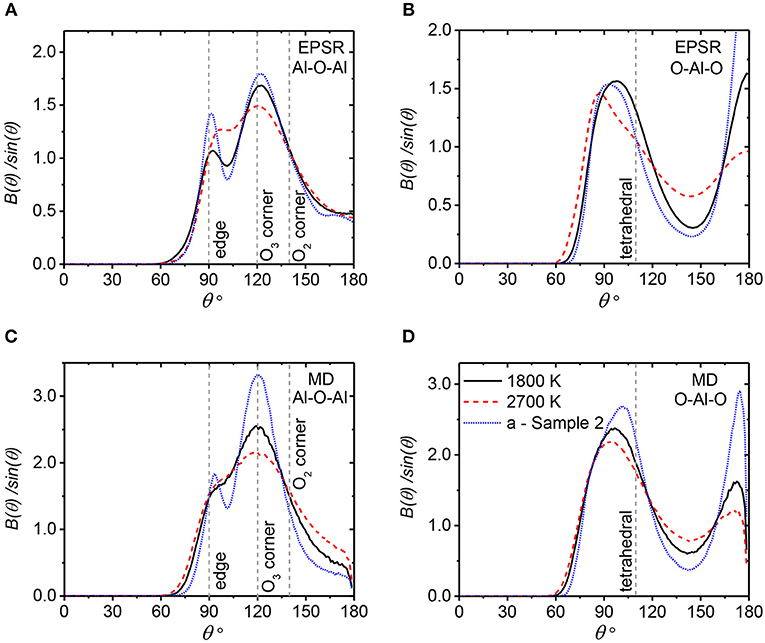
Figure 10. The bond angle distributions for amorphous alumina sample 2, and liquid alumina at the highest and lowest experimental temperatures of 2,700 and 1,817 K. EPSR results using a density of 3.05 g cm−3 (A,B) and MD models (C,D). (A,C) show the Al-O-Al angle distribution; (B,D) display the O-Al-O angle distribution. The dashed lines denote bond angles for some typical polyhedral arrangements (Skinner et al., 2013).
The Al-O-Al bond angle distributions from our EPSR and MD simulations are shown in Figures 10A,C. The main peak at 120° corresponds to Al4-O3-Al4 linkages and these become better defined at lower temperatures, indicating that slightly more AlO4 units are linked by 3-fold coordinated oxygens; namely AlO4 oxygen triclusters. The broad tail extending to 180° is associated with a large fraction of AlO4 units connected by 2-fold coordinated oxygen atoms. The peak at ~96° is attributed to Al5-O3-Al5 linkages and represents the formation of edge-sharing AlO5 units. This peak becomes slightly sharper with decreasing temperature indicating that better defined Al5-O3-Al5 form and connect by edge sharing with supercooling. This is in line with the more pronounced tail in the O-Al-O distribution at ~170° at the lower temperature, which derives from the O3-Al5-O3 units. The O-Al-O bond angle distributions in Figures 10B,D show generally similar trends but the features are sharper in the EPSR model. The broad peak comprises two main components: the O3-Al5-O3 around 80° and O3-Al4-O3 around 109.5°. The peak at ~100° sharpens and shifts to higher angles upon supercooling.
Glass Forming Ability
Liquid alumina is unlike any of the single oxide glass formers, such as SiO2 or B2O3, because it has an average cation-oxygen coordination number nMO > VM, the cation valence. This means that it violates Zachariasen's first rule of network glass formation, namely that the inequality nOM = (cM/cO)nMO = (VO/VM)nMO ≤ 2 = VO should hold. Indeed, experimentally, while it is found that alumina can be deeply supercooled, it not only cannot form glass but has properties vastly different from those of the single oxide glass formers, including much lower viscosities (Doremus, 2002). This can be understood qualitatively by the local structure. The predominance of OAl3 units limits the range of Al-O-Al angles and hence the flexibility to form a disordered network. The very same structural feature also lowers the single bond strength and hence viscous flow via bond breaking and reforming events is promoted, something which is further facilitated by a distribution of coordination environments (unlike e.g., SiO2 or B2O3). It is interesting to note that, as liquid alumina is supercooled, the coordination numbers increase such that the structure moves further away from the glass forming ideal of nAlO = 3. This is the opposite of observations in the case of some modified glass-forming aluminates such as CaAl2O4 (Liška et al., 2008; Drewitt et al., 2012). In-situ Al-27 NMR measurements on liquid alumina and calcium aluminates support this finding (Capron et al., 2001; Massiot et al., 2008), because the temperature dependence of the isotropic chemical shift changes sign from positive for liquid alumina, to negative for molten CaAl2O4. In the case of CaAl2O4, the Al-O coordination decreases during cooling, and tends toward 4, leading to a structure which promotes open network glass formation, with nOAl close to 2, which is enabled by charge balance from the modifying Ca2+ cations and the smaller Al /O ratio.
Conclusions
The structure of deeply supercooled liquid Al2O3 has been investigated using a combination of high energy x-ray diffraction and neutron diffraction, revealing a weak but continuous dependence of the local structure on temperature. The structure of amorphous alumina has also been investigated using x-ray diffraction. Atomistic models based on empirical potential structure refinement to the diffraction data, and classical molecular dynamics simulations using the inter-atomic potentials of Du and Corrales (2007) lead to similar pictures. Namely,
1. The mean Al-O coordination number increases gradually under supercooling. AlO4 and AlO5 are the predominant motifs in normal and supercooled liquid alumina. The number of AlO5 units increases by 21% during supercooling from 2,700 to 1,817 K. The oxygen atoms are mainly linked to three AlOx polyhedra, and the number of OAl3 increases by 9% over the same experimentally accessed temperature range, at the expense of OAl2 bridging oxygens.
2. Oxygen triclusters Al4, 5-O3-Al4, 5 dominate the linkages found in both the stable melt and supercooled liquid. As the liquid is supercooled, a growth in the population of Al5-O3-Al5 groups is observed, and these tend to share edges.
3. Compared to the liquid, amorphous alumina has a smaller fraction of AlO4 and a larger number of AlO5 motifs, leading to a larger mean Al-O coordination number. Given the observed increase in coordination numbers during supercooling, the local structure of amorphous alumina is consistent with expectations for the hypothetical glass.
4. Nonetheless, the temperature dependence of the structure of liquid alumina is such that glass formation becomes less and less likely during supercooling. This is because larger coordination numbers and edge-sharing polyhedra tend to reduce network flexibility and promote crystallization.
Data Availability
The full datasets generated for this study are available on request to the corresponding author. Exemplary x-ray and neutron structure factors are available in the Supplementary Material, Table S1.
Author Contributions
CB conceived the work. DB fabricated the samples. CS, OA, JN, AT, JW, and CB performed the experiments. CS, OA, and JD performed the simulations. CS, OA, JY, and CB wrote the paper.
Funding
This research used resources of the Advanced Photon Source, the U.S. Department of Energy (DOE) Office of Science User Facility operated for the DOE Office of Science by Argonne National Laboratory under Contract No. DE-AC02-06CH11357 and by the Spallation Neutron Source, Oak Ridge National Laboratory under Contract No. DE-AC05-00OR22725. This work was partially funded under DOE grant number DE-SC0015241.
Conflict of Interest Statement
The authors declare that the research was conducted in the absence of any commercial or financial relationships that could be construed as a potential conflict of interest.
Acknowledgments
CS gratefully acknowledges financial support from the China Scholarship Council (CSC No. 201706890053).
Supplementary Material
The Supplementary Material for this article can be found online at: https://www.frontiersin.org/articles/10.3389/fmats.2019.00038/full#supplementary-material
References
Ahuja, R., Belonoshko, A. B., and Johansson, B. (1998). Melting and liquid structure of aluminum oxide using a molecular-dynamics simulation. Phys. Rev. E 57:1673. doi: 10.1103/PhysRevE.57.1673
Alderman, O., Liska, M., Machacek, J., Benmore, C. J., Lin, A., Tamalonis, J., et al. (2016). Temperature-driven structural transitions in molten sodium borates Na2O–B2O3: x-ray diffraction, thermodynamic modeling, and implications for topological constraint theory. J. Phys. Chem. C 120, 553–560. doi: 10.1021/acs.jpcc.5b10277
Alderman, O., Skinner, L. B., Benmore, C. J., Tamalonis, A., and Weber, J. (2014). Structure of molten titanium dioxide. Phys. Rev. B 90:94204. doi: 10.1103/PhysRevB.90.094204
Ansell, S., Krishnan, S., Weber, J. R., Felten, J. J., Nordine, P. C., Beno, M. A., et al. (1997). Structure of liquid aluminum oxide. Phys. Rev. Lett. 78:464. doi: 10.1103/PhysRevLett.78.464
Belonoshko, A. B. (1998). Melting of corundum using conventional and two-phase molecular dynamic simulation method. Phys. Chem. Miner. 25, 138–141. doi: 10.1007/s002690050096
Benmore, C. J., Gallington, L. C., Hebden, A., Weber, J. K. R., et al. (2019). Laser heating of polycrystalline nuclear materials. Proc. 13th Synchrotron Radiation Instrumentation Conference (Taipei).
Benmore, C. J., and Weber, J. (2017). Aerodynamic levitation, supercooled liquids and glass formation. Adv. Phys. X 2, 717–736. doi: 10.1080/23746149.2017.1357498
Benmore, C. J., Weber, J., Sampath, S., Siewenie, J., Urquidi, J., and Tangeman, J. A. (2003). A neutron and x-ray diffraction study of calcium aluminate glasses. J. Phys. Condens. Matt. 15:S2413. doi: 10.1088/0953-8984/15/31/316
Berman, D., Guha, S., Lee, B., Elam, J. W., Darling, S. B., and Shevchenko, E. V. (2017). Sequential infiltration synthesis for the design of low refractive index surface coatings with controllable thickness. ACS Nano 11, 2521–2530. doi: 10.1021/acsnano.6b08361
Burt, J. M., and Boyd, I. D. (2007). High altitude plume simulations for a solid propellant rocket. AIAA J. 45, 2872–2884. doi: 10.2514/1.30129
Capron, M., Florian, P., Fayon, F., Trumeau, D., Hennet, L., Gaihlanou, M., et al. (2001). Local structure and dynamics of high temperature SrO–Al2O3 liquids studied by 27Al NMR and Sr K-edge XAS spectroscopy. J. Non-Cryst. Solids 293–295, 496–501. doi: 10.1016/S0022-3093(01)00762-1
Cockayne, B., Chesswas, M., and Gasson, D. B. (1967). Single-crystal growth of sapphire. J. Mater. Sci. 2, 7–11. doi: 10.1007/BF00550046
Coutures, J., Massiot, D., Bessada, C., Echegut, P., Rifflet, J., and Taulelle, F. (1990). Etude par RNA 27Al d'almuminates liquides dans le domaine 1600-2100oC. Comptes rendus de l'Académie des sciences. Série 2, Mécanique, Phys. Chim. Sci. de l'univers, Sci. de la Terre 310, 1041–1045.
Davis, S., and Gutiérrez, G. (2011). Structural, elastic, vibrational and electronic properties of amorphous Al2O3 from ab initio calculations. J. Phys. Condens. Matt. 23:495401. doi: 10.1088/0953-8984/23/49/495401
Drewitt, J. W., Hennet, L., Zeidler, A., Jahn, S., Salmon, P. S., Neuville, D. R., et al. (2012). Structural transformations on vitrification in the fragile glass-forming system CaAl2O4. Phys. Rev. Lett. 109:235501. doi: 10.1103/PhysRevLett.109.235501
Du, J., Benmore, C. J., Corrales, R., Hart, R. T., and Weber, J. R. (2009). A molecular dynamics simulation interpretation of neutron and x-ray diffraction measurements on single phase Y2O3-Al2O3 glasses. J. Phys. Condens. Matt. 21, 205102. doi: 10.1088/0953-8984/21/20/205102
Du, J., and Corrales, L. R. (2007). Understanding lanthanum aluminate glass structure by correlating molecular dynamics simulation results with neutron and X-ray scattering data. J. Non-Cryst. Solids 353, 210–214. doi: 10.1016/j.jnoncrysol.2006.06.025
Faber, T. E., and Ziman, J. M. (1965). A theory of the electrical properties of liquid metals: III. The resistivity of binary alloys. Philos. Mag. 11, 153–173. doi: 10.1080/14786436508211931
Fejer, M. M., Nightingale, J. L., Magel, G. A., and Byer, R. L. (1984). Laser–heated miniature pedestal growth apparatus for single–crystal optical fibers. Rev. Sci. Instrum. 55, 1791–1796. doi: 10.1063/1.1137661
Fiquet, G., Richet, P., and Montagnac, G. (1999). High-temperature thermal expansion of lime, periclase, corundum and spinel. Phys. Chem. Miner. 27, 103–111. doi: 10.1007/s002690050246
Florian, P., Massiot, D., Poe, B., Farnan, I., and Coutures, J. (1995). A time resolved 27Al NMR study of the cooling process of liquid alumina from 2450 C to crystallisation. Solid State Nucl. Mag. 5, 233–238. doi: 10.1016/0926-2040(95)01188-X
Glorieux, B., Millot, F., Rifflet, J., and Coutures, J. (1999). Density of superheated and undercooled liquid alumina by a contactless method. Int. J. Thermophys. 20, 1085–1094. doi: 10.1023/A:1022650703233
Gorham, C. S., Gaskins, J. T., Parsons, G. N., Losego, M. D., and Hopkins, P. E. (2014). Density dependence of the room temperature thermal conductivity of atomic layer deposition-grown amorphous alumina (Al2O3). Appl. Phys. Lett. 104:253107. doi: 10.1063/1.4885415
Granroth, G. E., An, K., Smith, H. L., Whitfield, P., Neuefeind, J. C., Lee, J., et al. (2018). Event-based processing of neutron scattering data at the spallation neutron source. J. Appl. Crystallogr. 51, 616–629. doi: 10.1107/S1600576718004727
Gutiérrez, G., Belonoshko, A. B., Ahuja, R., and Johansson, B. (2000). Structural properties of liquid Al2O3: a molecular dynamics study. Phys. Rev. E 61:2723. doi: 10.1103/PhysRevE.61.2723
Hammersley, A. P., Svensson, S. O., Hanfland, M., Fitch, A. N., and Hausermann, D. (1996). Two-dimensional detector software: from real detector to idealised image or two-theta scan. Int. J. High Pressure Res. 14, 235–248. doi: 10.1080/08957959608201408
Hemmati, M., Wilson, M., and Madden, P. A. (1999). Structure of liquid Al2O3 from a computer simulation model. J. Phys. Chem. B 103, 4023–4028. doi: 10.1021/jp983529f
Hennet, L., Pozdnyakova, I., Bytchkov, A., Cristiglio, V., Palleau, P., Fischer, H. E., et al. (2006). Levitation apparatus for neutron diffraction investigations on high temperature liquids. Rev. Sci. Instrum. 77:53903. doi: 10.1063/1.2200756
Hennet, L., Thiaudiere, D., Gailhanou, M., Landron, C., Coutures, J., and Price, D. L. (2002). Fast x-ray scattering measurements on molten alumina using a 120 curved position sensitive detector. Rev. Sci. Instrum. 73, 124–129. doi: 10.1063/1.1426228
Hung, P. K., and Vinh, L. T. (2006). Local microstructure of liquid and amorphous Al2O3. J. Non-Cryst. Solids 352, 5531–5540. doi: 10.1016/j.jnoncrysol.2006.09.016
Hung, P. K., Vinh, L. T., Nghiep, D. M., and Nguyen, P. N. (2006). Computer simulation of liquid Al2O3. J. Phys. Condens. Matt. 18:9309. doi: 10.1088/0953-8984/18/41/001
Jennings, G. (1997). QXRD–Readout Software for Flat Panel x-ray Detectors. Structural Science Group, Advanced Photon Source, Argonne National Laboratory, Argonne, IL 60439.
Johnson, J., Weber, R., and Grimsditch, M. (2005). Thermal and mechanical properties of rare earth aluminate and low-silica aluminosilicate optical glasses. J. Non-Cryst. Solids 351, 650–655. doi: 10.1016/j.jnoncrysol.2005.01.065
Keen, D. A. (2001). A comparison of various commonly used correlation functions for describing total scattering. J. Appl. Crystallogr. 34, 172–177. doi: 10.1107/S0021889800019993
Kniep, R., Lamparter, P., and Steeb, S. (1989). Structure of anodic coatings on Aluminium. Adv. Mater. Weinheim. 1, 229–231. doi: 10.1002/adma.19890010705
Kresse, G., Schmid, M., Napetschnig, E., Shishkin, M., Köhler, L., and Varga, P. (2005). Structure of the ultrathin aluminum oxide film on NiAl (110). Science 308, 1440–1442. doi: 10.1126/science.1107783
Krishnan, S., Hennet, L., Jahn, S., Key, T. A., Madden, P. A., Saboungi, M., et al. (2005). Structure of normal and supercooled liquid aluminum oxide. Chem. Mater. 17, 2662–2666. doi: 10.1021/cm050254p
LaBelle, H. E. Jr. (1971). Growth of controlled profile crystals from the melt: part II-Edge-defined, film-fed growth (EFG). Mater. Res. Bull. 6, 581–589. doi: 10.1016/0025-5408(71)90007-9
Lamparter, P., and Kniep, R. (1997). Structure of amorphous Al2O3. Phys. B Condens. Matt. 234, 405–406. doi: 10.1016/S0921-4526(96)01044-7
Landron, C., Hennet, L., Jenkins, T. E., Greaves, G. N., Coutures, J. P., and Soper, A. K. (2001). Liquid alumina: detailed atomic coordination determined from neutron diffraction data using empirical potential structure refinement. Phys. Rev. Lett. 86:4839. doi: 10.1103/PhysRevLett.86.4839
Lee, S., Cahill, D. G., and Allen, T. H. (1995). Thermal conductivity of sputtered oxide films. Phys. Rev. B 52:253. doi: 10.1103/PhysRevB.52.253
Lee, S. K., Lee, S. B., Park, S. Y., Yi, Y. S., and Ahn, C. W. (2009). Structure of amorphous aluminum oxide. Phys. Rev. Lett. 103:95501. doi: 10.1103/PhysRevLett.103.095501
Lee, S. K., Park, S. Y., Yi, Y. S., and Moon, J. (2010). Structure and disorder in amorphous alumina thin films: insights from high-resolution solid-state NMR. J. Phys. Chem. C 114, 13890–13894. doi: 10.1021/jp105306r
Lee, S. K., and Ryu, S. (2017). Probing of triply coordinated oxygen in amorphous Al2O3. J. Phys. Chem. Lett. 9, 150–156. doi: 10.1021/acs.jpclett.7b03027
Liška, M., Macháček, J., Perichta, P., Gedeon, O., and Pilát, J. (2008). Thermochemical modelling and ab initio molecular dynamics simulations of calcium aluminate glasses. Ceramics-Silikáty 52, 61–65. Available online at: http://www.ceramics-silikaty.cz/index.php?page=cs_detail_doi&id=453
Lorch, E. (1969). Neutron diffraction by germania, silica and radiation-damaged silica glasses. J. Phys. C Solid State Phys. 2:229. doi: 10.1088/0022-3719/2/2/305
Massiot, D., Fayon, F., Montouillout, V., Pellerin, N., Hiet, J., Roiland, C., et al. (2008). Structure and dynamics of oxide melts and glasses: a view from multinuclear and high temperature NMR. J. Non-Cryst. Solids 354, 249–254. doi: 10.1016/j.jnoncrysol.2007.06.097
Massiot, D., Taulelle, F., and Coutures, J. P. (1990). Structural diagnostic of high temperature liquid phases by 27Al NMR. Le J. Phys. Colloq. 51, C5-C425–C5-C431. doi: 10.1051/jphyscol:1990551
Massobrio, C., Du, J., Bernasconi, M., and Salmon, P. S. (2015). Molecular Dynamics Simulations of Disordered Materials. Springer.
McMillan, P., and Piriou, B. (1983). Raman spectroscopy of calcium aluminate glasses and crystals. J. Non-Cryst. Solids 55, 221–242. doi: 10.1016/0022-3093(83)90672-5
Mei, Q., Benmore, C. J., Sampath, S., Weber, J., Leinenweber, K., Amin, S., et al. (2006). The structure of permanently densified CaAl2O4 glass. J. Phys. Chem. Solids 67, 2106–2110. doi: 10.1016/j.jpcs.2006.05.018
Mei, Q., Benmore, C. J., Weber, J., Wilding, M., Kim, J., and Rix, J. (2008). Diffraction study of calcium aluminate glasses and melts: II. High energy X-ray diffraction on melts. J. Phys. Condens. Matt. 20:245107. doi: 10.1088/0953-8984/20/24/245107
Miyata, T., Kataza, H., Okamoto, Y., Onaka, T., and Yamashita, T. (2000). A spectroscopic study of dust around 18 oxygen-rich mira variables in the N band. I. Dust profiles. Astrophys. J. 531:917. doi: 10.1086/308485
Momida, H., Hamada, T., Takagi, Y., Yamamoto, T., Uda, T., and Ohno, T. (2006). Theoretical study on dielectric response of amorphous alumina. Phys. Rev. B 73:54108. doi: 10.1103/PhysRevB.73.054108
Neuefeind, J., Feygenson, M., Carruth, J., Hoffmann, R., and Chipley, K. K. (2012). The nanoscale ordered materials diffractometer NOMAD at the spallation neutron source SNS. Nuclear Instrum. Methods Phys. Res. Sect. B Beam Interact. Mater. Atoms 287, 68–75. doi: 10.1016/j.nimb.2012.05.037
Neuville, D. R., Cormier, L., and Massiot, D. (2006). Al coordination and speciation in calcium aluminosilicate glasses: effects of composition determined by 27Al MQ-MAS NMR and Raman spectroscopy. Chem. Geol. 229, 173–185. doi: 10.1016/j.chemgeo.2006.01.019
Neuville, D. R., De Ligny, D., Cormier, L., Henderson, G. S., Roux, J., Flank, A., et al. (2009). The crystal and melt structure of spinel and alumina at high temperature: An in-situ XANES study at the Al and Mg K-edge. Geochim. Cosmochim. Ac. 73, 3410–3422. doi: 10.1016/j.gca.2009.02.033
Nordine, P. C., Weber, J. R., and Abadie, J. G. (2000). Properties of high-temperature melts using levitation. Pure Appl. Chem. 72, 2127–2136. doi: 10.1351/pac200072112127
Nubling, R. K., and Harrington, J. A. (1997). Optical properties of single-crystal sapphire fibers. Appl. Optics 36, 5934–5940. doi: 10.1364/AO.36.005934
Oka, Y., Takahashi, T., Okada, K., and Iwai, S. (1979). Structural analysis of anodic alumina films. J. Non-Cryst. Solids 30, 349–357. doi: 10.1016/0022-3093(79)90172-8
Onaka, T., De Jong, T., and Willems, F. J. (1989). A study of M Mira variables based on IRAS LRS observations. I-Dust formation in the circumstellar shell. Astron. Astrophys. 218, 169–179.
Paradis, P., Ishikawa, T., Saita, Y., and Yoda, S. (2004). Non-contact thermophysical property measurements of liquid and undercooled alumina. Jpn. J. Appl. Phys. 43:1496. doi: 10.1143/JJAP.43.1496
Plastinin, Y., Karabdzhak, G., Khmelinin, B., Baula, G., and Rodionov, A. (2001). “Ultraviolet, visible and infrared spectra modeling for solid and liquid-fuel rocket exhausts,” in: 39th Aerospace Sciences Meeting and Exhibit (Reno, NV).
Qiu, X., Thompson, J. W., and Billinge, S. J. (2004). PDFgetX2: a GUI-driven program to obtain the pair distribution function from X-ray powder diffraction data. J. Appl. Crystallogr. 37:678. doi: 10.1107/S0021889804011744
Risbud, S. H., Kirkpatrick, R. J., Taglialavore, A. P., and Montez, B. (1987). Solid-state NMR evidence of 4-, 5, and 6-fold aluminum sites in roller-quenched SiO2-A12O3 glasses. J. Am. Ceram. Soc. 70, 10–12. doi: 10.1111/j.1151-2916.1987.tb04859.x
Rosenflanz, A., Frey, M., Endres, B., Anderson, T., Richards, E., and Schardt, C. (2004). Bulk glasses and ultrahard nanoceramics based on alumina and rare-earth oxides. Nature 430, 761–764. doi: 10.1038/nature02729
San Miguel, M. A., Sanz, J. F., Alvarez, L. J., and Odriozola, J. A. (1998). Molecular-dynamics simulations of liquid aluminum oxide. Phys. Rev. B 58:2369. doi: 10.1103/PhysRevB.58.2369
Schneider, S. J. (1970). Cooperative determination of the melting point of alumina. Pure Appl. Chem. 21, 115–122. doi: 10.1351/pac197021010115
She, Y., Lee, J., Diroll, B., Scharf, T., Shevchenko, E., and Berman, D. (2018). Accessibility of the pores in highly porous alumina films synthesized via sequential infiltration synthesis. Nanotechnology 29:495703. doi: 10.1088/1361-6528/aae144
She, Y., Lee, J., Diroll, B. T., Lee, B., Aouadi, S., Shevchenko, E. V., et al. (2017). Rapid synthesis of nanoporous conformal coatings via plasma-enhanced sequential infiltration of a polymer template. ACS Omega 2, 7812–7819. doi: 10.1021/acsomega.7b01314
Skinner, L. B., Barnes, A. C., Salmon, P. S., Hennet, L., Fischer, H. E., Benmore, C. J., et al. (2013). Joint diffraction and modeling approach to the structure of liquid alumina. Phys. Rev. B 87:24201. doi: 10.1103/PhysRevB.87.024201
Skinner, L. B., Benmore, C. J., and Parise, J. B. (2012). Area detector corrections for high quality synchrotron X-ray structure factor measurements. Nuclear Instrum. Methods Phys. Res. Sect. A 662, 61–70. doi: 10.1016/j.nima.2011.09.031
Smith, W., and Forester, T. R. (1996). DL_POLY_2. 0: a general-purpose parallel molecular dynamics simulation package. J. Molecular Graphics 14, 136–141. doi: 10.1016/S0263-7855(96)00043-4
Soper, A. K. (1996). Empirical potential Monte Carlo simulation of fluid structure. Chem. Phys. 202, 295–306. doi: 10.1016/0301-0104(95)00357-6
Soper, A. K. (2005). Partial structure factors from disordered materials diffraction data: an approach using empirical potential structure refinement. Phys. Rev. B 72:104204. doi: 10.1103/PhysRevB.72.104204
Stebbins, J. F., Kroeker, S., Lee, S. K., and Kiczenski, T. J. (2000). Quantification of five-and six-coordinated aluminum ions in aluminosilicate and fluoride-containing glasses by high-field, high-resolution 27Al NMR. J. Non-Cryst. Solids 275, 1–6. doi: 10.1016/S0022-3093(00)00270-2
Stierle, A., Renner, F., Streitel, R., Dosch, H., Drube, W., and Cowie, B. C. (2004). X-ray diffraction study of the ultrathin Al2O3 layer on NiAl (110). Science 303, 1652–1656. doi: 10.1126/science.1094060
Susman, S., Volin, K. J., Montague, D. G., and Price, D. L. (1991). Temperature dependence of the first sharp diffraction peak in vitreous silica. Phys. Rev. B 43:11076. doi: 10.1103/PhysRevB.43.11076
Taylor, J. R., Dinsdale, A. T., Hilleit, M., and Selleby, M. (1992). A Critical assessment of tnermodynamic and phase diagram data for the Al-O system. Calphad 16, 173–179. doi: 10.1016/0364-5916(92)90005-I
Van Hoang, V. (2004). Molecular dynamics study on structure and properties of liquid and amorphous Al2O3. Phys. Rev. B 70:134204. doi: 10.1103/PhysRevB.70.134204
Van Hoang, V. (2005). About an order of liquid-liquid phase transition in simulated liquid Al2O3. Phys. Lett. A 335, 439–443. doi: 10.1016/j.physleta.2004.12.040
Van Hoang, V., and Oh, S. K. (2004). Molecular dynamics study of aging effects in supercooled Al2O3. Phys. Rev. E 70:61203. doi: 10.1103/PhysRevE.70.061203
Van Hoang, V., and Oh, S. K. (2005). Computer simulation of the structural transformation in liquid Al2O3. J. Phys. Condens Matt. 17:3025. doi: 10.1088/0953-8984/17/19/016
Verma, A. K., Modak, P., and Karki, B. B. (2011). First-principles simulations of thermodynamical and structural properties of liquid Al2O3 under pressure. Phys. Rev. B 84:174116. doi: 10.1103/PhysRevB.84.174116
Wang, H. L., Lin, C. H., and Hon, M. H. (1997). The dependence of hardness on the density of amorphous alumina thin films by PECVD. Thin Solid Films 310, 260–264. doi: 10.1016/S0040-6090(97)00404-5
Waseda, Y., Sugiyama, K., and Toguri, J. M. (1995). Direct determination of the local structure in molten alumina by high temperature X-ray diffraction. Z. für Naturforsch. A 50, 770–774. doi: 10.1515/zna-1995-0809
Watanabe, Y., Masuno, A., and Inoue, H. (2012). Glass formation of rare earth aluminates by containerless processing. J. Non-Cryst. Solids 358, 3563–3566. doi: 10.1016/j.jnoncrysol.2012.02.001
Weber, J., Benmore, C. J., Skinner, L. B., Neuefeind, J., Tumber, S. K., Jennings, G., et al. (2014). Measurements of liquid and glass structures using aerodynamic levitation and in-situ high energy x-ray and neutron scattering. J. Non-Cryst. Solids 383, 49–51. doi: 10.1016/j.jnoncrysol.2013.03.035
Weber, R., Sen, S., Youngman, R. E., Hart, R. T., and Benmore, C. J. (2008). Structure of high alumina content Al2O3- SiO2 composition glasses. J. Phys. Chem. B 112, 16726–16733. doi: 10.1021/jp807964u
Weigel, C., Cormier, L., Calas, G., Galoisy, L., and Bowron, D. T. (2008). Intermediate-range order in the silicate network glasses NaFexAl 1– x Si2O6 (x = 0, 0.5, 0.8, 1): A neutron diffraction and empirical potential structure refinement modeling investigation. Phys. Rev. B 78:64202. doi: 10.1103/PhysRevB.78.064202
Wilding, M. C., Benmore, C. J., and Weber, J. (2010). High-energy X-ray diffraction from aluminosilicate liquids. J. Phys. Chem. B 114, 5742–5746. doi: 10.1021/jp907587e
Winkler, A., Horbach, J., Kob, W., and Binder, K. (2004). Structure and diffusion in amorphous aluminum silicate: a molecular dynamics computer simulation. J. Chem. Phys. 120, 384–393. doi: 10.1063/1.1630562
Keywords: alumina, supercooled liquid, amorphous, structure, x-ray diffraction, glass forming ability
Citation: Shi C, Alderman OLG, Berman D, Du J, Neuefeind J, Tamalonis A, Weber JKR, You J and Benmore CJ (2019) The Structure of Amorphous and Deeply Supercooled Liquid Alumina. Front. Mater. 6:38. doi: 10.3389/fmats.2019.00038
Received: 14 November 2018; Accepted: 20 February 2019;
Published: 19 March 2019.
Edited by:
Ashutosh Goel, Rutgers University, The State University of New Jersey, United StatesReviewed by:
Daniel R. Neuville, UMR7154 Institut de physique du globe de Paris (IPGP), FranceGarth W. Scannell, Friedrich-Schiller-Universität Jena, Germany
Copyright © 2019 Shi, Alderman, Berman, Du, Neuefeind, Tamalonis, Weber, You and Benmore. This is an open-access article distributed under the terms of the Creative Commons Attribution License (CC BY). The use, distribution or reproduction in other forums is permitted, provided the original author(s) and the copyright owner(s) are credited and that the original publication in this journal is cited, in accordance with accepted academic practice. No use, distribution or reproduction is permitted which does not comply with these terms.
*Correspondence: Chris J. Benmore, benmore@anl.gov