Anchor Forces on Coir-Based Artificial Seagrass Mats: Dependence on Wave Dynamics and Their Potential Use in Seagrass Restoration
 Raúl Villanueva
 Maike Paul
 Torsten Schlurmann
- Ludwig Franzius Institute for Hydraulic, Estuarine and Coastal Engineering, Leibniz University Hannover, Hanover, Germany
Seagrasses represent an essential part of the coastal environment and are hence the target of many coastal restoration projects. Artificial seagrass (ASG) mats may facilitate seagrass growth, making them a captivating option for restoration projects. However, little is known about the forces occurring on mats deployed in marine environments and especially on how these forces are transmitted to the anchoring points. Here, we present a study of prototype biodegradable coconut-mesh mats as base layer for ASG meadows and investigate the forces that occur at the anchors. We test the performance of three mesh types under wave forcing using two different anchor configurations without ASG and subsequently test ASG mats of one mesh type under wave forcing and a 4-anchor configuration to assess the effect of the ASG on anchor loading as a function of incident orbital velocities. We found that the mat composition plays a more important role than the number of anchors in anchor load reduction. The anchor forces were 2–4 times higher at front anchors compared to rear anchors, relative to wave propagation direction, and were also considerably higher in that direction compared to the opposite direction. With ASG, the forces increased compared to the highest measured forces without ASG. The forces on the anchors were almost fully dominated by the drag on the ASG based on material properties, ASG reconfiguration and flow conditions. We derive a relation between horizontal orbital velocities and expected forcing on the anchor based on ASG properties and the corresponding area of each anchor and discuss relevant criteria for the design of ASG mats. This should help to assess the loading on anchors deployed for restoration under specific site conditions and chosen materials.
Introduction
Seagrasses are important globally spread coastal ecosystems which provide essential ecosystem services (Short et al., 2007). These services include habitat for fish, carbon sequestration (Barbier et al., 2011; Fourqurean et al., 2012) and reduction of hydrodynamic energy (Ondiviela et al., 2014). Despite these known services, almost a third of seagrass cover has been destroyed mostly due to human activity since records started during the late 19th century (Waycott et al., 2009). This has called for incentives to promote seagrass protection and restoration (Cullen-Unsworth and Unsworth, 2018) and to tackle the main challenges these ecosystems face (Unsworth et al., 2019). The UN Decade for Ecosystem Restoration highlights the need for immediate action, whereby new reports such as The Blue Guide to Coastal Resilience (The Nature Conservancy, 2021), which provide guidelines for practitioners and stakeholders using nature-based solutions, include seagrasses as an essential ecosystem to be targeted for restoration.
A plethora of pilot seagrass restoration projects have tested different approaches; van Katwijk et al. (2016) provide a meta-analysis of more than 1700 trials, concluding that success, defined through seagrass survival, is mainly driven by the number of introduced seedlings and the site selected for restoration. Hydrodynamic conditions, i.e., incident wave heights and currents, also represent an important factor for survival (Barbier et al., 2011), so that shelter of seedlings plays an important role for restoration (Villanueva et al., 2021). To achieve shelter, artificial seagrass (ASG) mats can be deployed in order to minimize wave loading and currents in and around the desired restoration area, subsequently enhancing sedimentation and improving light availability (Carus et al., 2021). The ASG mats are composed of a base layer to which seagrass surrogates in the form of either flexible shoots or stems can be attached. Both components should ideally be made of biodegradable materials lest they become a source of microplastics whose proliferation and transport are enhanced by hydrodynamic loading (Kerpen et al., 2020) and represent a high risk to wildlife (Wright et al., 2013).
A candidate for the base layer to be used in seagrass restoration is coconut fiber – or coir. Coir-based geotextiles have gained popularity as a geoengineering solution as they provide high tensile strengths of up to 20 kN m–1 (Subaida et al., 2008) while being biodegradable and hence less damaging to the environment. These geotextiles have been successfully applied for reforestation purposes – successfully prompting vegetation growth, improving soil stability, and protecting seedlings – as well as stabilization of riverbanks and sandy beaches, predominantly in Brazil, Indonesia and India (see e.g., David et al., 2016). Admittedly, the tensile resistance of such geotextiles decreases with time due to degradation (Miller et al., 1998; Marques et al., 2014), yet they have proven to last for 2–5 years when used for soil stabilization and inland reforestation (Rickson, 2006). Experiments on tensile strength show 40% loss during the first half year and up to 80% after 1 year for reforestation under tropical conditions (Marques et al., 2014), and 77–90% after the 3rd year for stream bank treatments (Miller et al., 1998). Albeit scarce, examples of submerged ASG mats deployed in marine environments do exist; they focus on scour protection around pipelines and other structures, sediment and bed stabilization, habitat facilitation and even seagrass restoration (Ismail, 2003). On scour protection applications, one of the main problems commonly reported were anchors (Jones et al., 2006), whereby a popular solution still used today is the one proposed almost half a century ago by Bakker et al. (1973): substrate-filled tubes that weigh down the mats. The authors advocate for weighted anchors, preferably flexible, to adapt to the changing environment and thus avoid failure, but also state that under extreme conditions pinned anchors may be needed. Jones et al. (2006) investigated the performance of ASG mats made by SSCS – a United Kingdom-based company focused on scour protection – and described the company-developed “Safe Anchor” which consists of a steel anchor buried at 1 m depth and connected to the mat by a high resistance strap. On seagrass restoration, Campbell and Paling (2003) used metal rods to anchor 1.5- by 1.5-m ASG mats to promote seagrass growth but did not measure the forces befalling the anchors. Bakker et al. (1973) reported an anchoring strength of about 1.5 kN for anchors pinned 0.5–1 m deep and state that “sufficient anchoring” is provided by anchoring tubes of 7–15 kg m–2. However, none of these studies measured the actual forces occurring at the anchors under the local conditions. The anchors of flexible submerged mats laying on the seabed will experience oscillatory loads from the wave orbital motion and potentially increased loads caused by unidirectional currents (e.g., in tidal areas). The oscillatory motion is expected to create horizontal shear loads on the anchors caused by hydrodynamic drag and a lift force caused by both drag and buoyancy. The acting forces, however, will differ from other submerged anchors, such as those used for mooring lines, as these are affected by the water level fluctuations and movement along the whole water column (Peña et al., 2011). In addition, due to the flexibility of the mats, the distribution of forces will differ from the symmetrical force distribution given by theory of plates and applied in construction and mechanics (e.g., anchor bolts and fastenings, see Mallée and Eligehausen, 2013).
To date, coir-geotextiles have not yet been employed permanently under marine conditions and their performance in such environments is largely unknown. Moreover, the forces occurring at the anchoring points of such mats have not been investigated. Thus, the aims of this study are: (i) compare the forces occurring at the anchoring points of coir-based geotextiles with differing structural composition; (ii) test the forces on a prototype ASG mat to be used in coastal areas for restoration purposes; and (iii) discuss the design criteria of candidate ASG mats to be used for restoration under real environmental conditions (prototype scale to match material properties and wave-induced forces on ASG mats) based on physical experiments and provide practical initial guidelines for future pilot studies. Finally, we derive a formula to determine the expected loading on anchors of ASG mats deployed in coastal areas depending on the local hydrodynamic conditions which can then be used as basis for the conception of set-ups to be used in pilot projects.
Forces on an Artificial Seagrass Mat
Drag Force
Any submerged object in a marine environment will be subject to pressure and viscosity-induced forces – referred to as drag – and inertial forces caused by the mass acceleration of the fluid. These forces have been reliably represented by Morison-equation-based formulations where the forces are proportional to the square of the horizontal velocity F∼u2, whereby generally, in the case of aquatic vegetation, plant movement and the inertial portion can be neglected (see e.g., Mendez and Losada, 2004; Losada et al., 2016), thus leaving the general form for drag force as:
where the subscript x represents the horizontal force component parallel to the main flow direction, ρ is the water density, CD the drag coefficient, A the characteristic area perpendicular to flow and u the flow velocity. Under wave conditions, this velocity u is represented by the maximum horizontal wave orbital velocity, i.e., u = umax. A will be given by the vegetation geometry orthogonal to flow, usually represented by the vegetation width bv and upright (stretched) height hc.
A biodegradable ASG mat deployed for restoration would be composed of a flexible base layer and a set of flexible seagrass-like stems or shoots (Carus et al., 2021). The base layer lying on the seabed would be primarily subject to viscous drag driven by the so-called skin friction induced by an ambient current. This typical load case is commonly expressed by the bed shear stress τb which, for unidirectional flow, is analogously represented by means of the drag coefficient as CD=τb/ρu2 (Bricker et al., 2005). Under wave-induced loading, the skin friction represents a principal component of the wave-induced bed shear stress τb,w which in turn depends on the empirically derived friction coefficient fw (Pascolo et al., 2018), previously defined by Soulsby (1997) as:
where aB is the horizontal orbital wave amplitude at the bed given by aB=uT/2π, with T the wave period; z0 is the bed roughness length calculated as z0=ks/30with ks the equivalent sand roughness. The subscript w in Equation 2 and further equations stands for waves. The maximum wave-induced bed shear stress τb,w is then given by:
The drag force on the ASG stems, on the other hand, is dominated by the pressure drag and is a function of the characteristic area normal to flow (Kobayashi et al., 1993; Mendez and Losada, 2004; Nepf, 2011). To simplify the calculation of the drag force on flexible elements, Luhar and Nepf (2011) presented a model based on the effective blade length leff – i.e., the height of a single rigid stem whose drag matches to that of a flexible stem of height hc (Equation 4). This model is based on the dimensionless parameters B and Ca (Equations 5, 6) which correspond to the buoyancy term and the Cauchy Number, respectively, and represent the ratios of buoyancy and drag to the restoring forces due to stiffness.
where the subscript C in leff represents the “current-only model”, Δρ is the difference in density between water and the ASG, t is the vegetation thickness, and EI the flexural rigidity given by the modulus of elasticity E and second moment of area I. The model was then applied to Equation 1 and successfully predicted the drag force on a single stem under unidirectional flow (Equation 7):
This formulation simplifies the calculation of the drag force on flexible elements using a single CD = 1.95 for rigid cylinders (Vogel, 1994). Under this assumption, Paul et al. (2016) further validated Equation 7 for varying regular and irregular wave conditions. The model was subsequently extended to consider wave-induced motion (Luhar and Nepf, 2016) where leff was found to depend on Ca and the relative velocity between the stem and the oscillating water given by the ratio Rlw=hc/aB. The definition of Ca changes for the extended model where it is given by , where the subscript w represents the wave-extended model; CD is omitted due to its variation with the Keulegan-Carpenter Number (KC = uT/bv), which gives the ratio between drag and inertial forces under wave-induced flow. CD is then only applied within the calculation of the modeled force (Equation 7) and is given by CD,w=max(10KC−1/3,1.95) (Luhar and Nepf, 2016). Recalling that u = umax, the reconfigured height based on maximum forces caused by wave-induced flow is then given by:
with a = 1.05 ± 0.12 and b = −0.03 ± 0.08 for CawRlw ≤ 1 and a = 0.65 ± 0.07 and b = −0.22 ± 0.02 for 1 < CawRlw < 4000. The inertial portion present in the right term of equation 20 in Luhar and Nepf (2016) can be neglected as at umax the acceleration is equal to zero and leff,w can be used in Equation 7 with CD,w to obtain the modeled maximum forces under waves. Note that Equation 8 shows that the effective length is not dependent on CawRlw for CawRlw ≤ 1, which marks the limit at which the blade behaves like a rigid stem and the effective length approaches hc. Lei and Nepf (2019a) expanded this model for a broader range of conditions, obtaining a = 0.94 ± 0.06 and b = −0.25 ± 0.02 for 0.3 < CawRlw < 20000. Other dimensionless parameters have been introduced in recent literature, e.g., Jacobsen et al. (2019) compares the dimensionless ratio CaRlw(KC–1) with CaRlw and the typical hydrodynamic parameters KC and the Reynolds number Re. Here, we focus on the stem-induced drag force which is a function of the material properties. As such, we further focus on CaRlw and the resulting leff to characterize drag. Note that previously Ca has been defined differently for unidirectional flow, pure wave and combined waves and currents. While several studies define Ca as Caw mentioned above for pure wave conditions (Luhar and Nepf, 2016; Lei and Nepf, 2019a; van Veelen et al., 2021), Lei and Nepf (2019b) showed that Ca given in Equation 6 is suitable for long waves (Rlw≪1) as well as combined waves and currents.
Anchor Forces
The forces occurring at the anchors will depend on: (a) the size of the mat and corresponding skin friction represented by the bed shear stress (Equation 3), (b) the drag induced by the ASG (Equation 7), and (c) the number of anchoring points per surface area. The latter aspect translates into a corresponding area which depends on the size of the mat. Here, we hypothesize that the force at the anchor of an ASG mat can be expressed as the sum of ASG and mat drag forces based on the characteristic area corresponding to the anchor (Equation 9).
with N the shoot density per unit area. The subscript ap stands for “anchor position” which can be either f for frontal or r for rear anchor. Based on site-specific conditions (water depth, wave height and period, and the sediment composition) the expected maximum horizontal orbital velocity over the bed and τb,w (Equation 3) can be calculated. Finally, an estimation of the characteristic area for each anchor Aap (discussed in section “Data Analysis”) can provide the expected drag force on the anchors using Equation 9.
Experimental Methods
Laboratory experiments were carried out in the WKS (Schneiderberg Wave Flume) at Ludwig-Franzius-Institute in Hanover, Germany. The WKS is a 110-m long, 2.2-m wide, and 2-m deep wave flume equipped with a vertical paddle-type electric wave maker. The maximum paddle stroke is 1.8 m and its maximum wave height generation 0.5 m. A 10.5-m-long, 10-cm-deep sand bed beginning 62.65 m away from the wave paddle (in idle position) was built (Figure 1). The sand consisted of a homogenously graded quartz sand of d50 = 0.19 mm, particle density 2.65 g cm–3 and bulk density 1.45 t m–3. The sand bed was preceded by a 1:30 ramp made of 2.7-cm-thick plywood panels and a smaller 1:10 ramp was built out of gravel on the far end. A stepped aluminum artificial beach covered with thick industrial foam at the end of the flume was in place in order to increase wave absorption and minimize reflection. Additional plywood panels were installed covering the concrete bed of the flume along the full span of the sand bed to facilitate the mounting of anchors (Figure 2). The panels plus the layer of sand meant that the sand bed surface was 12.7 cm above the concrete flume bed.
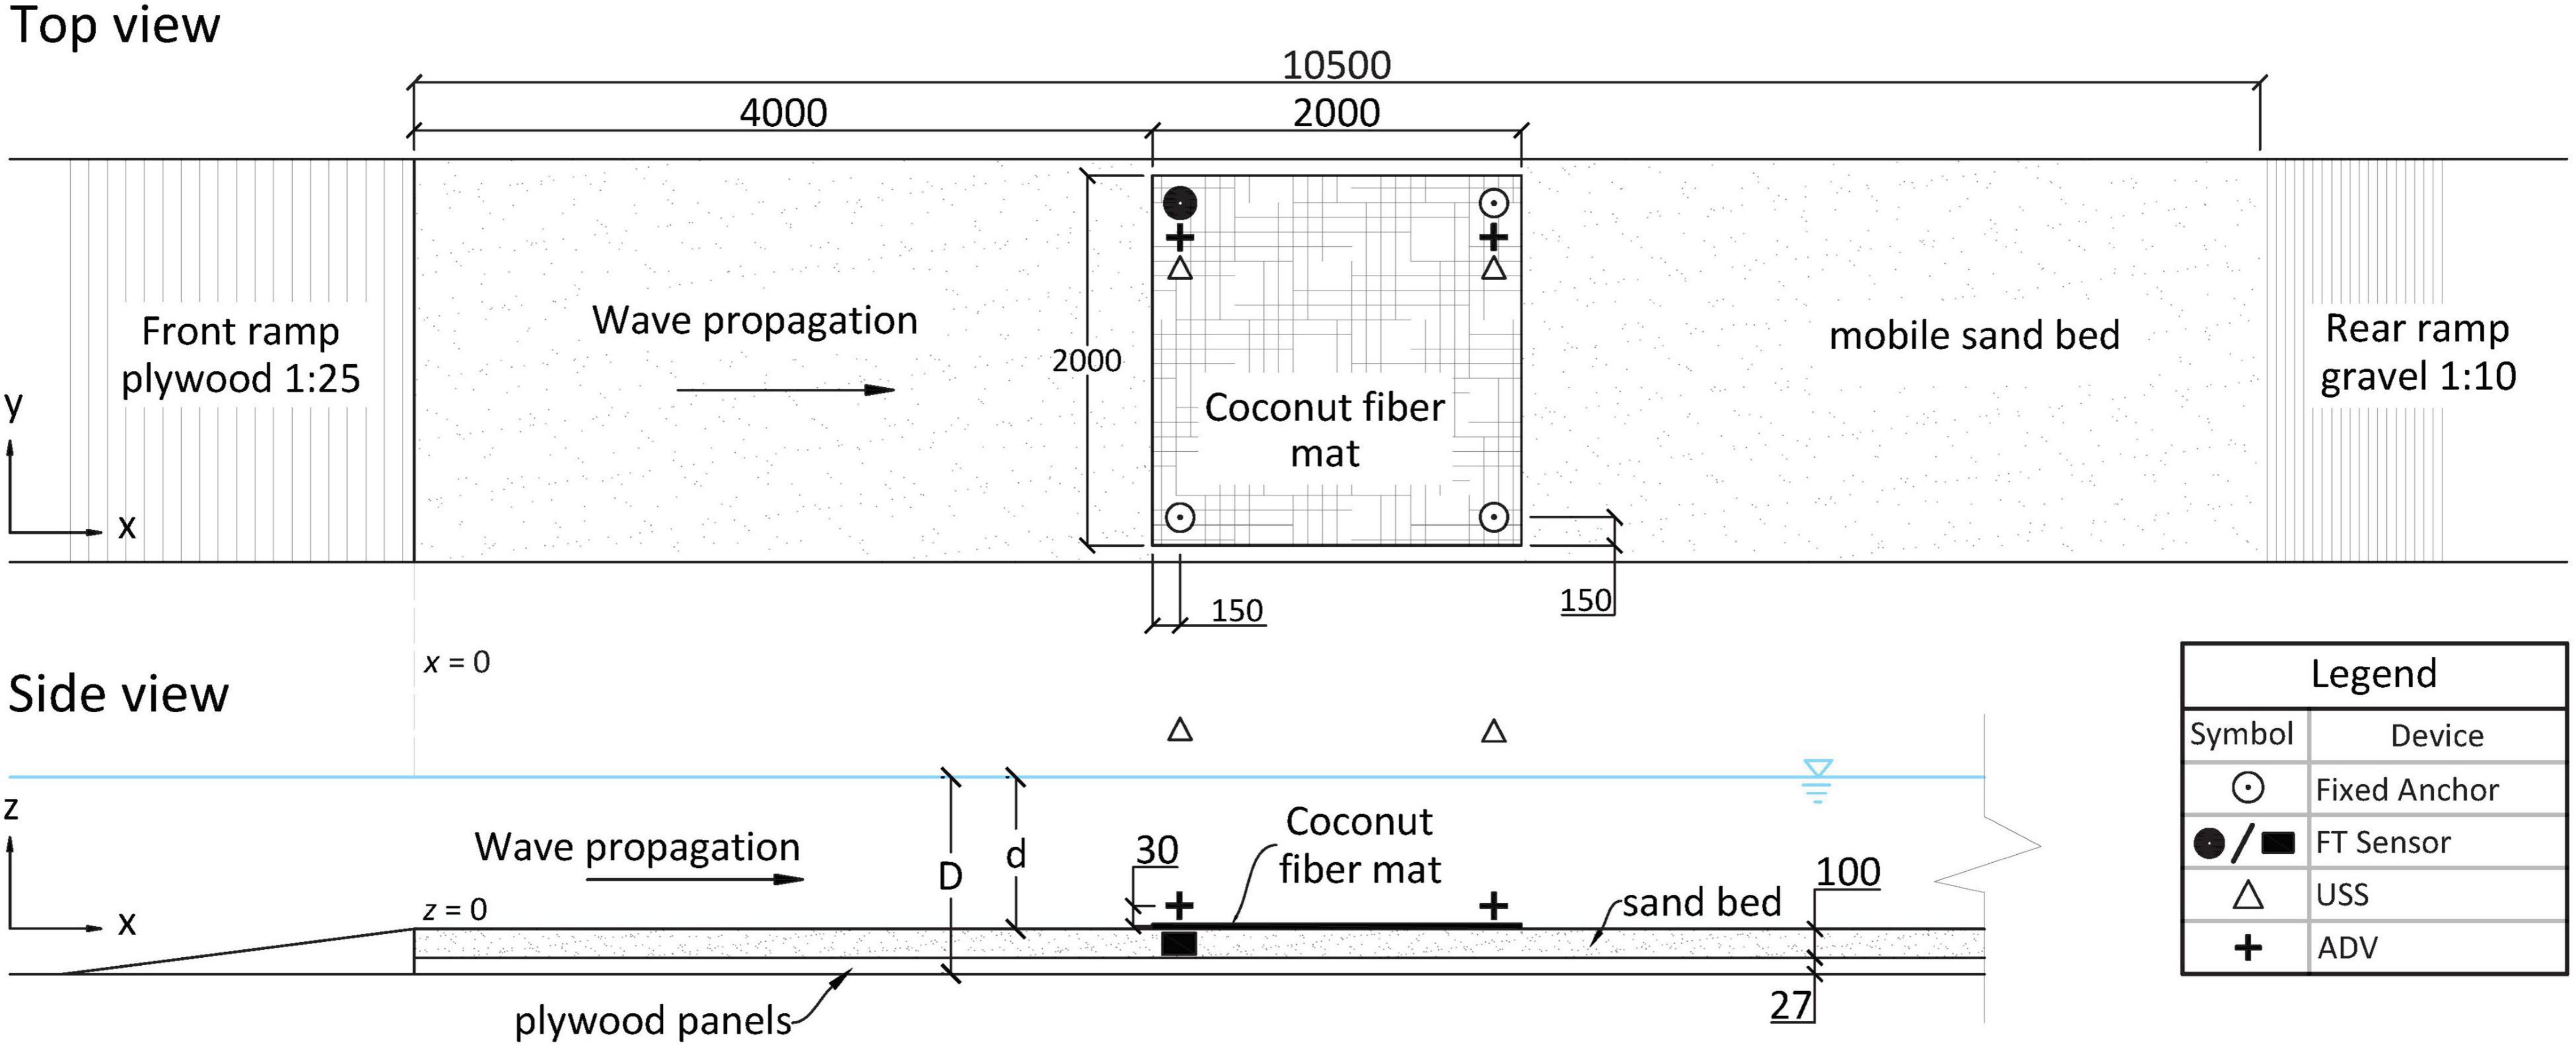
Figure 1. Top and side view of the experimental set-up section of the flume. The wave paddle is located at x = –62.65 m. x = 0 position shown by the gray dashed line joining both schemes. The experimental set-up shown corresponds to the coir mat experiments without artificial seagrass (for one anchor set-up, see section “Coir Mat Tests”). The z-scale is exaggerated; all dimensions are given in mm. d = water depth above the sand bed; D = water depth above flume floor.
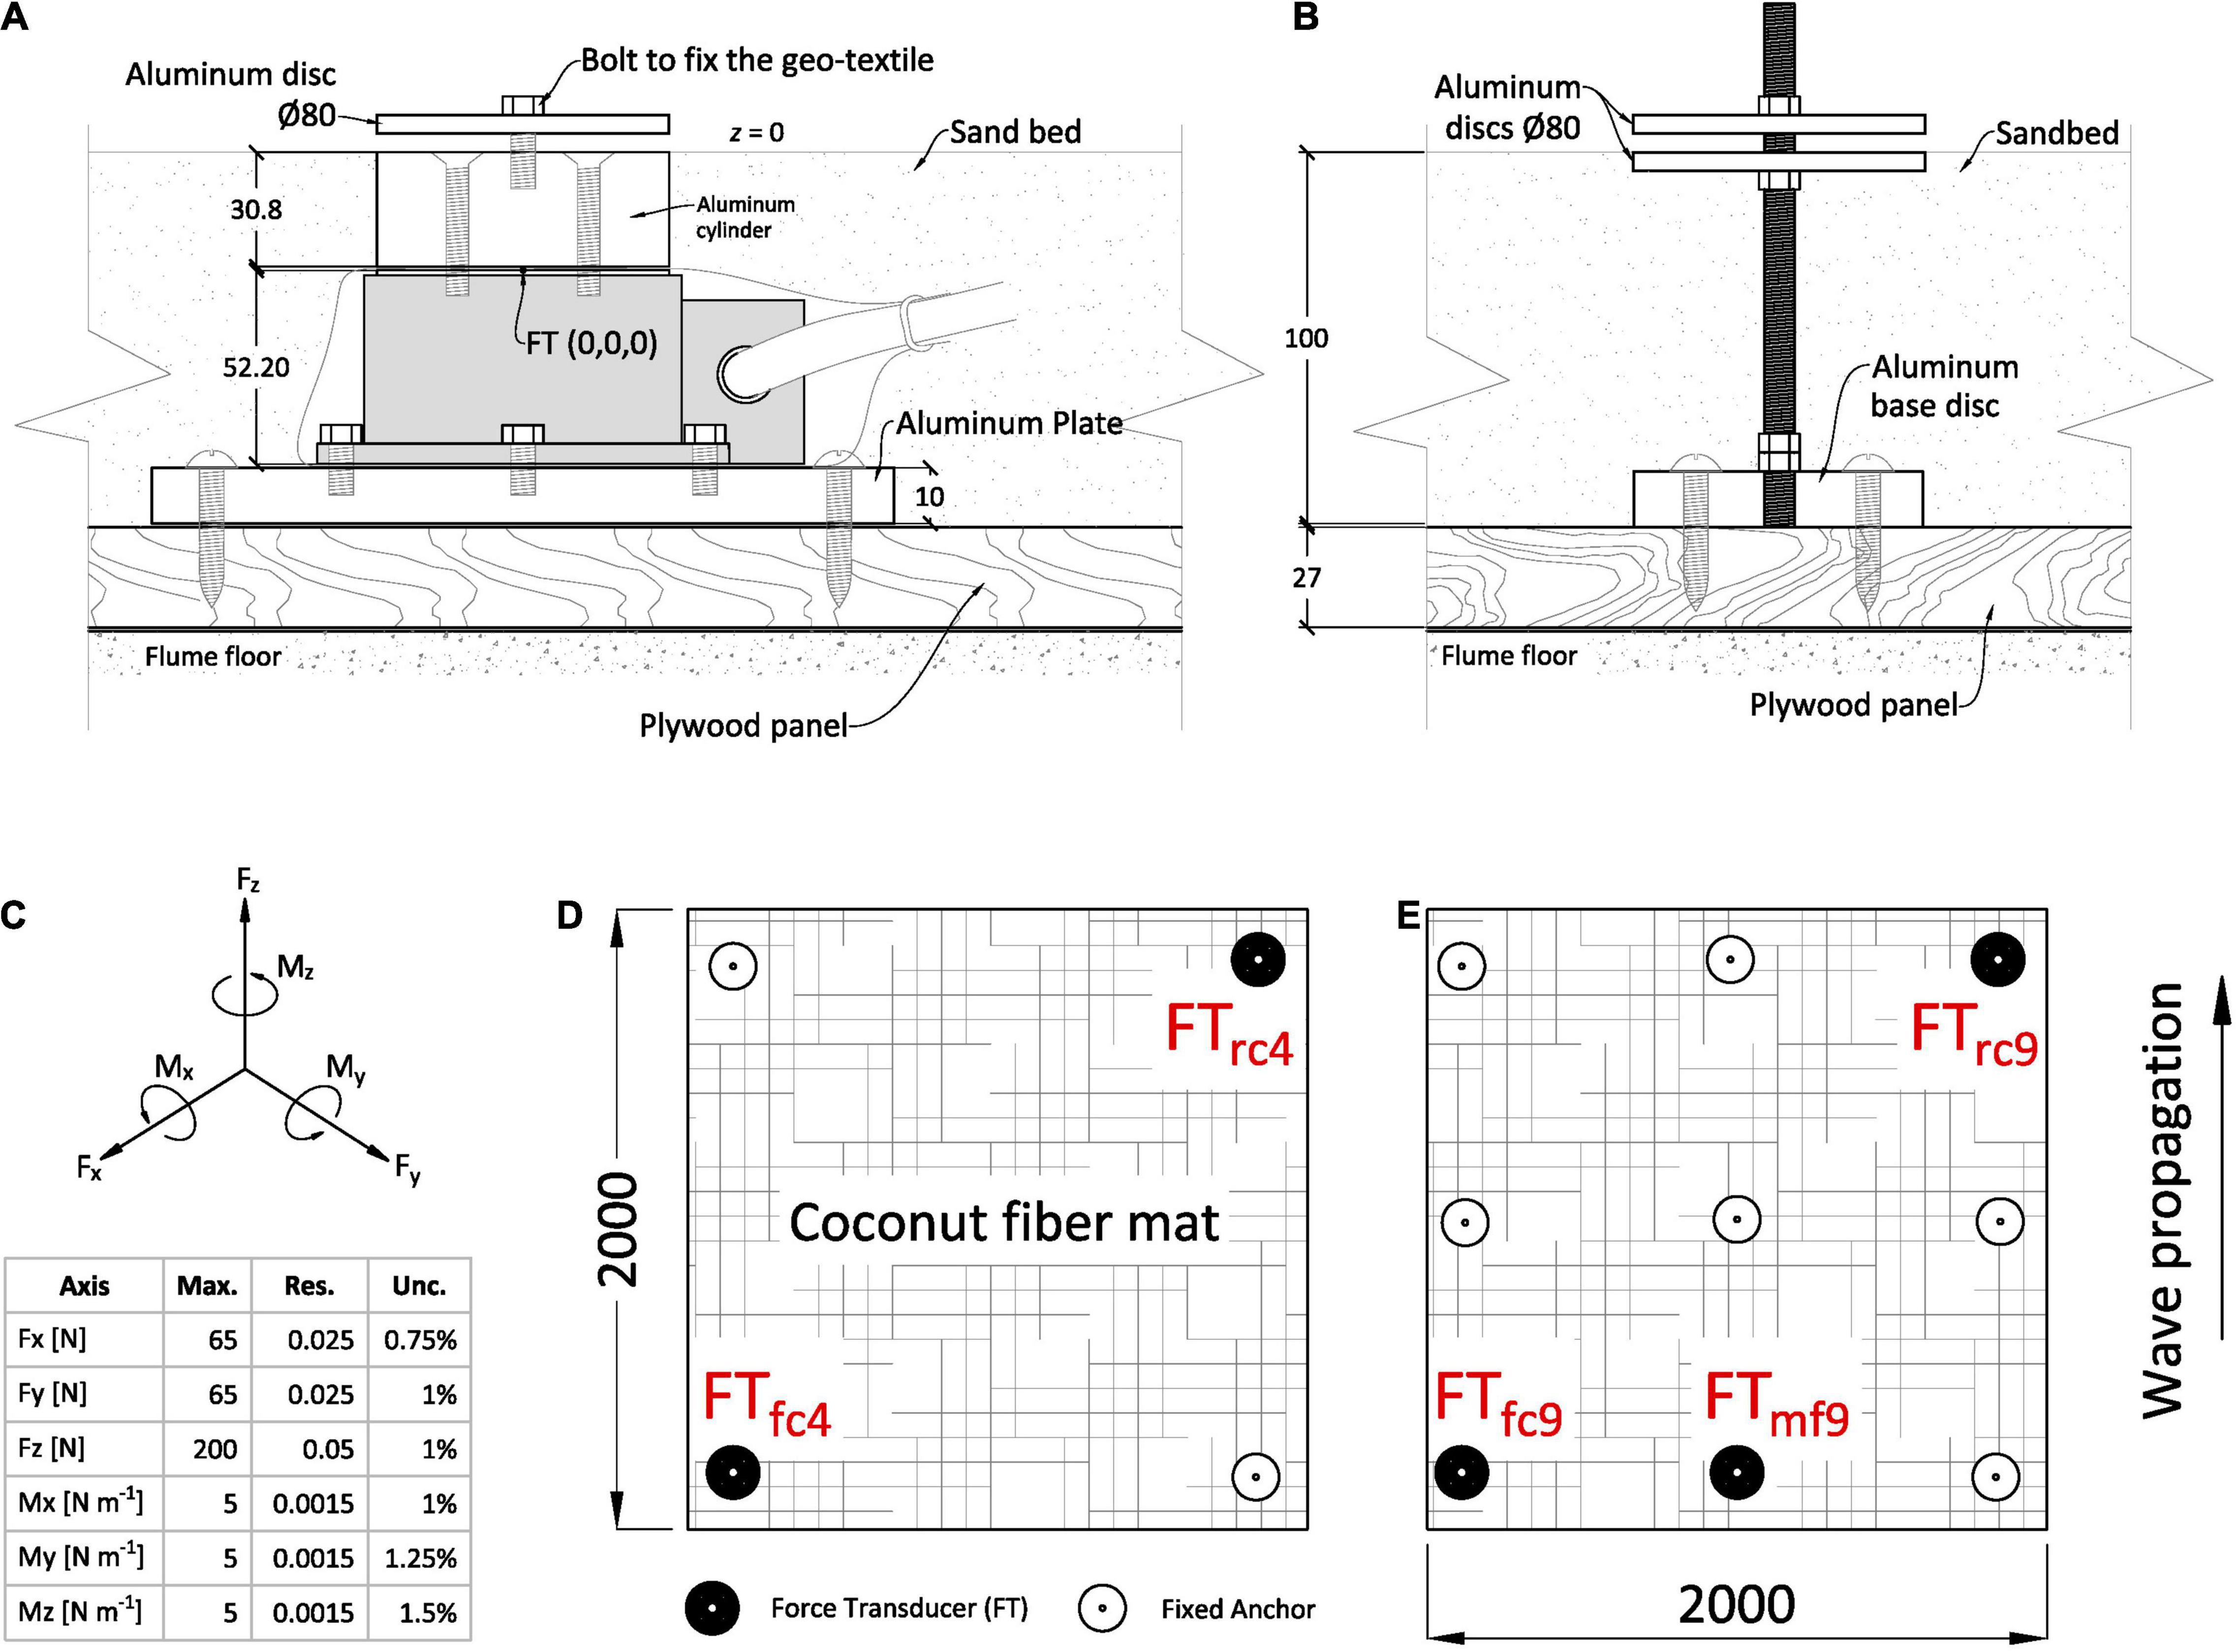
Figure 2. Anchor set-up and positions. (A) Force-Torque transducer (FT), shown in gray, and its mounting frame which includes a custom-made aluminum cylinder to make the transducer flush with the sand bed. (B) Fixed anchor construction. (C) Schematic of the 6 degrees of freedom (DOFs) of the FT measured at (0,0,0) shown in panel (A) and device specifications (Res = resolution; Max. = measuring range; Unc. = uncertainty given by manufacturer). The axes directions were set to match the coordinate system used in the flume. (D) 4-anchor mat configuration and position of the FT for measurements, respectively, tagged. (E) 9-anchor configuration (only used for the experiments without artificial vegetation) with the different FT positions. Subscripts in panels (D,E) denote the specific anchor position and set-up as follows: f and r stand for front and rear, c and m for corner and middle, and 4 and 9 for the number of anchors, respectively. Note that the indicated wave propagation direction for panels (D,E) is down to up. All dimensions are given in mm.
The experimental set-up was divided into two sets of experiments: (1) experiments with three different coir mats without ASG for the purpose of testing different coir mesh combinations – from now on denominated CM (section “Coir Mat Tests”); and (2) experiments with ASG using a coir mat as base layer to test the effect that the additional artificial vegetation has on anchor loading – from now on denominated AV (section “Mat Tests With Artificial Vegetation”). With regard to mat size and placement, sheltering and seagrass growth facilitation needed to be considered. The dense coir-ASG combination covered the sand bed in such way that actual seagrass could hardly grow within the mats. To circumvent this problem, a checkerboard-like configuration was envisioned (Carus et al., 2021), with alternating patches of ASG and bare sand, whereby shelter for growing seagrass is provided adjacent to the ASG and within the enclosed bare sand patches. A horizontally symmetrical patch of 2- by 2-m was chosen as prototype for testing the staggered configuration. All experiments were done at prototype scale so that scaling effects did not affect the results, while facilitating a transferability to field conditions. In all experiments, the mats were set, not buried, on the sand bed.
Although current loads may be high in tidal zones (Bouma et al., 2005), fully, perennially submerged areas are dominated by loads from orbital motion created by waves, whereby shallow, low-energetic (non-extreme wave loading and no wave breaking) areas are a reasonable choice for restoration projects (van Katwijk et al., 2016). We therefore aimed to produce nature-like conditions based on horizontal orbital velocities and investigated the load caused by near-bed velocities u < 40 cm s–1 (z = 3 cm, Figure 1) which would represent a threshold value for growing seedlings and seeds (Fonseca et al., 1983; Koch et al., 2010). The incident wave conditions (regular, non-breaking waves only) were chosen accordingly by previously calculating the expected horizontal orbital velocities at the bed following linear wave theory. The chosen wave periods ranged from 1.5 to 5 s and wave heights from 2 to 33 cm (Table 1), with 3 different depths for the AV series (section “Mat Tests With Artificial Vegetation”). The input conditions yielded theoretically calculated velocities ranging from 0.03 to 0.38 m s–1. The calculated velocities were only used during the experimental design phase, whereas for analysis, the measured velocities were used (section “Data Analysis”). Control measurements with no coir or ASG mat were done for all chosen incident wave conditions (CM and AV) and device positions (section “Instrumentation”) to directly assess the effect of the mats on anchor forces. For each experimental run (i.e., wave condition), sixty waves were generated employing a ramp time of 3 times the respective wave period. Throughout the experiments, the x, y and z-directions corresponded to the wave propagation direction, the horizontal cross section of the flume and the vertical direction, respectively, with x = 0 at the start of the sand bed and z = 0 at the sand bed surface (Figure 1).

Table 1. Input parameters (depth d, wave height H, and wave period T) for experiments with coir-based mats and no artificial vegetation (CM) and experiments with artificial seagrass (AV).
Instrumentation
To quantify the wave-induced forces on the anchoring points, we developed a sophisticated experimental set-up utilizing ATI Gamma IP68 Force/Torque transducers (FT) to measure the force acting on the anchors (see Figure 2 for device specifications). The FT were further calibrated with a manual force gauge (FMI-100B5) and known weights. Throughout this paper, the forces at the anchors are represented by F and the torques by M, with a subscript indicating the direction. A custom-made 30.8-mm-long aluminum cylinder was fixed to the top of the transducer to set the anchor proxy flush with the sand bed (z = 0, Figure 2A). The offset created by the cylinder acts on the torque measurement of the FT, which was then accounted for during data post-processing. Nuts and aluminum discs were used to make sure that the coir mats did not come out of their anchoring point and that the full load went to the anchors. The fixed anchors, i.e., those without an FT, consisted of threads fixed to solid aluminum discs screwed into the plywood floor and additional discs to entrap the mat flush with the sand bed (z = 0, Figure 2B).
Ultralab Ultrasonic Sensors (USS) with a resolution of 0.2 mm were used to measure the water level fluctuations η during the experiments and were installed over the sand bed. The position of the sensors varied depending on the set-up (sections “Coir Mat Tests” and “Mat Tests With Artificial Vegetation”). The USS and FT measured simultaneously through an HBM signal amplifier at a frequency of 100 Hz. Finally, wave orbital velocities were recorded simultaneously employing a trigger connected to the HBM and utilizing downward-looking Nortek Vectrino+ Acoustic Doppler Velocimeters (ADV) measuring at 25 Hz and 50 Hz for set-ups CM and AV, respectively. The u, v and w components of the measured velocities were respectively aligned with the x, y, and z components of the set-up.
Coir Mat Tests
Three different types of coconut fiber mats (product: Greenfix, manufactured by the Soiltec GmbH) with no ASG were tested (Figure 3 and Table 2): (1) CN700 – a coir netting; (2) Eromat Type 7H – a coir fiber-mesh mat (weak polypropylene, PP, reinforcement); and (3) Eromat type 75C – a coir fiber-mesh mat (strong high-density polyethylene, HDPE, reinforcement) usually used for turf reinforcement. Throughout the paper, the 3 mats are referenced by the number given above to identify specific mat experiments, e.g., CM1 corresponds to the coir netting (Figure 3A).
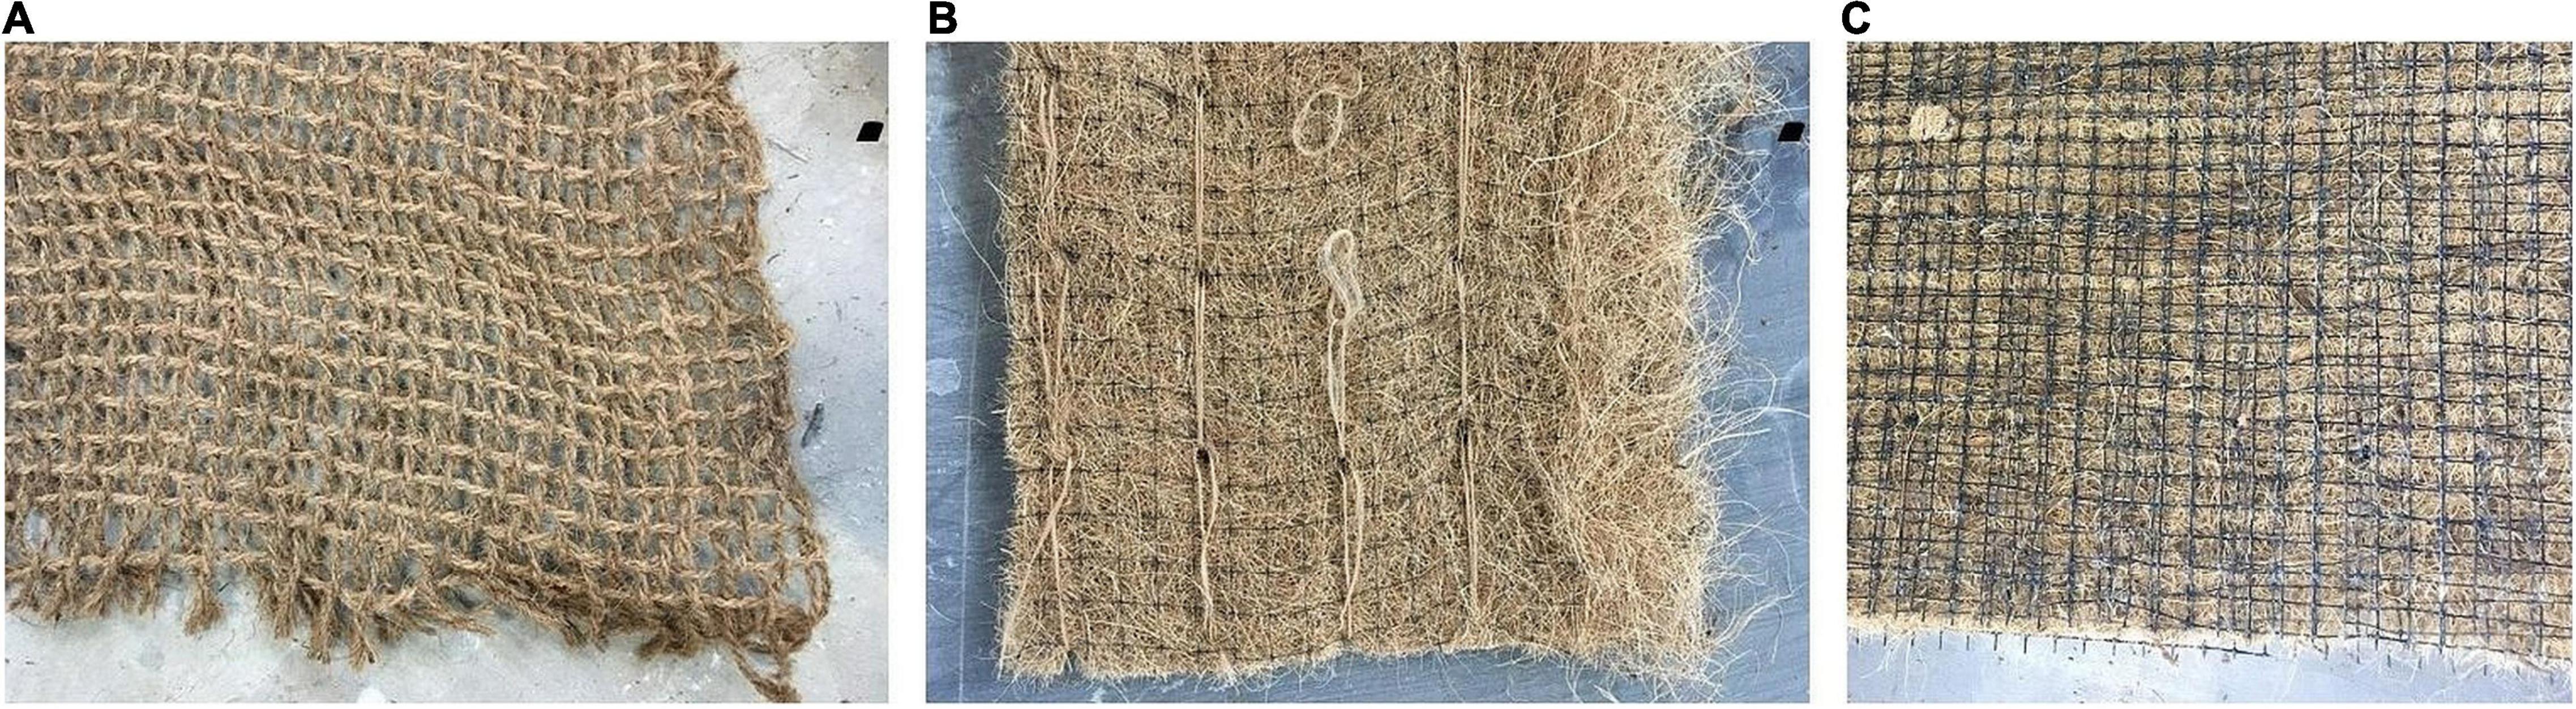
Figure 3. Coir mats from Greenfix used for testing without artificial seagrass. (A) CN700: Coir netting made of woven coir fiber (CM1), (B) Eromat 7H: Coir fiber encompassed by thin polypropylene (PP) (CM2). (C) Eromat 75C: Coir fiber encompassed by high-density polyethylene (HDPE) (CM3). An indication of size is given in Table 2.
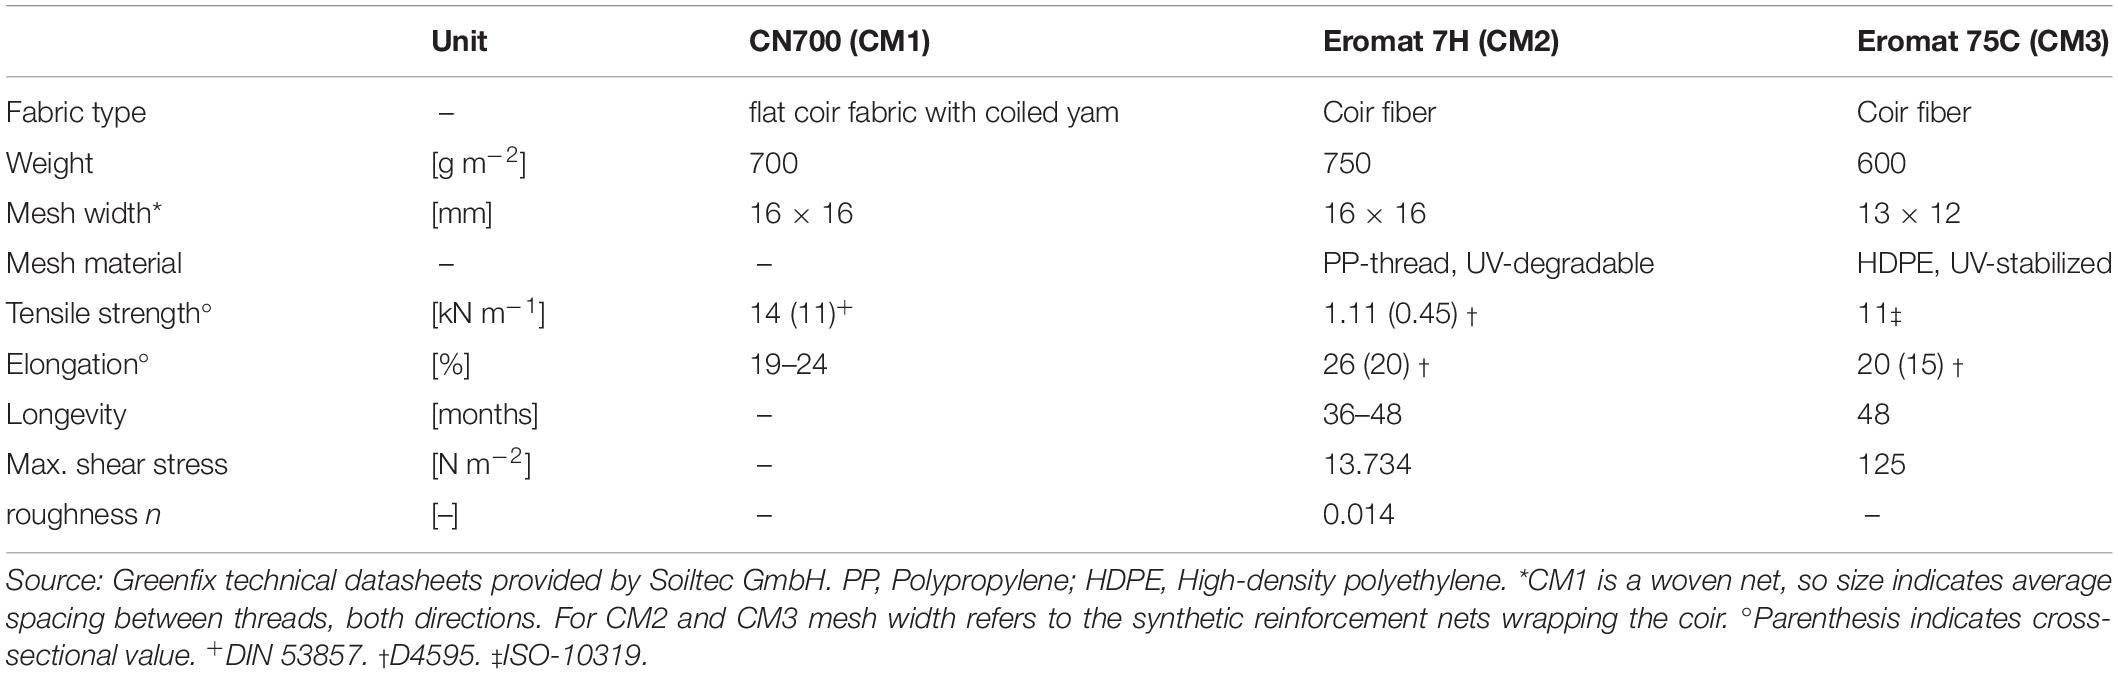
Table 2. Technical specifications of the coir mats used for the experiments.
To match the envisioned checkerboard-like configuration at prototype scale, mats with a dimension of 2 × 2 m were used, meaning they covered most of the width of the channel (10-cm spacing between mat edge and flume wall at each side). Two anchor set-ups were used (Figures 2D,E): (i) 4-Anchor set-up, one in each corner of the square mat; (ii) 9-Anchor set-up, distributed in a 3- by 3-knot setting. For this set of experiments, a single FT sensor was available which was placed in different positions consecutively (Figures 2D,E). Throughout this paper, the frontal anchors refer to those affected first by incident waves (FTfc4, FTfc9 and FTmf9, subscript f for front, c for corner and the digit denoting the number of anchors in the set-up) and rear anchors those affected afterwards (FTrc4 and FTrc9, subscript r for rear). Two ADVs and two USS were aligned in the y-direction with the FT, with the ADVs measuring at a height of z = 3 cm (Figure 1). The aluminum discs of the anchors created a reflection that affected the ADV measurements, so ADVs were not placed directly above the anchors. We tested each mat type and anchor configuration with 13 different incoming regular wave conditions under a constant water depth d = 0.5 m (Table 1); each of these runs (i.e., each wave condition) was performed 3 times, once for each mat type, and repeated 5 times, once for each anchor position. This resulted in a total of 208 test runs (including a set of control runs performed without coir mats).
Mat Tests With Artificial Vegetation
The artificial vegetation was made of cable straps of width bv = 4.8 mm, length of hc = 250 mm and thickness t = 1.36 mm (Figure 4B), composed of polyamide (PA, density ρPA = 1.13 g cm–3 and a flexural rigidity of EI = 800 N mm2, Taphorn et al., 2021). A density of N = 400 shoots m–2 was chosen, which results in a frontal area per canopy volume a = 1.92 m–1 (Nepf, 2011). The chosen shoot density and stem length is akin to those found in nature for strap-like seagrasses such as Zostera marina (e.g., Ondiviela et al., 2014). Albeit not biodegradable, PA was chosen based on target mechanical properties of ASG used for restoration, which may potentially be used in the field (Bouma et al., 2005). Taphorn et al. (2021) proved that under pure unidirectional flow (in absence of wave motion), a single-stem PA shoot, which was mechanically and geometrically identical to the one used in the present study, alters the incident velocity while displaying a flexible, plant-like motion. This motion is an essential parameter when studying structure-hydrodynamic interaction (Paul et al., 2016).
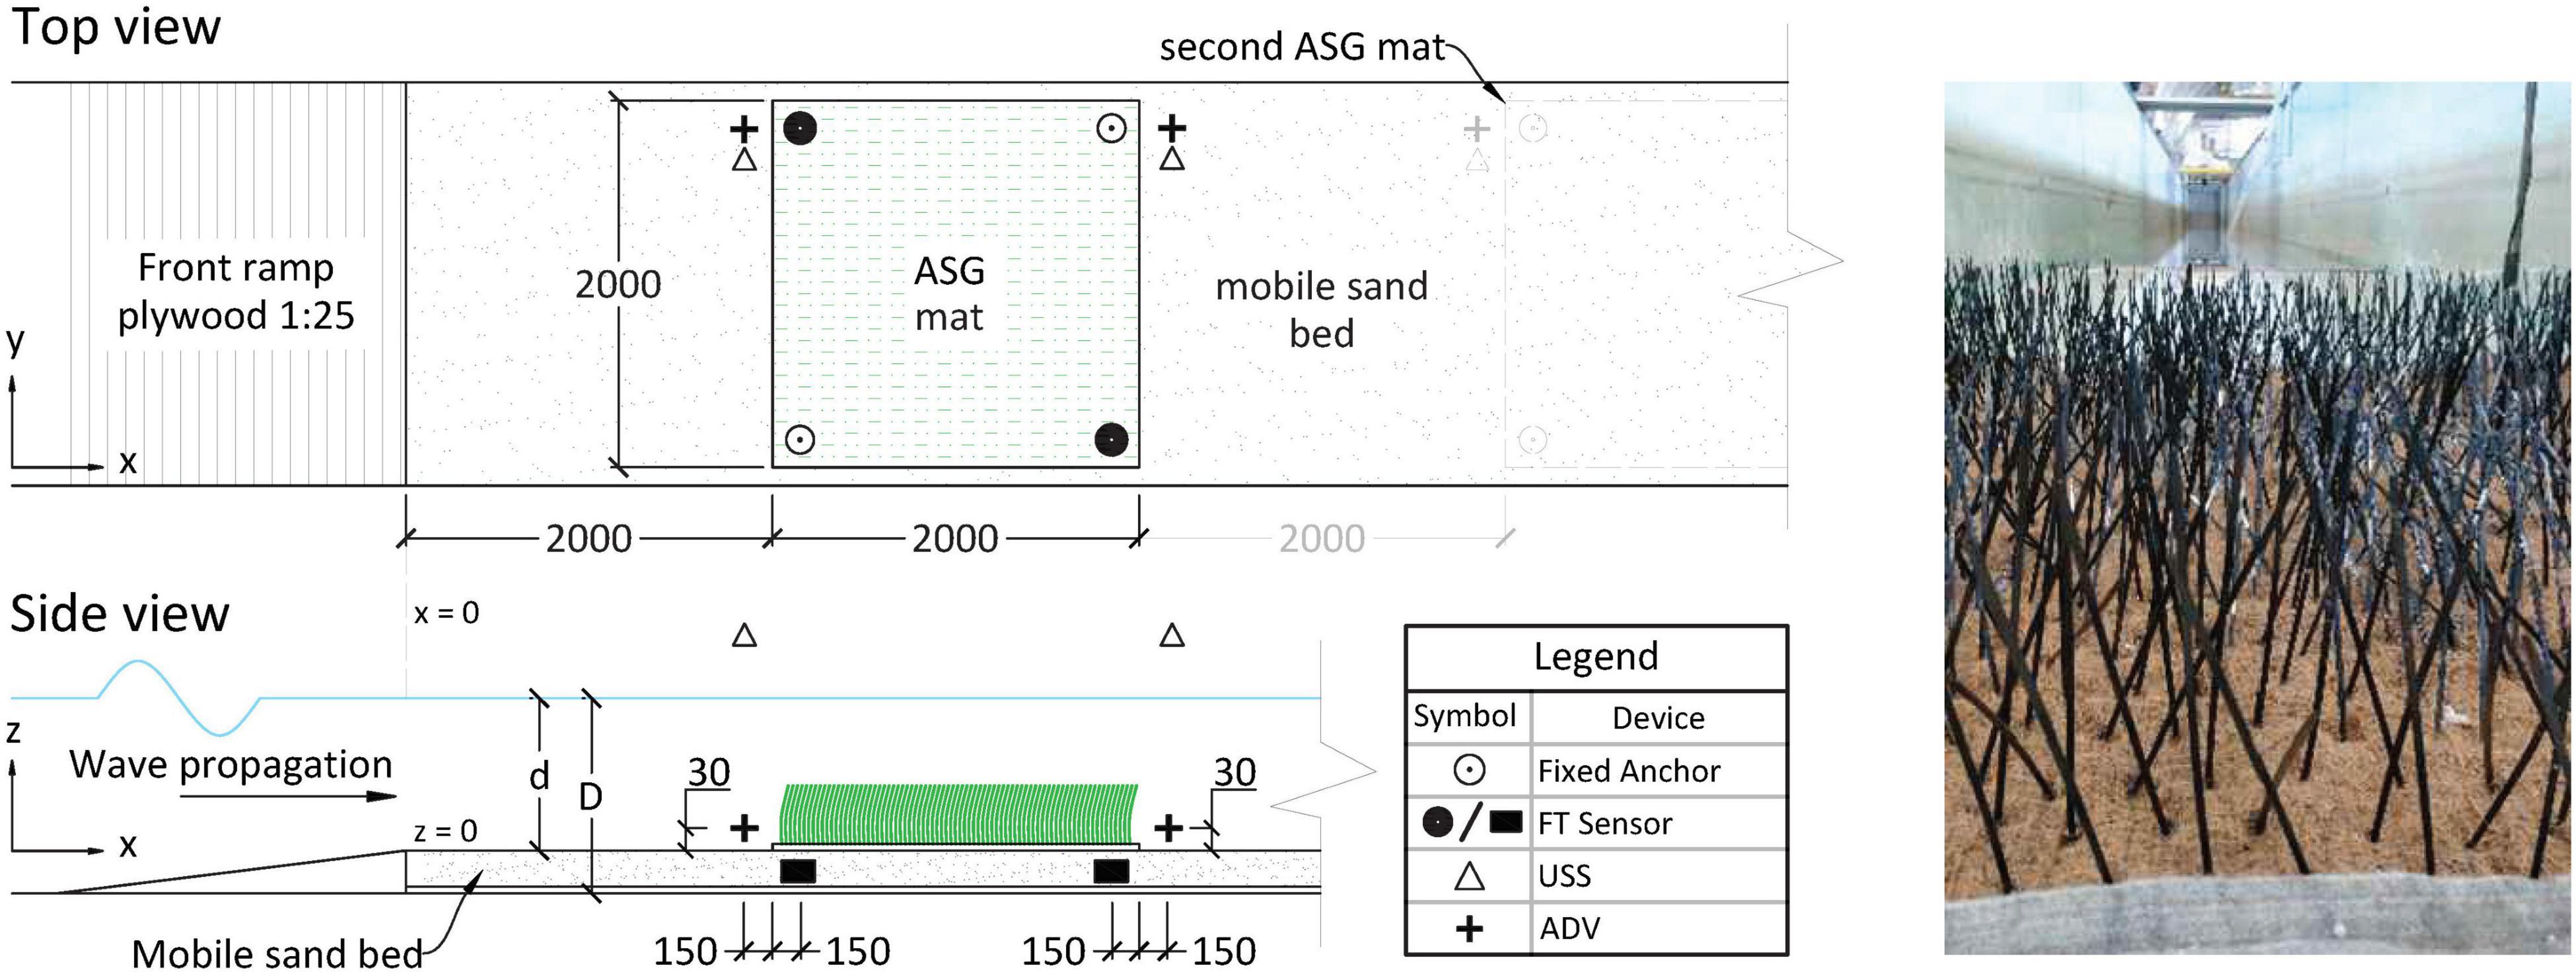
Figure 4. (A) Schematic of the experimental set-up for ASG coir mats (1-mat set-up, 2nd mat shown dimmed). z-scale is exaggerated; all dimensions given in mm. (B) Close-up image of an ASG mat in the flume.
The CM series revealed that, under wave loading, the coir meshes tend to be torn apart from within due to the oscillatory motion. The coir netting (CM1) displayed the best stability under wave loading, with threads basically intact after all runs. However, as PA is not positively buoyant, fixing the straps by tying them around the netting proved to be complicated even under laboratory conditions. Therefore, we produced a hybrid coir netting mesh by stacking the non-reinforced coir mesh (CM2) on top of the coir netting (CM1), the latter therefore serving as a kind of biodegradable reinforcement to the former. As the surface area remains unchanged and the contribution of the net proved to be minimal (section “Forces on Coir Mats”), we did not expect a major difference between the drag contribution of the AV mat (excluding vegetation) and CM mats, the former being just a combination of two of the latter. Finally, to avoid that neither the fiber within the mesh nor single threads of the netting came apart during testing, an industrial sewing machine was used to seal the edges with a thin synthetic fabric; this proved to be highly effective as the mats had suffered no discernible damage by the end of the experiments and moreover seems practical under real conditions in the field.
The AV series was likewise done in prototype scale utilizing 2- by 2-m mats (Figure 4), where we tested the effects of having (a) one ASG mat and (b) two ASG mats with a bare sand bed gap of 2 m between them. The AV tests were done exclusively for the 4-anchor configuration. In addition, three different submergence ratios (hc/d) were used, each with four varying wave conditions in order to meet the target horizontal orbital velocities above the bed (Table 1). Due to blade motion, the ADV sensors could not be placed within the mat. Therefore, orbital velocity profiles were measured around the mat(s) by deploying ADVs located 15 cm in front of and behind each mat aligned in x with the FT sensors (Figure 4A). The sensors were vertically displaced to measure at z = {3, 10, 25, 35, 45} cm (with the last height only possible for the two higher d used). The analysis of the velocity structure around the ASG and the gradual wave height decay in reference to propagation distance over the ASG mats is outside the scope of the present study and is thus not further discussed here; nonetheless, the velocity profile measurements meant that each run was repeated 4–5 times (depending on the water depth) thus yielding the corresponding number of repetitions for the AV force measurements. Previous research regarding wave-induced flow within and around seagrass meadows have decomposed flow into a mean current, mean oscillatory flow and the turbulent components (e.g., Luhar et al., 2010); here, however, we focus on measured bulk incident velocity affecting the anchors and refer to this as the orbital velocity within the entire paper.
For AV, two FT were available (Figure 4) which allowed to simultaneously measure the induced forces at the frontal and rear anchors of propagating waves for all runs (FTfc4 and FTrc4 simultaneously, as depicted in Figure 2D). USS vertically aligned with the ADVs provided wave height measurements. For each test case, the experiments were thereafter repeated according to the number of mats and ADV vertical positions, including control measurements, resulting in a total of 168 runs with the conditions shown for AV in Table 1.
Data Analysis
All recorded data were processed utilizing MATLAB (Version R2020a). Water level fluctuations at the leading edge of the mat (or of the first mat for the 2-mat set-up) were extracted from the USS data. Autocorrelation was then used to calculate the period of the incoming waves (T) by determining the time-lag between correlation peaks, which was then compared with the calculated T for control; the former did not deviate from the latter by more than 0.02 s, so we further used the measured T for all corresponding calculations. 50 waves were then extracted from each of the time series produced by each Instrument. The USS and FT data were zeroed before each measurement and afterwards detrended during post-processing to make sure only the fluctuations caused by wave propagation were considered. Non-linearity could be observed within the incident waves, especially for T > 3 s, which results in analogous non-linear measurements from the FT and ADV measurements. Within this study, we focus on the measured incident velocity and corresponding measured forces, using the measured values in all calculation. Hence, these non-linearities are not discussed in detail.
The output of the FT measurements corresponds to the shear forces in x and y, the lift force in z and the corresponding torques at the measuring point of the device (or point [0,0,0] in Figures 2A,C). The offset between measuring point of FT ([0,0,0] in Figure 2) and acting forces caused by the buried position of the sensor was corrected during post-processing. The lift force Fz could be directly taken from the measurements while the forces in x and y were a function of the torque in y and x, respectively. Thus, for the forces directly at the anchor, Fx,M = My/la and Fy,M = Mx/la, where la is the lever arm and the subscript M depicts the forces calculated from the torque measurements. In order to derive the impact of the ASG mats on the anchor forces in all relevant directions, we subsequently subtracted the maximum measured forces of each run from the respective maximum measured control measurement; e.g., Fx,max = Fx,max,M(run i) – Fx,max,cl(run i), where the subscript cl stands for the control measurement and the input variables are a function of the specific wave conditions.
A preliminary analysis of the forces occurring at the anchors revealed that the lift forces (Fz) were smaller in magnitude than the horizontal forces. In addition, the cross-sectional force Fy was not negligible, indicating that, although particle motion is 2-dimensional, the forces at the anchors were 3-dimensional. This is because the anchors, located at the corners of the mats, experience forces directed towards the center of the mat as bed shear stress acts across its whole surface, i.e., in the x-y plane (Figure 5). Here, we describe this horizontal force at the anchors through the resultant horizontal force, calculated from both relevant components (Equation 10) for each run for the complete time series, thus yielding a new time series of the resulting forces on the anchor. Finally, we calculated the respective direction of the resultant force in radians using the four-quadrant inverse tangent.
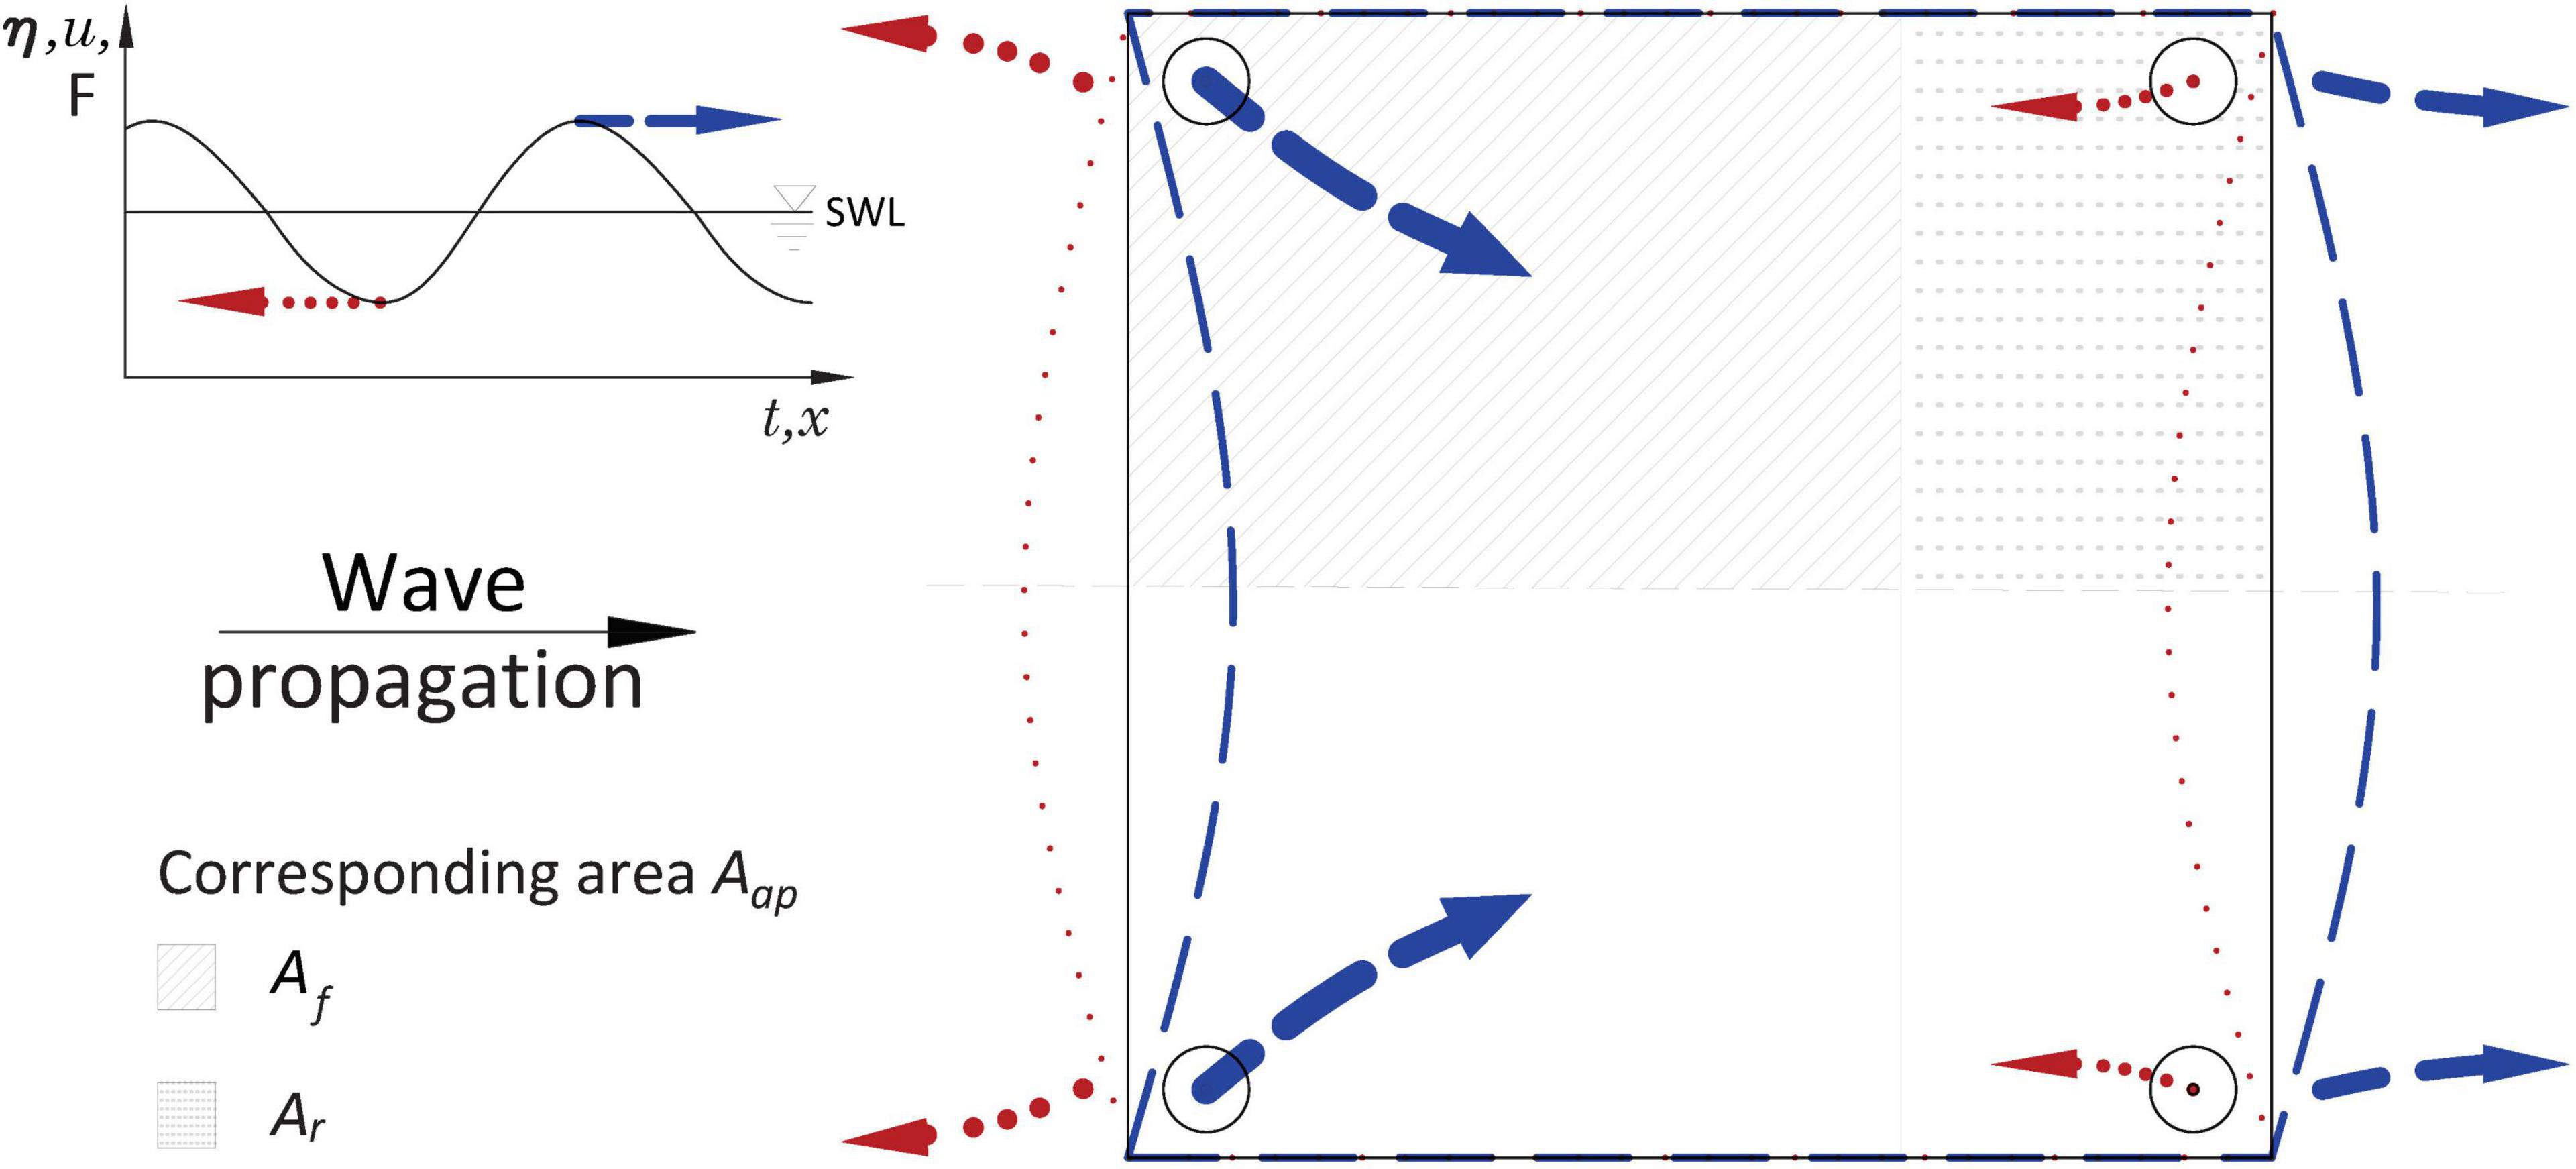
Figure 5. Qualitative scheme of the predominant directions of the resultant forces in direction of wave propagation (blue dashed line) and in opposite direction (red dotted line) for the 4-anchor configuration and respective (exaggerated) deformation of the mat with the corresponding area for each anchor (Aap) for the direction of wave propagation. The solid gray line denotes the original mat position. SWL = Still Water Level.
The ADV data were first curated by removing measurements not complying with threshold values of 15 dB for beam signal-to-noise ratio (SNR) and 70% for correlation (Sulaiman et al., 2013). The acceleration threshold method (Goring and Nikora, 2002) was then used to de-spike the data. The orbital velocity data presented here correspond to the measurements at z = 3 cm. Similarly, both ADV and FT data were filtered utilizing a 4th-order zero-phase digital filter in order to avoid peaks and outliers. After filtering, we calculated the average maxima and minima for all 50 waves within all data – i.e., water levels, horizontal and vertical orbital velocities and all directions of forces and torques – through time-synchronous signal averaging (TSA). TSA provides a phase-average of all waves as a function of sampling frequency and wave period. Here, the maxima and minima corresponding to each run are represented by the maxima and minima of the resulting phase-averaged wave.
Modeled Forces
The expected forces on the anchors of an ASG mat were calculated for the AV series based on the wave-induced bed shear stress τb,w and the stem drag force Fv (Equations 3, 7, respectively). The measured incident velocity (umax,f) and calculated T were used to calculate aB and KC. ks was calculated from manning’s n given for the top mat (CM2, Table 2) using the relation n ≈ ks1/6/26 (Marriott and Jayaratne, 2010) to then calculate z0 and the friction factor fw utilizing Equation 2. B and Ca were calculated from the ASG mechanical and geometric properties and the measured maximum horizontal orbital velocities in the direction of wave propagation in front of the preceding mat (umax,f). The chosen ASG is negatively buoyant with no marked effect on the drag force as the restoring forces due to stiffness certainly dominate, thus approaching a zero-buoyancy case (Luhar and Nepf, 2011) with |B| = 0.16. For the wave-induced model (using Equations 7, 8), the calculated modeled forces did not differ significantly when using either Ca or Caw (R2 = 0.99 and RMSE = 0.15 after linear regression); Equation 6 was thence further used for all calculations of Ca, yielding values ranging from 0.13 to 24.9 for the range of measured umax,f. For comparison, the range of Ca of seagrasses can range from 0.16 for stiffer species up to 80000 for highly flexible ones (see Table 1 in Lei and Nepf (2019a) and references therein for further details on seagrass parameters). Furthermore, the measurements yielded the following ranges for the nondimensional hydraulic parameters: 40 ≤ KC < 400; 1.95 ≤ CD ≤ 2.95; 0.66 < Rlw < 8.45; and 1.1 ≤ CaRlw < 24.5 (Table 1).
The modeled forces were calculated after both the approach under unidirectional flow proposed by Luhar and Nepf (2011), validated for waves by Paul et al. (2016), and the extended approach for wave-induced forces proposed by Luhar and Nepf (2016), including the further extension by Lei and Nepf (2019a) for a comparison of wave-based models. The application of both current-based and wave-based models was done to test the feasibility of using a flow-only based model against the wave extension models when calculating anchor forces on a vegetated ASG mat. The flow-only model is easily applicable when only near-bed flow data is available for a specific site, whereas the wave extensions require knowledge of the governing sea state. For all models, Ca was then given by Equation 6, while CD = 1.95 for the unidirectional flow model and is a function of KC for the wave-induced force model (see section “Anchor Forces”). The corresponding effective length, leff, was then calculated from Equations 4, 8 and used in Equation 9 to calculate the forces at each anchor.
For the characteristic area Aap, symmetry along the y-axis about the mid-flume (x-z plane) was assumed so that only one frontal and one rear anchor were further analyzed (Figure 5). The force measurements for all test cases were then separated into frontal and rear anchor forces. Similarly, Aap was partitioned into a frontal (Af) and rear (Ar) portion. Following a proportional relation between the force and the square of orbital velocity (F∼u2), a simple quadratic fitting approach (y = αx2) was tailored to capture this dependency by means of fitting the resulting Fx vs. umax plots for the frontal and rear anchor forces based on the frontal incident velocity, i.e., umax in front of the mat. The ratio of the fitted coefficients (α) was then taken as the relation between frontal and rear anchor forces. For simplicity, the ratio of forces was assumed analogous to the ratio of the corresponding length per unit width, i.e., αf/αr = lmat,f/lmat,r = rα, where lmat is the length of the mat (x-direction) and is given by lmat = lmat,f + lmat,r. Finally, for our case using a mat of 2 m width, the equivalent area for the anchors on either side of the mat results in Af = lmat,f and Ar = lmat,r for the frontal and rear anchors, respectively. Af can then be calculated as shown in Equation 11, after which Ar = lmat – lmat,f.
Results
The control measurements showed that, for the range of velocities tested here, the horizontal forces at the anchors alone (no mat attached) were rather low (Fx < 0.15 N for velocities up to 30 cm s–1). Results showing the resultant forces thus show the full measured force, i.e., no subtraction of the force measured from the control measurements. To compare measured anchor forces with modeled forces directly, the forces obtained from the control measurements were subtracted from the measured forces to obtain only the effect of the ASG and the coir mat.
Force Components
The velocity measurements for the AV series showed a minor difference in maximum measured horizontal velocities (umax) between the direction of wave propagation (+x) and the opposite direction (-x), the former being 10 ± 3% higher than the latter across all measurements. This indicates a nonlinearity within the propagating waves where the maximum horizontal velocity at the crest is higher, but shorter in duration, than that at the trough and translates directly to the forces on the anchors (histograms in Figure 6). The force measurements exhibited differences in maximum forces for both directions depending on the anchor position. The +x forces were 2–2.4 times higher than -x forces at frontal anchors for CM, and about 1.67 times for AV. The rear anchor forces of CM tended to the opposite behavior with -x forces slightly higher (1.05–1.15 times) than +x, whereas for AV rear anchors, the +x force persisted as the dominant force showing symmetry to the front anchors (1.69 times the -x forces). This ratio, however, lowered to 1.21 for the 2-mat configuration, suggesting an interaction between both ASG mats (see section “Forces on Artificial Seagrass Mats”). Given the predominantly higher maximum velocities and forces measured in the direction of wave propagation, all further comparisons using Fx and umax refer to the +x direction unless otherwise indicated.
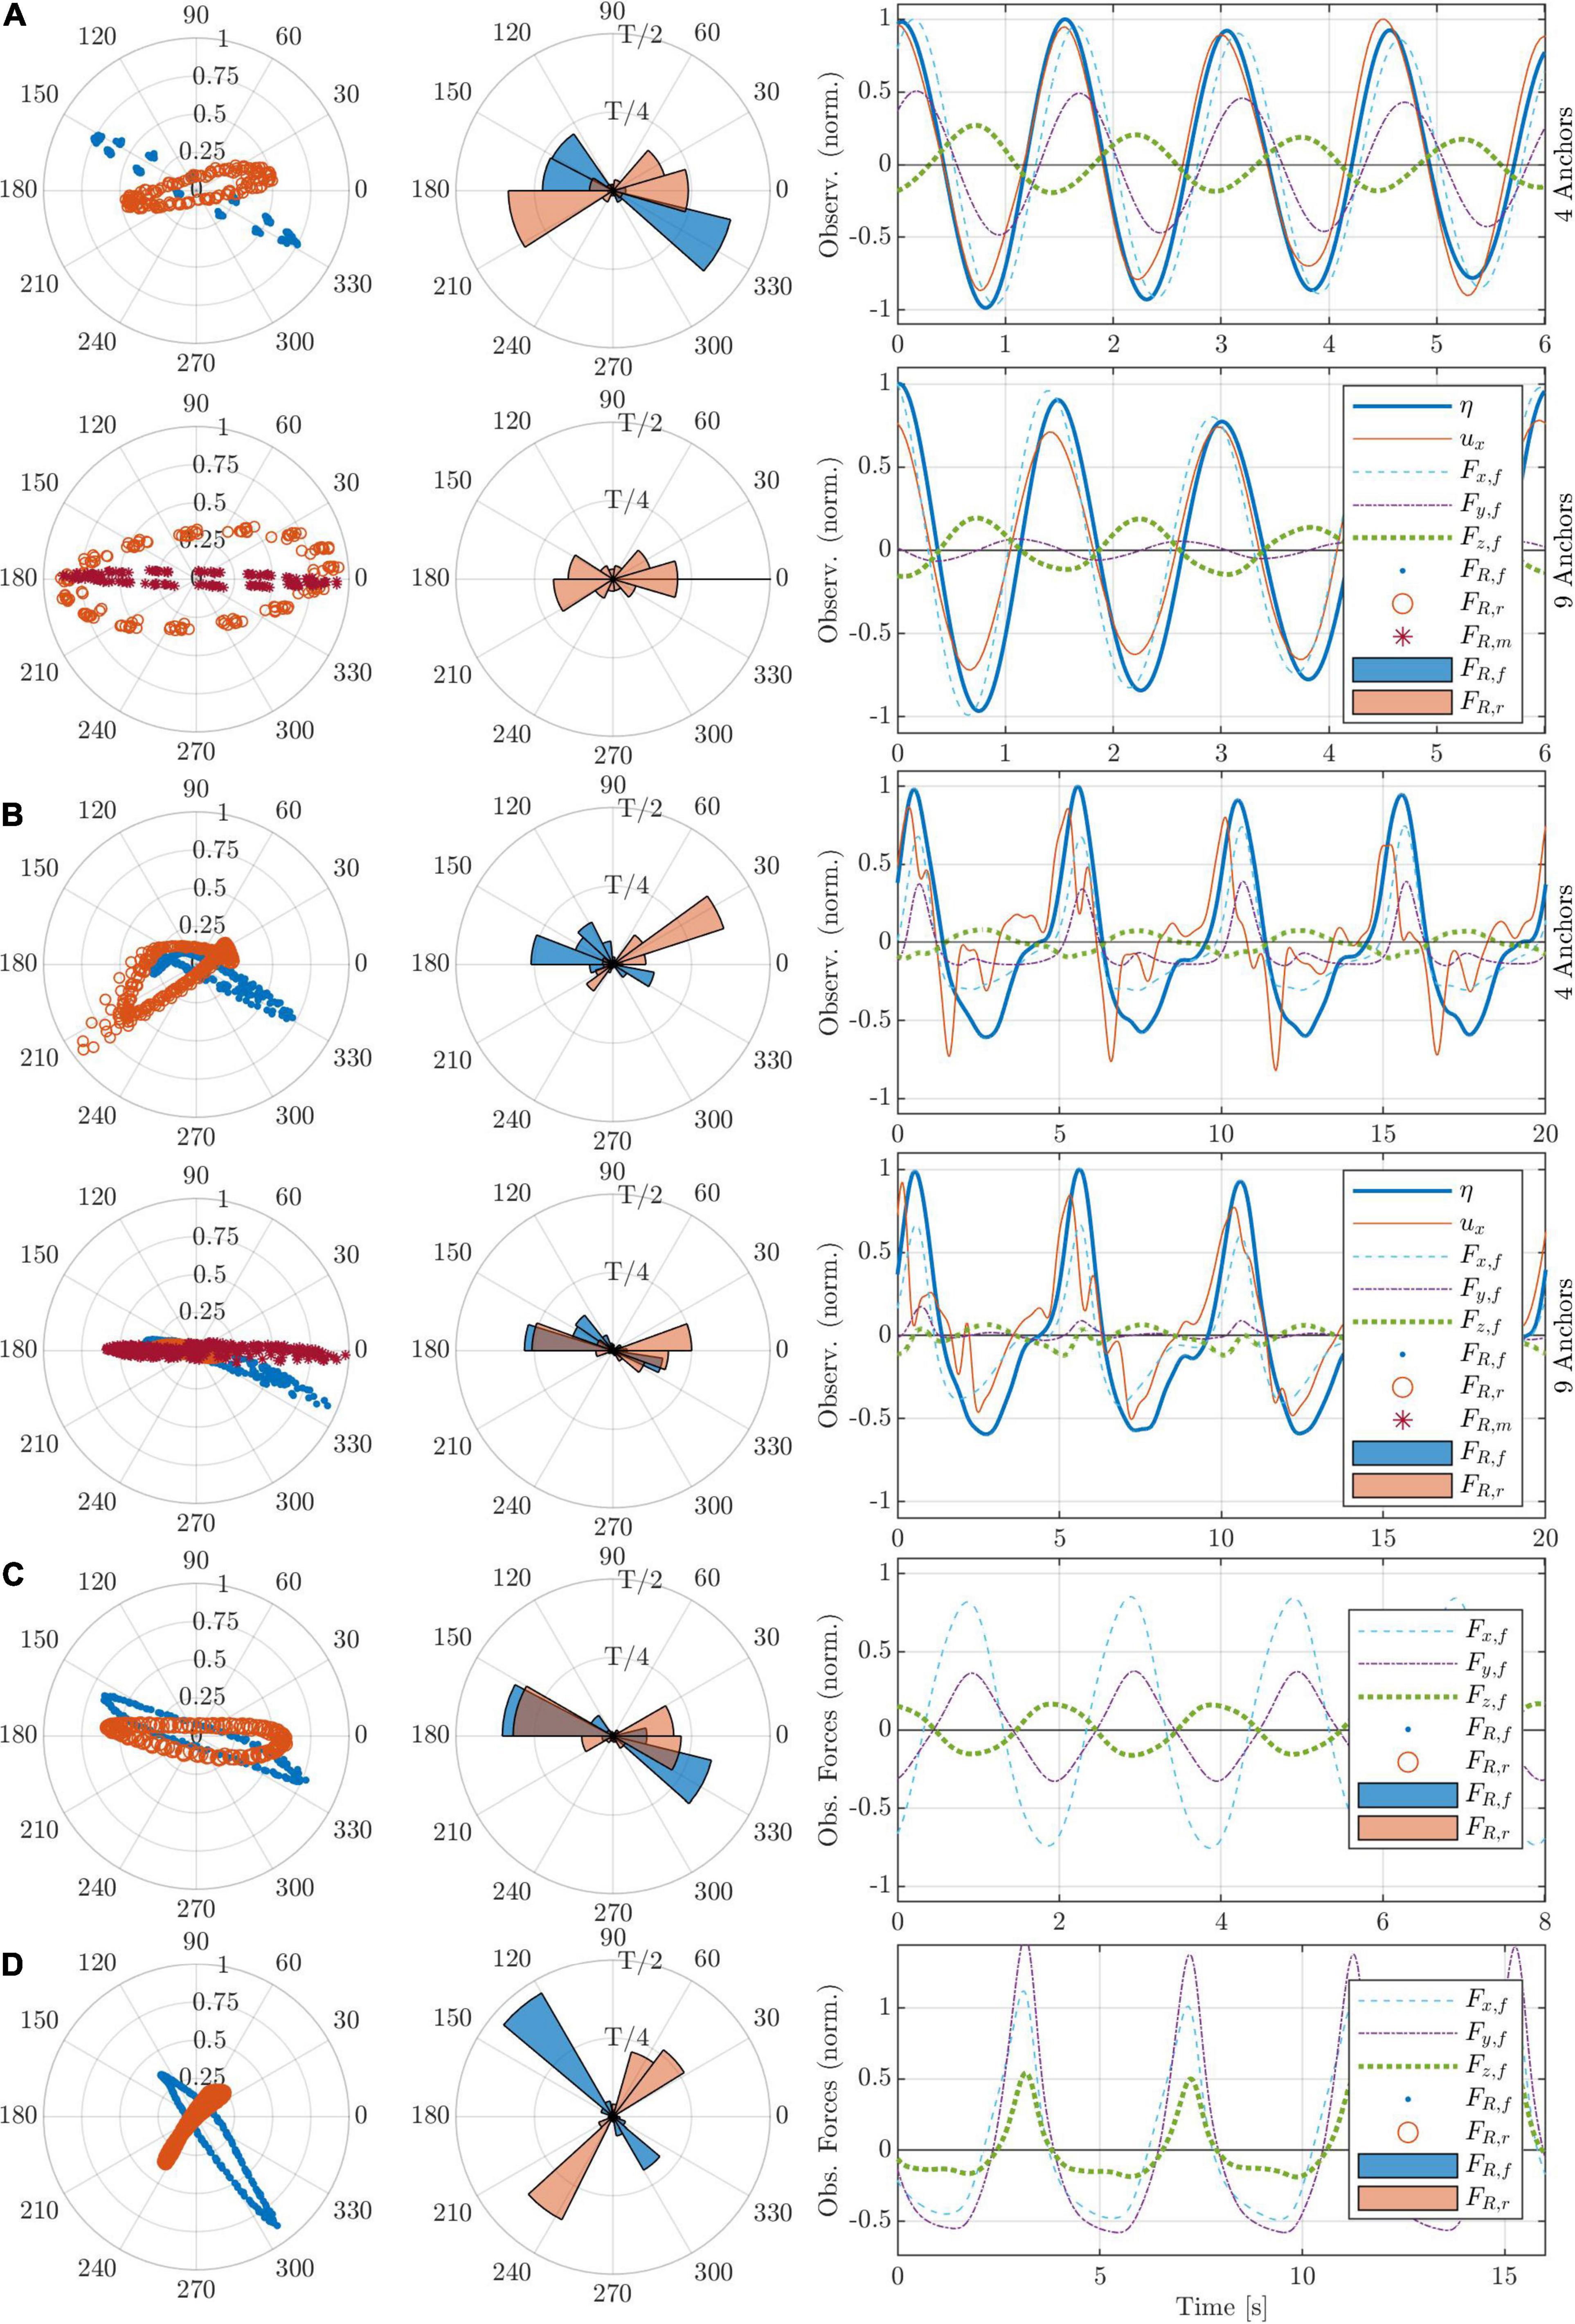
Figure 6. Observations and calculated resultant force magnitude and direction for panels (A) CM2, T = 1.5 s and H = 0.02 m; (B) CM2, T = 5 s and H = 0.08 m; (C) 1 ASG Mat, T = 2 s and H = 0.11 m; and (D) 2 ASG Mats, T = 4 s and H = 0.06 m. Plots in panels (A,B) show the CM configurations for 4 (top) and 9 (bottom) anchors. In panels (C,D) the vegetated runs (AV) are shown; note that in AV, the water level and particle velocity were not measured aligned with the anchors and are thus not shown together here. Within each panel: (left) polar graph showing the resultant force magnitude (Equation 10 normalized by the maximum measured resultant force of the respective run) and direction (inverse tangent), with the direction of rear anchors (FTrc4 and FTrc9) inverted to be aligned with the front; (center) polar histogram showing the average spatial distribution of the forces at one anchor and the corresponding duration over one period T. (right) time series of 4 waves with observed post-processed data, with η the water level fluctuation. The legend within the time series refers to all subfigures within the respective panel, with subscripts f, r and m corresponding to front, rear and middle front anchors, respectively.
The direction of the resultant forces calculated utilizing the inverse tangent showed that the forces were not parallel to the wave propagation direction (Figure 6). Frontal corner forces (FTfc4 and FTfc9) were directed towards the center of the mat, whereas the forces at rear corners (FTrc4 and FTrc9) differed depending on umax, with FR aligned with x for low velocities (e.g., Figure 6C) and directed toward the center of the mat for higher umax. The maximum forces were in phase or only slightly off phase with the wave crest and umax (time series in Figure 6), as reported by Paul et al. (2016). However, the average temporal distribution of the resultant force over one wave period displayed the opposite behavior, with the maximum forces in +x direction generally corresponding to less than 0.25T and the forces in -x dominating the rest of the time span of the wave period T (histograms in Figure 6). At low T (< 3s), the maximum lift forces were approximately O(1) smaller than the maximum horizontal forces and were in antiphase with the surface water level η, meaning that Fz was driven by the water column fluctuation and not buoyancy or lift (Figures 6A,C). Contrastingly, at T > 3s (Figures 6B,D), the high horizontal forces occurring at the wave crest are brief, sudden and act analog to the snap loads on mooring lines (e.g., Landmann et al., 2021). More importantly, the lift forces gain importance as they become comparable in magnitude to the horizontal forces; this, however, was only visible for AV, meaning that the lift force was mainly caused by drag on the ASG – recalling that this is a zero-buoyancy case. The irregularities with umax seen in Figure 6B could be seen for several runs of CM and is attributed to the flapping of the highly flexible mats, especially CM2, around the edges.
The horizontally induced wave force increased with increasing umax. Higher wave heights H produced higher shear velocities near the bed, as can be inferred from wave theory, whereas the wave period T did not influence the value of umax or Fx linearly. Nevertheless, with longer T, and due to the small relative water depths (H/d), bed interaction caused stronger wave non-linearity, in which case the maximum forces and velocities could still be observed at the wave crests, but the anchor load exposure was predominantly at wave troughs (Figure 6).
A direct comparison of force components showed that anchor forces were dominated by shear and not by lift (Figure 7). For all tested set-ups, Fx showed the highest values, with Fy generally being slightly lower, yet in the same order of magnitude (Figure 8) – with the exception of FTmf9, whose central position means that the y-direction forces cancel each other out (section “Forces on Coir Mats”). This was especially true for the 4-anchor configurations showing that, under wave forcing, the mats pull the anchor towards the center of the mat (evident in Figures 5–8). At rear anchors, Fy lost prominence, yielding values < 5 N (<10 N) for all CM (AV) cases compared to forces up to 30 N (60 N) at the front in the +x direction; hence, rear anchor forces in +x were primarily one-dimensional. In the opposite direction (-x), the forces only increased marginally with Fy,rear < 7.5 N for both CM and AV. Similarly, Fx showed values < 10 N for the -x direction at the rear and <15 N at the front for both CM and AV, demonstrating that the forces in the direction of wave propagation correspond to the dominant loads on the anchors.
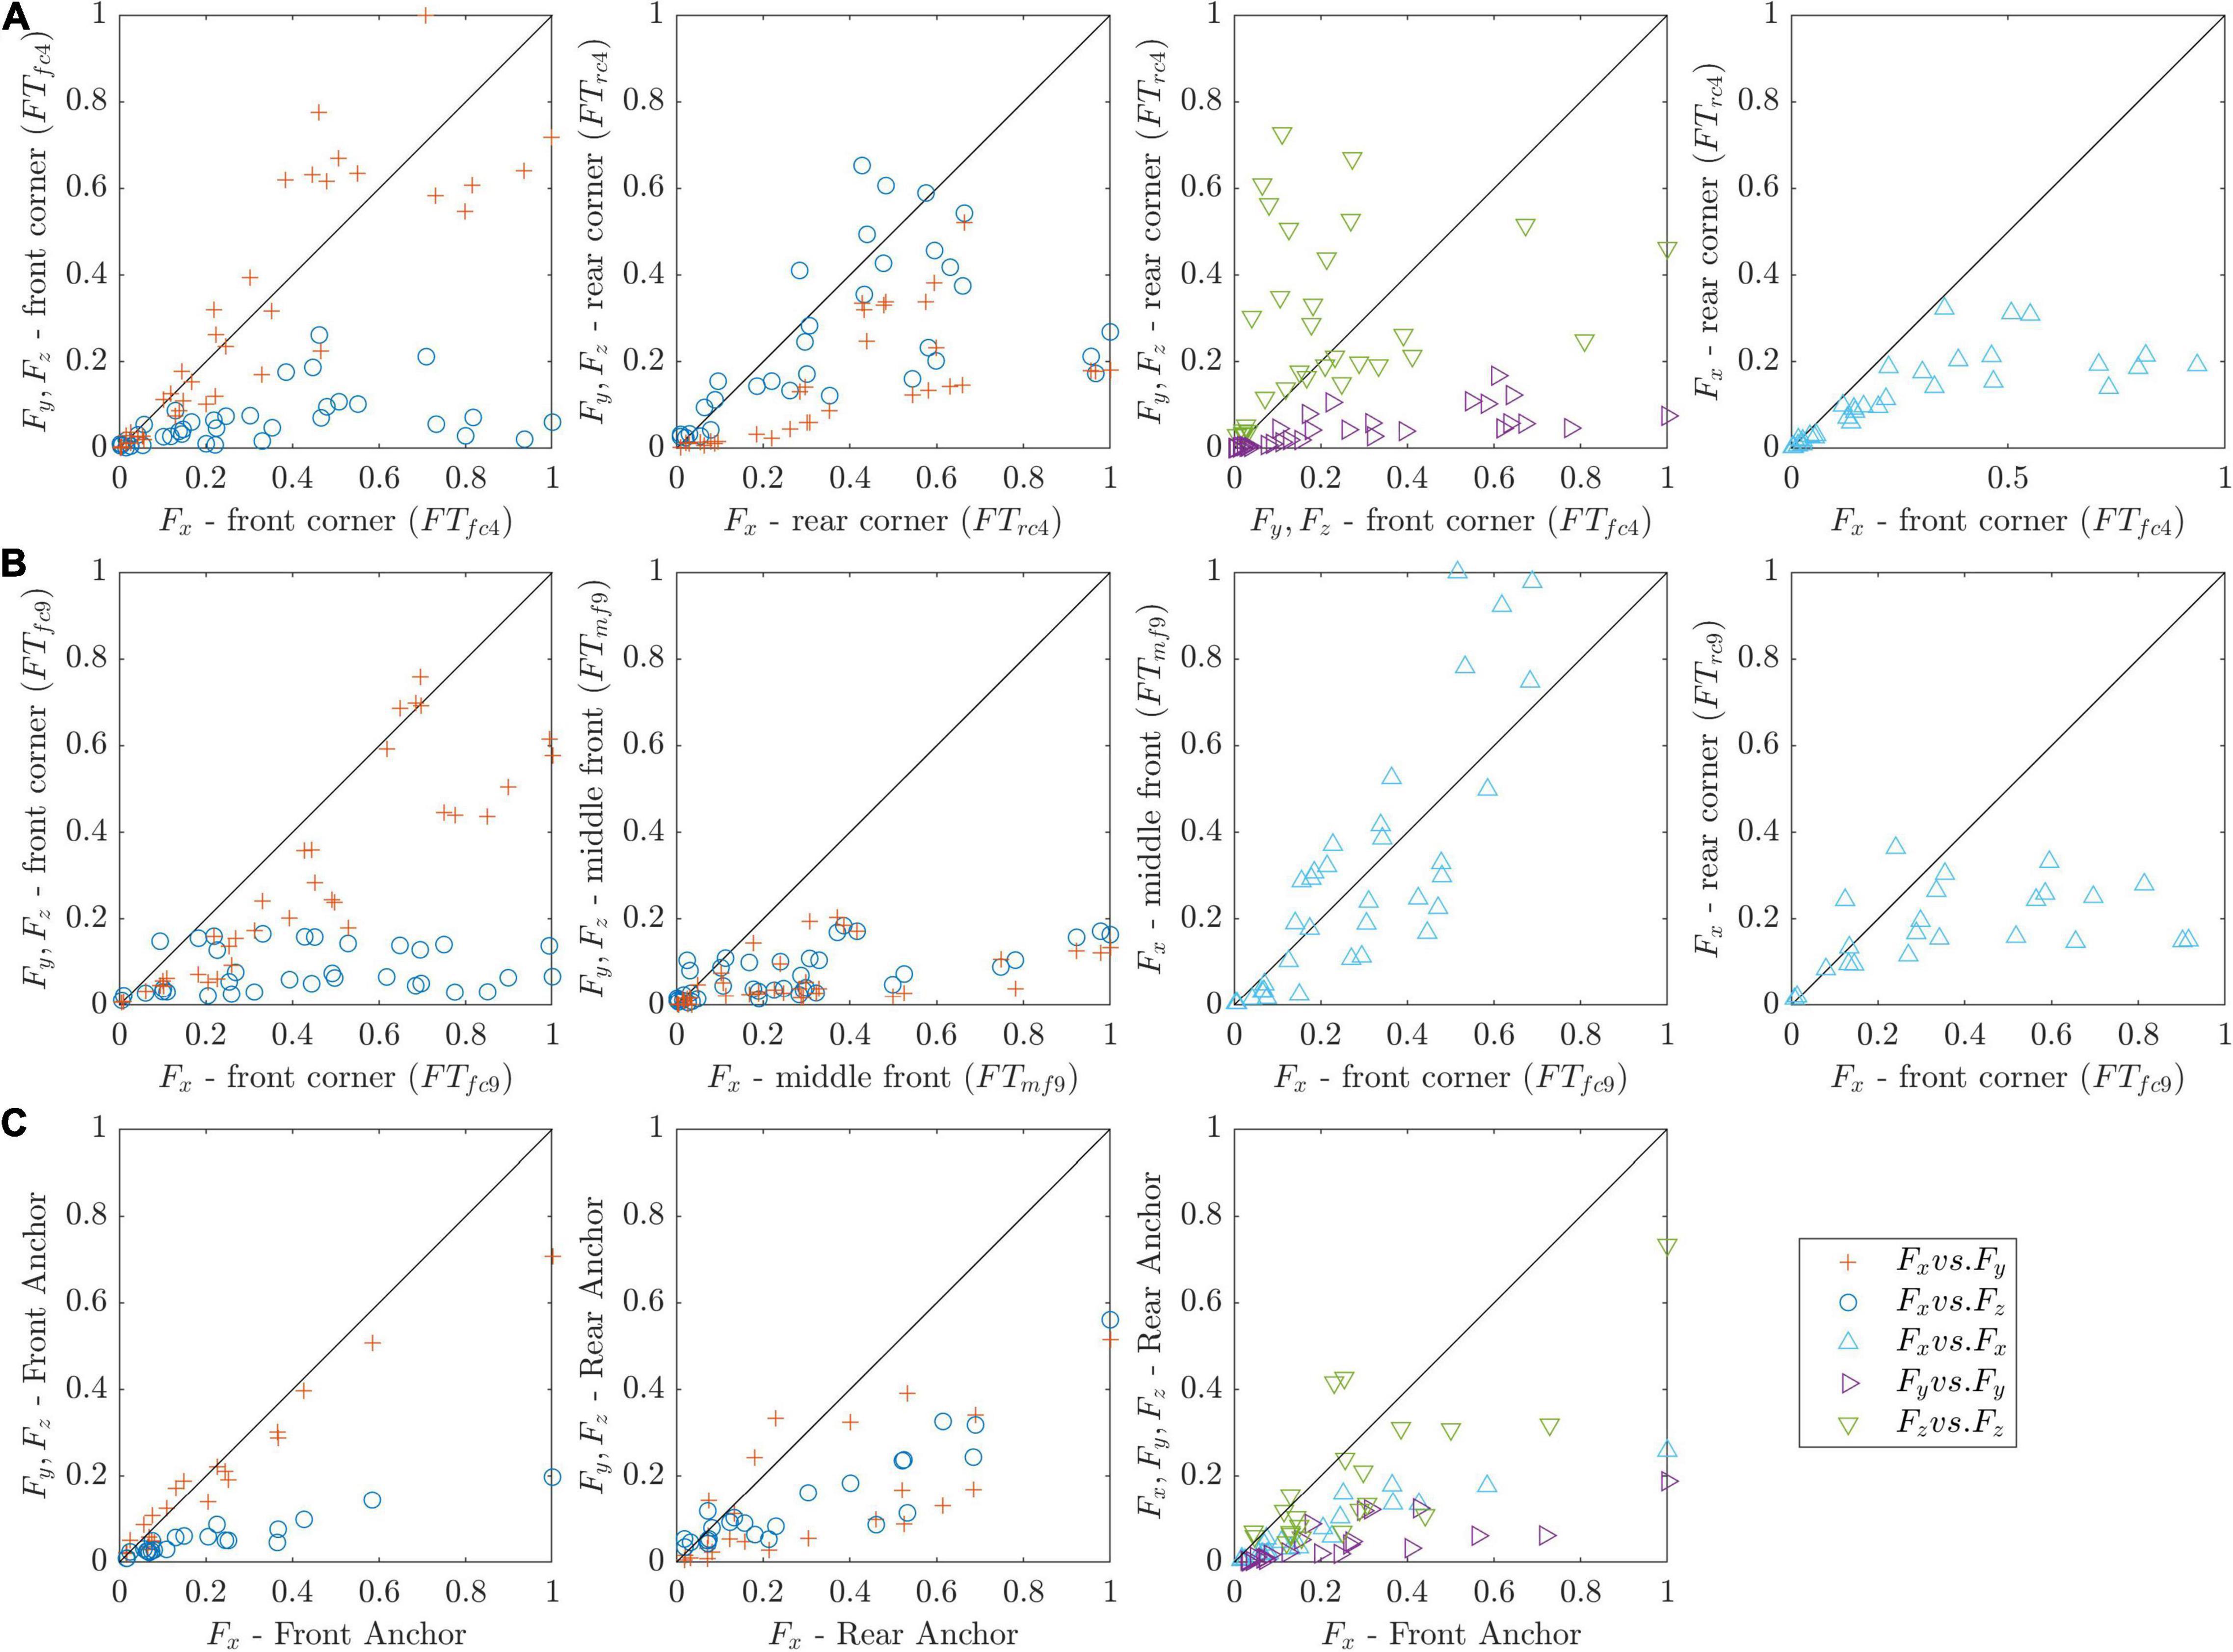
Figure 7. Force component (x, y, z) comparison for all runs depending on anchoring position (shown in the axis label). All forces are normalized by the maximum measured force. (A) 4-anchor configuration for non-vegetated mats (CM), showing the front (FTfc4) and rear anchor (FTrc4) forces. (B) 9-anchor configuration (CM), comparing components in the front corner (FTfc9), middle-front (FTmf9) and rear corner (FTrc9) anchors. (C) front and rear anchor force comparison for the vegetated mat experiments (AV).
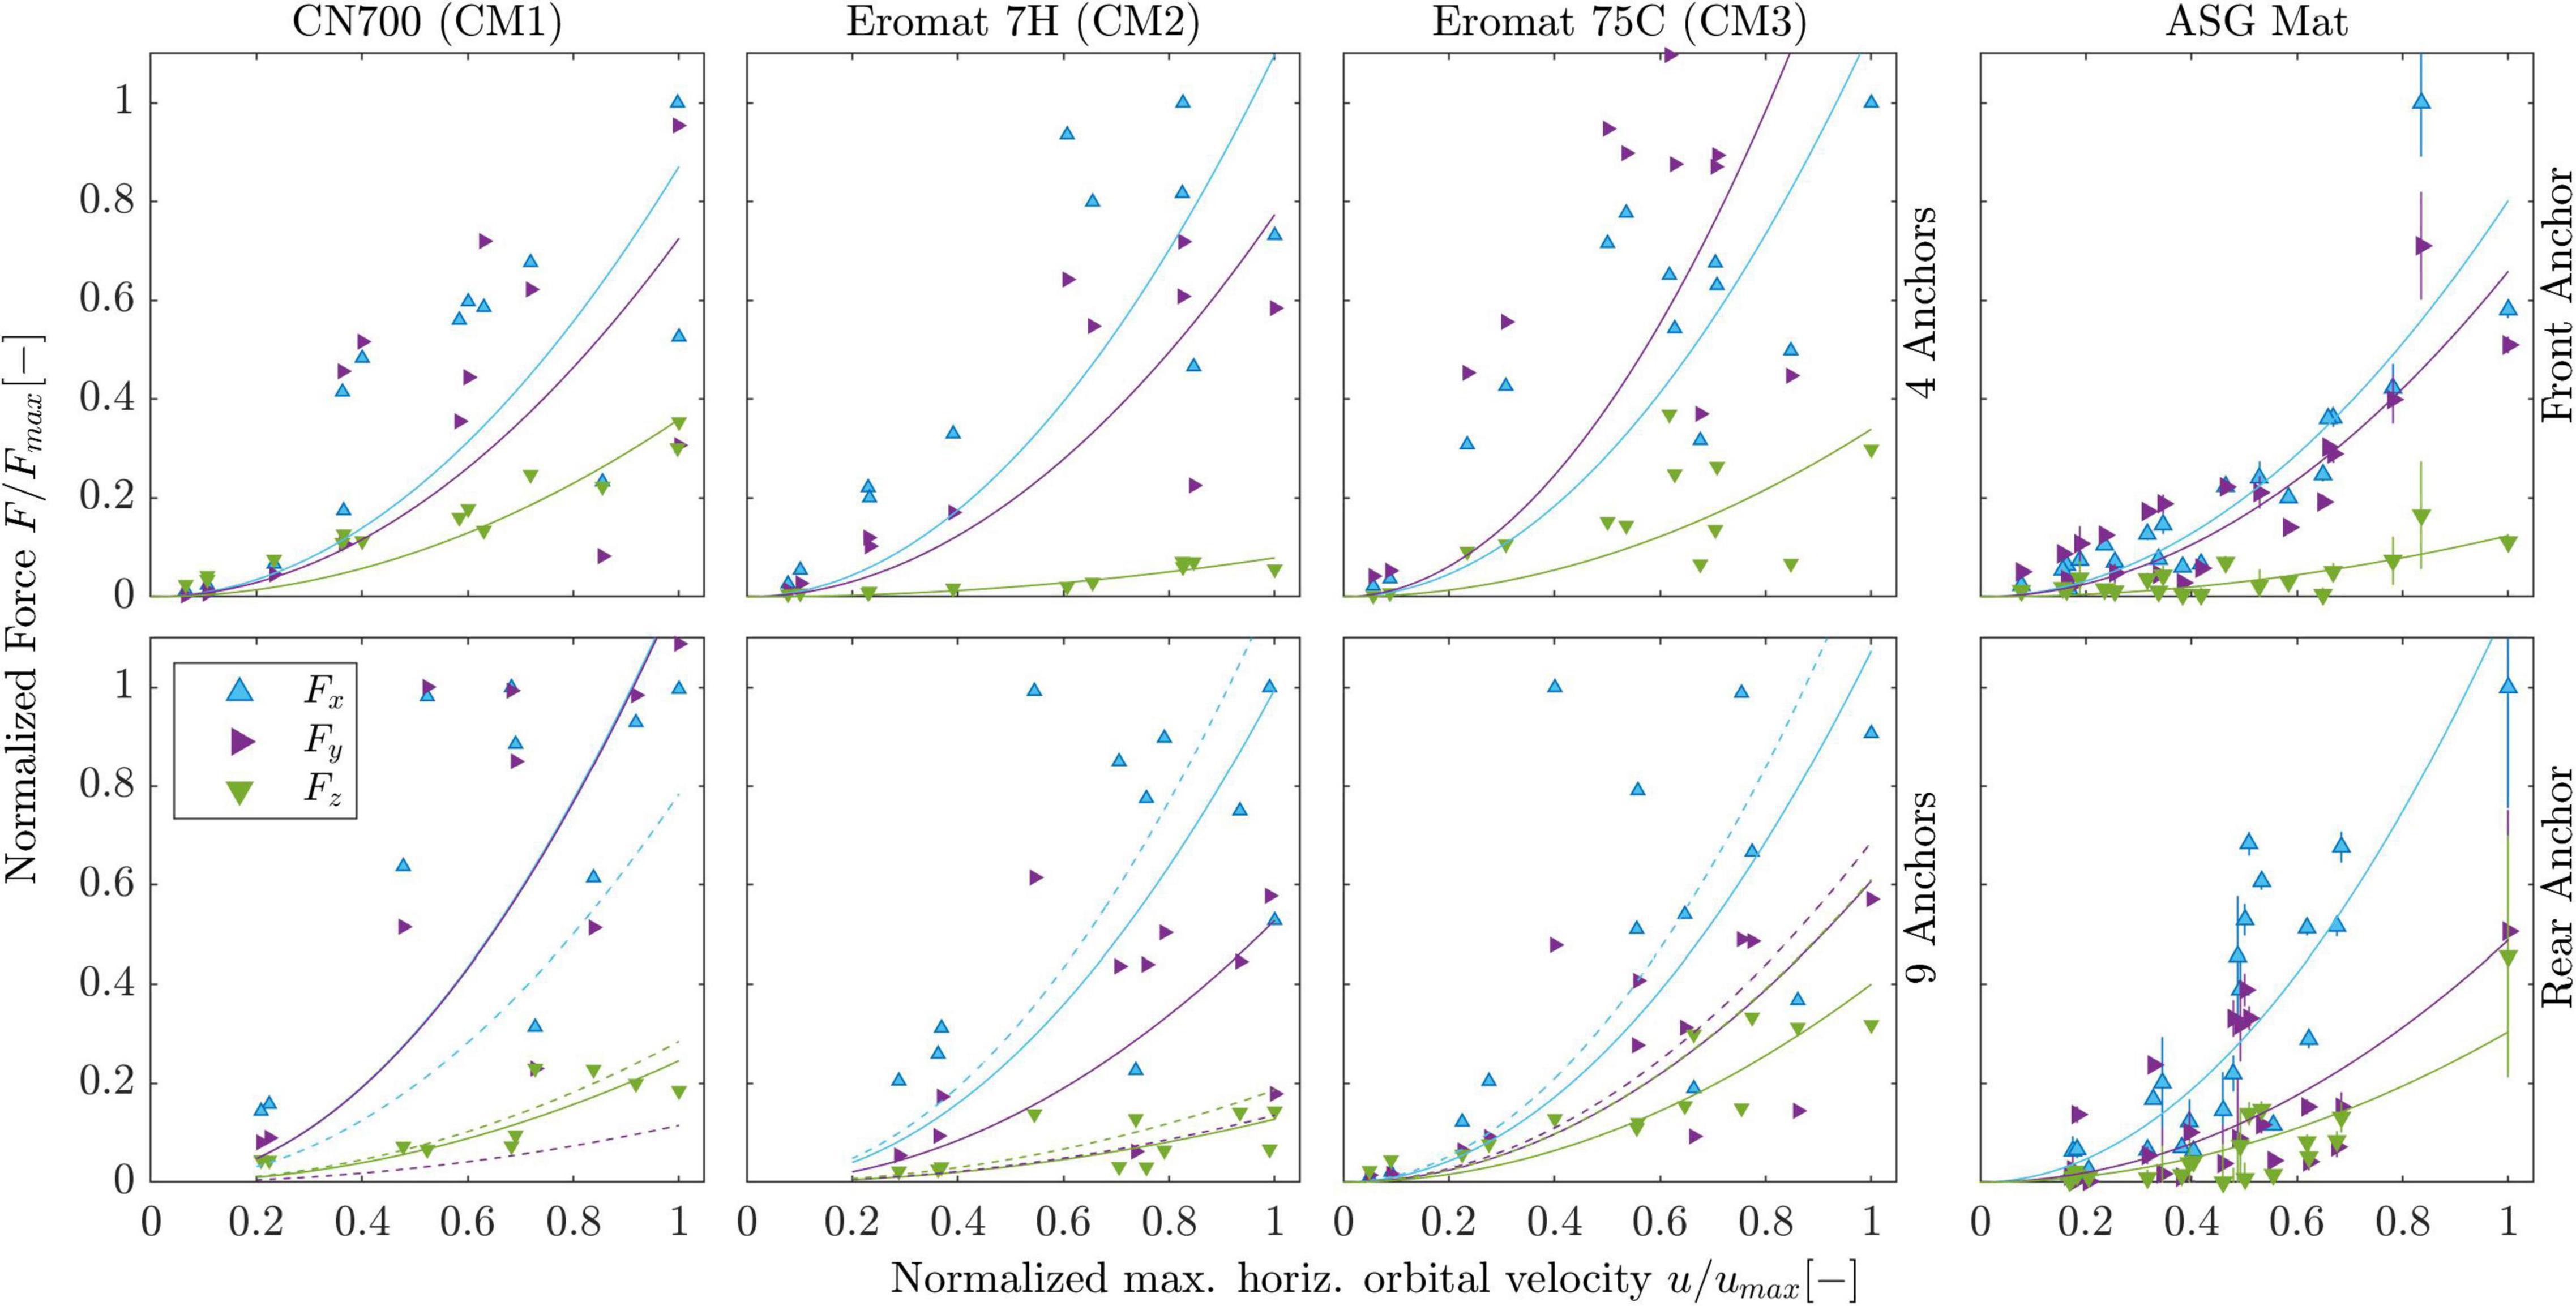
Figure 8. Force-velocity plots of maximum measured horizontal orbital velocities against the respective maximum measured shear and lift forces for all runs. All plots are normalized by the maximum value for the respective set-up. The 2 rightmost panels show the front and rear anchor of the ASG mat (AV). These comprised measurements with repetitions, thus resulting in the shown error bars, while the rest (CM) have no calculated uncertainty. The CM are exclusively for front anchors. Solid lines represent quadratic fits for comparison. Dashed lines in lower plots correspond to middle-front anchor (FTmf9, markers omitted for clarity).
Forces on Coir Mats
For all CM cases, the forces at the rear anchor were <10 N and less than one third of the corresponding forces at the front (<30 N) for velocities over 0.1 m s–1 (Figure 7). For the 9-anchor configuration, the middle-front anchor (FTmf9) measured Fx O(1) higher than Fy, which was expected due to drag contribution from both sides of the anchor. However, the force measured did not amount to double that of the corner anchor (FTfc9), as was originally expected (the corner anchor would be expected to take half of the load of that in the middle), with the quadratic fit coefficients showing that Fx,mf9 = 1.2Fx,fc9 for both Eromats (CM2 and CM3). This shows that the outermost anchors incur in loads that do not correspond to a symmetric areal distribution with the neighboring anchor. Lift forces at all anchors were notably smaller than the shear forces with Fz,max < 0.4Fx,max for all cases. CM1 and CM3 showed the highest Fz contribution; however, it is worth noting that the former also displayed low horizontal forces (<12 N) compared to the other 2 mats (Figure 9). The increased Fz for CM3 is likely caused by the positive buoyancy of the HDPE mesh surrounding the coir.
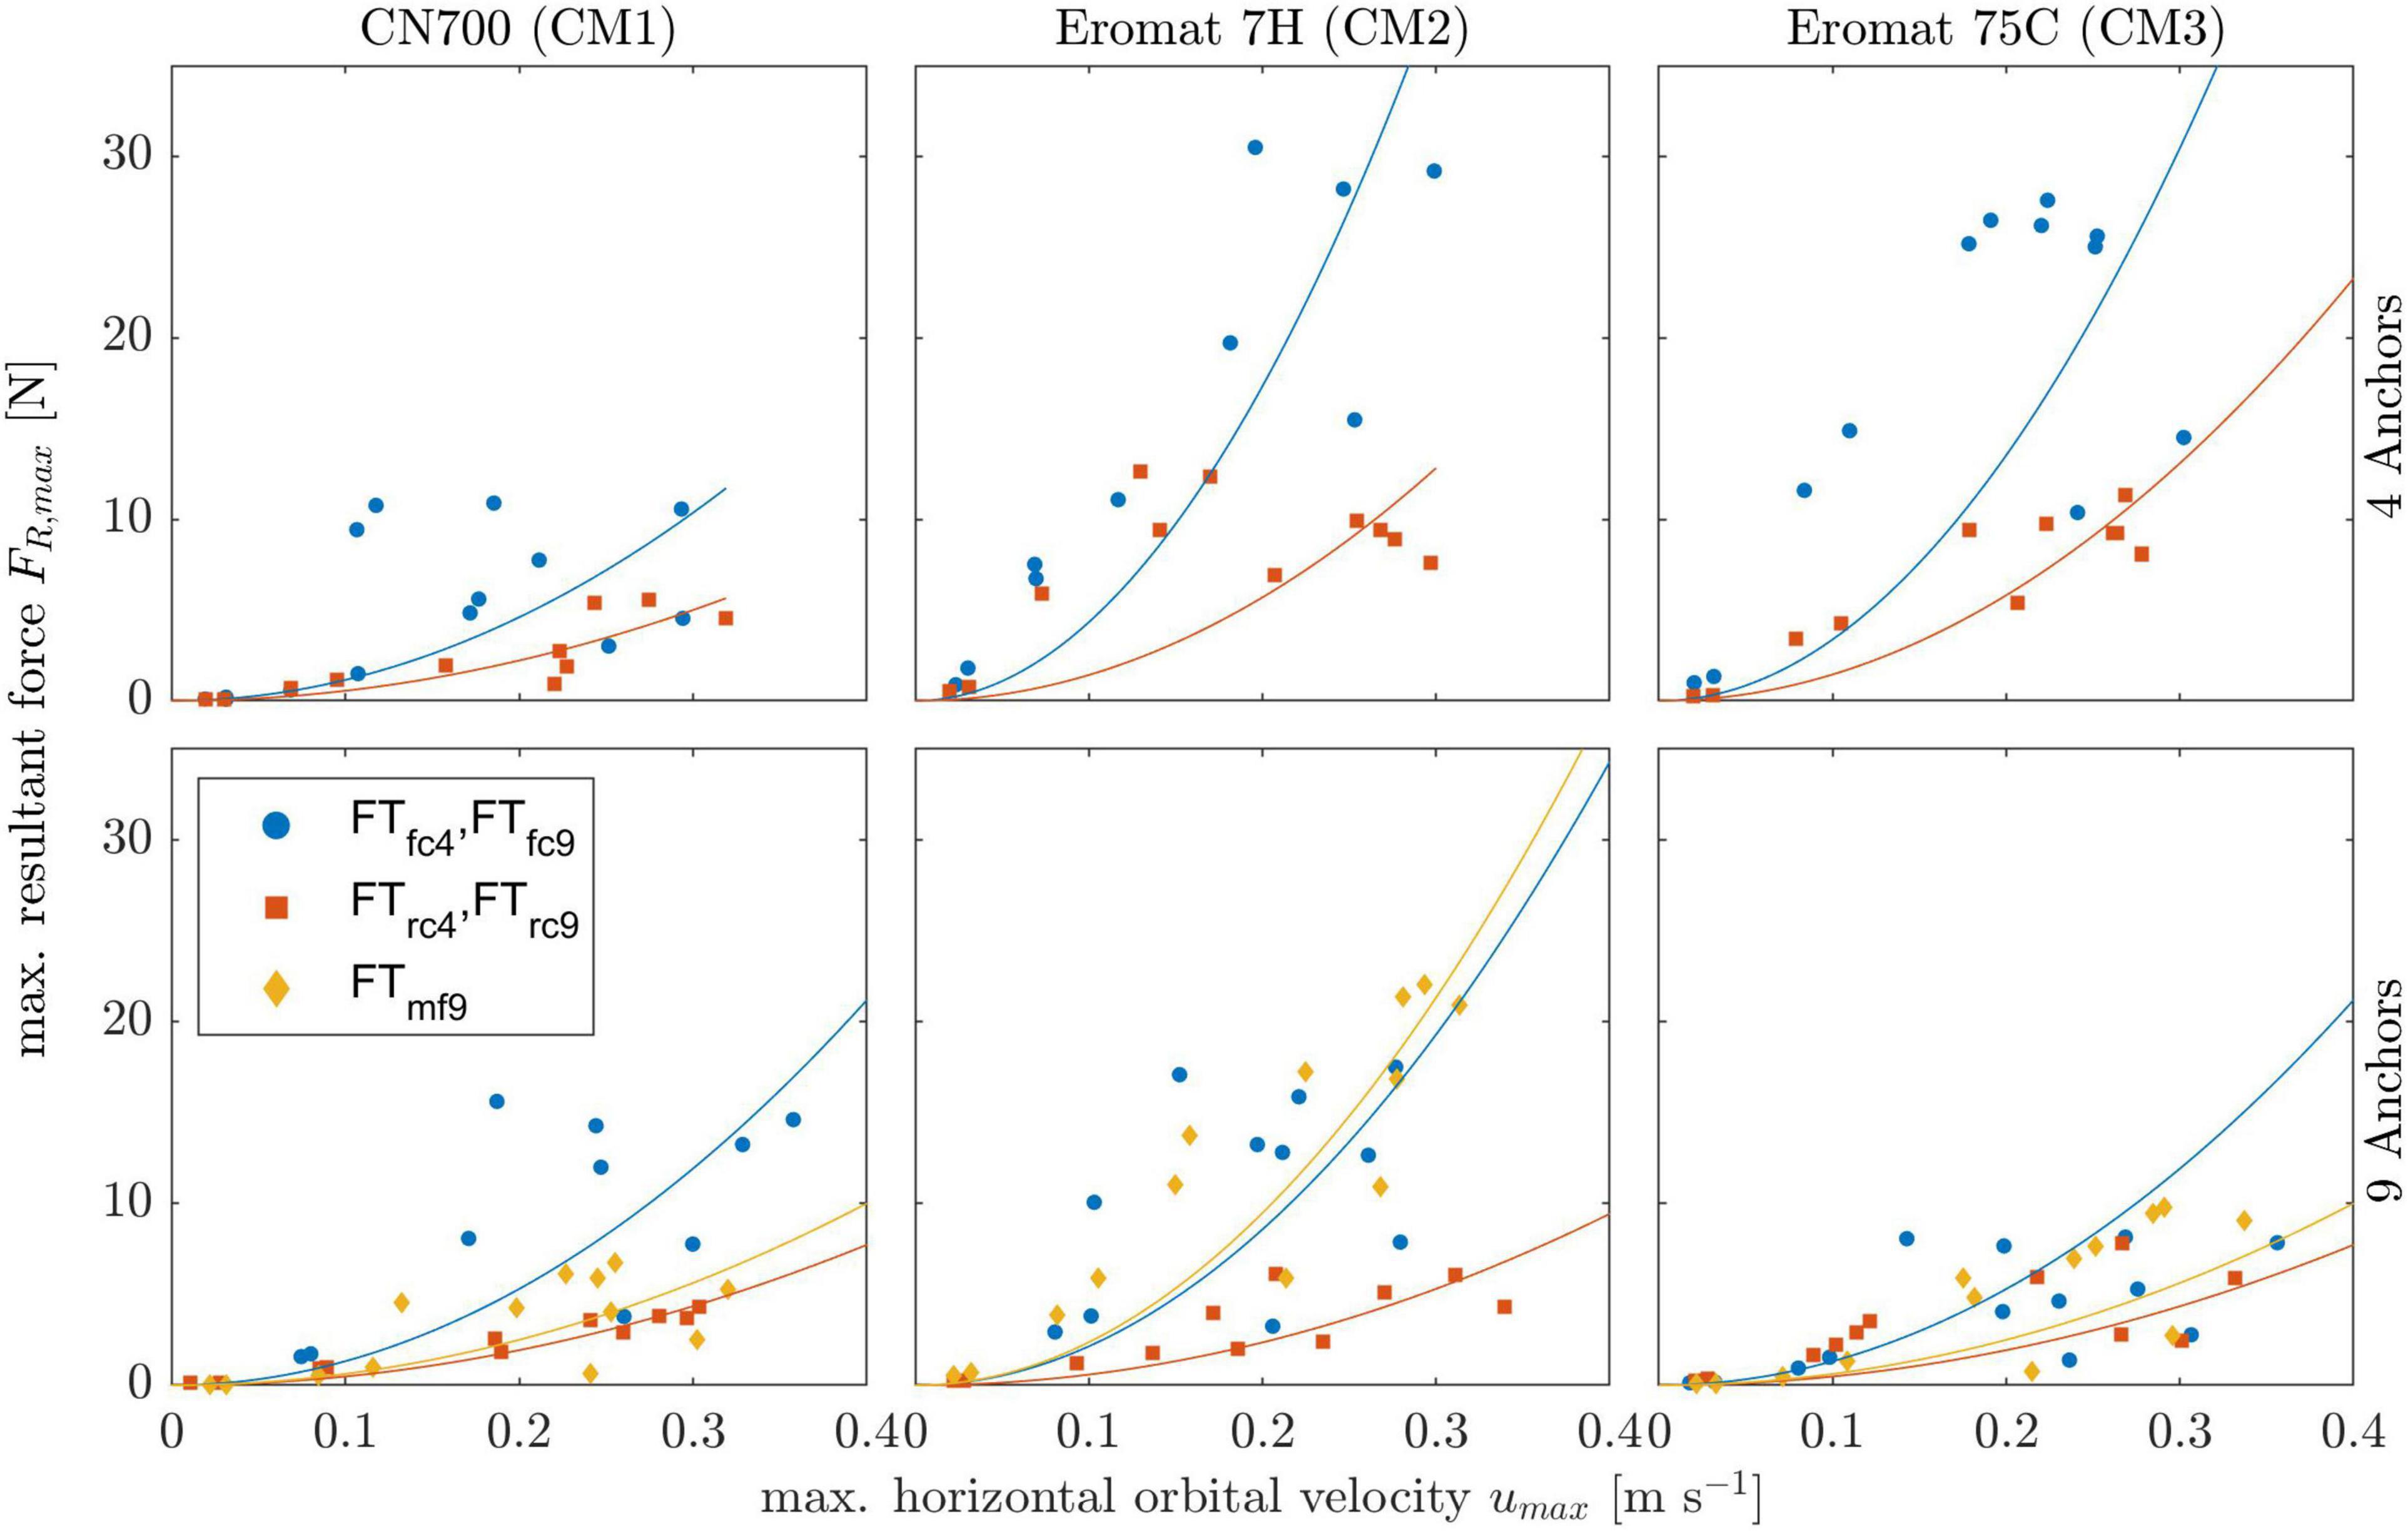
Figure 9. Resultant forces at all anchor positions for the experiments on coir mats (CM). Columns: mat type; rows: number of anchors. The subscripts in the legend indicate the anchor position of the measurement, with f = front, c = corner, m = middle, and 4 and 9 representing the number of anchors. A quadratic fit of form is shown for reference, color-coded for the respective marker.
For the 195 CM runs (all excluding control measurements), the resultant forces (Equation 10) did not exceed 30 N and were dominant at the frontal anchors (Figure 9). The 4-anchor configuration displayed the highest forces, up to 30 N, which were measured for both Eromats (CM2 and CM3). The woven net (CM1) measured forces lower than the other two mats by a factor of 3.3 (2.5) for the frontal (rear) anchors. Compared to the 9-anchor configuration, the frontal anchors measured an estimated 2 (4) times higher forces for CM2 (CM3); the rear anchor forces were in turn twice as high for both mats. For the netting, the measured forces did not vary in dependence of the number of anchors (FR,front < 15 N and FR,rear < 5 N for all runs). CM2 – by construction the most flexible and unstable mat – displayed the highest forces at just over 30 N for the front corner with 4 anchors and above 20 N for the middle front with 9 anchors (Figure 9).
Forces on Artificial Seagrass Mats
Measured Forces
The measured AV forces were above 2 times higher than the CM at high horizontal orbital velocities (u ≈ 0.4 m s–1) and up to 10 times higher at low velocities (u ≈ 0.1 m s–1), reaching values above 60 N (Figure 10). This demonstrates that the presence of the ASG had a marked impact on measured drag. Four to five force measurements (depending on d) were done per velocity measurement at z = 3 cm resulting in the standard deviation denoted by the error bars in the figure. The rear anchor forces were lower than the frontal forces by a factor of about 2. A quadratic fit () is shown for frontal and rear anchors yielding the R2 and α coefficients shown in Figure 10.
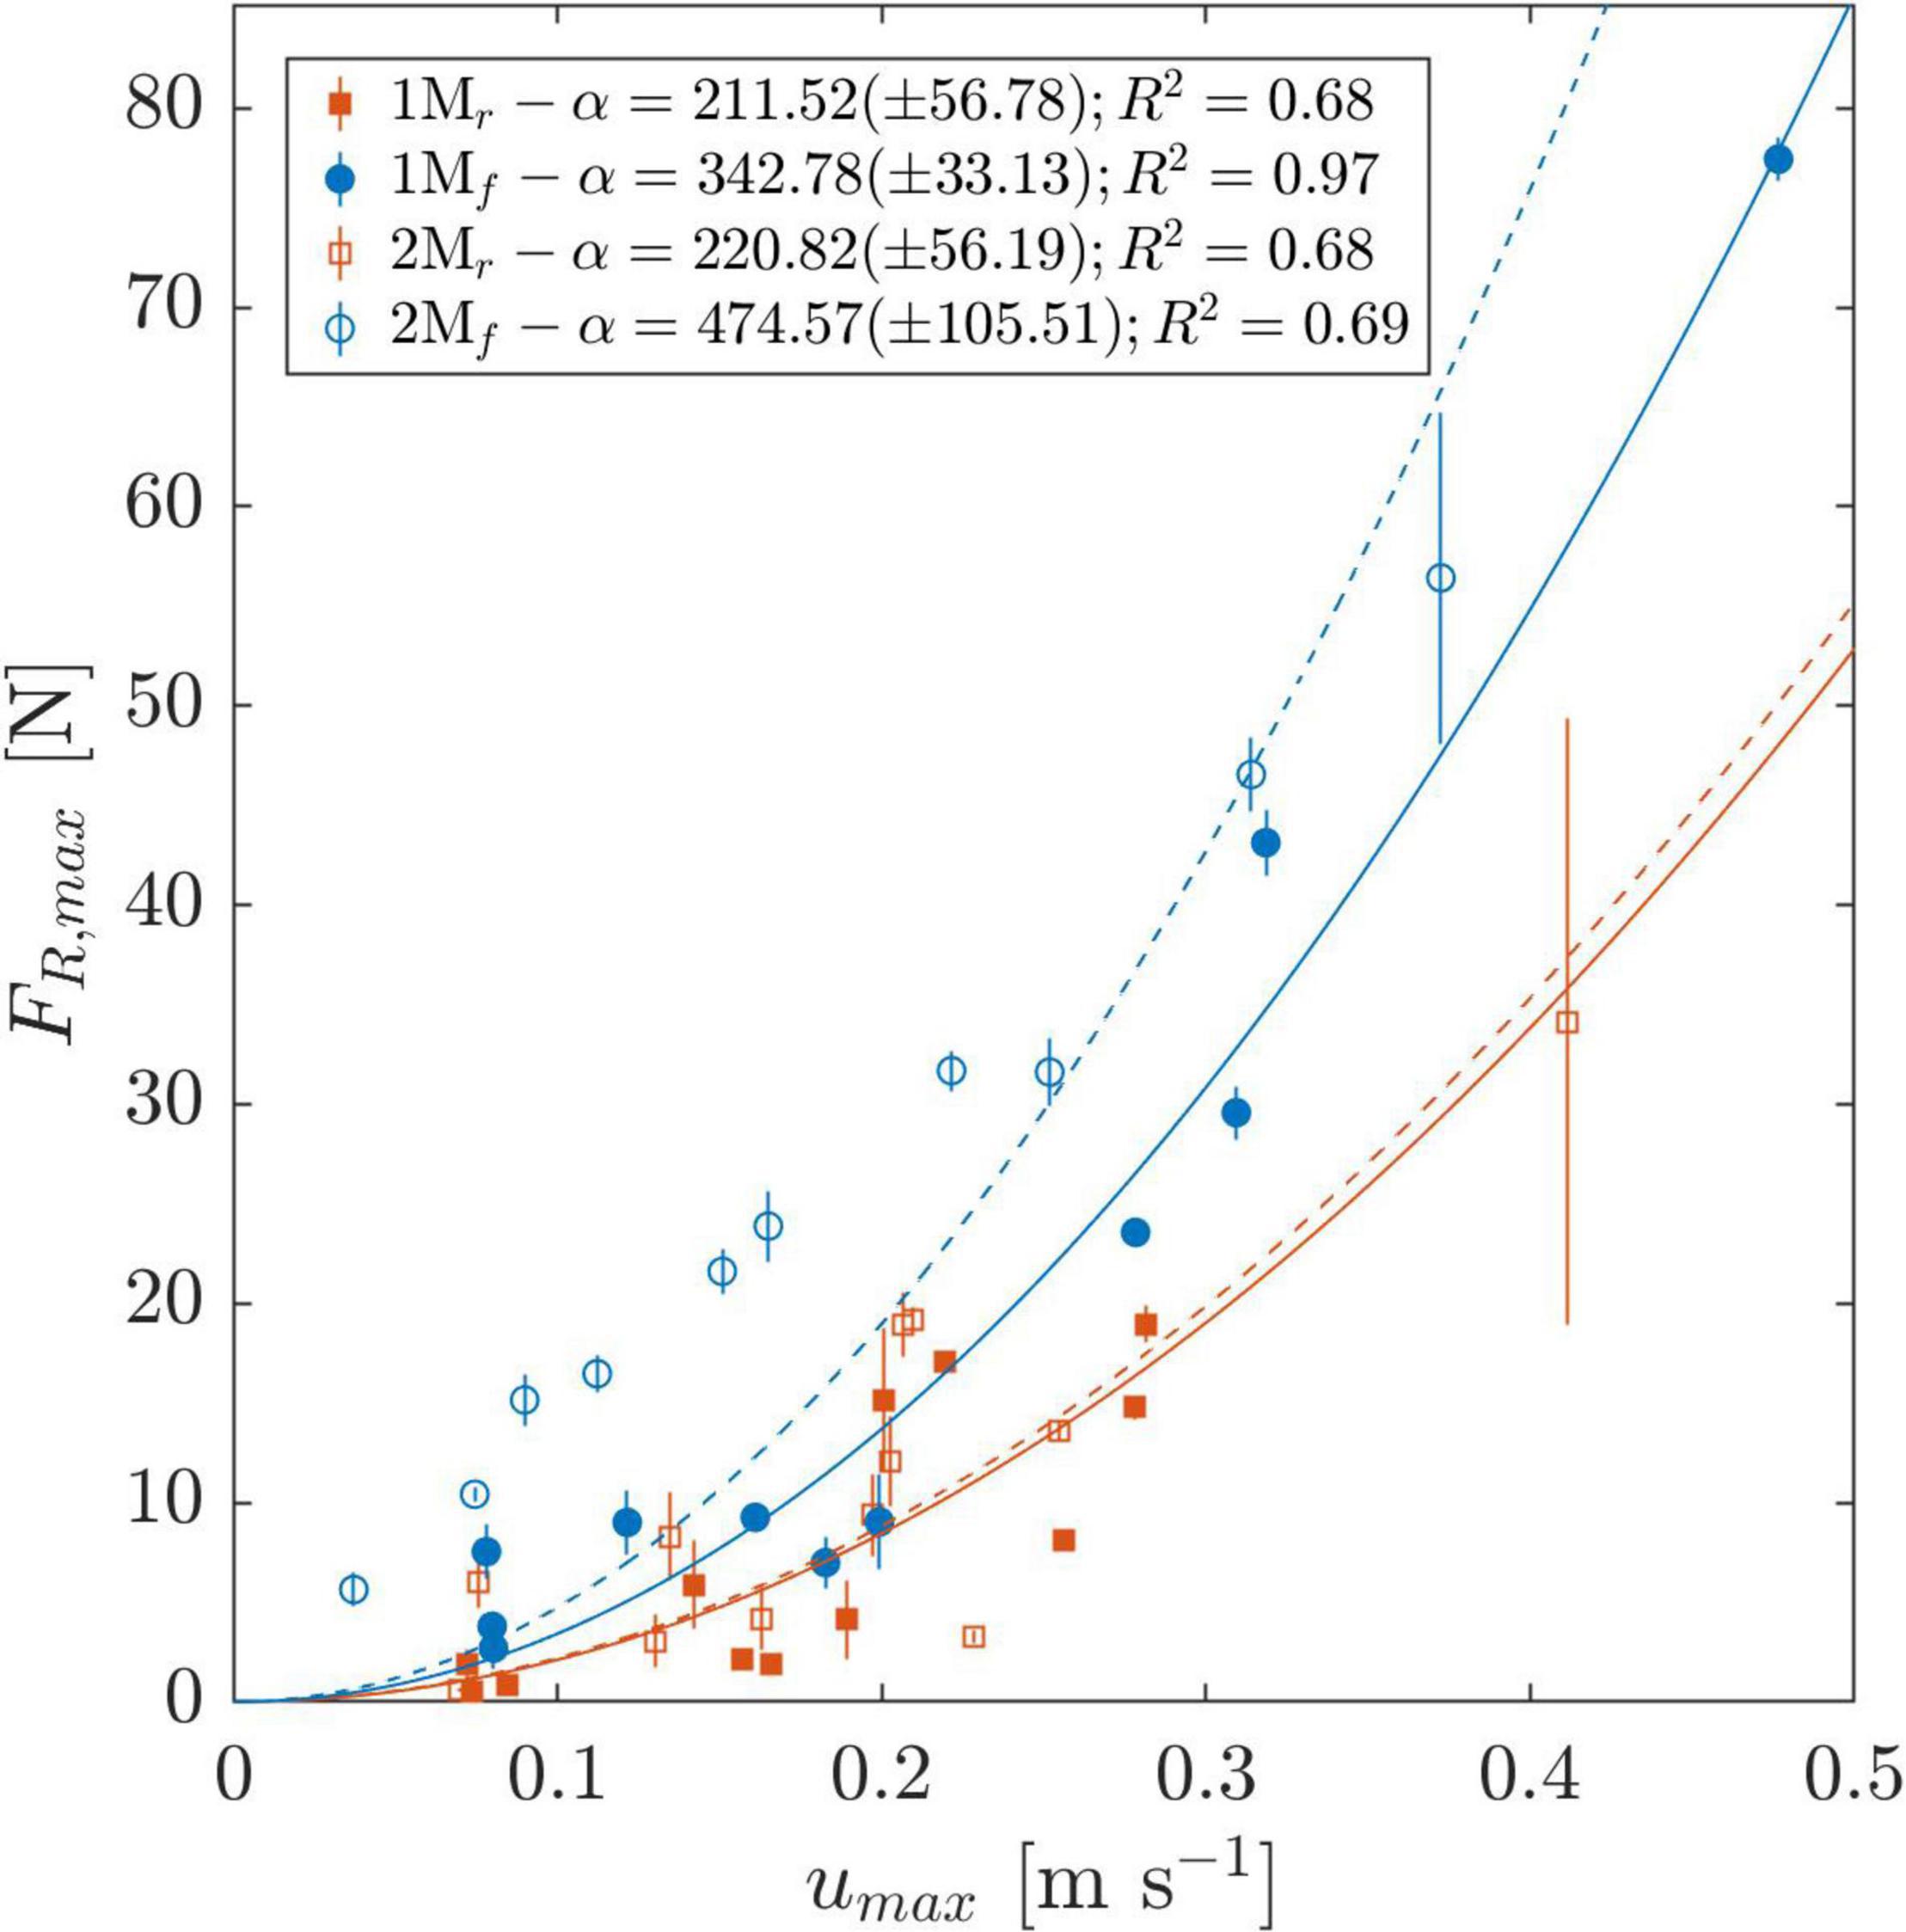
Figure 10. Mean maximum resultant forces FR measured at front and rear anchors (subscripts f and r, respectively) of a 4-point anchored artificial seagrass mat. Filled markers correspond to the one-mat configuration (1M), void markers to the two-mat configuration (2M); error bars depict standard deviation (n = 4–5). A quadratic fit of form is shown for reference for each set of measurements with dashed lines representing 2M and solid lines 1M, respectively, color-coded according to the position f and r. The values for α and coefficient of determination (R2) are given beside the respective position in the legend. An additional fit for all front and all rear measurements (not plotted) yielded α=384.12(±49.8);R2=0.82 and α=217.56(±36.71);R2=0.69 for f and r, respectively.
The rear anchors did not display any change in dependence on the number of mats; in contrast, the front anchors experienced increased resultant forces to a factor of 1.4 based on quadratic fits (Figure 10) with the presence of a second mat. The forces for the 2-mat measurements ranged from 1.16 to 3.6 times the corresponding forces for the 1-mat measurement. Considering all measurements, the mean ratio of maximum resultant force measured for the 2-mat to 1-mat configuration was 1.77. Interestingly, despite this prevalent increase in horizontal forces in the presence of a second mat, the average ratio of maximum measured velocity over the bed u(z = 0.03m) between both set-ups was 1.02 ± 0.12.
Modeled Forces
The bed shear stress τb,w depends on the wave friction factor fw and the horizontal orbital velocity u, where fw depends on T and aB. To be able to relate the τb,w-induced forces with the flexible stem drag forces (Equation 7), we utilized the entirety of the measurements (CM and AV) to calculate the corresponding friction factors depending on the measured incident wave conditions. The measured wave periods and maximum incident velocity for each run were then used to calculate fw (Figure 11A). An exponential fit of fw against umax provided an equation for fw(u) (Equation 12), which was then used in Equation 9. KC and CD,w for the wave extension model showed a linear dependency on the incident wave period. KC increased linearly with umax at a rate proportional to T, while CD reduced to 1.95 at a rate 3.2 times higher for T = 5 s compared to T = 2 s, and 2 times higher than T = 3 s (Figure 11B).
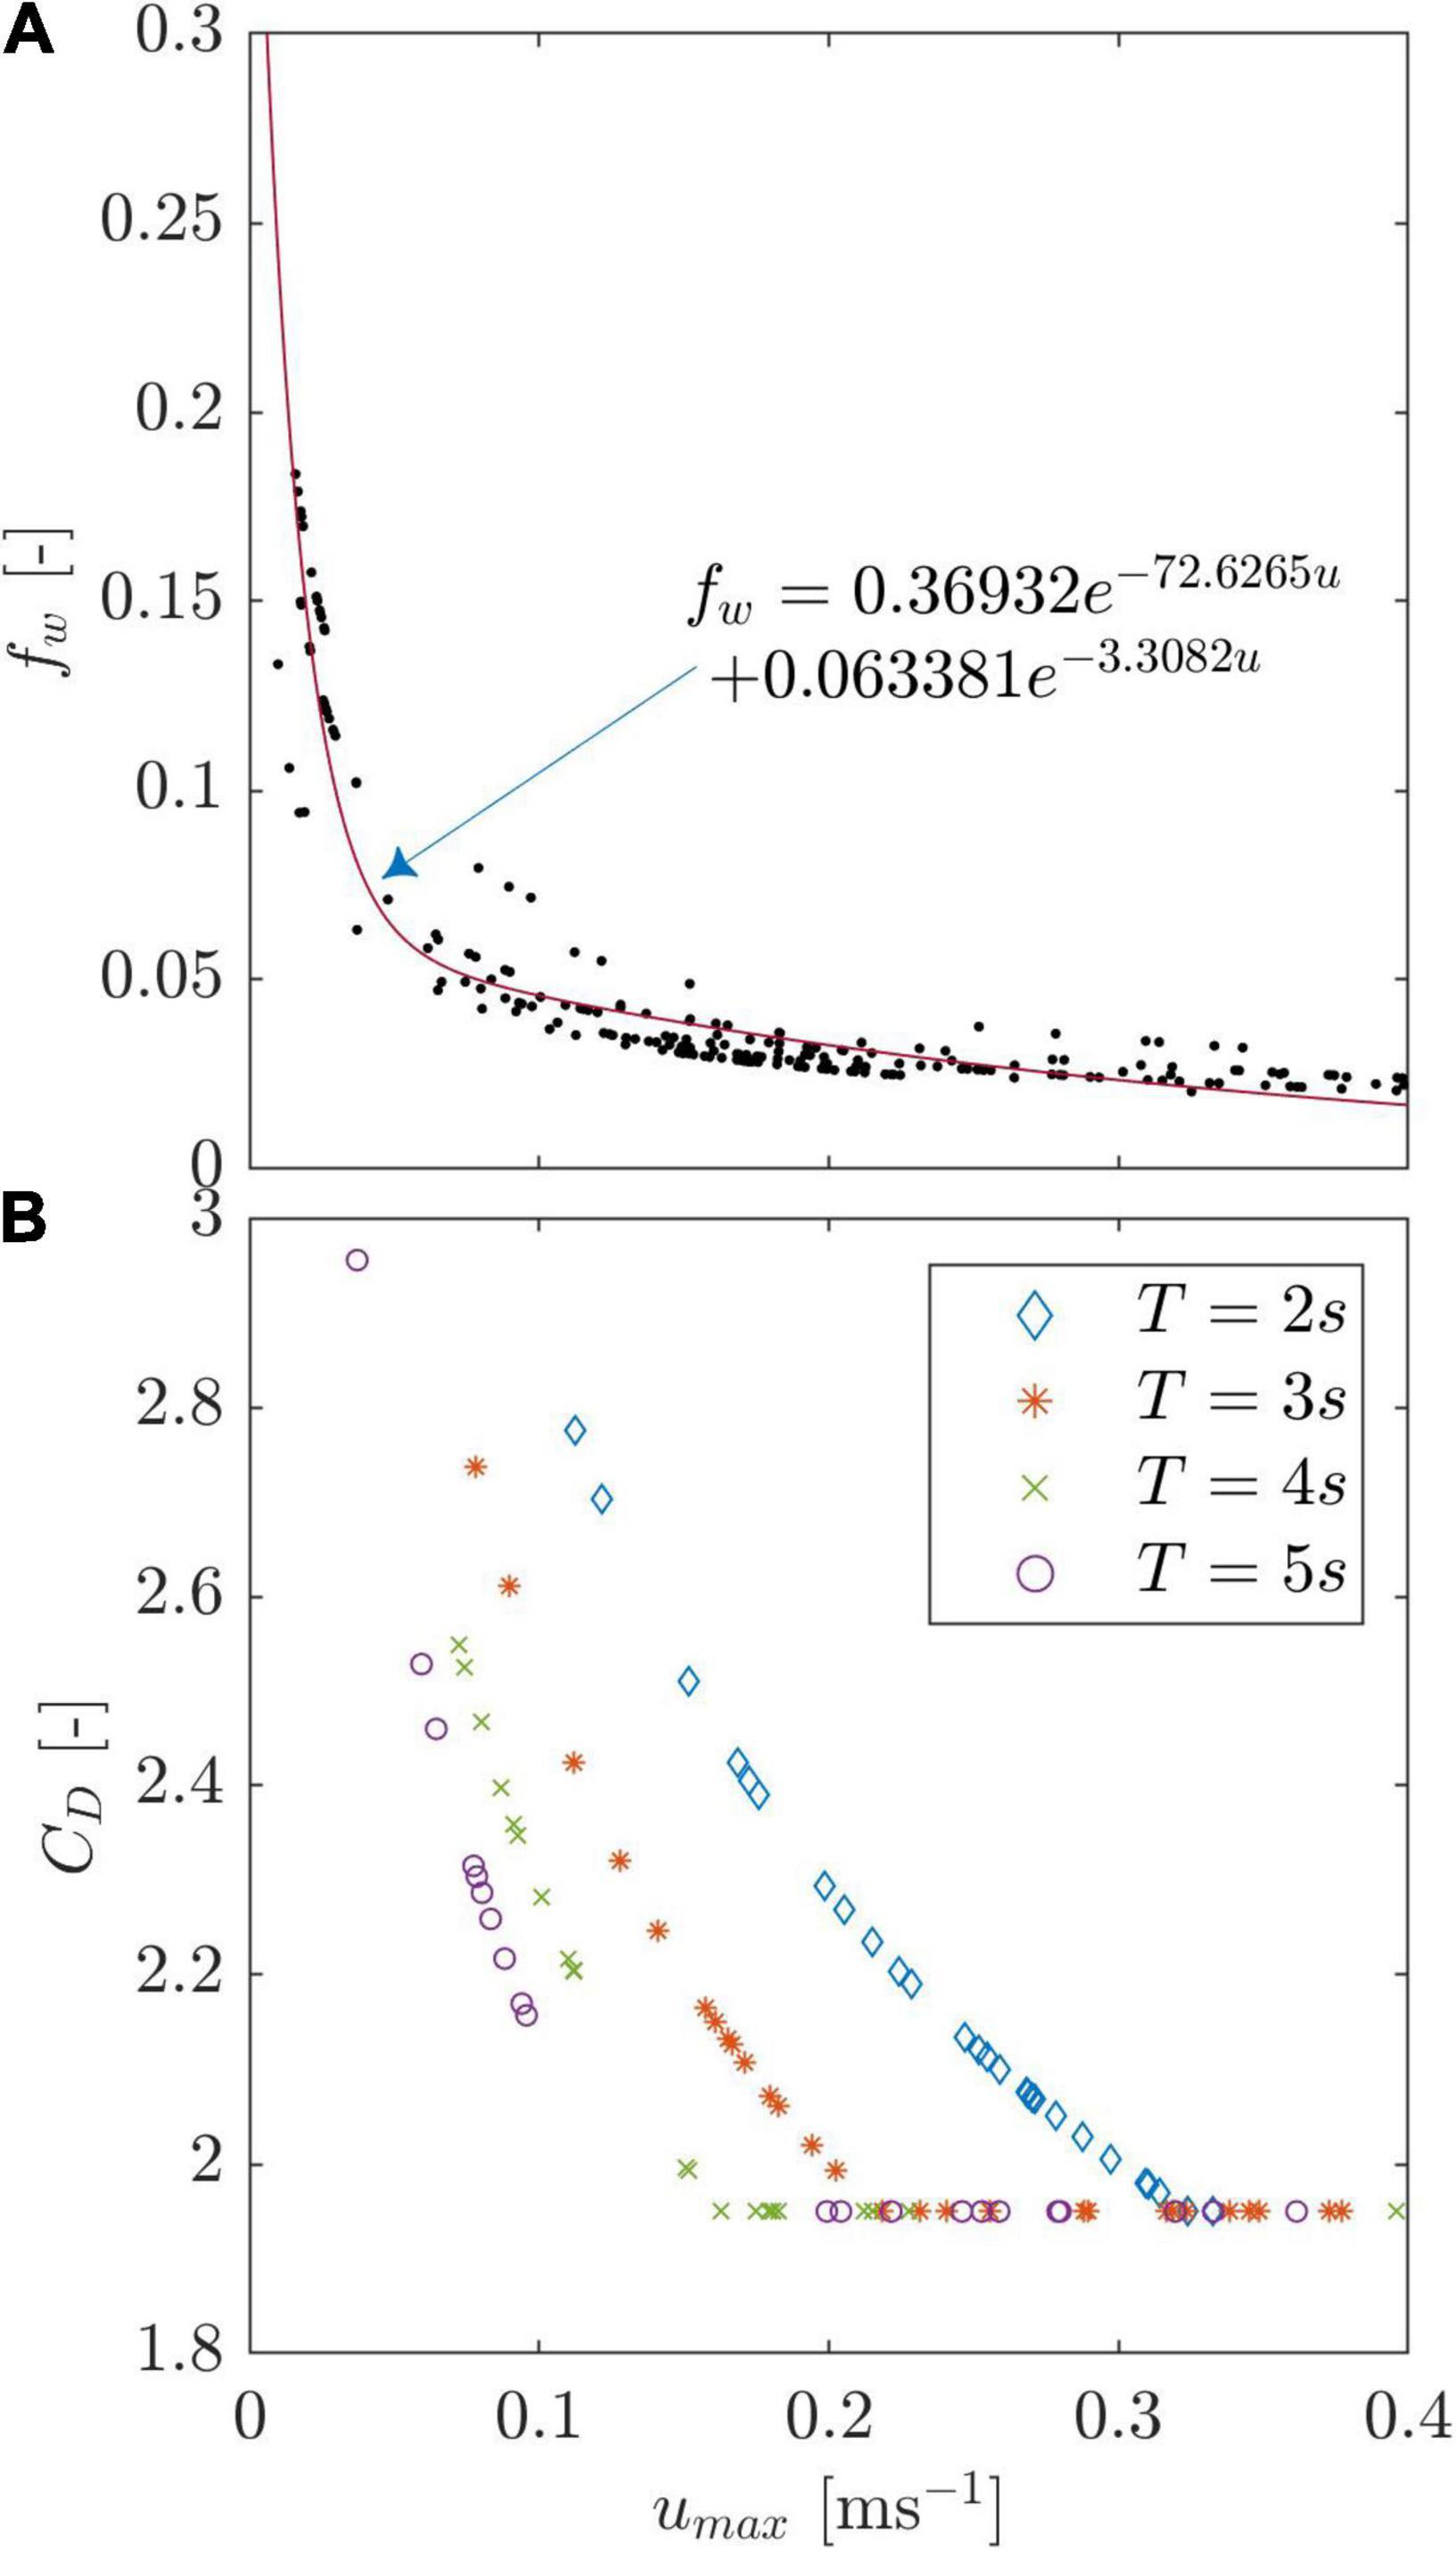
Figure 11. (A) Exponential fit (R2 = 0.92, RMSE = 0.0147) for the calculation of the friction factor fw for all sets of waves trialed (with and without artificial seagrass). Uncertainty given in Equation 12. (B) CD calculated from KC with CD=max(10KC−1/3,1.95) (Luhar and Nepf, 2016) as a function of the incident wave period T.
The ratio of fitted coefficients for the measured frontal and rear horizontal forces (Fx) was rα=3.08 ± 0.81 (Section “Modeled Forces”, uncertainty propagated from the fit coefficients αf and αr). Following Equation 11, Af = 1.51 m2 and Ar = 0.49 m2. Equation 12 was then used to calculate fw after which Equation 9 returned the modeled forces for the rear and frontal anchors (Figure 12). The unidirectional flow (Luhar and Nepf, 2011, c11 in Figure 12) and wave extension models (the extension by Luhar and Nepf, 2016, and the further extension by Lei and Nepf, 2019a; w16 and w19 in Figure 12) captured the measured forces well with the modeled forces using c11 yielding an R2 of 0.86 and 0.78 for the front and rear anchor forces, respectively, and 0.91 and > 0.73 for both wave-based extensions. The models predict forces at low velocities well, with c11 overestimating forces at velocities between 0.15 and 0.4 m s–1 and w19 overestimating them at umax > 0.4 m s–1. At the highest measured velocity, c11 and w16 predict a similar force (3% deviation from each other at both anchor positions), which also agrees well with the corresponding measured force (<10% deviation). w19, on the other hand, overpredicts the highest measured forces by a factor above 1.4. The forces modeled were dominated by the stem-based vegetation drag (Equation 7), with Fv corresponding, on average, to 95 ± 1.7% of Fx,mod,C and Fv,w to 93 ± 1% of Fx,mod,w. The contribution of the bed shear stress in our calculated model was therefore marginal.
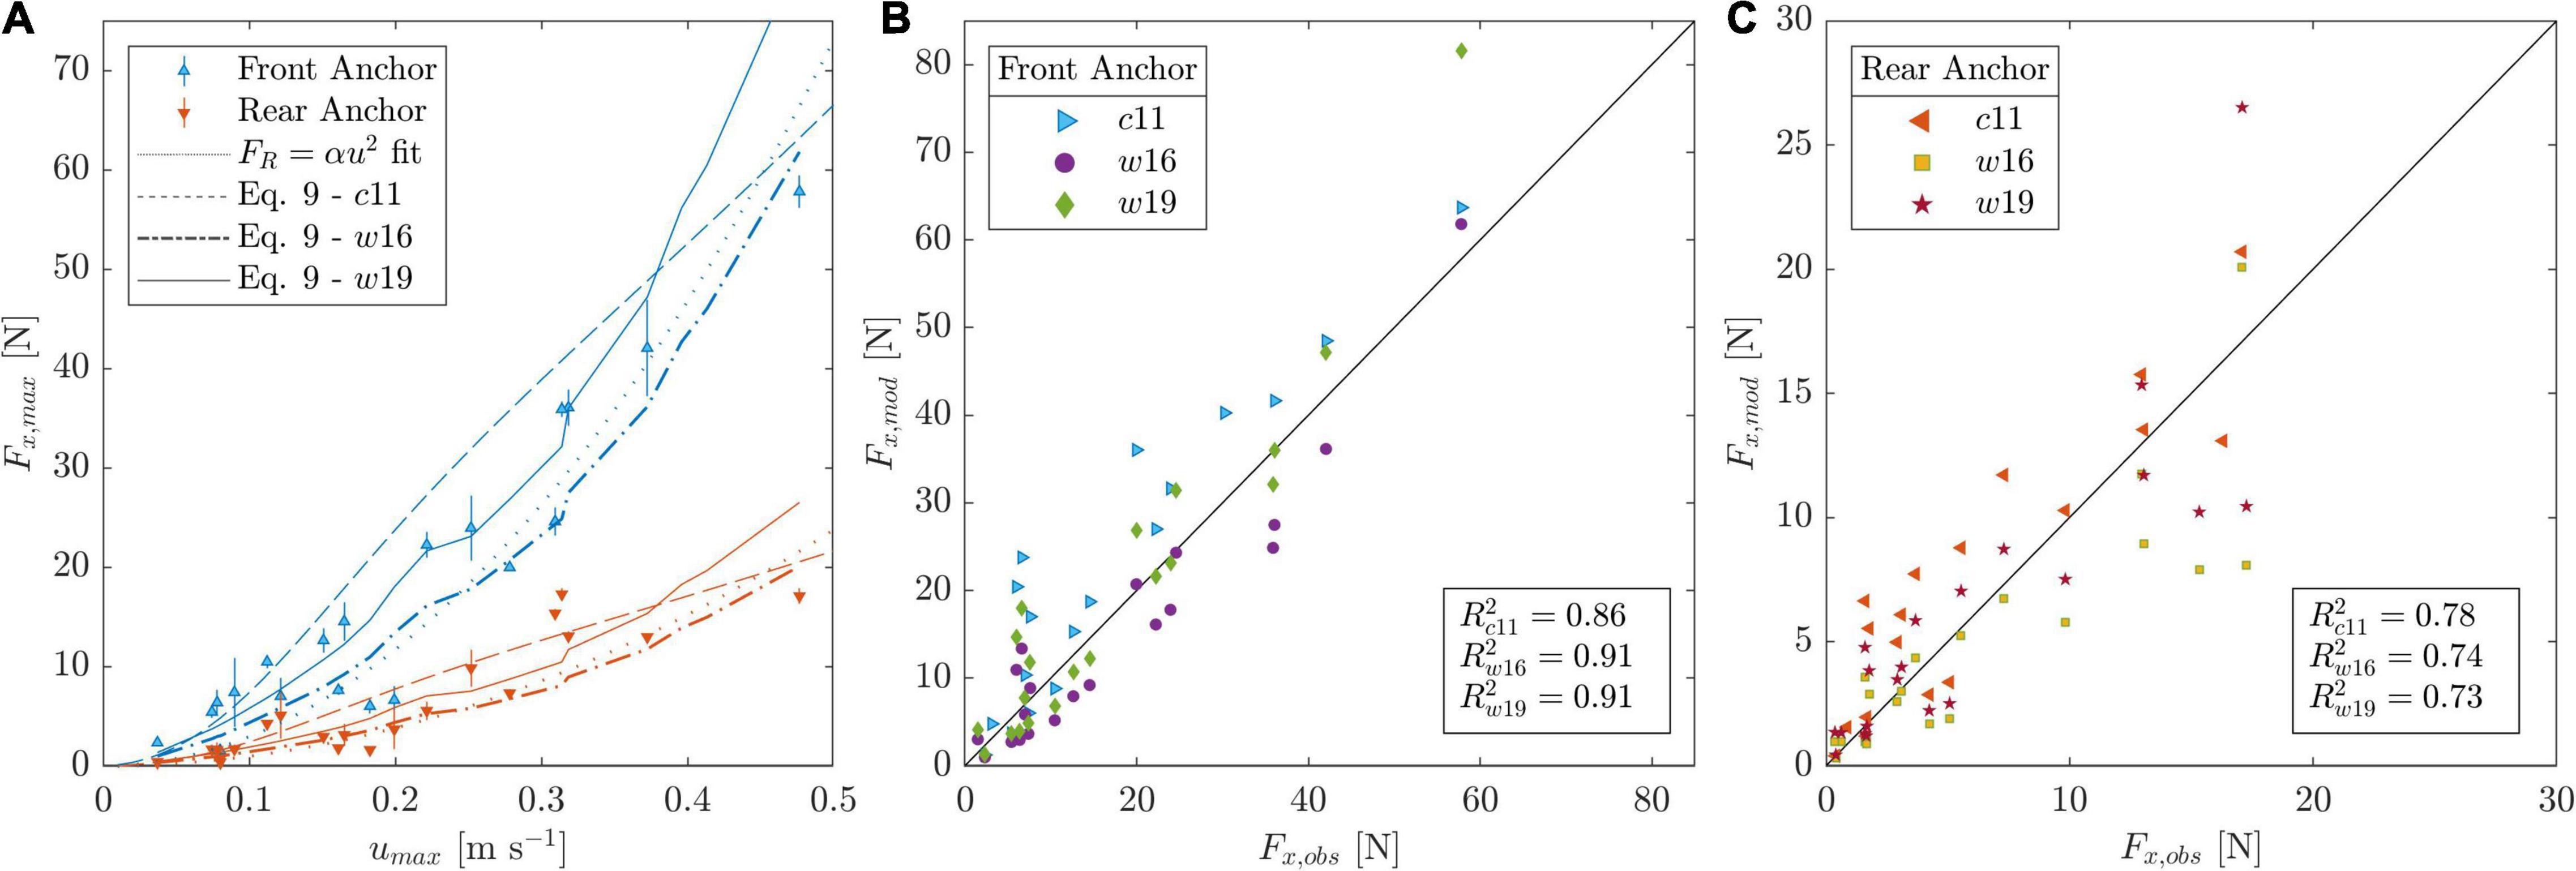
Figure 12. Measured (obs; using both 1 and 2-mat measurements) and modeled (mod) horizontal forces utilizing Equation 9 for the unidirectional flow forces model (c11) and wave-induced forces models (c16 and c19). (A) the maximum measured horizontal force and modeled forces as a function of the maximum horizontal orbital velocity umax. (B,C) show the plots of modeled versus observed forces depending on the anchor position. Note the different axis scales. Uncertainties of modeled forces and observations in panels (B,C) omitted for clarity.
Discussion
Wave-Induced Forces on Coir Mats
Geotextile mats subject to marine hydrodynamics will experience cyclic forces that analogously transfer into the anchoring points. Our experiments demonstrate that the magnitude of these forces depends on the geometric and mechanical properties of the mats, the number of anchoring points, and the hydrodynamic conditions. More interestingly, our results show that the wave-induced force distribution is also affected by the anchor position relative to the direction of wave propagation, discernably reflected in the difference in magnitude of the maximum forces measured between front and rear anchors.
Analogous to real vegetation, ASG increased drag forces under wave loading. The forces on anchors of ASG mats were considerably higher than for the bare mats. We can argue that the force surplus arises entirely from the surrogates; however, from CM, the forces coming from mats alone accounted for up to more than half of the measured forces with ASG, while the modeled vegetation drag could explain more than 90% of the measured force. Furthermore, the presence of a second ASG mat also affected the forces measured. One would expect the presence of a second mat to attenuate orbital velocities further, causing forces to sink. Surprisingly, our experiments showed the opposite behavior, with the measured forces increasing, on average, by a factor of 1.4 while the measured orbital velocities did not vary significantly. A possible reason for this could be recirculating currents within the meadows. It has been shown that flexible meadows create a recirculating current with an in-meadow mean flow in the direction of wave propagation (Luhar et al., 2010; Pujol et al., 2013). Rigid meadows can enhance the recirculating current forming a strong in-meadow +x current and above-meadow -x current (Pujol et al., 2013). van Veelen et al. (2020) corroborated this for rigid vegetation, stating that these are up to 70% more effective at wave attenuation compared to flexible vegetation, with the flexible meadows showing little effect on recirculation. Our chosen vegetation, albeit falling under the category of flexible, has a higher rigidity than the fully flexible blades used in the cited studies, as can be inferred from the range of resulting Ca (0.16 – 25). This may enhance the generation of a current within the meadow. An interaction between both meadows would then enhance this current, which is plausible for waves with wavelength greater than the gap between the meadows. Furthermore, van Rooijen et al. (2020) showed a positive (+x) mean wave velocity at the leading edge of the meadow, with a low mean and predominantly negative (-x) velocity in front and behind the meadow. This mean negative velocity may be influenced through the presence of the second meadow and the generated mean current within both meadows, which may drive the higher forces experienced with 2 mats. Contrastingly, El Allaoui et al. (2016) showed that, for a meadow gap longer than twice the vegetation height (as is the case here), the wave velocities between the meadows rapidly return to the no-vegetation values. Albeit analogous to our velocity measurements, this does not explain the increase in measured force. Measurement of forces with different number of mats and at all mats (instead of only the foremost mat) would be needed to further clarify this interaction and the governing mechanisms.
Effect of Mat Properties
A mat comprising of positively buoyant materials will sustain increased lift forces Fz due to the acting buoyant force, as was observed with the HDPE-wrapped mat (CM3). Otherwise, the lift forces were observed to be less relevant compared to the shear forces. Furthermore, swaying (the back and forth movement of the mats under wave loading) was observed to increase both lift and shear forces on the anchors, suggesting inertia (not taken into account here) may play a role for highly flexible mats. Mats of loose material (i.e., unwoven; here CM2 and CM3) showed a more prominent swaying motion than both CM1 and the AV mats which could be in part due to lower flow permissibility; i.e., the increased contact area on the closely packed fibers of CM2 and CM3 increase drag and friction, causing the mat to sway more. On the other hand, the AV mat, with a negatively buoyant ASG attached to it, was considerably heavier, which may reduce sway. Moreover, the increased forces may be accentuated by an underlying current created by a viscous sublayer between the mat and the bed generated during oscillatory motion, whereby a part of the water mass is redirected under the mat. Flow then separates into two domains, creating two opposite boundary layers and doubling the skin friction area (thus removing the 1/2 term in Equation 3).
The netting (CM1) – a woven coir fiber mat (Figure 3A) – logged the lowest forces which is likely due to its grid-like form; being a net, it does not cover the seabed homogeneously which translates into high flow permissibility, low drag and thus reduced sway. In our experiments, sway of CM1 was observed to be minimal. In addition, suspended sediment may deposit within the net thread spacing as these spaces correspond to no-flow zones, making the mat more prone to become buried under water movement which may in turn increase stability. A buried mat – even if only partially – reduces the loading on the anchors significantly as the tensile strength of the soil and mat increases (Subaida et al., 2008). Burial was marginally observed during our experiments, but a prolonged field deployment could prove that such a structure would have a high burial rate.
CM2 and CM3 contained an extra reinforcement made of PP and HDPE, respectively. The reinforcement envelops the coir fiber in order to increase resistance as these were originally designed for erosion control and slope stabilization. Our results should thence provide a starting point for the design of natural mats reinforced with biodegradable materials ultimately having similar bulk mechanical properties as those shown in Table 2. Such materials could be polybutylene succinate (PBS) and polybutylene adipate-co-terephthalate (PBAT), which have been proven to have similar properties to PP and HDPE (Xu and Guo, 2010), or a combination of both (PBSAT), shown to be significantly similar to polyamide (PA) (Seonghun et al., 2020). These materials have been tested in the field to replace conventional fishing nets with biodegradable nets whose tensile strength is adequate for fishing while being a potential solution to ghost fishing (Grimaldo et al., 2018).
Effect of the Number of Anchors
The number of anchors played an important role by controlling the freedom of movement of the mat as well as the corresponding area affecting each anchor. Here, going from a 4 to a 9-anchor configuration, the frontal and rear anchor forces were reduced by more than half for the unwoven fiber meshes, whilst the netting showed similar forces regardless of the number of anchors. This suggests that even with four anchors the drag force was not entirely transmitted to the nearest anchor but rather dissipated through thread elongation and friction between the bed and the mat.
The resultant forces were also observed to change in magnitude and direction depending on the number of anchors. A 4-anchor set-up resulted in a force normal to the wave propagation direction (Fy) comparable in magnitude to longitudinal forces (Fx). As Figures 5, 6 show, the maximum forces are directed toward the center of the mat, with many cases reaching Fy = Fx. For a 9-anchor configuration, the orthogonal forces (Fy) on central anchors are present on both sides of the anchor which means they cancel each other out. This would also be the case for any number of anchors set between the lateral edges of a mat of any width perpendicular to wave propagation, as long as the anchor separation is congruent. More anchors may reduce the forces each endures significantly, but can also increase the costs of installation, so that this would depend on the needed resistance of the anchors based on field conditions.
Importance of Anchor Position Relative to Wave Propagation Direction
For all cases (with and without ASG), frontal anchors showed higher forces than rear ones, thus showing that a major proportion of areal drag on a flexible mat falls upon the foremost anchors, simultaneously releasing stress on posterior ones (relative to the instantaneous orbital flow direction). Furthermore, maximum forces were predominantly higher in the wave propagation direction (+x) compared to its backward component (-x). These asymmetries may be attributed to bed interactions in shallow areas, which causes wave non-linearity (Figure 6). Higher but temporally shorter forces result from the analogous wave crests, whereas longer but weaker forces emanate at the trough. The more spontaneous +x loads may be decisive regarding the design force of the anchors and tensile strength of the mat. However, considering the longer-lasting -x force, tensile fatigue on the mats could potentially become a major concern for the threads and fibers (Xu et al., 2014) while under washing of the mats (and thus exposure of the anchors) could destabilize the mats and reduce anchoring strength (Bakker et al., 1973). Moreover, Stokes drift, i.e., mass transport in the direction of wave propagation, has been shown to be present within near bed structures, which may also help explain the dominant +x forces. Stokes drift has been shown to increase in the presence of submerged vegetation (Jacobsen, 2016) and other porous structures such as coral reefs (Webber and Huppert, 2021), which in turn is an essential mechanism for the healthy development of these ecosystems.
Modeled Forces on Artificial Seagrass
Many vegetation drag models deal with single stem drag; similarly, we used the stem drag and shoot density to calculate the total drag created by an artificial meadow per unit bed area. Note that this simplification does not take into account the interaction between elements, which can have an effect on drag. Lima et al. (2007) calculated the total drag of a meadow based on single stems, the number of elements and an adjustment coefficient to take these interactions into account. They stated that stem interaction leads to forces up to 4 times greater than single-stem calculations. Our experiments, however, did not corroborate this statement as the forces per unit area calculated based on single-stem-drag closely matched the forces measured at the anchors without the need of an adjustment coefficient. However, it is worth noting that the forces calculated here use a CD ≥ 1.95 for all cases. Nepf (1999) found that CD decreased with increasing stem density as a result of stem-to-stem interaction, which may explain why, in this type of models, there is no need for an adjustment coefficient to include stem-to-stem interaction as suggested by Lima et al. (2007).
Notwithstanding, the model used here (Equation 9) proved to be capable of predicting the anchor forces reasonably well, regardless of the approach used. The stem drag model developed for unidirectional flow (c11) accounted for 95% of the forces modeled, while the wave-based model (w16) accounted for 93%. This renders the contribution of bed shear stress in our proposed model almost negligible. The experimental results for CM showed that form drag also played a role on anchor forces, as the measured forces were higher than the calculated areal skin friction. Nonetheless, Carus et al. (2020) found that wave-induced bed shear stress was reduced due to the presence of ASG, which implies a low contribution of the friction drag compared to the form drag generated by the ASG. Furthermore, the swaying motion may call for the calculation of a relative velocity to calculate the fw (u′ = u – umat, where u′ is the relative velocity and umat is the mat velocity), whereby fw, hence τb,w, would be reduced even further. Mat motion was not measured here, so this relative velocity was not taken into account. The reduction of τb,w may explain why the modeled vegetation drag corresponded to such a high portion of the force measured at the anchor, undermining the contribution of the mats. Whilst the maximum calculated τb,w was 2 N m–2 for velocities of about 0.4 m s–1, the anchors of CM2 and CM3 registered forces up to 20 N m–2 within the same velocity range (assuming the same front-rear distribution of area Aap as calculated for AV). This denotes a higher contribution of form drag and dynamic loading (e.g., edge-flapping of the highly flexible mats) for the CM mats than just friction drag. Moreover, the characteristic area Aap used here, albeit a simplification, does not make the model less robust, as Equation 9 may also be implemented without Aap to obtain the force per unit area [N m–2] of meadow, which, for 2 m2 (i.e., the sum of the front and rear anchor forces on one side of the mat), was accurately predicted here.
Design Considerations and Implications for Restoration
Previous approaches have shown that, for artificial seagrass mats used for erosion control, anchors buried 1 m deep utilizing hydraulic hammers are more than enough for any expected extreme load (Jones et al., 2006). However, these anchors may be expensive and cumbersome to install. Our experiments show that, for the range of near-bed velocities, the expected forces are not necessarily in the order of kN, so that shallow anchoring or other techniques (e.g., sand tubes) may suffice as long as site selection follow guidelines for restoration (i.e., areas of low hydrodynamic forcing; van Katwijk et al., 2016). Moreover, although increasing the number of anchors may reduce loads, it can increase costs. A four-anchor configuration may be enough for relatively small mats (e.g., 2 × 2 m, as done here) as long as the mat provides high flow permissibility and low buoyancy, and is thus not subject to increased swaying motion. Equation 9 can then provide an estimation of the expected maximum loads depending on the hydrodynamic conditions and ASG properties. As the direction of wave propagation can change periodically depending on the site, these maximum forces should be considered for all anchors. Additionally, a safety factor to account for extreme events can be implemented for field trials. A suitable safety factor will depend greatly on the anchor set-up and mat materials, as these, similar to mooring line design, will determine the rate of fatigue and ultimately failure of the system (Huang and Pan, 2010). Note, however, that in contrast to our findings, mooring line anchors suffer proportionally higher Fz loads compared to shear, and are also subject to snap loads (i.e., abrupt, lagged loads arising from the near-surface oscillatory motion; Landmann et al., 2021) which can be orders of magnitude higher than what we can expect for the mats.
Regarding field applications and restoration, our tests suggest that a woven fabric mat will perform better due to higher flow permissibility and reduced anchor loading, with accelerated burial and facilitation of growth within the mat as positive feedbacks. A stable mat such as CM3 with an increased number of anchors (9-anchor configuration) also showed to incur lower forces at the anchors. Nevertheless, the geometrical properties of ASG need to be carefully chosen as these readily affect the intrinsic surrounding hydro and morphodynamics. Shoot density and canopy height proportionally affect sediment deposition and resuspension (Chen et al., 2007) which in turn affects seagrass growth and the subsequent survival stability (Adams et al., 2016). The stability of the materials likewise plays an important role, especially if biodegradable alternatives are set to be used. Irving et al. (2014) reported that biodegradable jute bags with coarse weaving can facilitate seagrass growth, specifically Amphibolis antarctica in southern Australia, through increased sediment and seed fixation. In addition, Wear et al. (2010) reported a drastic decrease in newly recruited seagrass 3 years after deployment due to degradation of the bags and wave loading, thus accentuating the need for biodegradability and temporal stability studies of ASG and mat candidates used for restoration. Moreover, field experiments are also needed as other environmental factors can affect anchor loading and mat performance. For example, the formation of biofilm and settlement of epiphytes on the ASG may have a marked effect, whereby some studies state that epiphytes reduce the drag coefficient (Hansen et al., 2014), while others found that epiphytes could increase drag up to 50% in macroalgae (Anderson and Martone, 2014). Ultimately, this study provides the basis to determine the expected anchor forces based on validated models of drag on marine vegetation. Moreover, the proposed formula can be applied with basic knowledge of field conditions and proposed materials for the ASG mats. Ultimately, restoration success will be achieved through field experiments. Valuable information to gather in future experiments includes the evaluation of the degradation times, burial rates and its effect on loads, changes in mechanical and chemical properties of the biodegradable materials, quantifying anchor fatigue, and assessing the lifetime of the ASG mats within the context of restoration.
Conclusion
This study was set up to understand the loading on the anchoring points of geotextile mats deployed in marine conditions. We measured forces on the anchors of coir-based geotextiles in a wave flume, testing coir mats of different construction and varying the number of anchors used to fix the mats to a mobile sand bed. We subsequently measured the forces on a mat covered in artificial seagrass (ASG) whose application in the field can be to provide shelter for growing seedlings during restoration projects. This should inform future pilot projects on the design considerations of biodegradable ASG mats to be deployed on the field.
Our results showed that the loading on each anchor will depend on (i) the hydrodynamic conditions, e.g., water depth, wave height and wave period; (ii) the number of anchors set and the distance between them as well as their position relative to the wave propagation direction; and (iii) the mechanical composition and properties the mats. The hydrodynamic conditions are going to depend highly on the selected site for restoration. Sites with lower wave periods and higher wave heights may produce higher maximum loads, while longer wave periods will produce longer lasting loads which may be detrimental to the mats and anchors. Further, the use of more anchors can reduce the forces each anchor sustains; however, it is more important to choose a material that allows for through-flow, e.g., a net of woven coir fabric or any other grid-like structure. This would in turn reduce the number of anchors needed as the reduced oscillatory motion translates to reduced forcing. The forces on the anchors are dominated by the drag on the flexible ASG, which we tested empirically and compared to existing models for drag on single stems. The models, with the addition of a small contribution from bed friction, were able to provide reasonable estimates of the forces that are to be expected at the anchors based on the corresponding area for each anchor. Anchors facing incoming waves were found to take twice the load of the anchor further into the mat in the direction of wave propagation, after which the proportional corresponding area can be calculated. This proportion was found for a 2-m mat and needs to be investigated further in order to find a dimensionless value applicable to any mat length. Ultimately, knowing the target field conditions and the mechanical properties of the chosen ASG should then be enough to gain insights on the forces incurred by the anchors during deployment.
Data Availability Statement
The datasets generated and analyzed during the current study are available from the corresponding author on reasonable request.
Author Contributions
MP and TS designed the SeaArt research project and secured the funding. RV performed the experiments, carried out the data curation and formal analysis, investigated the data, wrote the original draft preparation, and conceptualized the experimental procedure, which was optimized by all authors. All authors reviewed the manuscript.
Funding
This study was part of the collaborative project “SeaArt – Long term establishment of SEAgrass ecosystems through biodegradable ARTificial meadows,” funded by the Niedersächsisches Vorab and Ministry of Science and Culture (MWK) of the Federal state of Lower Saxony under Grant No. ZN3187.
Conflict of Interest
The authors declare that the research was conducted in the absence of any commercial or financial relationships that could be construed as a potential conflict of interest.
Publisher’s Note
All claims expressed in this article are solely those of the authors and do not necessarily represent those of their affiliated organizations, or those of the publisher, the editors and the reviewers. Any product that may be evaluated in this article, or claim that may be made by its manufacturer, is not guaranteed or endorsed by the publisher.
Acknowledgments
We thank our project partners Soiltec GmbH and IfBB Hannover for providing the mats with their respective technical data sheets and information the insights into biodegradable materials, respectively. We also thank our students N. Ittera, B. Sarma, F. Neumann, M. Müller, and T. Kulkarni for their valuable support during set up and execution of the experiments. Finally, we thank the valuable input from the reviewers whose comments helped improve the clarity and enhanced the overall quality of the manuscript.
References
Adams, M. P., Hovey, R. K., Hipsey, M. R., Bruce, L. C., Ghisalberti, M., Lowe, R. J., et al. (2016). Feedback between sediment and light for seagrass: where is it important? Limnol. Oceanogr. 61, 1937–1955. doi: 10.1002/lno.10319
Anderson, L. M., and Martone, P. T. (2014). Biomechanical consequences of epiphytism in intertidal macroalgae. J. Exp. Biol. 217, 1167–1174.
Bakker, I., Bax, J., Grootenboer, D., and Tutuarima, I. (1973). Artificial seaweed Coastal and submarine-pipeline protection studies with stretched polypropylene foam strands. Houille Blanche 8, 661–676. doi: 10.1051/lhb/1973047
Barbier, E., Hacker, S., Kennedy, C., Koch, E., Stier, A., and Silliman, B. (2011). The value of estuarine and coastal ecosystem services. Ecol. Monogr. 81, 169–193.
Bouma, T. J., de Vries, M. B., Low, E., Peralta, G., Tánczos, I. C., van de Koppel, J., et al. (2005). Trade-offs related to ecosystem engineering: a case study on stiffness of emerging macrophytes. Ecology 86, 2187–2199.
Bricker, J. D., Inagaki, S., and Monismith, S. G. (2005). Bed drag coefficient variability under wind waves in a tidal estuary. J. Hydraul. Eng. 131, 497–508. doi: 10.1061/(asce)0733-94292005131:6(497)
Campbell, M. L., and Paling, E. I. (2003). Evaluating vegetative transplant success in Posidonia australis: a field trial with habitat enhancement. Mar. Pollut. Bull. 46, 828–834. doi: 10.1016/S0025-326X(03)00093-6
Carus, J., Arndt, C., Bouma, T. J., Schröder, B., and Paul, M. (2020). Effect of artificial seagrass on hydrodynamic thresholds for the early establishment of Zostera marina. J. Ecohydraul. 71, 1–11. doi: 10.1080/24705357.2020.1858197
Carus, J., Arndt, C., Schröder, B., Thom, M., Villanueva, R., and Paul, M. (2021). Using artificial seagrass for promoting positive feedback mechanisms in seagrass restoration. Front. Mar. Sci. 8:546661. doi: 10.3389/fmars.2021.546661
Chen, S. N., Sanford, L. P., Koch, E. W., Shi, F., and North, E. W. (2007). A nearshore model to investigate the effects of seagrass bed geometry on wave attenuation and suspended sediment transport. Estuar. Coasts 30, 296–310. doi: 10.1007/BF02700172
Cullen-Unsworth, L. C., and Unsworth, R. (2018). A call for seagrass protection. Science 361, 446–448. doi: 10.1126/science.aat7318
David, C. G., Schulz, N., and Schlurmann, T. (2016). Assessing the application potential of selected ecosystem-based, low-regret coastal protection measures. Adv. Nat. Technol. Hazards Res. 42, 457–482. doi: 10.1007/978-3-319-43633-3_20
El Allaoui, N., Serra, T., Colomer, J., Soler, M., Casamitjana, X., and Oldham, C. (2016). Interactions between fragmented seagrass canopies and the local hydrodynamics. PLoS One 11:e0156264. doi: 10.1371/J.pone.0156264
Fonseca, M. S., Zieman, J. C., Thayer, G. W., and Fisher, J. S. (1983). The role of current velocity in structuring eelgrass (Zostera marina L.) meadows. Estuar. Coast. Shelf Sci. 17, 367–380. doi: 10.1016/0272-7714(83)90123-3
Fourqurean, J. W., Duarte, C. M., Kennedy, H., Marbà, N., Holmer, M., Mateo, A. M., et al. (2012). Seagrass ecosystems as a globally significant carbon stock. Nat. Geosci. 5, 505–509. doi: 10.1038/ngeo1477
Goring, D. G., and Nikora, V. I. (2002). Despiking acoustic doppler velocimeter data. J. Hydraul. Eng. 128, 117–126. doi: 10.1061/(asce)0733-94292002128:1(117)
Grimaldo, E., Herrmann, B., Vollstad, J., Su, B., Moe Føre, H., Larsen, R. B., et al. (2018). Fishing efficiency of biodegradable PBSAT gillnets and conventional nylon gillnets used in Norwegian cod (Gadus morhua) and saithe (Pollachius virens) fisheries. ICES J. Mar. Sci. 75, 2245–2256.
Hansen, A. T., Hondzo, M., Sheng, J., and Sadowsky, M. J. (2014). Microscale measurements reveal contrasting effects of photosynthesis and epiphytes on frictional drag on the surfaces of filamentous algae. Freshw. Biol. 59, 312–324. doi: 10.1111/FWB.12266
Huang, C. C., and Pan, J. Y. (2010). Mooring line fatigue: a risk analysis for an SPM cage system. Aquac. Eng. 42, 8–16. doi: 10.1016/J.AQUAENG.2009.09.002
Irving, A. D., Tanner, J. E., and Collings, G. J. (2014). Rehabilitating seagrass by facilitating recruitment: improving chances for success. Restor. Ecol. 22, 134–141. doi: 10.1111/REC.12036
Ismail, H. (2003). “Value-Added shore protection structures for the enhancement of marine ecosystem services,” in Proceedings of the 2003 Technical Seminar on Shoreline Management (San Francisco, CA: Academia.edu).
Jacobsen, N. G. (2016). Wave-averaged properties in a submerged canopy: energy density, energy flux, radiation stresses and Stokes drift. Coast. Eng. 117, 57–69. doi: 10.1016/J.COASTALENG.2016.07.009
Jacobsen, N. G., Bakker, W., Uijttewaal, W. S., and Uittenbogaard, R. (2019). Experimental investigation of the wave-induced motion of and force distribution along a flexible stem. J. Fluid Mech. 880, 1036–1069.
Jones, B. N., Hillier, T. S., Partridge, D. J., and Fagan, L. (2006). “Artificial frond system for seabed scour control at wind farm platforms in Nantucket Sound, Massachusetts,” in Proceedings of the Sixth International Conference on Civil Engineering in the Oceans, (Reston, VA: American Society of Civil Engineers), 246–254. doi: 10.1061/40775(182)19
Kerpen, N. B., Schlurmann, T., Schendel, A., Gundlach, J., Marquard, D., and Hüpgen, M. (2020). Wave-induced distribution of microplastic in the surf zone. Front. Mar. Sci. 7:590565. doi: 10.3389/fmars.2020.590565
Kobayashi, N., Raichle, A. W., and Asano, T. (1993). Wave attenuation by vegetation. J. Waterw. Port Coast. Ocean Eng. 119, 30–48. doi: 10.3390/s20226621
Koch, E. W., Ailstock, M. S., Booth, D. M., Shafer, D. J., and Magoun, A. D. (2010). The Role of currents and waves in the dispersal of submersed angiosperm seeds and seedlings. Restor. Ecol. 18, 584–595. doi: 10.1111/j.1526-100X.2010.00698.x
Landmann, J., Fröhling, L., Gieschen, R., Buck, B. H., Heasman, K., Scott, N., et al. (2021). New system design for the cultivation of extractive species at exposed sites – Part 2: experimental modelling in waves and currents. Appl. Ocean Res. 113:102749. doi: 10.1016/J.APOR.2021.102749
Lei, J., and Nepf, H. (2019a). Wave damping by flexible vegetation: connecting individual blade dynamics to the meadow scale. Coast. Eng. 147, 138–148. doi: 10.1016/j.coastaleng.2019.01.008
Lei, J., and Nepf, H. (2019b). Blade dynamics in combined waves and current. J. Fluids Struct. 87, 137–149. doi: 10.1016/j.jfluidstructs.2019.03.020
Lima, S. F., Neves, C. F., and Rosauro, N. M. L. (2007). Damping of gravity waves by fields of flexible vegetation. Coast. Eng. Proc. 1, 491–503. doi: 10.1142/9789812709554_0043
Losada, I. J., Maza, M., and Lara, J. L. (2016). A new formulation for vegetation-induced damping under combined waves and currents. Coast. Eng. 107, 1–13. doi: 10.1016/j.coastaleng.2015.09.011
Luhar, M., and Nepf, H. M. (2011). Flow-induced reconfiguration of buoyant and flexible aquatic vegetation. Limnol. Oceanogr. 56, 2003–2017. doi: 10.4319/lo.2011.56.6.2003
Luhar, M., and Nepf, H. M. (2016). Wave-induced dynamics of flexible blades. J. Fluids Struct. 61, 20–41. doi: 10.1016/J.JFLUIDSTRUCTS.2015.11.007
Luhar, M., Coutu, S., Infantes, E., Fox, S., and Nepf, H. (2010). Wave-induced velocities inside a model seagrass bed. J. Geophys. Res. C Oceans 115, 1–15. doi: 10.1029/2010JC006345
R. Mallée and R. (eds.) Eligehausen (2013). Design of Fastenings for Use in Concrete: The CEN/TS 1992-4 Provisions. Hoboken, NJ: John Wiley and Sons.
Marques, A. R., Santiago de Oliveira Patrício, P., Soares dos Santos, F., Monteiro, M. L., de Carvalho Urashima, D., and de Souza Rodrigues, C. (2014). Effects of the climatic conditions of the southeastern Brazil on degradation the fibers of coir-geotextile: evaluation of mechanical and structural properties. Geotext. Geomembr. 42, 76–82. doi: 10.1016/j.geotexmem.2013.07.004
Marriott, M. J., and Jayaratne, R. (2010). “Hydraulic roughness-links between Manning’s coefficient, Nikuradse’s equivalent sand roughness and bed grain size,” in Proceedings of the Advances in Computing and Technology, (AC&T) The School of Computing and Technology 5th Annual Conference, (London: University of East London), 27–32.
Mendez, F. J., and Losada, I. J. (2004). An empirical model to estimate the propagation of random breaking and nonbreaking waves over vegetation fields. Coast. Eng. 51, 103–118. doi: 10.1016/j.coastaleng.2003.11.003
Miller, D. E., Hoitsma, T. R., and White, D. J. (1998). “Degradation rates of woven coir fabric under field conditions,” in Proceedings of the Wetlands Engineering and River Restoration Conference 1998 March 22-27, ed. D. F. Hayes (Reston, VA: American Society of Civil Engineers), 266–271. doi: 10.1061/40382199846
Nepf, H. M. (1999). Drag, turbulence, and diffusion in flow through emergent vegetation. Water Resour. Res. 35, 479–489. doi: 10.1029/1998WR900069
Nepf, H. M. (2011). Flow and transport in regions with aquatic vegetation. Annu. Rev. Fluid Mech. 44, 123–142. doi: 10.1146/annurev-fluid-120710-101048
Ondiviela, B., Losada, I. J., Lara, J. L., Maza, M., Galván, C., Bouma, T. J., et al. (2014). The role of seagrasses in coastal protection in a changing climate. Coast. Eng. 87, 158–168. doi: 10.1016/j.coastaleng.2013.11.005
Pascolo, S., Petti, M., and Bosa, S. (2018). On the wave bottom shear stress in shallow depths: the role of wave period and bed roughness. Water (Switzerland) 10:1348. doi: 10.3390/w10101348
Paul, M., Rupprecht, F., Möller, I., Bouma, T. J., Spencer, T., Kudella, M., et al. (2016). Plant stiffness and biomass as drivers for drag forces under extreme wave loading: a flume study on mimics. Coast. Eng. 117, 70–78. doi: 10.1016/j.coastaleng.2016.07.004
Peña, E., Ferreras, J., and Sanchez-Tembleque, F. (2011). Experimental study on wave transmission coefficient, mooring lines and module connector forces with different designs of floating breakwaters. Ocean Eng. 38, 1150–1160. doi: 10.1016/J.OCEANENG.2011.05.005
Pujol, D., Serra, T., Colomer, J., and Casamitjana, X. (2013). Flow structure in canopy models dominated by progressive waves. J. Hydrol. 486, 281–292. doi: 10.1146/annurev-marine-042120-071823
Rickson, R. J. (2006). Controlling sediment at source: an evaluation of erosion control geotextiles. Earth Surf. Process. Landforms 31, 550–560. doi: 10.1002/esp.1368
Seonghun, K., Pyungkwan, K., Seongjae, J., and Kyounghoon, L. (2020). Assessment of the physical characteristics and fishing performance of gillnets using biodegradable resin (PBS/PBAT and PBSAT) to reduce ghost fishing. Aquat. Conserv. Mar. Freshw. Ecosyst. 30, 1868–1884.
Short, F., Carruthers, T., Dennison, W., and Waycott, M. (2007). Global seagrass distribution and diversity: a bioregional model. J. Exp. Mar. Biol. Ecol. 350, 3–20. doi: 10.1016/j.jembe.2007.06.012
Soulsby, R. L. (1997). Dynamics of Marine Sands: A Manual for Practical Applications. Report SR 466. Wallingford: HR Wallingford Group Ltd, for Department of the Environment.
Subaida, E. A., Chandrakaran, S., and Sankar, N. (2008). Experimental investigations on tensile and pullout behaviour of woven coir geotextiles. Geotext. Geomembr. 26, 384–392. doi: 10.1016/j.geotexmem.2008.02.005
Sulaiman, M. S., Sinnakaudan, S. K., and Shukor, M. R. (2013). Near bed turbulence measurement with acoustic doppler velocimeter (ADV). KSCE J. Civil Eng. 17, 1515–1528. doi: 10.1007/s12205-013-0084-8
Taphorn, M., Villanueva, R., Paul, M., Visscher, J., and Schlurmann, T. (2021). Flow field and wake structure characteristics imposed by single seagrass blade surrogates. J. Ecohydraul. 7, 1–13. doi: 10.1080/24705357.2021.1938253
The Nature Conservancy (2021). The Blue Guide to Coastal Resilience: Protecting Coastal Communities Through Nature-Based Solutions. A Handbook for Practitioners of Disaster Risk Reduction. Arlington, VA: The Nature Conservancy.
Unsworth, R. K. F., McKenzie, L. J., Collier, C. J., Cullen-Unsworth, L. C., Duarte, C. M., Eklöf, J., et al. (2019). Global challenges for seagrass conservation. Ambio 48, 801–815. doi: 10.1007/s13280-018-1115-y
van Katwijk, M. M., Thorhaug, A., Marbà, N., Orth, R. J., Duarte, C. M., Kendrick, G. A., et al. (2016). Global analysis of seagrass restoration: the importance of large-scale planting. J. Appl. Ecol. 53, 567–578. doi: 10.1111/1365-2664.12562
van Rooijen, A., Lowe, R., Rijnsdorp, D. P., Ghisalberti, M., Jacobsen, N. G., and McCall, R. (2020). Wave-driven mean flow dynamics in submerged canopies. J. Geophys. Res. Oceans 125:e2019JC015935.
van Veelen, T. J., Fairchild, T. P., Reeve, D. E., and Karunarathna, H. (2020). Experimental study on vegetation flexibility as control parameter for wave damping and velocity structure. Coast. Eng. 157:103648.
van Veelen, T. J., Karunarathna, H., and Reeve, D. E. (2021). Modelling wave attenuation by quasi-flexible coastal vegetation. Coast. Eng. 164:103820. doi: 10.1016/j.coastaleng.2020.103820
Villanueva, R., Thom, M., Visscher, J., Paul, M., and Schlurmann, T. (2021). Wake length of an artificial seagrass meadow: a study of shelter and its feasibility for restoration. J. Ecohydraul. 7, 1–15. doi: 10.1080/24705357.2021.1938256
Waycott, M., Duarte, C. M., Carruthers, T. J. B., Orth, R. J., Dennison, W. C., Olyarnik, S., et al. (2009). Accelerating loss of seagrasses across the globe threatens coastal ecosystems. Proc. Natl. Acad. Sci. U.S.A. 106, 12377–12381. doi: 10.1073/pnas.0905620106
Wear, R. J., Tanner, J. E., Hoare, S. L., Wear, R. J., Tanner, J. E., and Hoare, S. L. (2010). Facilitating recruitment of Amphibolis as a novel approach to seagrass rehabilitation in hydrodynamically active waters. Mar. Freshw. Res. 61, 1123–1133. doi: 10.1071/MF09314
Webber, J. J., and Huppert, H. E. (2021). Stokes drift through corals. Environ. Fluid Mech. 21, 37–55. doi: 10.1007/s10652-021-09811-8
Wright, S. L., Thompson, R. C., and Galloway, T. S. (2013). The physical impacts of microplastics on marine organisms: a review. Environ. Pollut. (Barking, Essex?: 1987) 178, 483–492. doi: 10.1016/j.envpol.2013.02.031
Xu, J., and Guo, B. H. (2010). “Microbial succinic acid, its polymer poly (butylene succinate), and applications,” in Plastics From Bacteria, Vol. 14, ed. G. Q. Chen (Berlin: Springer), 347–388.
Keywords: wave forcing, artificial seagrass, ecosystem restoration, anchors, coir, geotextiles
Citation: Villanueva R, Paul M and Schlurmann T (2022) Anchor Forces on Coir-Based Artificial Seagrass Mats: Dependence on Wave Dynamics and Their Potential Use in Seagrass Restoration. Front. Mar. Sci. 9:802343. doi: 10.3389/fmars.2022.802343
Received: 26 October 2021; Accepted: 22 February 2022;
Published: 29 March 2022.
Edited by:
Maria Maza, University of Cantabria, SpainReviewed by:
Beena Mary John, Cochin University of Science and Technology, IndiaDavide Vettori, Politecnico di Torino, Italy
Jiarui Lei, National University of Singapore, Singapore
Copyright © 2022 Villanueva, Paul and Schlurmann. This is an open-access article distributed under the terms of the Creative Commons Attribution License (CC BY). The use, distribution or reproduction in other forums is permitted, provided the original author(s) and the copyright owner(s) are credited and that the original publication in this journal is cited, in accordance with accepted academic practice. No use, distribution or reproduction is permitted which does not comply with these terms.
*Correspondence: Raúl Villanueva, villanueva@lufi.uni-hannover.de