Spatiotemporal Patterns in the Biomass of Drift Macroalgae in the Indian River Lagoon, Florida, United States
 Lauren M. Hall1*
  Lori J. Morris2
  Robert H. Chamberlain2
  M. Dennis Hanisak3
  Robert W. Virnstein2,4
  Richard Paperno5
  Bernhard Riegl6
  L. Rex Ellis2
  Ali Simpson2
  Charles A. Jacoby2
- 1St. Johns River Water Management District, Palm Bay, FL, United States
- 2St. Johns River Water Management District, Palatka, FL, United States
- 3Harbor Branch Oceanographic Institute, Florida Atlantic University, Fort Pierce, FL, United States
- 4Seagrass Ecosystems Analysts, Gainesville, FL, United States
- 5Florida Fish and Wildlife Conservation Commission, Melbourne, FL, United States
- 6Department of Marine and Environmental Sciences, Halmos College of Arts and Sciences, Nova Southeastern University, Dania Beach, FL, United States
Drift macroalgae plays key roles in the ecology of many coastal systems, including the Indian River Lagoon. In the lagoon, changes in the biomass of drift macroalgae may have interacted with an unprecedented bloom of phytoplankton in 2011. Patterns in the biomass of drift macroalgae were identified using new and original analyses of data from several sampling programs collected between 1997 and 2019. All available data show a relatively low biomass of drift macroalgae in 2010–2012, and surveys of fixed transects and seining as part of a fisheries independent monitoring program also recorded low biomass in 2016. Low light availability and potentially stressful temperatures appeared to be the main influences as indicated by the results of incubations in tanks to determine environmental tolerances and data on ambient conditions. Decreased biomass of drift macroalgae had implications for cycling of nutrients because carbon, nitrogen, and phosphorus not stored in the tissues of drift macroalgae became available for uptake by other primary producers, including phytoplankton. The estimated 14–18% increases in concentrations of these elements in the IRL could have promoted longer and more intense phytoplankton blooms, which would have reduced light availability and increased stress on algae and seagrasses. An improved understanding of such feedback and the ecological roles played by drift macroalgae will support more effective management of nutrient loads and the system by accounting for cycling of nutrients among primary producers.
Introduction
Interactions among three key primary producers, phytoplankton, macroalgae, and rooted macrophytes, represent influential processes in many estuaries (Duarte, 1995; Kinney and Roman, 1998; Viaroli et al., 2008). In the Indian River Lagoon (IRL), drift macroalgae (DMA) can dominate the total biomass of submersed aquatic vegetation, and even during years when seagrass is abundant, DMA contribute a significant proportion of the total primary productivity (Dawes et al., 1974; Josselyn, 1977; Thompson, 1978; Virnstein and Carbonara, 1985; Jensen and Gibson, 1986). Beyond being an important primary producer, DMA also provide habitat for small animals and a place to forage for predators (Stoner, 1980; Kulczycki et al., 1981; Virnstein and Howard, 1987; Holmquist, 1997).
As key primary producers in the IRL, DMA play an important role in cycling of carbon, nitrogen, and phosphorus. The ability of macroalgae to take up and store nutrients makes them successful when nutrients are limiting or supplied in pulses, which allows them to compete with phytoplankton for access to elements in the water column (Marshall and Orr, 1949; Hanisak, 1983). However, DMA are less robust and persistent than rooted macrophytes, so their death or lack of growth can add or leave carbon, nitrogen, and phosphorus that become available for uptake by fast-growing phytoplankton (Hanisak, 1983, 1993; Lavery and McComb, 1991; Gao et al., 2013). In fact, shifts from dominance by benthic primary producers to dominance by phytoplankton have been observed in multiple systems with negative impacts on seagrass assemblages and their associated fauna (Jensen and Gibson, 1986; Duarte, 1995; Burkholder et al., 2007; Duarte et al., 2010). Such a shift may have occurred in the IRL because an unprecedented sequence of intense and long-lasting blooms of phytoplankton has afflicted the system since 2011 (Phlips et al., 2010, 2011, 2015).
Although important in the IRL and elsewhere, DMA are difficult to sample effectively and efficiently. The fact that DMA are moved by currents complicates the choice of locations to sample, and details regarding their movements in the IRL are poorly known (Kulczycki et al., 1981; Virnstein and Carbonara, 1985; Jensen and Gibson, 1986; Hanisak, 2021). Additionally, DMA occur across a wider range of depths than rooted macrophytes because they have lower requirements for light (Biber et al., 2004; Hily et al., 2004; McGlathery et al., 2007), so the need to survey more area and deeper water makes effective sampling more challenging. Drift macroalgae also are relatively ephemeral, and changes in their abundance within and between years, including ‘boom and bust cycles’ driven by environmental conditions make the choice of temporal intensity for sampling important (Virnstein and Carbonara, 1985; McGlathery et al., 2007).
In spite of these challenges, the objectives of this paper are to identify the presence, causes, and consequences of differences and changes in the biomass of DMA across space and through time in the IRL. Substantial and consistent patterns in the biomass of DMA are elucidated from data collected at multiple spatial and temporal scales, and those patterns are related to environmental drivers that reflect physiological tolerances identified in incubations. The implications of spatiotemporal variation in biomass of DMA are translated into effects on cycling of elements in the IRL via data on the carbon, nitrogen, and phosphorus content of several species of DMA.
Materials and Methods
Study Area
The IRL is a shallow, bar-built estuary along the east coast of Florida comprising three, interconnected sublagoons: Mosquito Lagoon, Banana River Lagoon, and Indian River Lagoon (Figure 1). The average water depth in the sublagoons is 1.9 m, and most of the system is microtidal (semidiurnal lunar tidal amplitude range 0.2–18.1 cm), with more substantial changes in water level driven by wind and the seasonal rise and fall of the coastal ocean (Smith, 1987; Pitts, 1989; Steward et al., 2005). Significant exchange with the coastal ocean is limited to five inlets located primarily in the southern portion of the IRL. This configuration contributes to residence times of over a year in the portions of the system that are far from inlets (Steward et al., 2005).
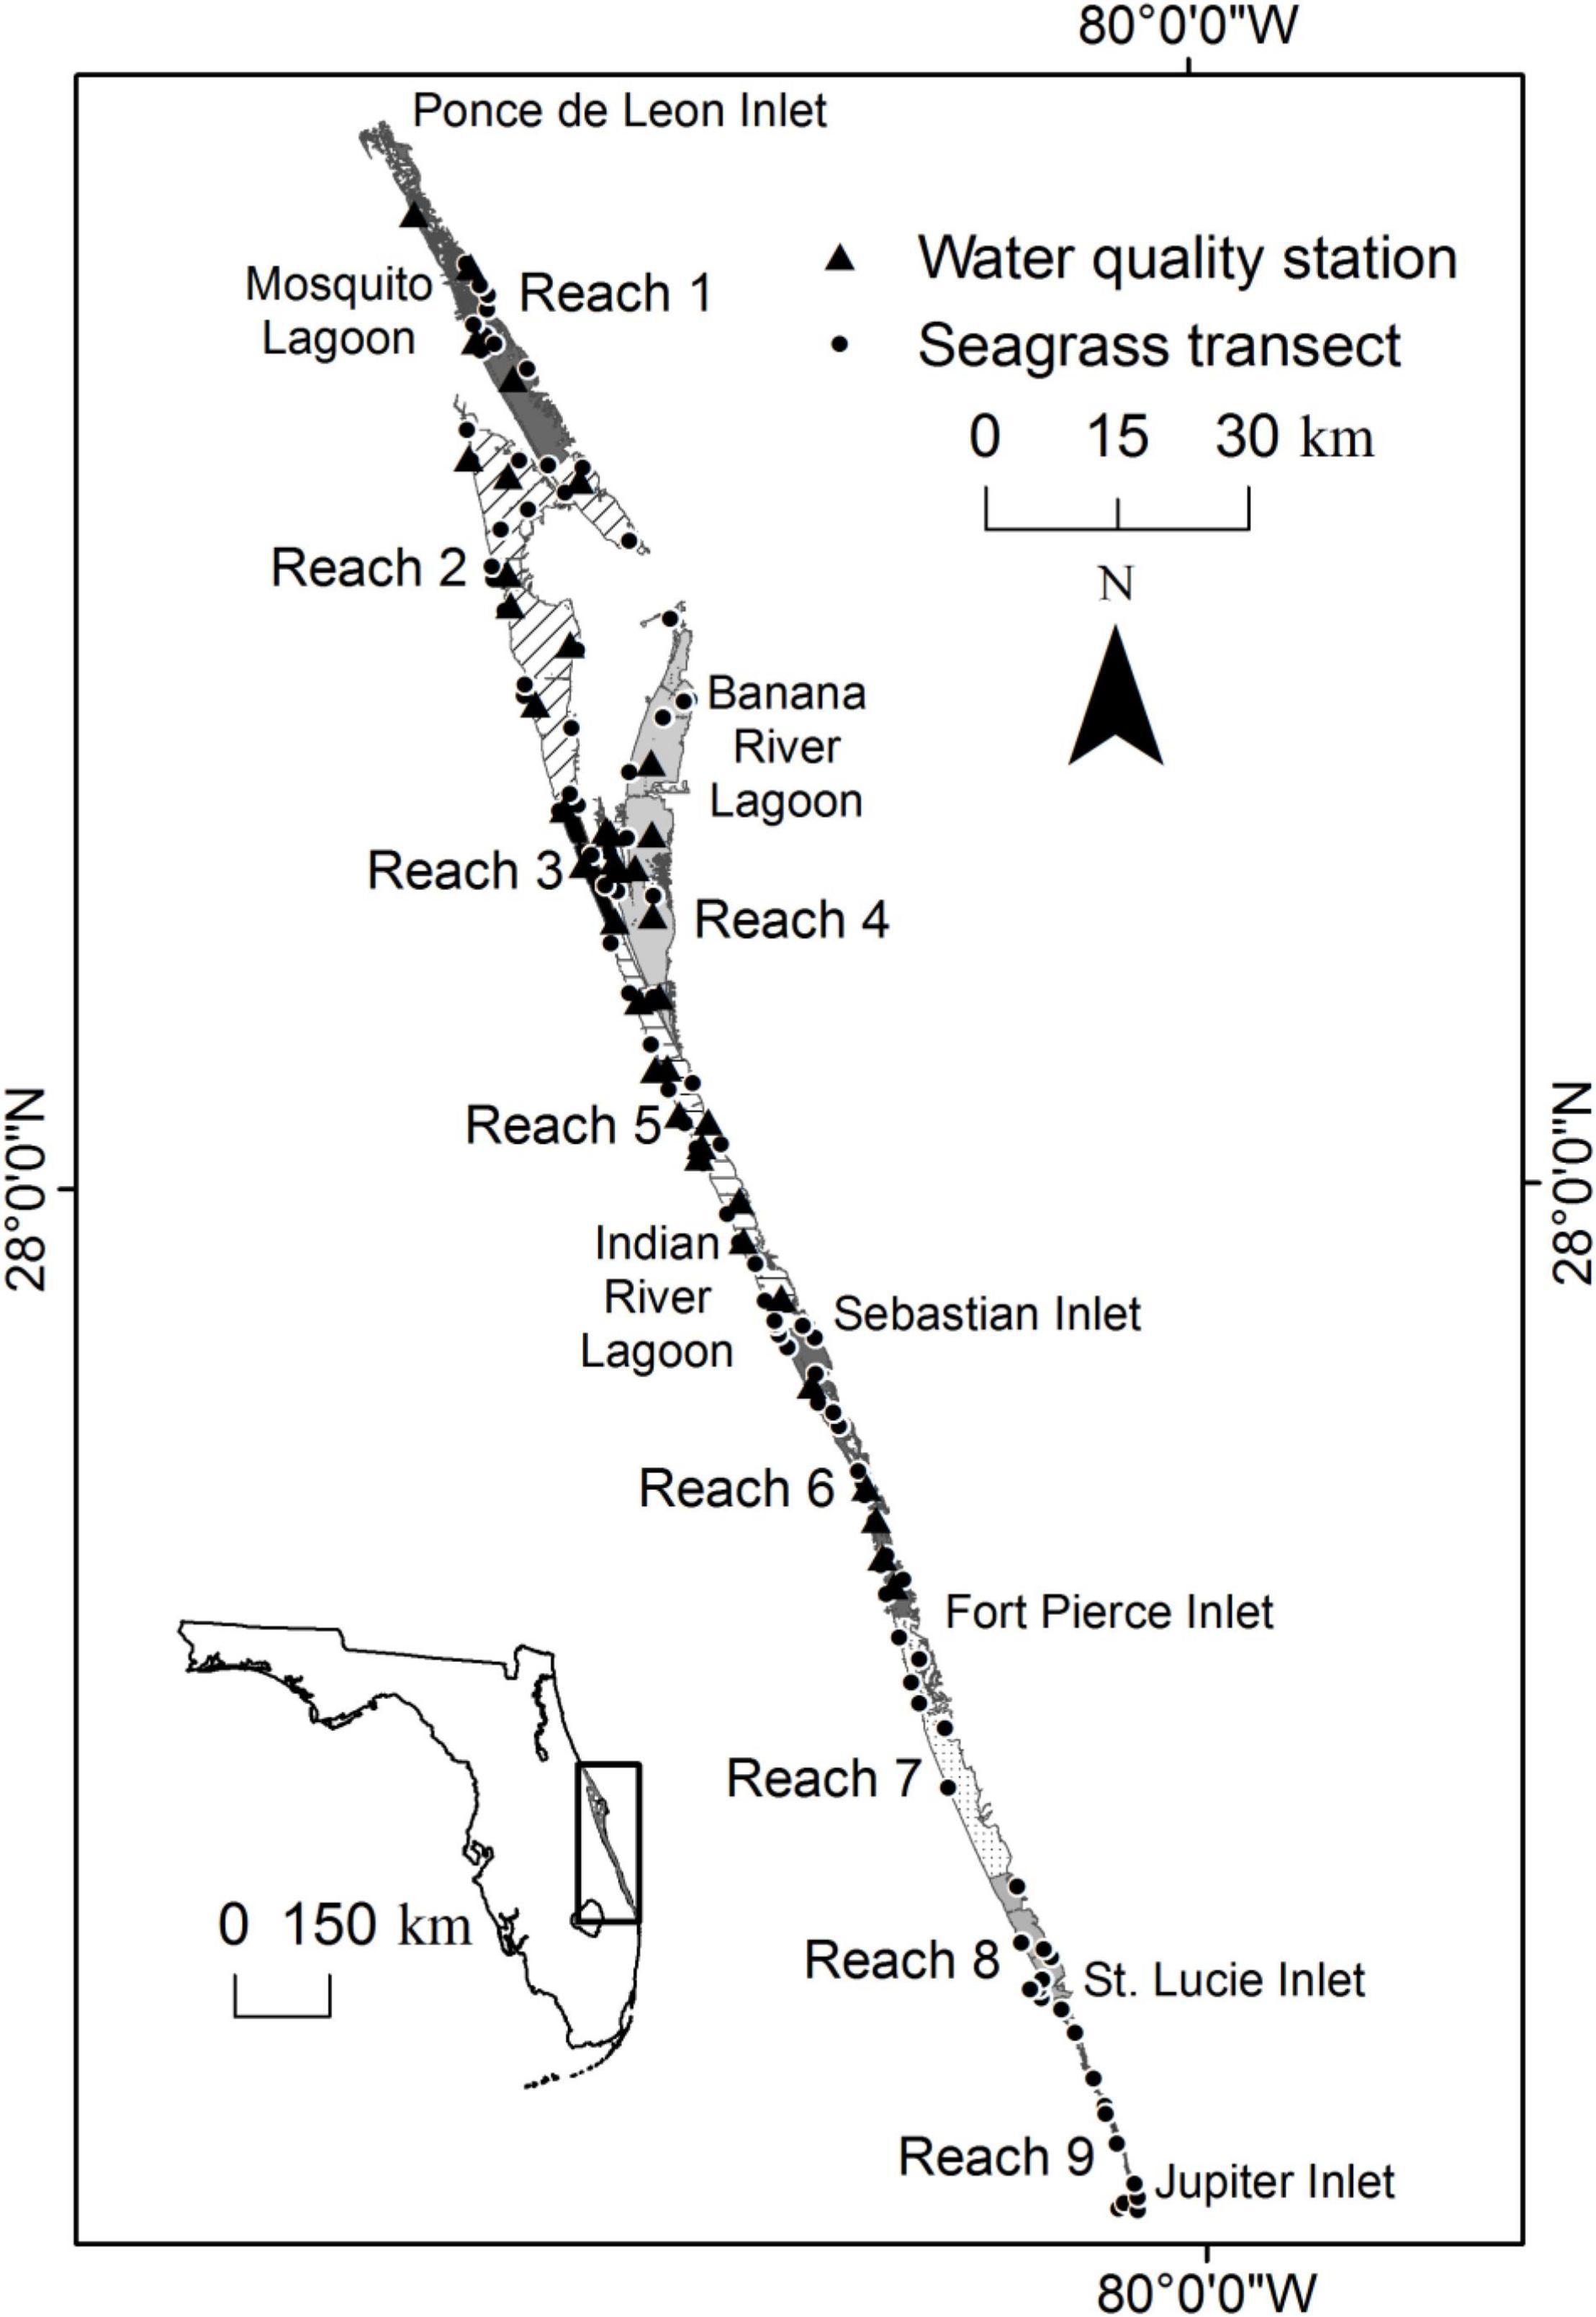
Figure 1. Map showing the location of the Indian River Lagoon, five inlets, nine reaches, fixed transects through seagrass, and water quality stations.
For this paper, the IRL was subdivided into reaches (Figure 1). The reaches were delineated by evaluating similarities in time series of water quality parameters (Lasi et al., this volume). The first six reaches were within the St. Johns River Water Management District. The remainder, reaches 7, 8, and 9, were within the boundary of the South Florida Water Management District.
Biomass of Drift Macroalgae
Data generated by visual surveys of fixed transects, seines of two sizes hauled as part of fisheries independent monitoring, and hydroacoustic surveys were analyzed independently because samples were taken at different frequencies, over different areal extents, and across depths that may or may not overlap (Supplementary Table 1). Given these variations, there was no attempt to intercalibrate the data, and interpretations focused on changes or differences that were consistent across methods.
A focus on consistent and substantial changes also resulted from a lack of details on the taxonomic composition of DMA. In surveys of transects, which focused on seagrass, and seining, which focused on fish and macroinvertebrates, DMA was considered bycatch; therefore, the biomasses of individual species typically were not measured. Furthermore, hydroacoustic surveys could not differentiate species. Nevertheless, widespread, consistent, and statistically significant spatiotemporal patterns provide valuable insights into the roles of DMA.
Fixed Transects
Fixed transects were surveyed at least twice a year (summer and winter) approximating times of annual maximum and minimum abundance of seagrasses (Figure 1; Virnstein and Morris, 1996). The location of each transect was marked with poles, and the path to be surveyed was delineated by a graduated line extending perpendicularly from the shoreline out to the deep end of the seagrass canopy. In summary, transects extended for 15–1,900 m across depths to 1.8 m.
At pre-designated points along transects, a suite of standardized, non-destructive measurements was taken within a 1-m2 quadrat divided by strings into 100 cells, each 10 cm by 10 cm. The relevant measurement for DMA was a visual estimate of the biomass of all species expressed as an index, which was converted to biomass using empirically derived coefficients, i.e., 0 = 0 g dry weight (DW) m–2, 1 = 0.35 g DW m–2, 2 = 1.98 g DW m–2, 3 = 21.37 g DW m–2, 4 = 47.74 g DW m–2, 5 = 141.94 g DW m–2 (Morris et al., 2001). For this study, we used data collected between 1998 and 2020.
Fisheries Independent Monitoring
Larger and in some cases deeper areas were sampled as part of long-term fisheries independent monitoring (FIM) conducted by the Florida Fish and Wildlife Conservation Commission, Fish and Wildlife Research Institute. The program sampled sites selected without replacement using a stratified random sampling design (FWC-FWRI, 2016), and we used data from sites sampled between either 1997 or 1998 and 2019.
The FIM program employed multiple types of gear, and we used data from two seines, a 21.3-m × 1.8-m center-bag haul seine with 3.2-mm nylon mesh and a 183-m × 2.5-m center-bag haul seine with 38-mm stretched nylon mesh. Seines were deployed along estuarine shorelines to sample areas with emergent vegetation, fringing mangroves, seawalls, and beaches or on flats at least 5 m from the shoreline. The 21.3-m seine was pulled for 9.1 m across a 15.5-m wide strip of bottom, resulting in a sampling area of approximately 140 m2. Using a boat, the 183-m seine was set in a rectangular shape adjacent to the shoreline with a maximum depth of 2.5 m at the bag before being retrieved by hand. The area sampled by the net (approximately 40 m × 103 m = 4,120 m2) was standardized by marking 40 m from each end to designate the corners of the rectangular set.
Bycatch of DMA was quantified to 0.1 gallons in the field, with reliable data being quantities of all species due to the challenges associated with identifying species visually. To convert these data to wet weights and dry weights, samples were collected during May and June 2012. Several species of DMA in quantities up to 5 gallons were collected at several sites, transferred to mesh bags, and spun to remove excess water. Mesh bags containing DMA were weighed to yield wet weights per gallon. The algae were dried at 80°C and then weighed to yield dry weights per gallon. A conversion factor was generated by fitting a linear regression, forced through zero. This conversion factor and the area sampled by the seine were combined to convert gallons of DMA to g DW m–2.
Hydroacoustic Surveys
To quantify the abundance and distribution of DMA found in deeper water, large-scale acoustic surveys were conducted between April and June in 2008, 2010, 2012, 2014, and 2015. While the surveys covered up to 288 km2, we focused analysis of spatiotemporal variation on reaches 2, 3, and 4, which were completed in all 5 years.
Hydroacoustic data were acquired with a BioSonics DT-X echosounder and two multiplexed, single-beam digital transducers with full beamwidths of 10° (38 kHz) and 6.4° (418 kHz), operated at 5-Hz and 0.4 ms pulse duration (Riegl and Bushkirk, 2016; Foster et al., 2018). Surveys focused on water deeper than approximately 1.3 m. The east–west survey lines were spaced a minimum of 200 m and maximum of 400 m apart. Data were post-processed using BioSonics Visual Bottom Typer (VBT; Foster et al., 2018). To estimate percent cover of DMA, samples of algae and video were collected along the line of the hydroacoustic surveys, and wet weights were recorded. Based on these samples, the acoustic signals were grouped into a supervised training catalog for bare substrate, sparse algae, dense algae, and other vegetation. Using the catalog and the estimated conversion factor, counts of the acoustic signals in each class were used to estimate wet biomass, and the conversion factor calculated for samples from seining was used to estimate dry biomass (Riegl and Bushkirk, 2016; Foster et al., 2018).
Analysis of Data
To evaluate differences in biomass, dry weights of macroalgae generated by each of the methods were used in separate permutation analyses of variance (PERMANOVAs, Anderson et al., 2008). All the models included reach and years as fixed factors, and models applied to data from transects and seines included seasons as a random factor nested in years. Seasons were defined based on the results of agglomerative hierarchical clustering of water quality data, with a warm wet season running from May to October and a cool dry season running from November in 1 year through April of the following year (Lasi et al., this volume). The PERMANOVAs were based on Bray–Curtis distance measures calculated with a dummy variable of 1 to avoid undefined results.
Physiological Tolerances
To evaluate the effects of stress caused by extreme salinities, extreme temperatures, low light levels, and combinations of stressors, a series of incubations was conducted under controlled conditions in tanks holding 70 L of water (Hanisak, 2016). Incubations were conducted in batch cultures using approximately 80 g wet weight of Gracilaria tikvahiae and Crassiphycus secundus (formerly Hydropuntia secunda), which are two of the most widespread and abundant rhodophytes in the IRL (Hanisak, 2016, 2021). Data were collected weekly over 35 days after 7 days of acclimation, and quantities of macroalgae were adjusted to maintain ∼80 g wet weight. The potential effects of macronutrient and trace metal limitation were obviated by midday additions of 39.0 μM dissolved inorganic nitrogen (i.e., 26 μM ammonium and 13 μM nitrate), 0.94 μM orthophosphate, and trace metals at concentrations found in F/2 medium. These additions achieved a nitrogen:phosphorus ratio of ∼41, which paralleled ratios measured in the IRL (Lasi unpublished data), and the ∼38 mg of nitrogen and ∼2 mg of phosphorus was sufficient to support growth of G. tikvahiae in past cultures (Hanisak, 1990). Salinities were maintained within 1 psu of the target by diluting water from a saltwater well. Temperatures were controlled within 1°C of the targets by chillers and heaters. Light was provided by 100W SOL 1 – LED Grow Lights from 06:00 to 18:00.
Two types of incubations were conducted: single-factor range finding incubations for salinity, temperature, and light availability and incubations manipulating combinations of factors. The factors that were not manipulated were held at 25 psu, 25°C, or 250 μmol m–2 s–1, as appropriate. Incubations with varying salinity included 12, 18, 25, 35, 45, and 50 psu. Temperatures of 7, 10, 17, 25, and 33°C were tested, and light levels of 0, 10, 30, 50, 100, 250, and 400 μmol m–2 s–1 were examined. Algae were harvested each week, and changes in wet weight were recorded. If incremental growth occurred, it was removed so the initial stocking density was returned to the tank. If biomass was lost, the decline was recorded. Wet weights were converted to dry weights using an empirical relationship derived from samples taken at the beginning and end of the incubations. In addition, samples taken each week were rinsed to remove excess salt, dried at 80°C, ground to a fine powder with a mortar and pestle, and shipped to the University of Maryland’s Nutrient Analytical Services Laboratory for analysis of carbon, nitrogen, and phosphorus content (University of Maryland, 2022)1. The resulting percentages were used to identify any data that were affected by nutrient limitation.
Data on accumulation of biomass (growth) were extracted from seven sets of incubations and analyzed with PERMANOVAs based on Bray–Curtis distance measures with the addition of a dummy variable set at 1. Where necessary, adding the minimum to all values eliminated negative numbers. The design accounted for the repeated measures nature of the incubations. Species and the appropriate stressor or combination of stressors were fixed factors. Tank was a random factor nested in the interaction of species and treatment, and week was a random factor nested in the interaction of species, treatment, and tank. To examine the most extensive set of treatments, some data were used in more than one analysis.
Timing and Extent of Suitable Conditions
Based on the results from the evaluation of stressors, the timing and extent of suitable conditions for growth of DMA were predicted. The data to characterize stressors were drawn from ongoing sampling of water quality in the lagoon (Lasi et al., this volume) and existing bathymetry.
Salinities, water temperatures, and photosynthetically active radiation (PAR) were measured monthly at 30 fixed stations in reaches 1 through 6 (Figure 1). Measurements were taken with multiparameter instruments that were calibrated and verified with standards and procedures prescribed by state guidelines (Florida Department of Environmental Protection, 2017). Light availability was characterized by coefficients of attenuation for PAR (Kd) as determined by applying Beer’s Law (Kirk, 1983) to readings recorded simultaneously by three spherical quantum sensors. Sensors were held 0.2 and 0.5 m below the water’s surface, and a third sensor was held 0.3 m from the bottom in water ≤ 1.8 m deep or 1.5 m below the surface in deeper water (Morris et al., 2001). The resulting Kd values were combined with data on solar radiation from the Florida Automated Weather Network (FAWN2) (University of Florida, Institute of Food and Agricultural Sciences, 2022) to calculate the depth that received light above the threshold causing stress. Data from FAWN were converted from Watts m–2 to μmol m–2 s–1 and daily means were calculated from daytime data for 1998 through 2019. The daily means were converted to irradiance (I0) immediately below the surface of the water by reducing them by 6.6% to account for surface reflectance (Kirk, 1983), and the resulting values were combined with a threshold from the incubations (Iz) to determine the depth (z) receiving sufficient light using:
The depths with sufficient light were translated to areal extent of suitable habitat for DMA by combining them with bathymetric data collected by Coastal Planning and Engineering (1997). Depth soundings were taken throughout the IRL at 15.2-m intervals along east–west transects that were separated by 150–300 m. This survey resulted in over 230,000 depth measurements that were referenced to North American Vertical Datum of 1988 (NAVD88) and adjusted to depth below mean water level (MWL). From these data, isobaths were generated in 0.1-m increments for reaches 1–6.
Stressful periods in each reach were identified by examining months with salinities, temperatures, or light availability that caused stress during the incubations. In addition, estimates of light penetration combined with bathymetry identified the extent of the lagoon with a suitable light regime.
Carbon, Nitrogen, and Phosphorus Stored in Drift Algae
The carbon, nitrogen, and phosphorus contents of DMA were determined from samples of common rhodophytes collected bi-monthly from six sites in the Indian River and Banana River lagoons (reaches 2, 3, and 4) between July 2014 and August 2015. Three replicate samples of the two most abundant species were collected from beyond the deep edge of the seagrass beds, typically in 1.5–2.0 m of water. The samples were transported on ice to the laboratory where epiphytes and debris were removed before the algae were rinsed to remove excess salt and dried at 80°C. Dried samples were ground to fine powder and analyzed for carbon, nitrogen, and phosphorus content at University of Maryland’s Nutrient Analytical Services Laboratory (see Text Footnote 1).
The resulting data on carbon, nitrogen, and phosphorus content were used to gain insights into changes in the quantities of these elements stored in DMA. Median elemental contents were multiplied by DMA biomass per square meter from transects and surveys with seines to evaluate changes in cycling of key elements.
Results
Patterns in Biomass of Drift Macroalgae
The biomass of the DMA assemblage varied significantly in space and through time according to analyses of data from surveys of transects, deployment of two different seines, and hydroacoustic surveys (Table 1). Biomasses from the transects and seines varied among combinations of reach and season within year, and biomasses detected with hydroacoustics varied significantly among years.
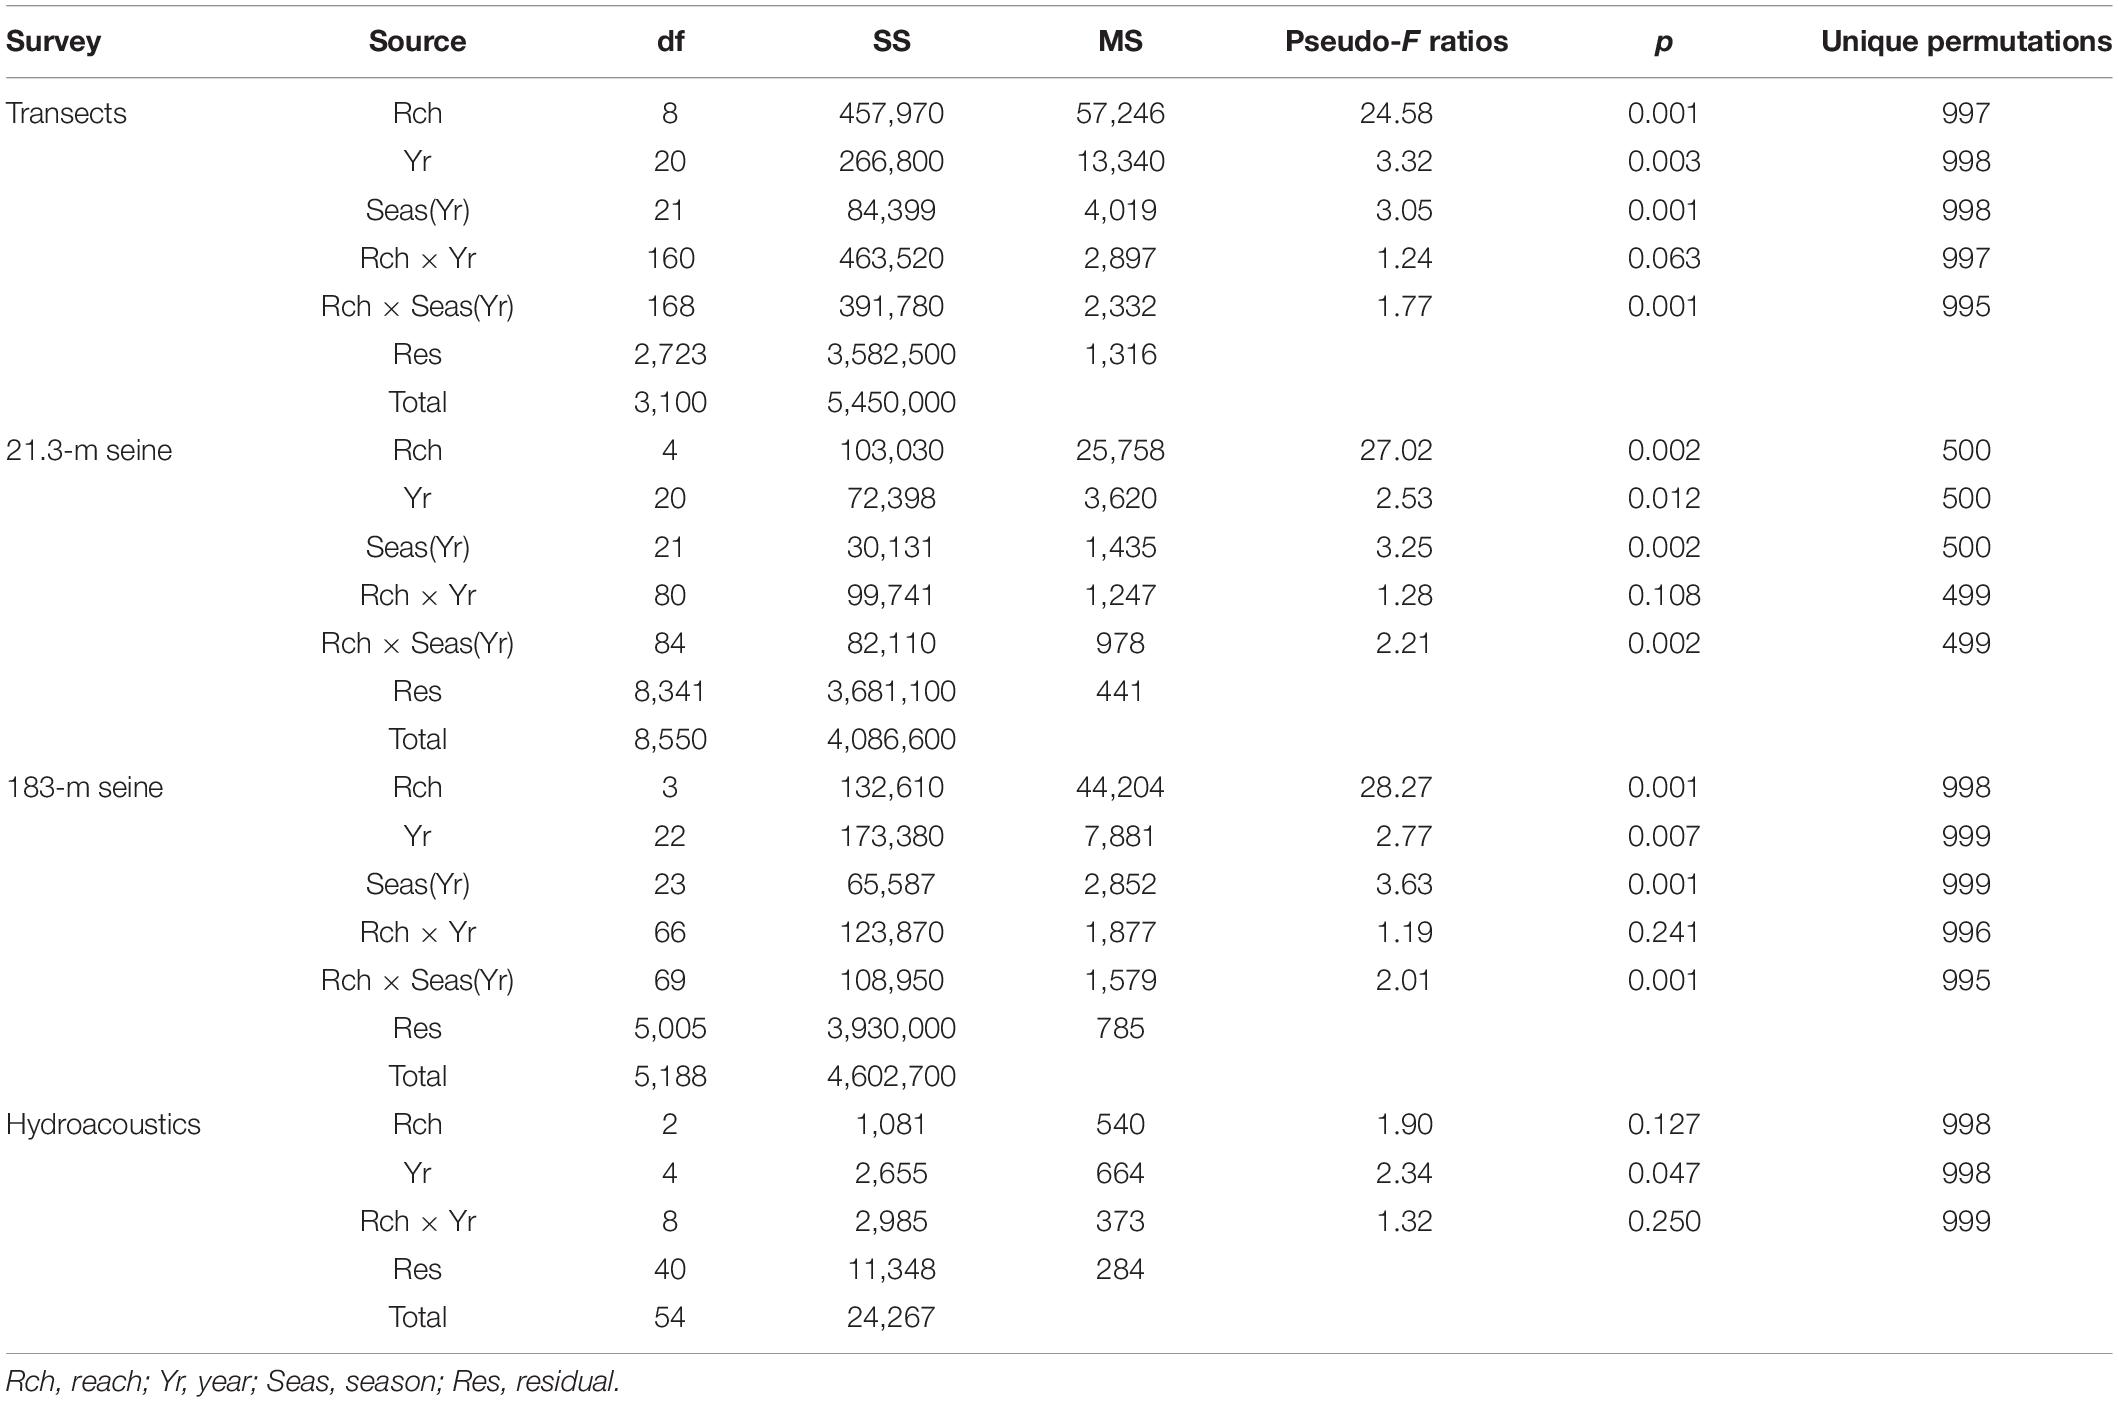
Table 1. Permutation analyses of variance for biomass of drift macroalgae sampled with four methods.
Higher values for the biomass of DMA observed during surveys of transects or as bycatch from seining did not reveal consistent and ecologically meaningful patterns across reaches or among years (Figures 2A–D). However, data from surveys of transects indicated that 70% of the biomasses above the 90th percentile were recorded in the warmer, wetter months of summer, and monthly data from seining indicated that the biomass of drift algae tended to be higher from March through July (means ± standard error for 21.3-m seine = 1.7 ± 0.2 g m–2 and 183-m seine = 2.6 ± 0.2 g m–2) than in August–February (means ± standard error for 21.3-m seine = 1.0 ± 0.1 g m–2 and 183-m seine = 1.2 ± 0.1 g m–2).
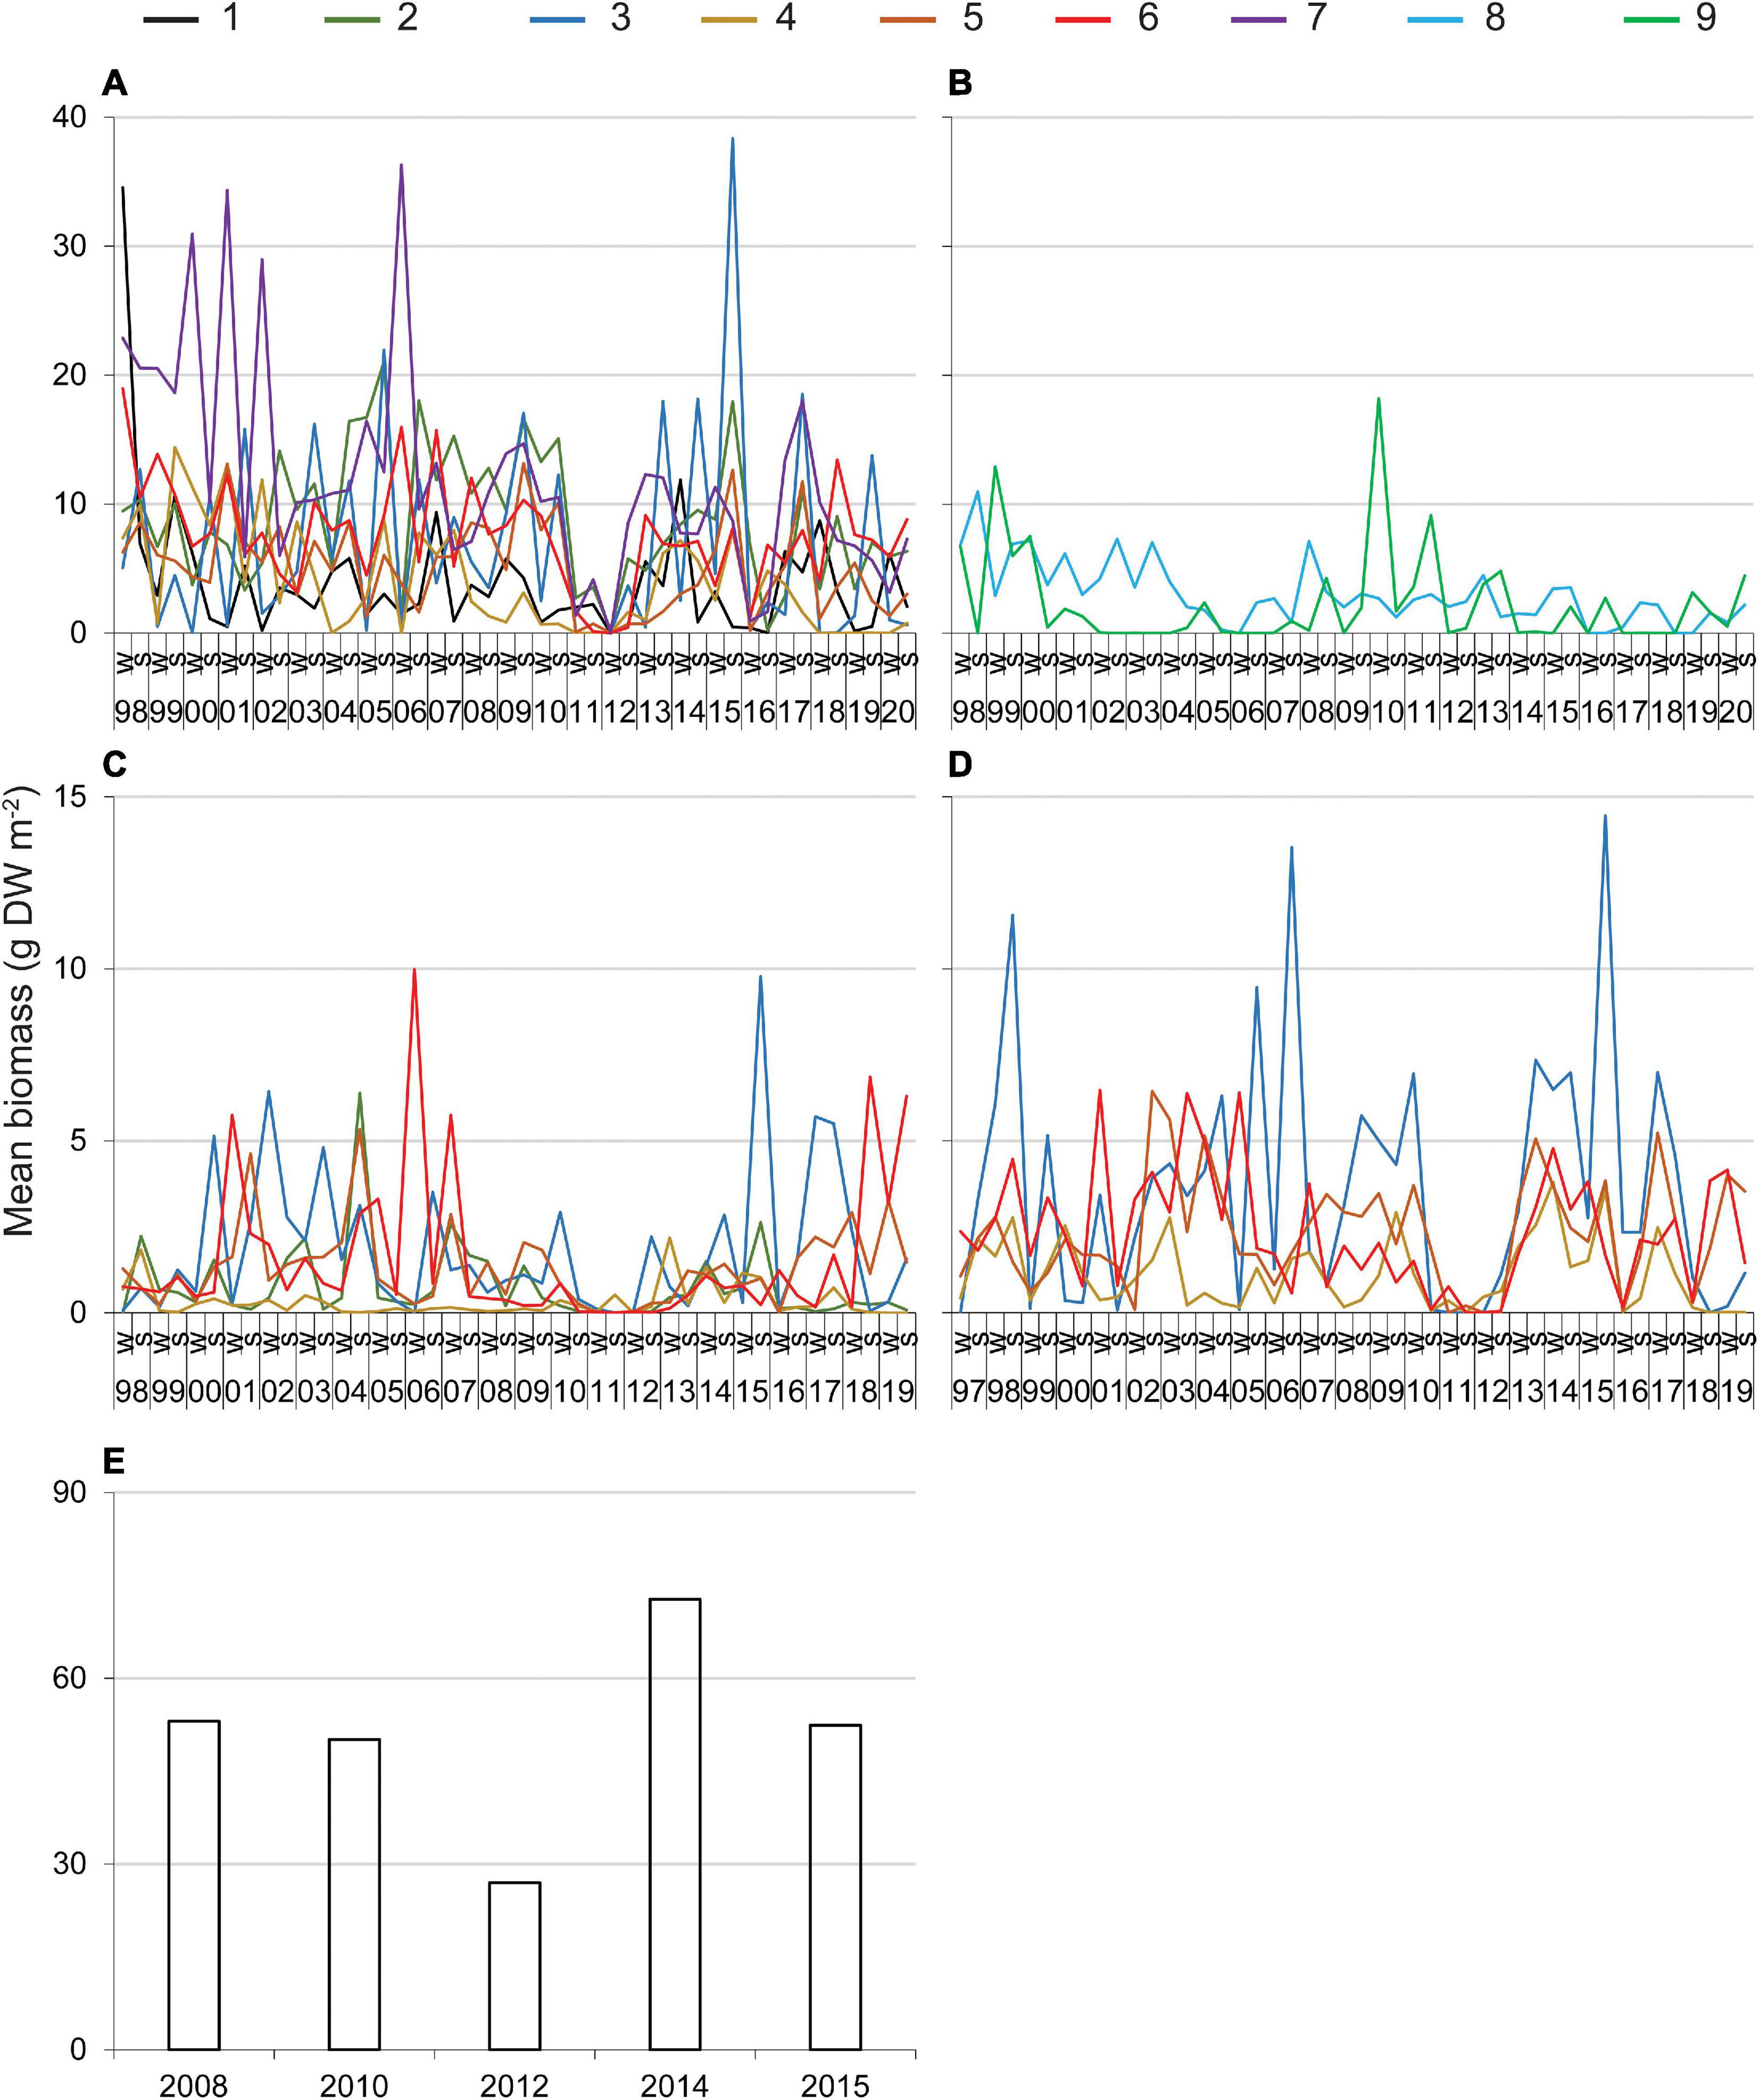
Figure 2. Mean biomass of drift macroalgae sampled along transects through seagrass (A,B), in a 21.3-m seine (C, reaches 2–6), in a 183-m seine (D, reaches 3–6), and via hydroacoustic surveys (E). 1–9 = reaches, 98–19, 1998–2019; W, winter; S, summer. See Table 1 for relevant statistics.
In contrast, relatively low biomass was recorded by multiple methods during two periods. Low biomass was documented consistently along the transects and in the seines from late 2010 through 2011–2012 in reaches 1–7, but the same pattern was not obvious in reaches 8 and 9 where the abundance of drift algae was lower (Figures 2A,B). Additionally, biomass detected by hydroacoustic surveys was lowest in 2012 (Figure 2E). Thus, multiple lines of evidence point to 2010–2012 as one period with little drift algae. In addition, drift algal biomass along transects and in the seines was consistently low in reaches 1–6 in 2016 (Figures 2A,C,D).
Physiological Tolerances
Evidence suggested that macroalgae were not limited by carbon, nitrogen, or phosphorus during the 35-day incubations. Cumulative growth of macroalgae over 35 days represented less than 2% of the 80 g incubated, so growth rates were unlikely to exhaust the nutrients, which were replenished daily. In addition, elemental contents from all incubations were consistent, which indicated that the algae received sufficient carbon, nitrogen, and phosphorus throughout the incubations. The mean content ± standard error was 28.169% ± 0.075% for carbon, 3.504% ± 0.026% for nitrogen, and 0.389% ± 0.004% for phosphorus.
Incubations with salinities that spanned 12–50 psu did not identify significant effects on cumulative growth or elemental contents (Table 2). On average for each of the salinities, G. tikvahiae accumulated 5.1 ± 1.4 g to 10.2 ± 1.2 g of biomass over 35 days, and C. secundus accumulated 4.6 ± 0.8 g to 9.2 ± 1.4 g of biomass. Given these results, the effect of salinity was not explored further.
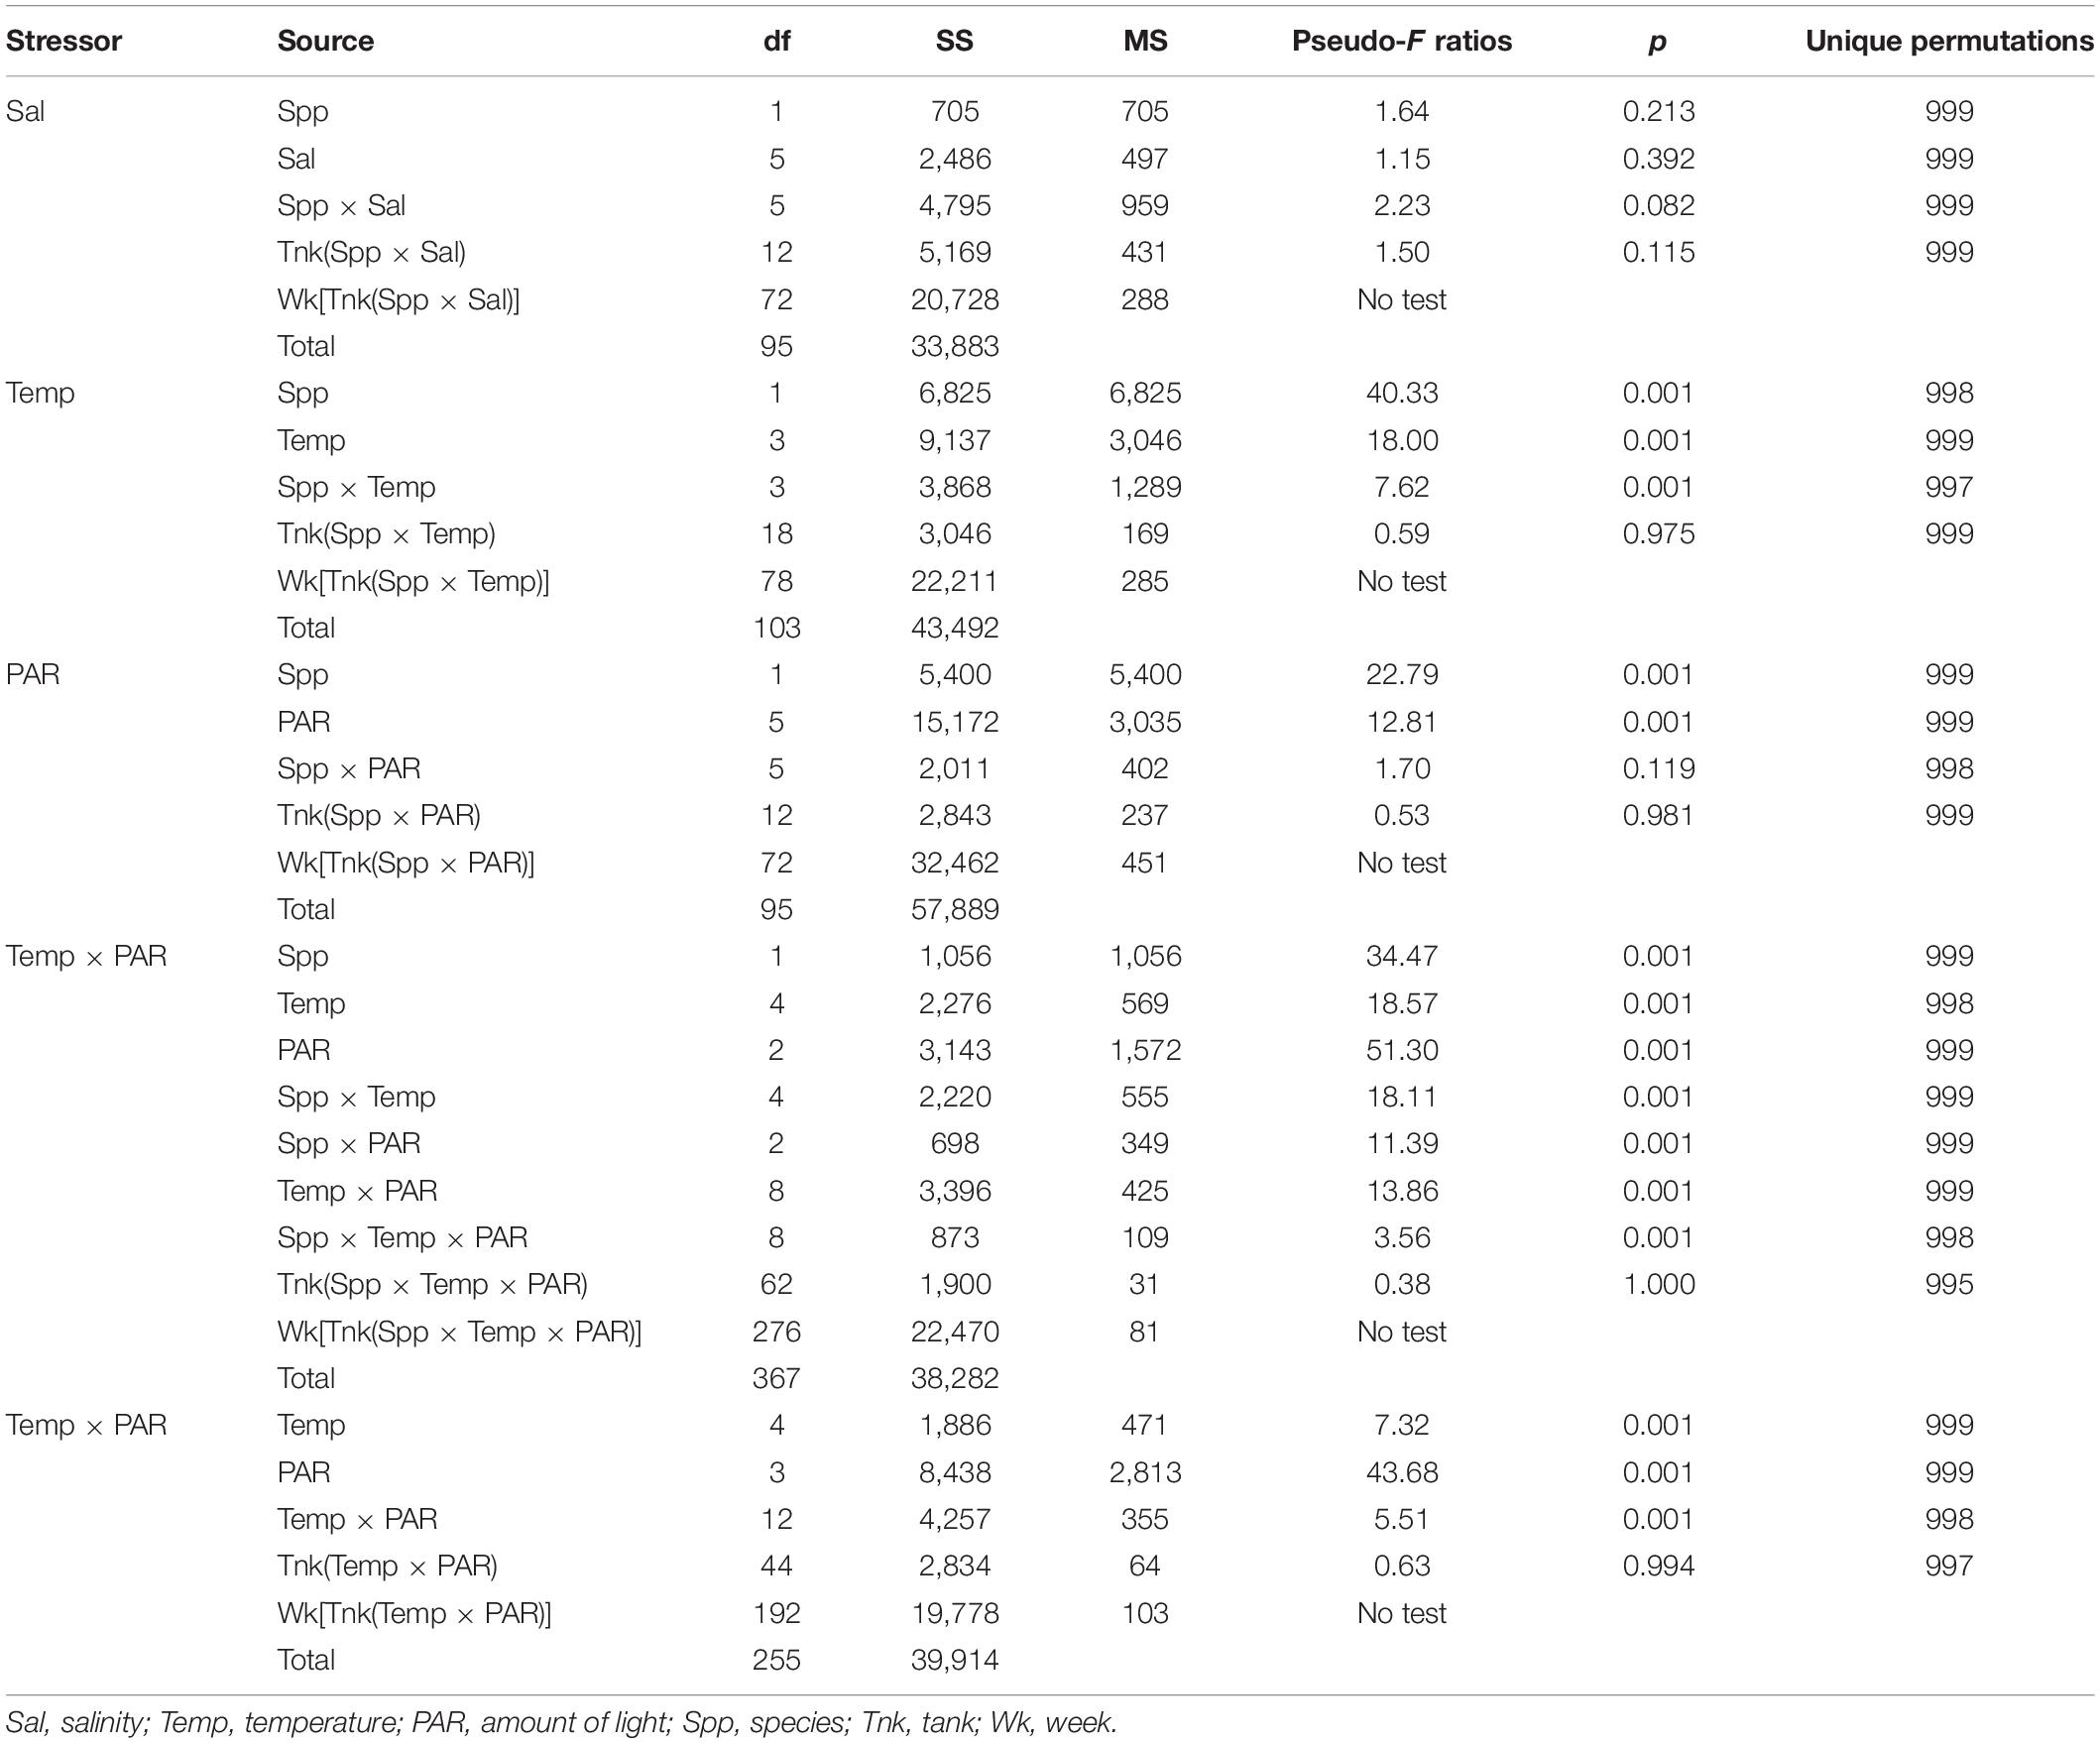
Table 2. Permutation analyses of variance for accumulation of biomass by drift macroalgae subjected to differing stressors in the laboratory.
The two species had differing responses to the varying temperatures used in a range finding incubations (Table 2). At all temperatures, G. tikvahiae accumulated more biomass over 35 days (Figure 3A). Both G. tikvahiae and C. secundus accumulated slightly more biomass at 25°C, although growth at 33°C was similar (Figure 3A). On average, C. secundus lost biomass at 7°C and only gained 0.8 ± 0.1 g at 10°C.
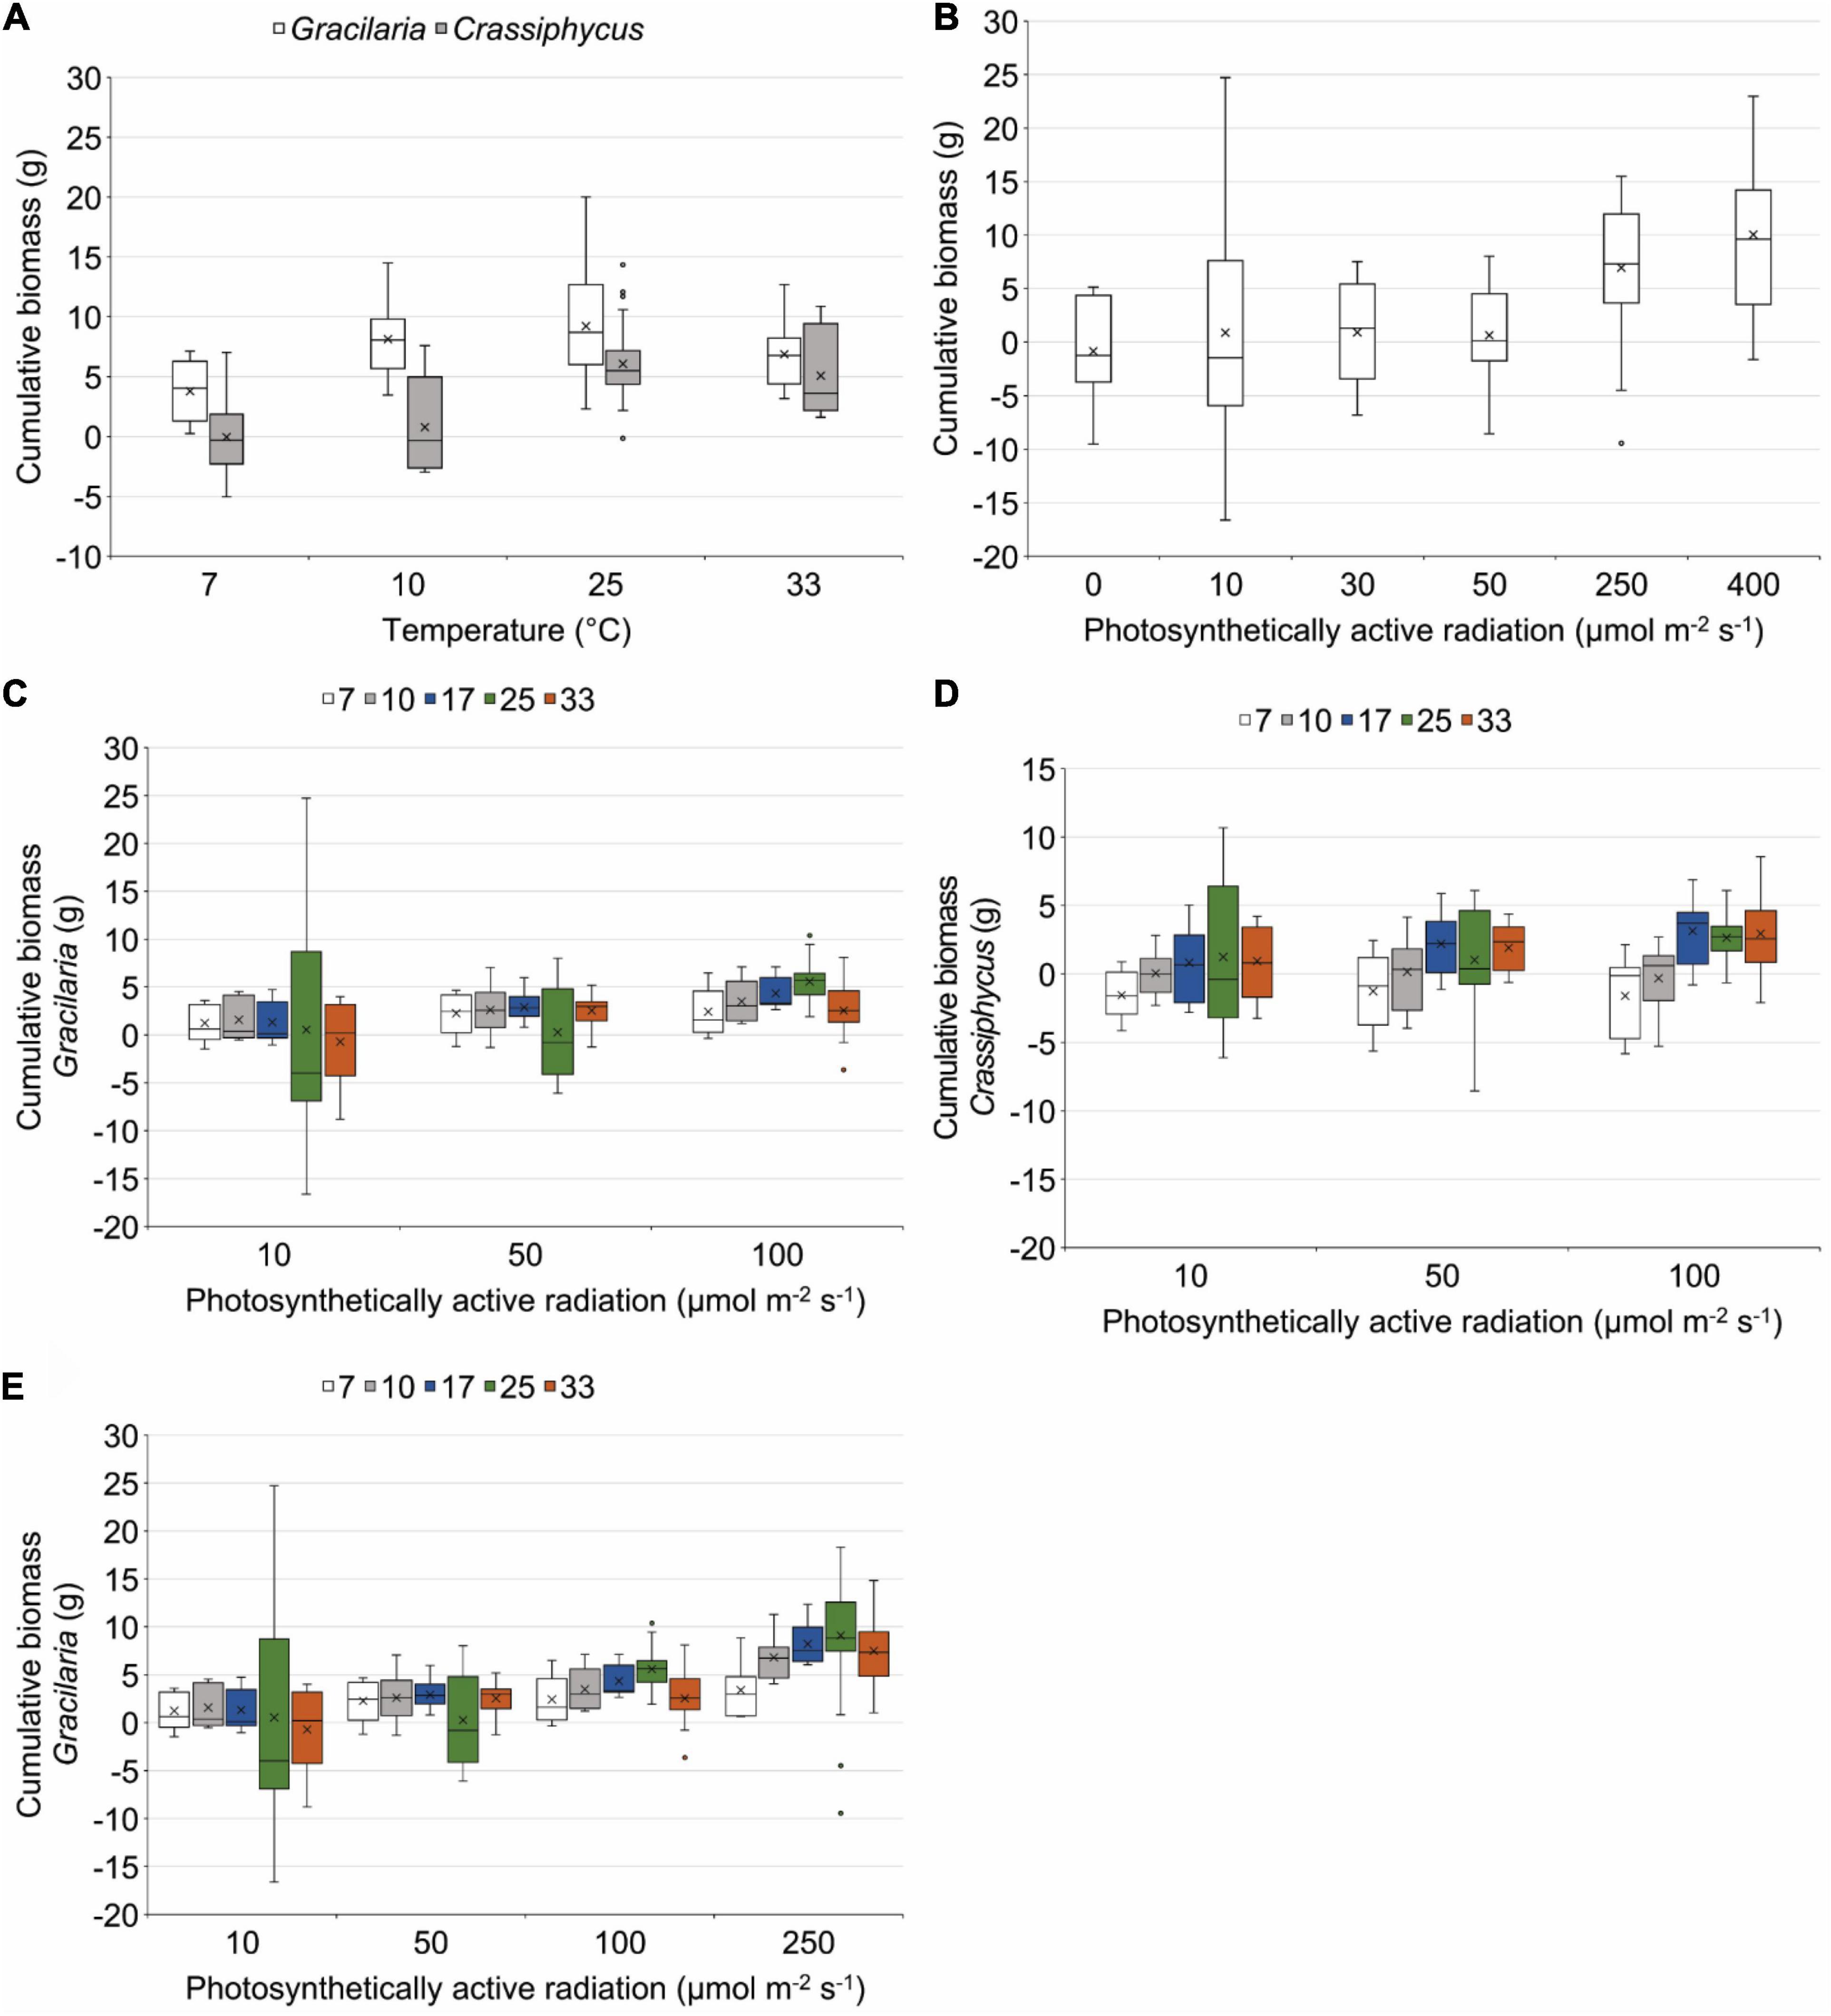
Figure 3. Box plots showing results of incubating Gracilaria tikvahiae (A–C,E) and Crassiphycus secundus (A,B,D) in tanks at different temperatures, different amounts of photosynthetically active radiation, and different combinations of temperature and amounts of photosynthetically active radiation. 7, 10, 17, 25, and 33 = temperatures in °C, points indicate extreme values, whiskers indicate the values in the lower 25% or upper 25% of all values, boxes indicate the 75th and 25th percentiles, horizontal line indicates the median, X indicates the mean.
Light availability characterized by PAR affected the growth of G. tikvahiae and C. secundus similarly as shown by the lack of a significant interaction between species and amount of PAR (Table 2). Unlike C. secundus, G. tikvahiae did not survive in 0 μmol m–2 s–1. Both species consistently accumulated biomass over 35 days only when provided with 250 or 400 μmol m–2 s–1 of PAR (Figure 3B). On average, G. tikvahiae accumulated 2.5 ± 1.2 g of biomass, and C. secundus accumulated 3.7 ± 0.7 g of biomass. Given the greater and less variable accumulation of biomass, C. secundus appeared to cope with low light better than G. tikvahiae.
Two sets of results combined differing temperatures and differing amounts of light, with some data for G. tikvahiae used in two PERMANOVAs (Table 2). In the first set of results, G. tikvahiae and C. secundus were incubated at 7, 10, 17, 25, and 33°C under 10, 50, and 100 μmol m–2 s–1 of PAR, and in the second set, only G. tikvahiae was available to be incubated at 7, 10, 17, 25, and 33°C under 10, 50, 100, and 250 μmol m–2 s–1 of PAR. The two species exhibited differing responses to combinations of temperature and PAR (Table 2). For both species, there was loss or accumulation of <2 g of biomass over 35 days at 10 μmol m–2 s–1 of PAR (Figures 3C–E). At 50 μmol m–2 s–1 of PAR over 35 days, G. tikvahiae gained 2–3 g of biomass at all temperatures except 25°C, and C. secundus gained about 2 g of biomass at 17 and 33°C (Figures 3C–E). At 100 μmol m–2 s–1 of PAR over 35 days, G. tikvahiae gained 2–6 g of biomass, with the maximum gain at 25°C (Figures 3C,E). At 100 μmol m–2 s–1 of PAR, C. secundus lost biomass at 7 and 10°C and gained approximately 3 g over 35 days at 17, 25, and 33°C (Figure 3D). Only G. tikvahiae was subjected to differing temperatures at 250 μmol m–2 s–1, and it gained a maximum of 9.1 ± 0.7 g of biomass over 35 days at 25°C, with gains decreasing to 3.4 ± 0.8 g of biomass at 7°C and 7.5 ± 1.2 g of biomass at 33°C (Figure 3E). Both species tended to lose biomass when subjected to less than 50 μmol m–2 s–1 of PAR although they survived the 35-day incubations. Loss of biomass was more common at temperatures of 7 or 10°C. Overall, the results indicated that light availability was a dominant influence on growth, with an effect of temperature appearing more strongly when the algae received over 100 μmol m–2 s–1 of PAR. In those conditions, optimum temperatures appeared to be 25°C for G. tikvahiae and 17–33°C for C. secundus.
Timing and Extent of Suitable Conditions
Salinity did not stress either G. tikvahiae or C. secundus, but incubations in the laboratory indicated that low temperatures (below 17°C), high temperatures (above 25–33°C), and reduced light availability (less than 100 μmol m–2 s–1) had the potential to reduce growth or cause mortality. Stressful periods for each reach were identified by coding monthly mean Kd values higher than the 90th percentile of all values (>1.6 m–1), monthly mean temperatures above the 90th percentile (>30.3°C), and monthly mean temperatures below the 10th percentile (<17.8°C) as zero and all other values as one to produce a heatmap (Figure 4). Mean temperatures exceeded the 90th percentile in summers of all years, and temperatures dropped below the 10th percentile in multiple winters. The period with the most spatially and temporally extensive distribution of all stressors was 2009–2011, which corresponded with multiple records of low abundance for DMA (Figure 2). In samples taken with the 21.3-m seine from June 2010 through May 2012, the mean biomass of DMA in all reaches was below the 10th percentile of all values 67% of the time and below the 25th percentile of all values 88% of the time. Similarly, in samples taken with the 183-m seine from August 2010 through October 2012, the mean biomass of DMA in all reaches was below the 10th percentile of all values 56% of the time and below the 25th percentile of all values 78% of the time. High Kd values that translated into low light availability also were noted in 2016 and 2018 along with warm temperatures, which again corresponded with low abundance of DMA, especially in reaches 3–6 (Figures 2A,C,D). In samples taken with the 21.3-m seine from August 2015 through November 2016, the mean biomass of DMA in all reaches was below the 10th percentile of all values 12% of the time and below the 25th percentile of all values 50% of the time. For the 183-m seine, the mean biomass of DMA recorded in all reaches from September 2016 through December 2016 was below the 10th percentile of all values 50% of the time and below the 25th percentile of all values 100% of the time.
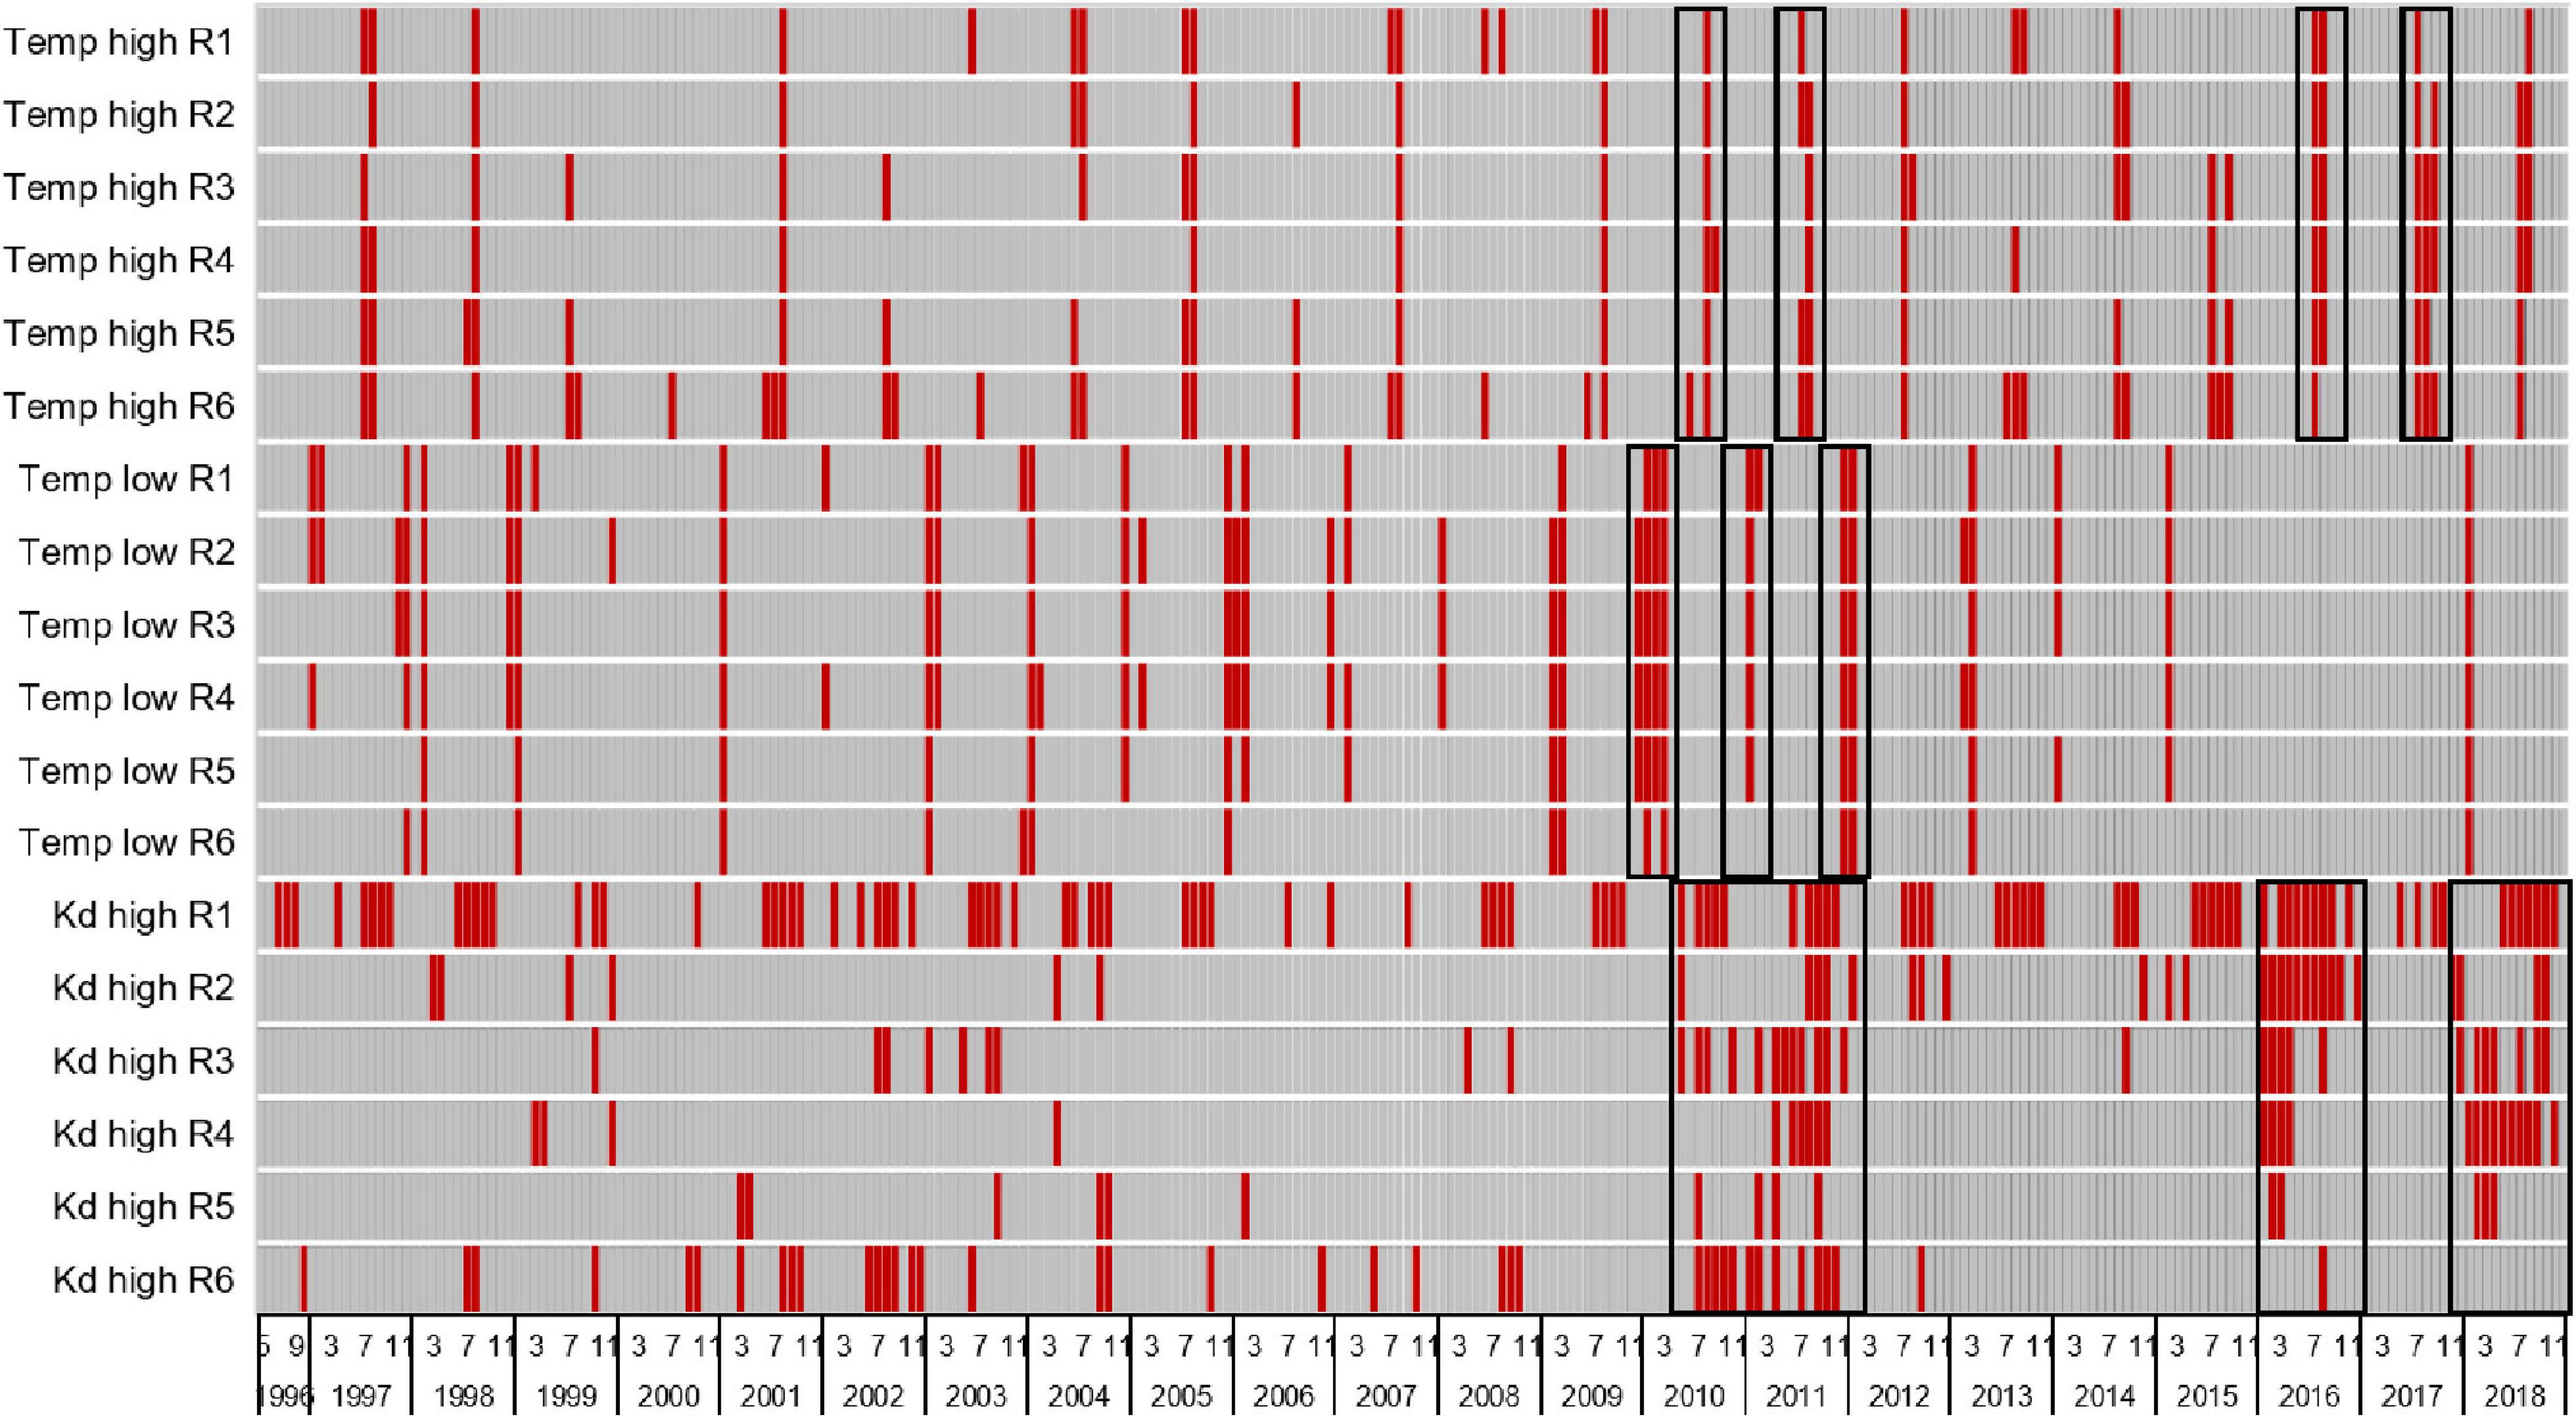
Figure 4. Heatmap with red bars identifying periods of stress (years and months) for drift macroalgae due to high temperatures (>90th percentile of all values = 30.3°C), low temperatures (<10th percentile of all values = 17.8°C), and high light attenuation coefficients or Kd values (>90th percentile of all values = 1.6), black boxes highlight periods of widespread increased stress. See Table 2 for relevant statistics.
The incubations to identify tolerances highlighted PAR below 100 μmol m–2 s–1 as a key influence on the growth of DMA; therefore, depths receiving ≥100 μmol m–2 s–1 were associated with 0.1-m isobaths to identify the extent of suitable habitat in hectares (Figure 5 and Supplementary Figure 1). The extent of suitable habitat varied through time for each reach, and when compared to the background extent from 1998 to 2009, reaches 2–6 had more substantial losses of suitable habitat in 2010–2011 and in 2016–2018, which would translate to changes in the amounts of carbon, nitrogen, and phosphorus stored in DMA (Figure 6 and Supplementary Table 2). These results were consistent with other evaluations of the abundance of DMA.
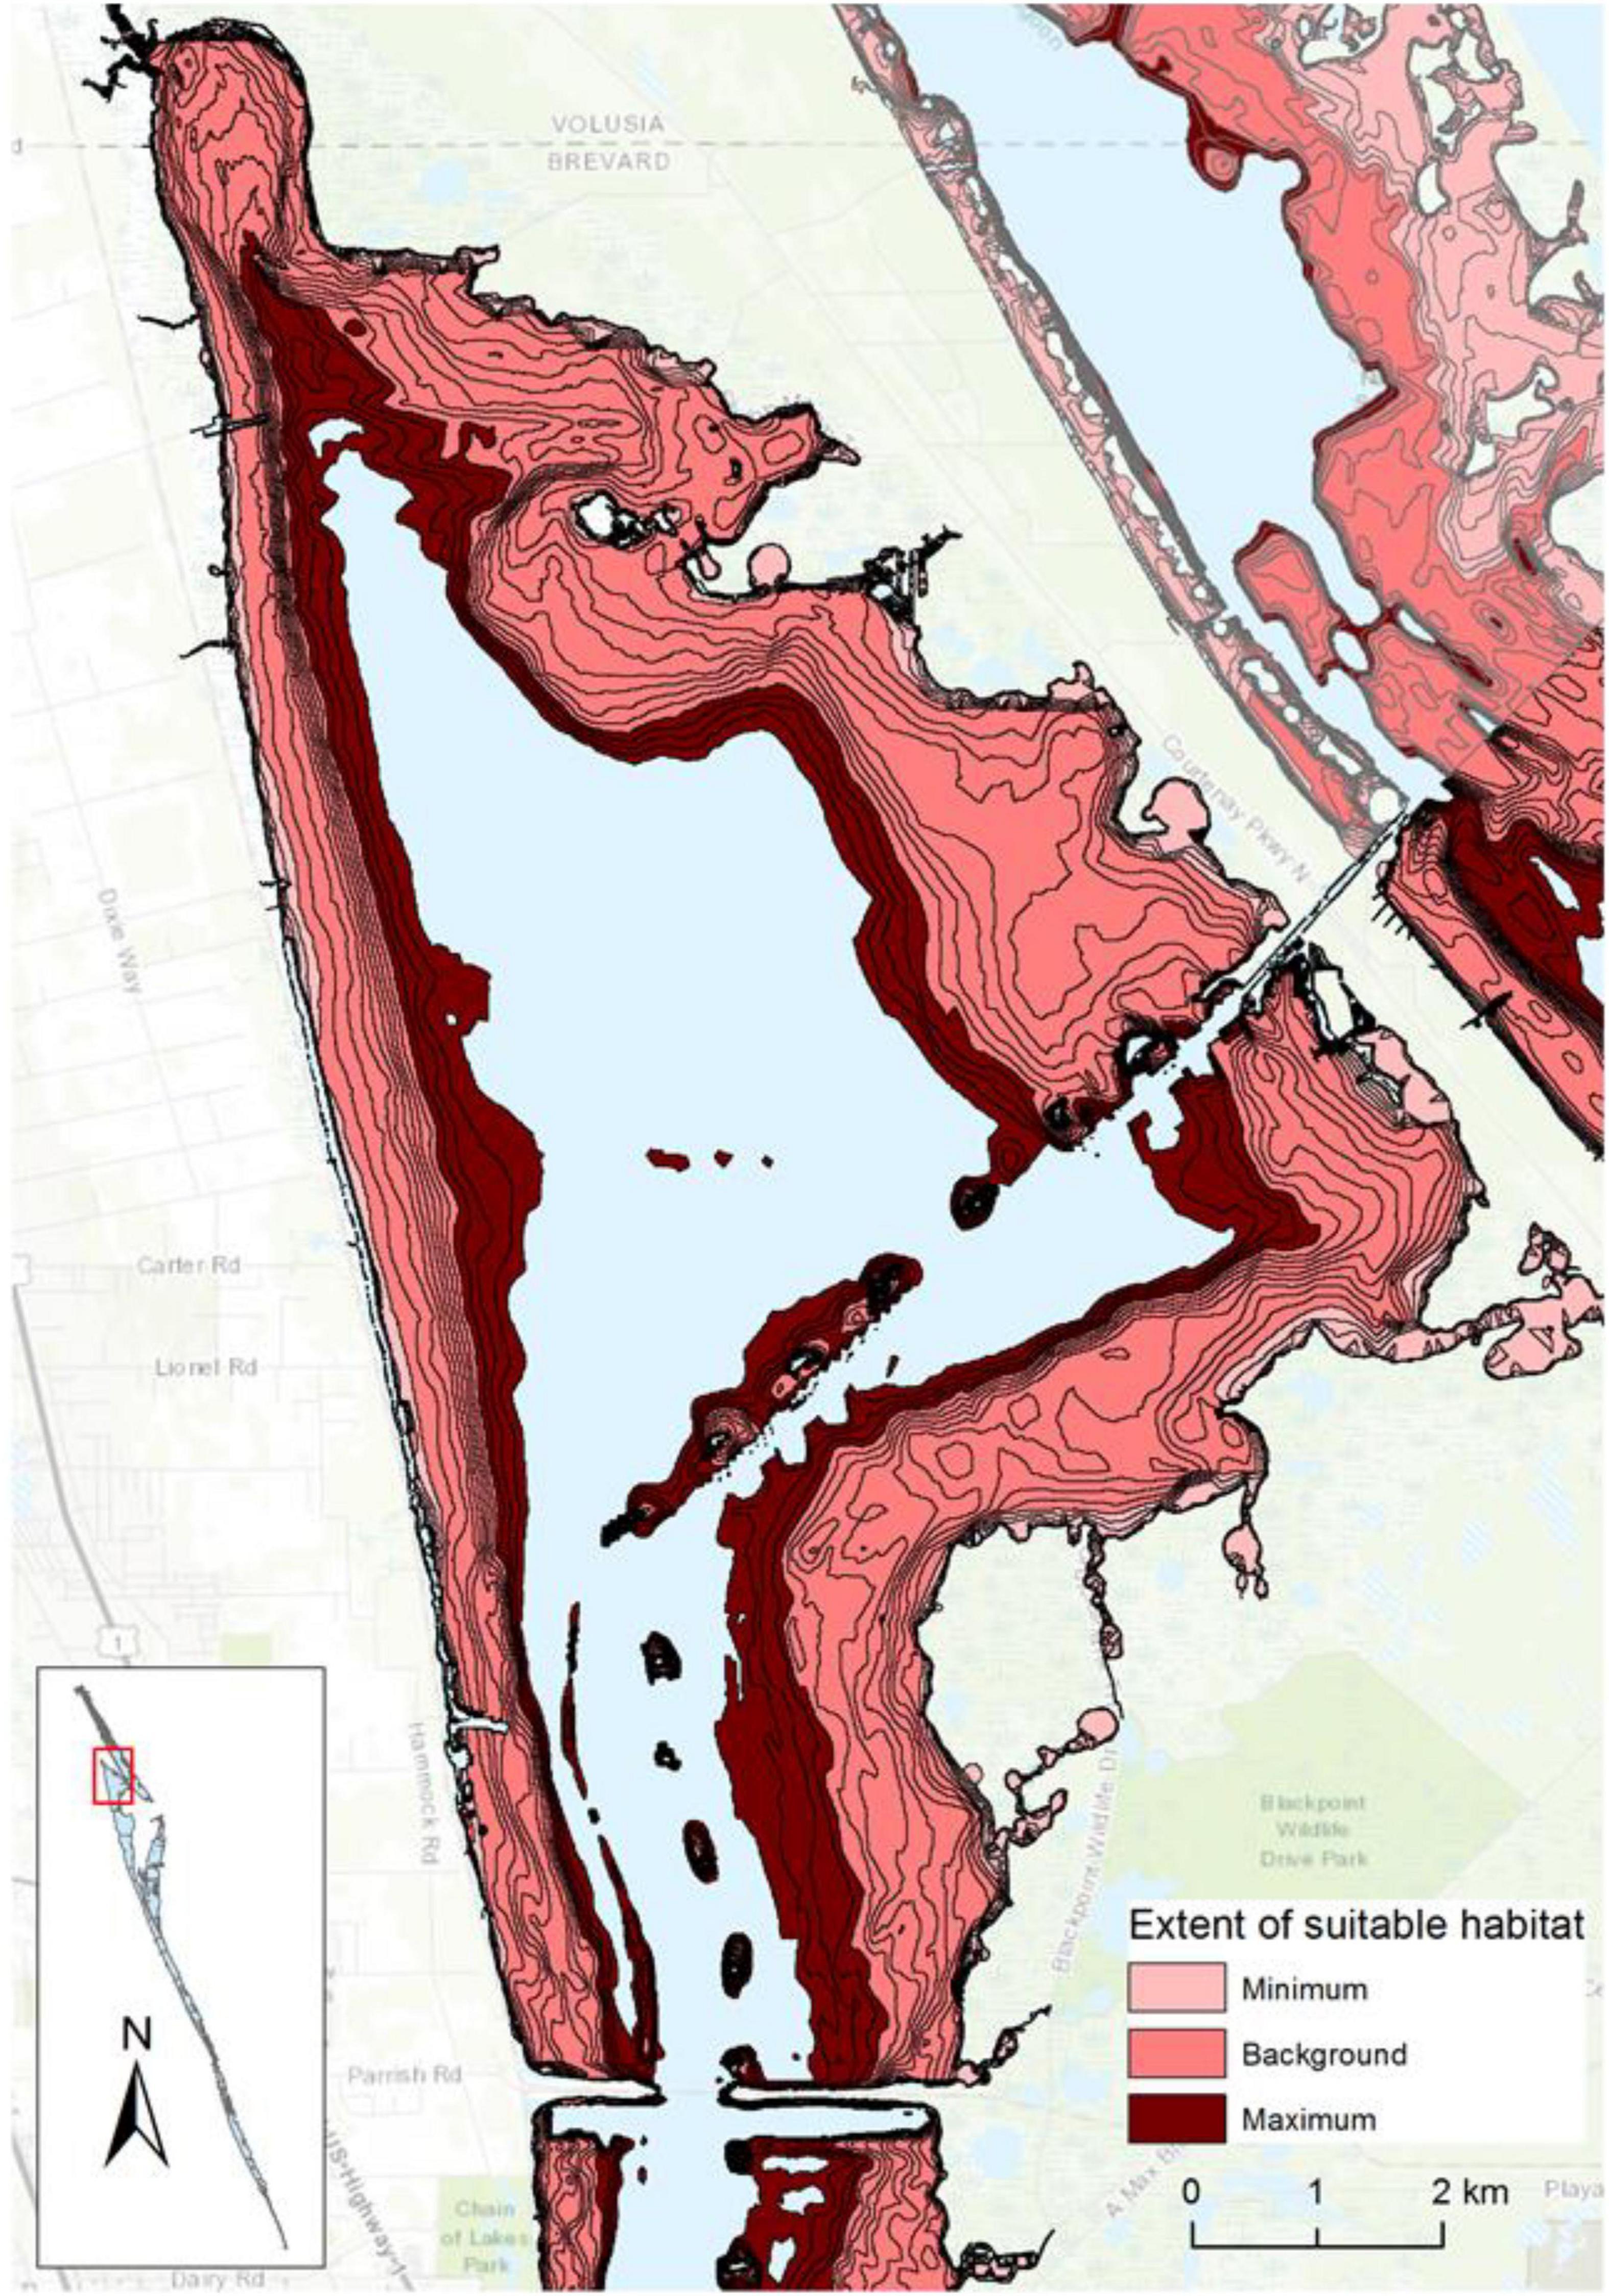
Figure 5. Extent of suitable light regime for drift macroalgae in a portion of reaches 1 and 2, with the minimum extent from 1998 to 2020, background extent from 1998 to 2009, and maximum extent from 1998 to 2020 displayed. Topographic map source: ESRI, USGS, contour lines represent 0.1-m isobaths.
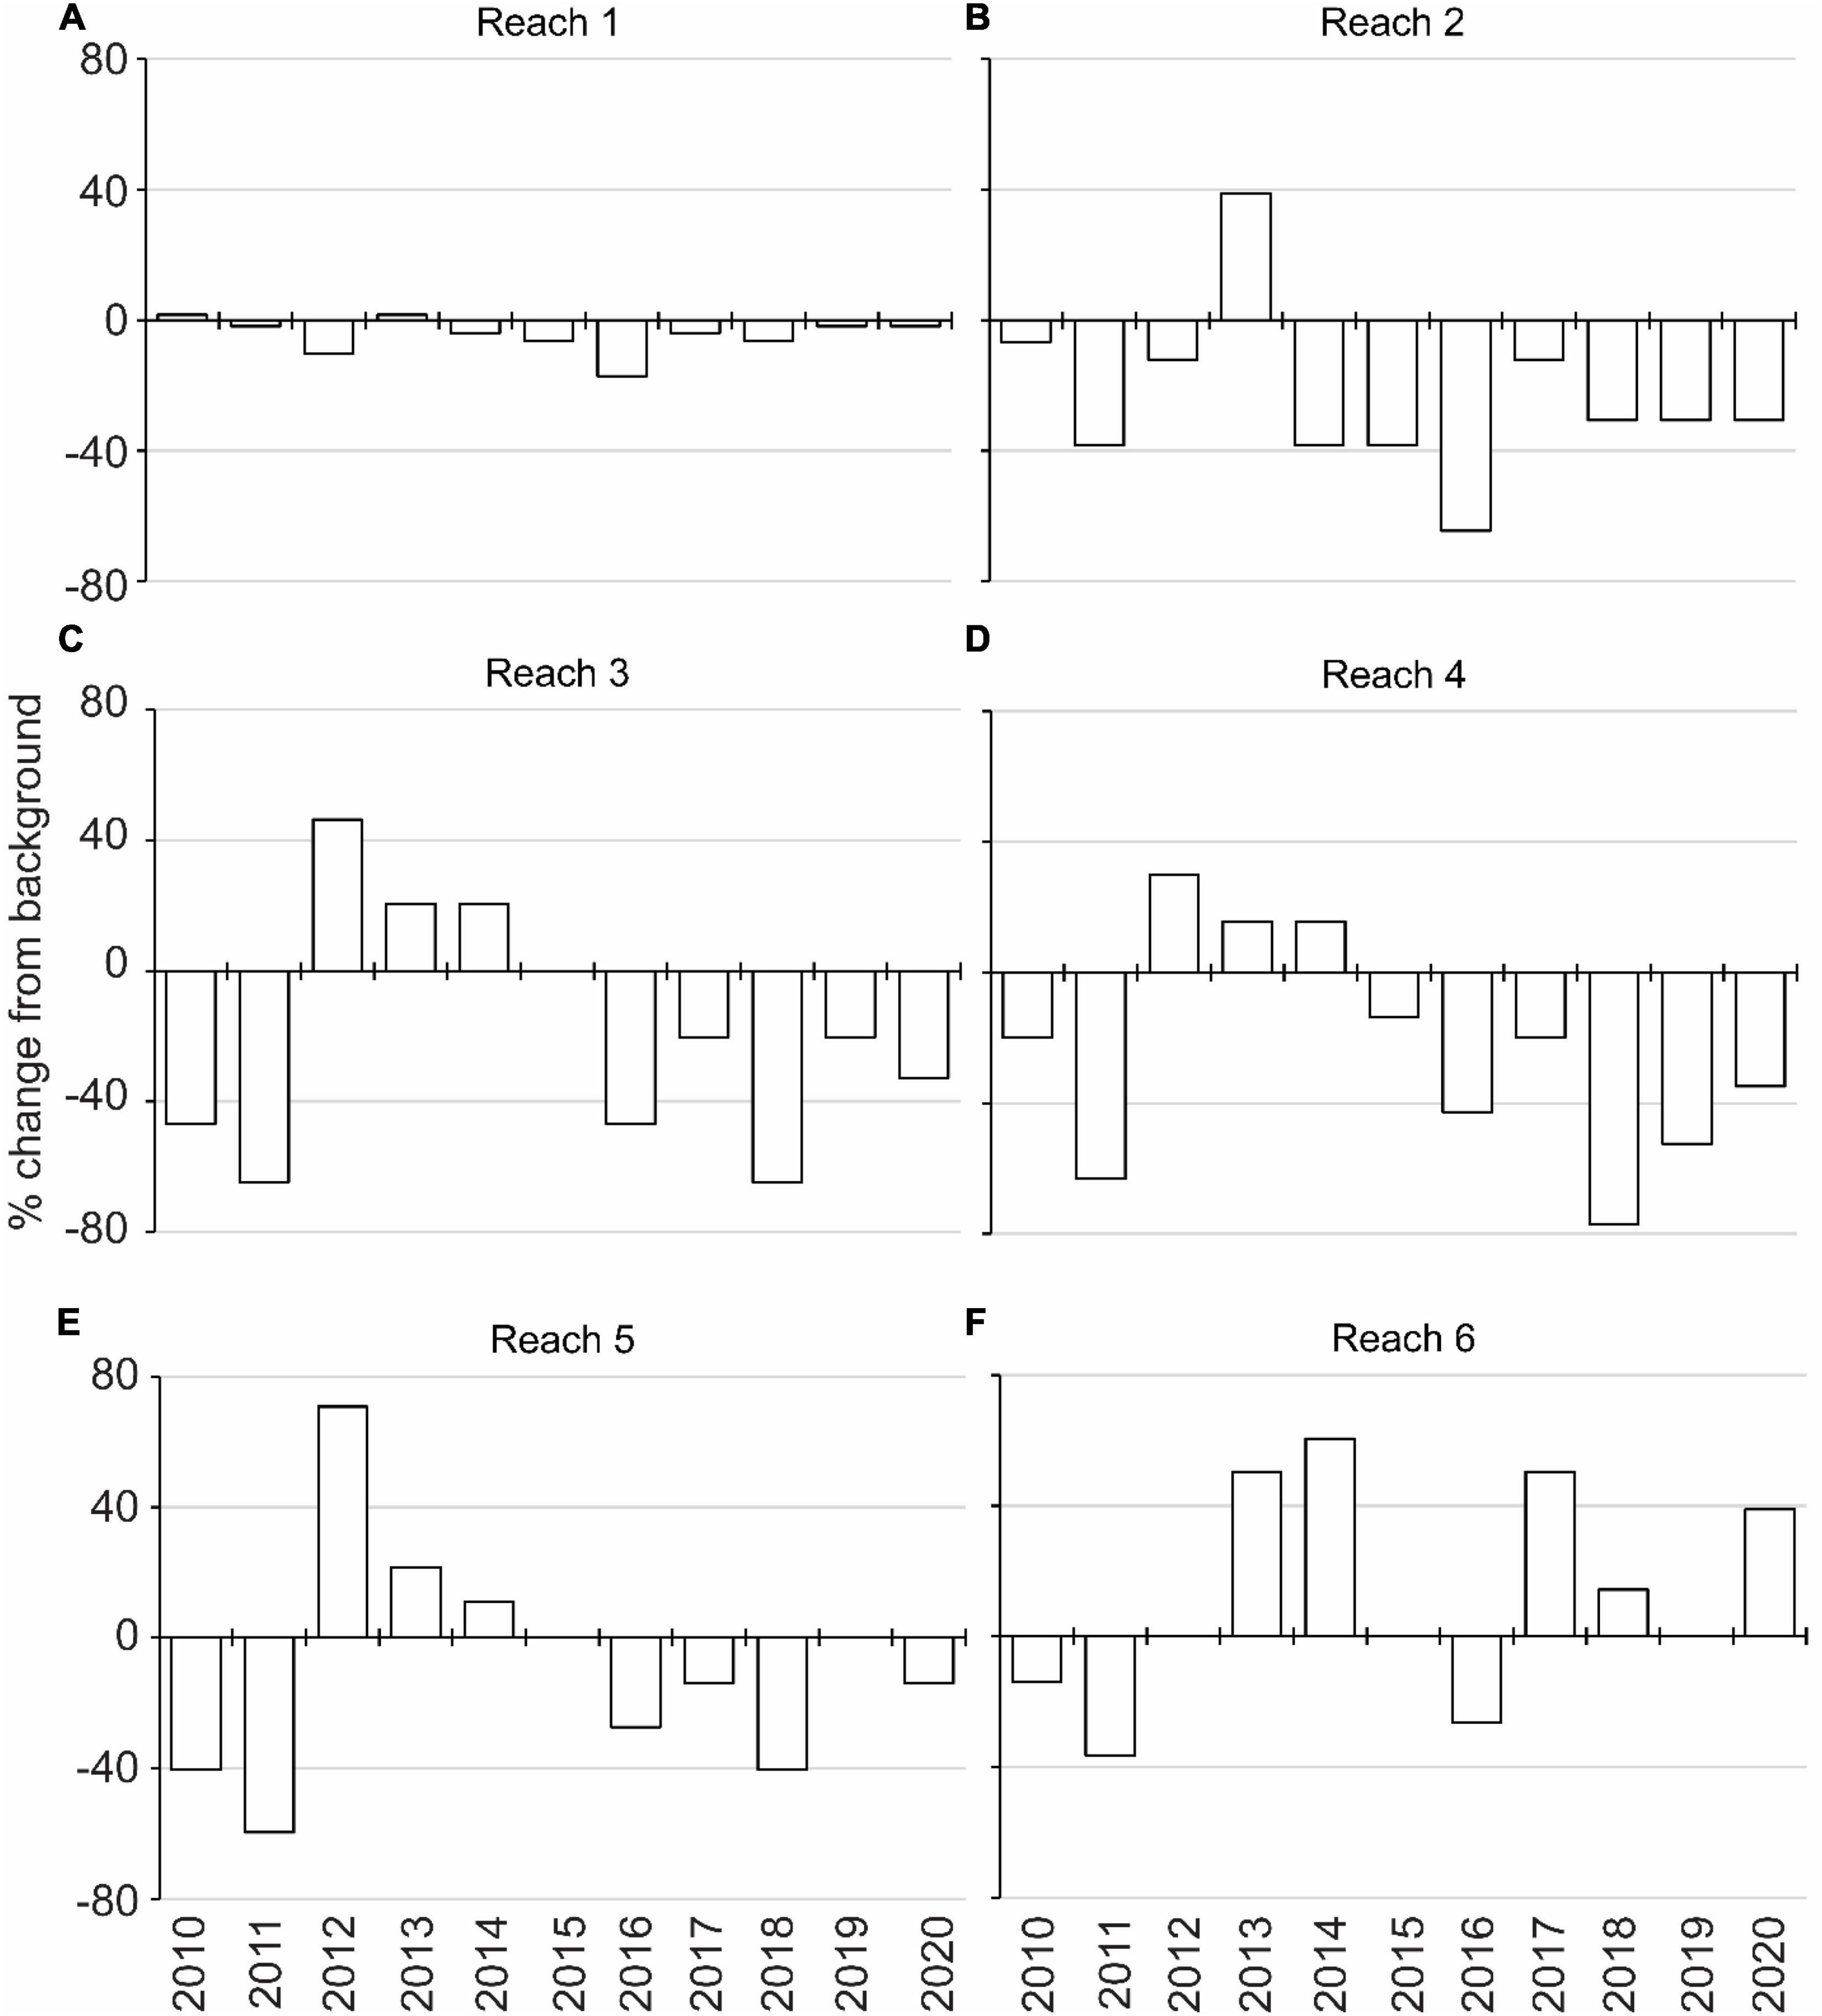
Figure 6. Annual percent change in the extent of suitable light regime for drift macroalgae compared to the background light regime (1998–2009) for reaches 1 through 6 (A–F).
Carbon, Nitrogen, and Phosphorus Stored in Drift Algae
Five species of DMA were collected from the field, Acanthophora spicifera, Agardhiella subulata, G. tikvahiae, C. secundus, and Hypnea spinella. A series of PERMANOVAs using elemental compositions of the three species collected multiple times, A. subulata, G. tikvahiae, and C. secundus, identified significant variation among the combination of species and sampling event for mean percent carbon (p10,212 = 0.001), nitrogen (p10,212 = 0.001), and phosphorus (p10,212 = 0.002). Mean carbon content ±SE varied from 16.6 ± 0.6% for A. subulata in July 2014 to 33.9 ± 0.4% for C. secundus in April 2015, mean nitrogen content ± SE varied from 1.5 ± 0.1% for A. subulata in August 2015 to 3.6 ± 0.1% for C. secundus in April 2015, and mean phosphorus content ± SE varied from 0.04 ± 0.003% for C. secundus in April 2015 to 0.2 ± 0.006% for G. tikvahiae in August 2014 (Supplementary Table 3). These results pointed to the value of expanded surveys to determine temporal, spatial, and interspecific variation in elemental compositions of DMA. These data can be used to make multiple estimates of changes in the amounts of carbon, nitrogen, and phosphorus stored in DMA, and as an example to illustrate the importance of such changes, the overall median percent compositions were multiplied by the relevant dry weights.
Based on mean annual biomass of DMA along transects, all reaches had less carbon, nitrogen, and phosphorus stored in DMA tissues in 2020 when compared to the amounts documented from 1998 to 2009 (Table 3). The losses of biomass ranged from 21% in reach 9 to 93% in reach 4 (Table 3). The decreases suggested that carbon, nitrogen, and phosphorus became available for uptake by other primary producers, such as phytoplankton.
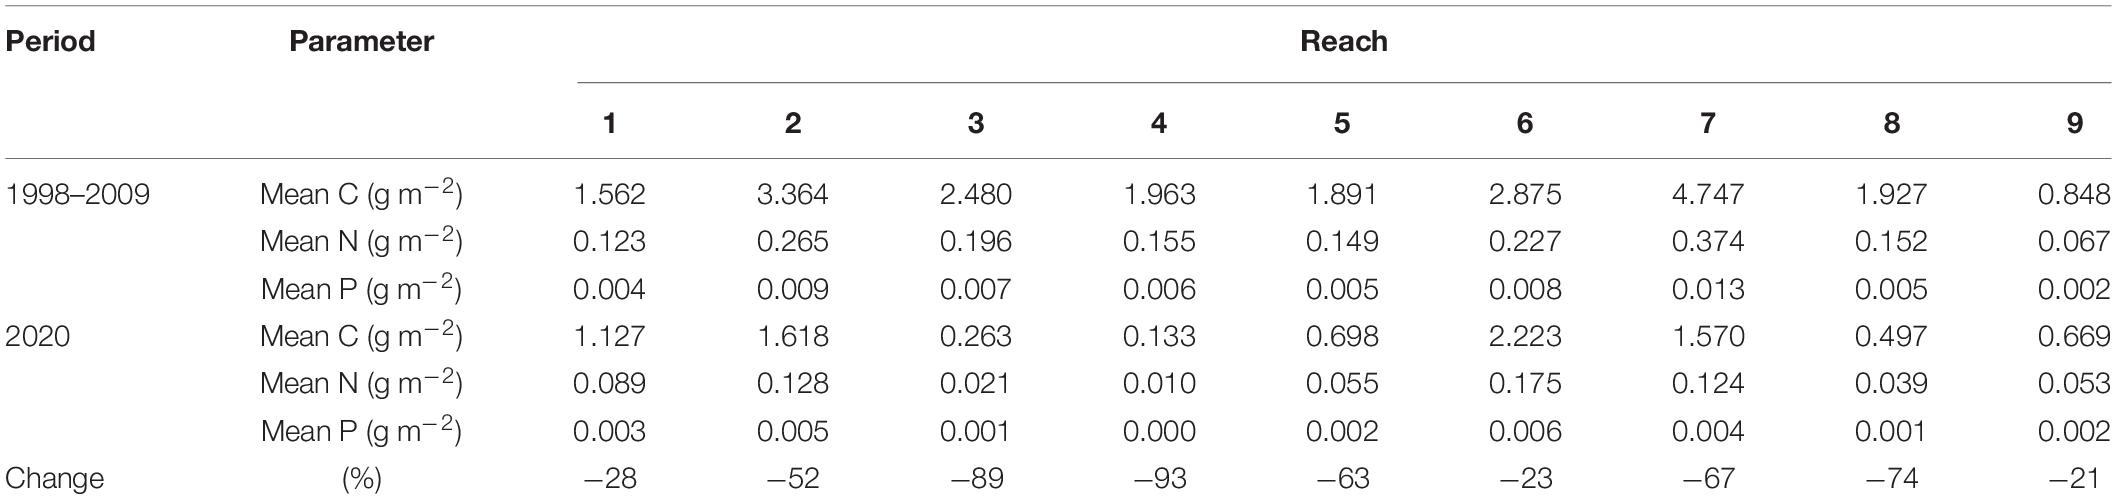
Table 3. Estimated carbon (C), nitrogen (N), and phosphorus (P) found in drift macroalgae along transects.
Discussion
Biomass of DMA varied significantly in space and through time, widespread decreases in biomass were related to thresholds for environmental tolerances as determined by incubations in the laboratory and field data, and less DMA translated into less carbon, nitrogen and phosphorus being stored in DMA. High biomass was recorded in different seasons, years, and reaches by the different methods, but low biomass was recorded by multiple sampling methods during 2010–2012 and in 2016, especially in reaches 1 through 6 where DMA was more common and abundant. Both these reductions in biomass of DMA followed periods of low light availability, and the 2010–2012 change also followed periods with potentially stressful low and high temperatures. Incubations indicated that light availability was a dominant influence, with less than ∼100 μmol m–2 s–1 leading to stress, and based on this threshold, there were widespread decreases in suitable habitat in 2010–2012, 2016, and 2018. During these periods, less carbon, nitrogen, and phosphorus were stored in DMA, with more of these elements likely to be available for uptake by other primary producers.
Although the biomass of DMA in the lagoon did not vary consistently between seasons in most years, it tended to be more abundant in March–July, and given the differences in sampling intensity and methodology, these results correspond well with previous surveys in the Indian River Lagoon (Benz et al., 1979; Kulczycki et al., 1981; Virnstein and Carbonara, 1985; Hanisak, 2021). Differences among the reports tended to occur in the cooler months, which was not unexpected given interannual variability in water temperatures. This temporal pattern was disrupted in 2010–2012 and 2016, with reduced light availability and stressful temperatures being apparent influences. The decreased availability of light coincided with phytoplankton blooms that increased light attenuation coefficients above the 90th percentiles for 6–8 months in all reaches during the 28 months from July 2010 to October 2012 and 6–12 months in reaches 1, 2, and 3 during the 18 months from July 2015 to December 2016 (Phlips et al., 2021; Lasi et al., this volume). A similar response to reductions in light availability caused by phytoplankton was noted in the coastal waters off Denmark (Nielsen et al., 2002).
The tolerances identified in incubations in the laboratory agreed with previous reports for various species of Gracilaria and species labeled as Hydropuntia. For example, five species of Gracilaria grew or photosynthesized in salinities ranging from <20 to >40 psu (Lapointe and Hanisak, 1985; Engledow and Bolton, 1992; Yokoya et al., 1999; Orduña-Rojas et al., 2013; de Paiva Alves et al., 2021), but Gracilaria textorii and Gracilaria vermiculophylla from Japan did not survive in 10 or 15 psu (Raikar et al., 2001) so adaptation to local conditions may have been an important influence. Similarly, growth or net photosynthesis typically was recorded across a broad range of temperatures (8–42°C) for fourteen species of Gracilaria and two species of Hydropuntia, with most species doing best at 20–30°C (Lapointe et al., 1984; Lapointe and Hanisak, 1985; Hanisak, 1987; Engledow and Bolton, 1992; Yokoya and Oliveirã, 1992; Dawes et al., 1998; Yokoya et al., 1999; Raikar et al., 2001; Abreau et al., 2011; Nejrup et al., 2013; Orduña-Rojas et al., 2013; Vo et al., 2015; Castro and Yokoya, 2019). Growth and photosynthesis also varied with available light for six species of Gracilaria and two species of Hydropuntia, with algae surviving when held at <40 μmol m–2 s–1, exhibiting little increase in growth rate or photosynthetic rate above ∼100 μmol m–2 s–1, and displaying an ability to cope with more extreme temperatures when sufficient light was available (Lapointe et al., 1984; Lapointe and Hanisak, 1985; Hanisak, 1987; Engledow and Bolton, 1992; Dawes et al., 1998; Yokoya et al., 1999; Abreau et al., 2011; Nejrup et al., 2013; Orduña-Rojas et al., 2013; Vo et al., 2015; Castro and Yokoya, 2019).
Decreases in the biomass of DMA reduced storage of carbon, nitrogen, and phosphorus in this pool, and these elements should have become available to other primary producers. As an example, the amounts stored in DMA were calculated by multiplying the total amount of biomass in reaches 2–6 as estimated from the 2015 hydroacoustic survey (16,000 MT dry weight) by the conversion factors derived from samples of DMA. These calculations yielded estimates of 4,400 MT of carbon, 410 MT of nitrogen, and 13 MT of phosphorus stored in DMA. Applying the mean change in the biomass of DMA along transects in reaches 2–6 calculated for 2019 (−38%; Table 3) to these values indicated that 2,800 MT of carbon, 260 MT of nitrogen, and 8 metric tons of phosphorus would have become available. Given the volumes of reaches 2–6 and an assumption of no uptake, concentrations of carbon, nitrogen, and phosphorus in the water column would have increased by 1.419, 0.132, and 0.004 mg L–1, respectively. These changes represented 14, 14, and 18% of the mean concentrations of dissolved organic carbon, dissolved nitrogen, and dissolved phosphorus in reaches 2–6 from 1997 to 2009, respectively (St. Johns River Water Management District, unpub. data). Thus, DMA played an important role in the cycling of elements in the lagoon that managers should consider.
Given that DMA play an important role in cycling of elements in the lagoon, managers could consider harvesting DMA to remove nitrogen and phosphorus and prevent shading of seagrass (Virnstein and Carbonara, 1985; Sfriso et al., 2020). Such an action demands careful consideration because removing DMA may increase the quantities of carbon, nitrogen, and phosphorus available to phytoplankton, but this issue could be addressed by timing the harvest to the period following maximum growth (Braun, 2020). In addition, less DMA translates into less structural habitat in the lagoon (Gore et al., 1981; Kulczycki et al., 1981; Virnstein and Howard, 1987; Holmquist, 1997; Monagail et al., 2017). For example, evidence has suggested that loss of DMA reduces refuge from predation for many macroinvertebrates (Heck, 1979; Heck and Thoman, 1981; Stoner, 1985; Stoner and Lewis, 1985; Edgar, 1987) and alters the composition of assemblages of benthic invertebrates due to species specific responses (Norkko et al., 2000).
Overall, management of the lagoon would be improved by a better understanding of the ecological roles played by DMA and attached macroalgae. Beyond elucidating its roles in cycling of elements and as a habitat, regular surveys that document the distribution, abundance, and diversity of DMA, experiments to elucidate the drivers of changes in the distribution and abundance of DMA more fully, and experiments to untangle the relationship between DMA and seagrass would supply valuable information to decision makers. In all cases, effort needs to be expanded to additional species of DMA and due consideration should be given to attached macroalgae. For example, DMA in reaches 2 and 4 during 2014–2015 were dominated by Chaetomorpha sp., large blooms of this green alga have blanketed seagrass in other locations (Pulich et al., 1997; Kennish et al., 2010; Gao et al., 2013), and approximately 35% of drift algae in parts of the lagoon are not Gracilaria (Hanisak, 2021). An increased likelihood of such blooms could be driven by climate change because green algae tolerated relatively high temperatures (Menéndez and Comín, 2000). Furthermore, blooms of DMA have been shown to shade seagrasses or self-shade, which increased concentrations of nutrients in the water column due to decomposition (Holmquist, 1994, 1997; Hauxwell et al., 2001; Cummins et al., 2004; Gao et al., 2013; Foster et al., 2018). Additionally, Fox et al. (2008) stated that Cladophora vagabunda and G. tikvahiae in locations with higher nitrogen loads from their watersheds stored up to 250% of the annual load. Similar roles may be played by attached algae. For example, Caulerpa prolifera has been documented as the dominant vegetation in the northern Indian River Lagoon and in deeper areas in Banana River Lagoon (White and Snodgrass, 1990; Provancha and Scheidt, 2000), and this species has demonstrated an ability to take up significant amounts of ammonium (Alexandre and Santos, 2020) so its role in cycling of nutrients should be considered.
In conclusion, reduced light availability and extreme temperatures in the IRL likely contributed to decreased growth or mortality of DMA. In turn, less DMA likely promoted phytoplankton blooms because more carbon, nitrogen, and phosphorus became available. The presence of DMA in the IRL has been recognized for decades (Thompson, 1978), but an increased understanding of its roles will support improved management of the system.
Data Availability Statement
The raw data supporting the conclusions of this article will be made available by the authors, without undue reservation, to any qualified researcher.
Author Contributions
All authors contributed to designing components of the study. MH conducted the incubations to determine tolerances and generated data on elemental composition. RP and BR provided valuable biomass data. CJ performed statistical analysis. LH and LM drafted the manuscript.
Funding
Parts of this research were funded by contracts from the St. Johns River Water Management District.
Conflict of Interest
The authors declare that the research was conducted in the absence of any commercial or financial relationships that could be construed as a potential conflict of interest.
The handling editor is currently organizing a Research Topic with one of the authors CJ.
Publisher’s Note
All claims expressed in this article are solely those of the authors and do not necessarily represent those of their affiliated organizations, or those of the publisher, the editors and the reviewers. Any product that may be evaluated in this article, or claim that may be made by its manufacturer, is not guaranteed or endorsed by the publisher.
Acknowledgments
The authors thank field crews from the St. Johns River Water Management District, Florida Fish and Wildlife Conservation Commission, South Florida Water Management District, NASA Environmental Consultants, Florida Department of Environmental Protection Fort Pierce Office of the Indian River Aquatic Preserve, Loxahatchee River District, and Marine Discovery Center. A special thank you to Greg Foster for his expertise with acoustic surveys, Whit Green for his work on designing the incubations to determine tolerances, Paul Wills and Chris Robinson for their work on the incubations, and John Hart for his assistance with incubations and field collections of DMA for analysis of elemental composition.
Supplementary Material
The Supplementary Material for this article can be found online at: https://www.frontiersin.org/articles/10.3389/fmars.2022.767440/full#supplementary-material
Supplementary Figure 1 | Extent of suitable habitat for drift macroalgae in hectares based on mean depths receiving 100 μmol m–2 s–1. Note different scales.
Supplementary Table 1 | Metadata for each method of sampling biomass of drift macroalgae.
Supplementary Table 2 | Estimates of carbon, nitrogen, and phosphorus found in drift macroalgae along transects extrapolated to extent of suitable habitat and reach volume.
Supplementary Table 3 | Elemental contents of common rhodophytes collected between July 2014 and August 2015.
Footnotes
References
Abreau, M. H., Pereira, R., Sousa-Pinto, I., and Yarish, C. (2011). Ecophysiological studies of the non-indigenous species Gracilaria vermiculophylla (Rhodophyta) and its abundance patterns in Ria de Aveiro lagoon, Portugal. Eur. J. Phycol. 46, 453–464. doi: 10.1080/09670262.2011.633174
Alexandre, A., and Santos, R. (2020). High nitrogen and phosphorous acquisition by belowground parts of Caulerpa prolifera (Chlorophyta) contribute to the species’ rapid spread in Ria Formosa Lagoon, southern Portugal. J. Phycol. 56, 608–617. doi: 10.1111/jpy.12988
Anderson, M. J., Gorley, R. N., and Clarke, K. R. (2008). PERMANOVA+ for PRIMER: Guide to Software and Statistical Methods. Plymouth: PRIMER-E.
Benz, M. C., Eiseman, N. J., and Gallaher, E. E. (1979). Seasonal occurrence and variation in standing crop of a drift algal community in the Indian River, Florida. Bot. Mar. 22, 413–420. doi: 10.1515/botm.1979.22.7.413
Biber, P. D., Harwell, M. A., and Cropper, W. P. Jr. (2004). Modeling the dynamics of three functional groups of macroalgae in tropical seagrass habitats. Ecol. Model. 175, 25–54. doi: 10.1016/J.ECOLMODEL.2003.10.003
Braun, G. E. (2020). Cost-benefit Analysis of Macroalgal Harvesting for Nitrogen Abatement. Master’s thesis. Cambridge, MA: Harvard University.
Burkholder, J. M., Tomasko, D. A., and Touchette, B. W. (2007). Seagrasses and eutrophication. J. Exp. Mar. Biol. Ecol. 350, 46–72. doi: 10.1016/j.jembe.2007.06.024
Castro, J. Z., and Yokoya, N. S. (2019). Growth and biochemical responses of tropical and subtropical strains of Gracilaria domingensis (Gracilariales, Rhodophyta) to temperature and irradiance variations. J. Appl. Phycol. 31, 607–613. doi: 10.1007/s10811-018-1520-4
Coastal Planning & Engineering (1997). Indian River Lagoon Bathymetric Survey. Boca Raton, FL: Coastal Planning & Engineering.
Cummins, S. P., Roberts, D. E., and Zimmerman, K. D. (2004). Effects of the green macroalga Enteromorpha intestinalis on macrobenthic and seagrass assemblages in a shallow coastal estuary. Mar. Ecol. Prog. Ser. 266, 77–87. doi: 10.3354/MEPS266077
Dawes, C. J., Mathieson, A. C., and Cheney, D. P. (1974). Ecological studies of Floridian Eucheuma (Rhodophyta, Gigartinales). I. Seasonal growth and reproduction. Bull. Mar. Sci. 24, 235–273.
Dawes, C. J., Orduña-Rojas, J., and Robledo, D. (1998). Response of the tropical red seaweed Gracilaria cornea to temperature, salinity and irradiance. J. Appl. Phycol. 10, 419–425. doi: 10.1023/A:1008021613399
de Paiva Alves, J., Bessa, A. P. Jr., and Henry-Silva, G. G. (2021). Salinity tolerance of macroalgae Gracilaria birdiae. Ciênc. Rural 51:e20190958. doi: 10.1590/0103-8478cr20190958
Duarte, C. M. (1995). Submerged aquatic vegetation in relation to different nutrient regimes. Ophelia 41, 87–112. doi: 10.1080/00785236.1995.10422039
Duarte, C. M., Marbà, N., Gacia, E., Fourqurean, J. W., Beggins, J., Barrón, C., et al. (2010). Seagrass community metabolism: assessing the carbon sink capacity of seagrass meadows. Glob. Biogeochem. Cycles 24, 1–8. doi: 10.1029/2010GB003793
Edgar, G. J. (1987). Dispersal of faunal and floral propagules associated with drifting Macrocystis pyrifera plants. Mar. Biol. 95, 599–610. doi: 10.1007/BF00393104
Engledow, H. R., and Bolton, J. J. (1992). Environmental tolerances in culture and agar content of Gracilaria verrucosa (Hudson) Papenfuss (Rhodophyta, Gigartinales) from Saldanha Bay. S. Afr. J. Bot. 58, 263–267. doi: 10.1016/S0254-6299(16)30845-6
Florida Department of Environmental Protection (2017). Department of Environmental Protection Standard Operating Procedures for Field Activities, DEP-SOP-001/1. Tallahassee, FL: Florida Department of Environmental Protection.
Foster, G., Riegl, B. M., Morris, L. J., and Foster, K. A. (2018). Reproducible multi-parameter acoustic detection of seasonal drift macroalgae in the Indian River Lagoon, Florida. J. Coast. Conserv. 22, 587–604. doi: 10.1007/s11852-018-0593-1
Fox, S. E., Stieve, E., Valiela, I., Hauxwell, J., and McClelland, J. (2008). Macrophyte abundance in Waquoit Bay: effects of land-derived nitrogen loads on seasonal and multi-year biomass patterns. Estuaries Coasts 31, 532–541. doi: 10.1007/s12237-008-9039-6
FWC-FWRI (2016). Fisheries-Independent Monitoring Program Procedure Manual. St. Petersburg, FL: Florida Fish and Wildlife Research Institute.
Gao, L., Zhang, L., Hou, J., Wei, Q., Fu, F., and Shao, H. (2013). Decomposition of macroalgal blooms influences phosphorus release from sediments and implications for coastal restoration in Swan Lake, Shandong, China. Ecol. Eng. 60, 19–28. doi: 10.1016/j.ecoleng.2013.07.055
Gore, R. H., Gallaher, E. E., Scotto, L. E., and Wilson, K. A. (1981). Studies on decapod crustacea from the Indian River Region of Florida: XI. Community composition, structure, biomass and species-areal relationships of seagrass and drift algae-associated macrocrustaceans. Estuar. Coast. Shelf Sci. 12, 485–508. doi: 10.1016/S0302-3524(81)80007-2
Hanisak, M. D. (1983). “The nitrogen relationship of marine macroalgae,” in Nitrogen in the Marine Environment, eds E. J. Carpenter and D. G. Capone (New York, NY: Academic Press), 699–730. doi: 10.1016/B978-0-12-160280-2.50027-4
Hanisak, M. D. (1987). “Cultivation of Gracilaria and other macroalgae in Florida for energy production,” in Seaweed Cultivation for Renewable Resources, eds K. T. Bird and P. H. Benson (New York, NY: Elsevier), 191–218.
Hanisak, M. D. (1990). The use of Gracilaria tikvahiae (Gracilariales, Rhodophyta) as a model system to understand the nitrogen nutrition of cultured seaweeds. Hydrobiologia 204, 79–87. doi: 10.1007/BF00040218
Hanisak, M. D. (1993). Nitrogen release from decomposing seaweeds: species and temperature effects. J. Appl. Phycol. 5, 175–181. doi: 10.1007/BF00004014
Hanisak, M. D. (2016). Algal Bloom Investigation: Analysis of Submersed Aquatic Vegetations Tissue Nutrient Content and Response of Drift Macroalgae to Extreme Levels of Salinity, Temperature, and Light. Final Report Contract 27857. Palatka, FL: St. Johns River Water Management District, 1–108.
Hanisak, M. D. (2021). Macroalgal biodiversity of the Indian River Lagoon: updating the puzzle. Fla. Sci. 84, 92–118.
Hauxwell, J., Cebrián, J., Furlong, C., and Valiela, I. (2001). Macroalgal canopies contribute to eelgrass (Zostera marina) decline in temperate estuarine ecosystems. Ecology 82, 1007–1022. doi: 10.2307/2679899
Heck, K. L. (1979). Some determinants of the composition and abundance of motile macroinvertebrate species in tropical and temperate turtlegrass (Thalassia testudinum) meadows. J. Biogeogr. 6, 183–200. doi: 10.2307/3038051
Heck, K. L., and Thoman, T. A. (1981). Experiments on predator-prey interactions in vegetated aquatic habitats. J. Exp. Mar. Biol. Ecol. 53, 125–134. doi: 10.1016/0022-0981(81)90014-9
Hily, C., Connan, S., Raffin, C., and Wyllie-Echeverria, S. (2004). In vitro experimental assessment of the grazing pressure of two gastropods on Zostera marina L. epiphytic algae. Aquat. Bot. 78, 183–195. doi: 10.1016/j.aquabot.2003.10.001
Holmquist, J. G. (1994). Benthic macroalgae as a dispersal mechanism for fauna: influence of a marine tumbleweed. J. Exp. Mar. Biol. Ecol. 180, 235–251. doi: 10.1016/0022-0981(94)90069-8
Holmquist, J. G. (1997). Disturbance and gap formation in a marine benthic mosaic: influence of shifting macroalgal patches on seagrass structure and mobile invertebrates. Mar. Ecol. Prog. Ser. 158, 121–130. doi: 10.3354/meps158121
Jensen, P. R., and Gibson, R. A. (1986). Primary production in three subtropical seagrass communities: a comparison of four autotrophic components. Fla. Sci. 49, 129–141.
Josselyn, M. N. (1977). Seasonal changes in the distribution and growth of Laurencia poitei (Rhodophyceae, Ceramiales) in a subtropical lagoon. Aquat. Bot. 3, 217–229. doi: 10.1016/0304-3770(77)90024-9
Kennish, M. J., Haag, S. M., and Sakowicz, G. P. (2010). “Seagrass decline in New Jersey coastal lagoons: a response to increasing eutrophication,” in Coastal Lagoons: Critical Habitats of Environmental Change, eds M. J. Kennish and H. W. Paerl (Boca Raton, FL: Taylor and Francis Publishers), 167–201. doi: 10.1201/EBK1420088304
Kinney, E. H., and Roman, C. T. (1998). Response of primary producers to nutrient enrichment in a shallow estuary. Mar. Ecol. Prog. Ser. 163, 89–98. doi: 10.3354/meps163089
Kirk, J. T. O. (1983). Light and Photosynthesis in Aquatic Ecosystems. Canberra, ACT: Cambridge University Press.
Kulczycki, G. R., Virnstein, R. W., and Nelson, W. G. (1981). The relationship between fish abundance and algal biomass in a seagrass-drift algae community. Estuar. Coast. Shelf Sci. 12, 341–347. doi: 10.1016/S0302-3524(81)80130-2
Lapointe, B. E., and Hanisak, M. D. (1985). “Productivity and nutrition of marine biomass systems in Florida,” in Proceedings of the Symposium Papers. Energy from Biomass and Wastes IX: Lake Buena Vista, Florida, January 28–February 1, 1985, ed. D. L. Klass (Chicago, IL: Institute of Gas Technology), 111–126.
Lapointe, B. E., Tenore, K. R., and Dawes, C. J. (1984). Interactions between light and temperature on the physiological ecology of Gracilaria tikvahiae (Gigartinales: Rhodophyta) I. Growth, photosynthesis and respiration. Mar. Biol. 80, 161–170. doi: 10.1007/BF02180183
Lavery, P. S., and McComb, A. J. (1991). Macroalgal-sediment nutrient interactions and their importance to macroalgal nutrition in a eutrophic estuary. Estuar. Coast. Shelf Sci. 32, 281–295. doi: 10.1016/0272-7714(91)90021-3
Marshall, S. M., and Orr, A. P. (1949). Further experiments in the fertilization of a sea loch (Loch Craiglin). The effect of different plant nutrients on the phytoplankton. J. Mar. Biol. Assoc. U.K. 27, 360–379. doi: 10.1017/s002531540002542x
McGlathery, K. J., Sundbäck, K., and Anderson, I. C. (2007). Eutrophication in shallow coastal bays and lagoons: the role of plants in the coastal filter. Mar. Ecol. Prog. Ser. 348, 1–18. doi: 10.3354/meps07132
Menéndez, M., and Comín, F. A. (2000). Spring and summer proliferation of floating macroalgae in a Mediterranean coastal lagoon (Tancada Lagoon, Ebro Delta, NE Spain). Estuar. Coast. Shelf Sci. 51, 215–226. doi: 10.1006/ecss.2000.0637
Monagail, M. M., Cornish, L., Morrison, L., Araújo, R., and Critchley, A. T. (2017). Sustainable harvesting of wild seaweed resources. Euro. J. Phycol. 52, 371–390. doi: 10.1080/09670262.2017.1365273
Morris, L. J., Hall, L. M., and Virnstein, R. W. (2001). Field Guide for Fixed Seagrass Transect Monitoring in the Indian River Lagoon. Palatka, FL: St. Johns River Water Management District.
Nejrup, L. B., Staehr, P. A., and Thomsen, M. S. (2013). Temperature- and light-dependent growth and metabolism of the invasive red algae Gracilaria vermiculophylla – a comparison with two native macroalgae. Eur. J. Phycol. 48, 295–308. doi: 10.1080/09670262.2013.830778
Nielsen, S. L., Sand-Jensen, K., Borum, J., and Geertz-Hansen, O. (2002). Depth colonization of eelgrass (Zostera marina) and macroalgae as determined by water transparency in Danish coastal waters. Estuaries 25, 1025–1032. doi: 10.1007/BF02691349
Norkko, J., Bonsdorff, E., and Norkko, A. (2000). Drifting algal mats as an alternative habitat for benthic invertebrates: species specific responses to a transient resource. J. Exp. Mar. Biol. Ecol. 248, 79–104. doi: 10.1016/s0022-0981(00)00155-6
Orduña-Rojas, J., García-Rodríguez, L. D., López-Meyer, M., and Riosmena-Rodríguez, R. (2013). Photosynthetic and respiratory responses of Gracilaria parvispora from the southeastern Gulf of California. J. Appl. Phycol. 25, 1855–1861. doi: 10.1007/s10811-013-0010-y
Phlips, E. J., Badylak, S., Christman, M. C., and Lasi, M. A. (2010). Climatic trends and temporal patterns of phytoplankton composition, abundance and succession in the Indian River Lagoon, Florida, USA. Estuaries Coasts 33, 498–512. doi: 10.1007/s12237-009-9166-8
Phlips, E. J., Badylak, S., Christman, M., Wolny, J., Brame, J., Garland, J., et al. (2011). Scales of temporal and spatial variability in the distribution of harmful algae species in the Indian River, Florida, USA. Harmful Algae 10, 277–290. doi: 10.1016/j.hal.2010.11.001
Phlips, E. J., Badylak, S., Lasi, M., Chamberlain, R., Green, W., Hall, L., et al. (2015). From red tides to green and brown tides: bloom dynamics in a restricted subtropical lagoon under shifting climatic conditions. Estuaries Coasts 38, 886–904. doi: 10.1007/s12237-014-9874-6
Phlips, E. J., Badylak, S., Nelson, N. G., Hall, L. M., Jacoby, C. A., Lasi, M. A., et al. (2021). Cyclical patterns and a regime shift in the character of phytoplankton blooms in a restricted sub-tropical lagoon, Indian River Lagoon, Florida, United States. Front. Mar. Sci. 8:730934. doi: 10.3389/fmars.2021.730934
Pitts, P. A. (1989). Upwind return flow in a coastal lagoon: seasonal-scale barotropic transport. Estuaries 12, 92–97. doi: 10.2307/1351500
Provancha, J. A., and Scheidt, D. M. (2000). “Long-term trends in seagrass beds in the Mosquito Lagoon and northern Banana River, Florida,” in Seagrasses: Monitoring, Ecology, Physiology and Management, ed. S. A. Bortone (Boca Raton, FL: CRC Press), 177–193. doi: 10.1201/9781420074475.ch14
Pulich, W., Blair, C., and White, W. A. (1997). Current Status and Historical Trends of Seagrasses in the Corpus Christi Bay National Estuary Program study area. Austin, TX: Texas Natural Resource Conservation Commission, 1–56.
Raikar, S. V., Iima, M., and Fujita, Y. (2001). Effect of temperature, salinity and light intensity on the growth of Gracilaria spp. (Gracilariales, Rhodophyta) from Japan, Malaysia and India. Indian J. Mar. Sci. 30, 98–104.
Riegl, B., and Bushkirk, B. (2016). Mapping the Distribution and Abundance of Macroalgae in the Indian River Lagoon. Final Report Contract 27793. Palatka, FL: St. Johns River Water Management District, 1–29.
Sfriso, A., Mistri, M., Munari, C., Buosi, A., and Sfriso, A. A. (2020). Management and exploitation of macroalgal biomass as a tool for the recovery of transitional water systems. Front. Ecol. Evol. 8:20. doi: 10.3389/fevo.2020.00020
Smith, N. P. (1987). An introduction to the tides of Florida’s Indian River Lagoon. I. Water levels. Fla. Sci. 50, 49–61.
Steward, J. S., Virnstein, R. W., Morris, L. J., and Lowe, E. F. (2005). Setting seagrass depth, coverage, and light targets for the Indian River Lagoon system Florida. Estuaries 28, 923–935. doi: 10.1007/bf02696020
Stoner, A. W. (1980). The role of seagrass biomass in the organization of benthic macrofaunal assemblages. Bull. Mar. Sci. 30, 537–551.
Stoner, A. W. (1985). Penicillus capitatus: an algal island for macrocrustaceans. Mar. Ecol. Prog. Ser. 26, 279–287. doi: 10.3354/meps026279
Stoner, A. W., and Lewis, F. G. (1985). The influence of quantitative and qualitative aspects of habitat complexity in tropical sea-grass meadows. J. Exp. Mar. Biol. Ecol. 94, 19–40. doi: 10.1016/0022-0981(85)90048-6
Thompson, M. J. (1978). Species composition and distribution of seagrass beds in the Indian River Lagoon, Florida. Fla. Sci. 4, 90–96.
University of Florida, Institute of Food and Agricultural Sciences (2022). Florida Automated Weather Network. Available online at: https://fawn.ifas.ufl.edu/ (accessed April 2020).
University of Maryland (2022). Nutrient Analytical Services Laboratory. Available online at: http://umces.edu/nutrient-analytical-services-laboratory (accessed January 2022).
Viaroli, P., Bartoli, M., Giordani, G., Naldi, M., Orfanidis, S., and Zaldivar, J. M. (2008). Community shifts, alternative stable states, biogeochemical controls and feedbacks in eutrophic coastal lagoons: a brief overview. Aquatic Conserv. Mar. Freshw. Ecosyst. 18, S105–S117. doi: 10.1002/aqc.956
Virnstein, R. W., and Carbonara, P. A. (1985). Seasonal abundance and distribution of drift algae and seagrasses in the mid-Indian River Lagoon, Florida. Aquat. Bot. 23, 67–82. doi: 10.1016/0304-3770(85)90021-X
Virnstein, R. W., and Howard, R. K. (1987). Motile epifauna of marine macrophytes in the Indian River Lagoon, Florida. II. Comparisons between drift algae and three species of seagrasses. Bull. Mar. Sci. 41, 13–26.
Virnstein, R. W., and Morris, L. J. (1996). Seagrass Preservation and Restoration: A Diagnostic Plan for the Indian River Lagoon. Technical Memorandum No. 14. Palatka, FL: St. Johns River Water Management District, 1–43.
Vo, T. D., Nishihara, G. N., Kitamura, Y., Shimada, S., Kawaguchi, S., and Terada, R. (2015). The effect of irradiance and temperature on the photosynthesis of Hydropuntia edulis and Hydropuntia eucheumatoides (Gracilariaceae, Rhodophyta) from Vietnam. Phycologia 54, 24–31. doi: 10.2216/14-61R1.1
White, C., and Snodgrass, J. W. (1990). Recent changes in the distribution of Caulerpa prolifera in the Indian River Lagoon, Florida. Fla. Sci. 53, 85–88.
Yokoya, N. S., and Oliveirã, E. C. (1992). Temperature responses of economically important red algae and their potential for mariculture in Brazilian waters. J. Appl. Phycol. 4, 339–345. doi: 10.1007/BF02185791
Keywords: abundance, physiological tolerance, nutrient content, nutrient cycling, habitat suitability
Citation: Hall LM, Morris LJ, Chamberlain RH, Hanisak MD, Virnstein RW, Paperno R, Riegl B, Ellis LR, Simpson A and Jacoby CA (2022) Spatiotemporal Patterns in the Biomass of Drift Macroalgae in the Indian River Lagoon, Florida, United States. Front. Mar. Sci. 9:767440. doi: 10.3389/fmars.2022.767440
Received: 30 August 2021; Accepted: 10 January 2022;
Published: 01 February 2022.
Edited by:
Kevin Brett Johnson, Florida Institute of Technology, United StatesReviewed by:
Gary Raulerson, Tampa Bay Estuary Program, United StatesJay Leverone, Sarasota Bay Estuary Program, United States
Copyright © 2022 Hall, Morris, Chamberlain, Hanisak, Virnstein, Paperno, Riegl, Ellis, Simpson and Jacoby. This is an open-access article distributed under the terms of the Creative Commons Attribution License (CC BY). The use, distribution or reproduction in other forums is permitted, provided the original author(s) and the copyright owner(s) are credited and that the original publication in this journal is cited, in accordance with accepted academic practice. No use, distribution or reproduction is permitted which does not comply with these terms.
*Correspondence: Lauren M. Hall, lhall@sjrwmd.com