Modulation of Antioxidant Enzymes, Heat Shock Protein, and Intestinal Microbiota of Large Yellow Croaker (Larimichthys crocea) Under Acute Cold Stress
 Huirong Lv1
  Yanli Liu1
  Haidong Li1 Xiaolong Yin2 Ping Wang1 Xiaoyu Qu1
  Yang Gao1* Weiye Li2* Zhangjie Chu1
- 1Fishery School, Zhejiang Ocean University, Zhoushan, China
- 2Aquaculture Genetics and Breeding Laboratory, Zhoushan Fisheries Research Institute, Zhoushan, China
The experiment was conducted in a sealed, temperature-controlled room. The initial water temperature of the treatment group was 12°C, lowered by 1°C a day to 8°C using a chiller, and maintained at that temperature for 3 days. The water temperature was then increased by 1°C per day to 12°C using a heater. The control group were the fish that kept at 12°C at the beginning of the experiment; T1 represents the group that sampled on the first day when the water temperature reached 8 from 12°C; T2 represents the group that sampled when the fish had been kept at 8°C for 3 days; T3 represents the group sampled when the water temperature was increased to 12 from 8°C. The antioxidant abilities of the liver, muscle, and intestine of large yellow croaker at different temperatures and times were determined, and the expression of HSP70 and HSP90 in the liver as well as the changes in intestinal microbiota were investigated. The results showed that the activities of SOD, CAT, GSH-Px, and MDA content increased significantly when the water temperature decreased from 12 to 8°C, significantly higher than those in the control group. The gene expression levels of HSP70 and HSP90 in the liver of large yellow croaker significantly increased under low temperature stress and were significantly higher than those in the control group. The diversity and abundance of intestinal microbiota of large yellow croaker were altered when the water temperature was maintained at 8°C, although the change was not obvious. Proteobacteria, Firmicutes, and Bacteroidetes were the dominate phyla in both the 12 and 8°C groups, and the temperature variation did not change the functional pathways of the microbiota. In conclusion, the acute temperature variation affected the antioxidant ability and heat shock protein expression of large yellow croaker but did not affect the diversity or abundance of the intestinal microbiota. These results will provide a theoretical basis for studying the mechanisms of large yellow croaker overwintering and adaptation to low temperatures.
Introduction
The large yellow croaker (Larimichthys crocea) is a warm water fish that is one of the most important marine aquaculture species in China. In recent years, the southern coastal areas of China have often been subject to cold-water currents, and large yellow croaker have been killed by freezing, resulting in a heavy blow to the large yellow croaker culture. Therefore, it is important to understand the low-temperature adaptation strategy of the large yellow croaker.
Water temperature is an important environmental factor that affects the physiological activities of fish. When the temperature changes, the oxygen consumption levels of fish change; this increases the production of oxygen free radicals, thereby affecting the antioxidant defense system of the fish (Martínez-lvarez et al., 2005; Lushchak and Bagnyukova, 2006; Wang et al., 2011). In the antioxidant systems of animals, superoxide dismutase (SOD), catalase (CAT), and glutathione peroxidase (GSH-PX) have the function of eliminating active oxygen radicals, and thus these enzymes play an important role in fish adaptation to low temperatures (Song et al., 2015). As the final product of lipid oxidative stress, malondialdehyde (MDA) can measure the level of reactive oxygen species (ROS) and the degree of oxidative stress (Kong et al., 2012).
Heat shock proteins (HSPs) exist in a wide variety of organisms. HSPs are expressed when the environmental temperature changes, and thus they have become an important index of the temperature adaptability of fish. A great deal of research has been done on zebrafish, carp, Wuchang fish, and other species (Ali et al., 2003; Lin and Janz, 2006; Ming et al., 2010). The expression of HSP70 in Pacific bluefin tuna increased after cold stimulation (Mladineo and Block, 2009). During a continuous cooling process, the expression of HSP90 in all tissues of turbot showed significant changes (Ji, 2014). Therefore, HSPs can be used as indicators of hypothermia stress in large yellow croaker.
Intestinal microorganisms play important roles in host metabolism, immunity, and health maintenance (Turnbaugh et al., 2009; Tremaroli and Bäckhed, 2012). Chevalier et al. (2015) found that cold could significantly affect the composition of the intestinal microbiota. The cold-adapted bacteria regulate fat metabolism and affect intestinal tissue, thereby helping the host to survive the cold weather. Plateau pika has high microbial diversity, indicating that cold and hypoxia affect the intestinal microbiota (Li et al., 2018). Thus, we may expect that the intestinal microbiota of the large yellow croaker will be altered under low temperature.
In this study, we investigated the effects of temperature on the antioxidant capacity, the expression of heat shock proteins HSP70 and HSP90, and the intestinal microbial community of the large yellow croaker. This will help us to better understand the mechanisms of the antioxidant system, the dynamics of heat shock proteins, and the role of intestinal microbiota of the large yellow croaker in adaptation to low temperatures. The results can provide a theoretical basis for understanding the mechanism of overwintering in this species.
Materials and Methods
Animal Treatment
Healthy large yellow croaker (90.5 ± 0.5 g) were obtained from Zhoushan Fisheries Research Institute (Zhoushan, Zhejiang, China). The experiment was carried out in the thermostatic control room of Zhoushan Fisheries Research Institute. A total of 240 fish were randomly divided into three parallel circular fiberglass tanks (Φ 2 m), each tank containing 80 fish. The density was about 2.86 kg/m3. The water volume was adjusted after each sampling to keep the stocking density consistent. Fish were kept at 12°C for 1 week to acclimate to the environment. The water was then cooled by 1°C per day using chillers (Resun C-2,500A, Shenzhen, China), starting at 12°C and dropping to 8°C, after keeping at 8°C for 3 days, then warming to 12 by 1°C per day using six heaters (Sunsun GP-1,000B, Zhoushan, Zhejiang, China). The experiment lasted for 10 days. Because the water temperature was low, fish rejected the food during the experimental period. There was no mortality during the experiment.
Sample Collection
Fish were terminally anaesthetized with a lethal dose of MS-222 (150 mg/L, Sigma-Aldrich, Shanghai, China). The samples used for enzyme activity determination were taken at four time points, at the initial temperature of 12°C (set as control group), after the temperature was reduced to 8°C (set as group T1), after fish was maintained at 8°C for 3 days (set as group T2), and then when the temperature was raised to 12°C (set as group T3). The sampled organs included liver, muscles, and intestines. Six large yellow croaker were randomly selected from each parallel experimental tank. The sampled tissues from six fish were mixed together and used as a replicate group to determine enzyme activity and liver HSP expression.
The intestines used to measure the diversity of intestinal microbiota were sampled twice, at the beginning of the experiment (the control group) and after the fish had been maintained at 8°C for 3 days (T2 group). The sampling method was as follows: the large yellow croaker was dissected on a sterile table, and the entire intestine were removed (from the stomach to the anus). The surface of the intestine was wiped with alcohol, placed flat on a sterile counter, and then tweezers were used to hold the intestine from head to tail and squeeze the intestines into a sampling tube. The contents of six large yellow croaker were combined as a replicate group, with the contents of at least 0.1 g. Six samples in each group were frozen in liquid nitrogen and then stored at −80°C until subsequent analysis.
Enzyme Activity Analysis
Enzyme activity was determined using enzyme kits (Suzhou Keming Biotechnology Co., Ltd., Suzhou, China). During the enzymatic activity analysis, the samples were taken out for deionizing and homogenized using 10 times frozen deionized water. After centrifugation at 3,000 rpm for 10 min, the supernatant was taken for the determination of catalase (CAT), glutathione peroxidase (GSH-PX), superoxide dismutase (SOD), and malondialdehyde (MDA). SOD activity was measured by the xanthine oxidase method. SOD activity in the reaction system was defined as a unit of enzyme activity when the inhibition percentage of the xanthine oxidase coupling reaction system was 50%. The activity of CAT was determined by the ultraviolet absorption method, and the CAT unit was defined as 1 nmol H2O2 degradation catalyzed per gram of mixture per minute as a unit of enzyme activity. The activity of GSH-PX was determined by the NADPH method. The GSH-PX activity unit was defined as the catalytic oxidation of 1 nmol NADPH to 1 enzyme activity unit per minute per gram of sample at a certain temperature. MDA content was determined by the thiobarbituric acid method (TBA). The MDA unit was defined as 1 mg of reducing sugar per gram of tissue catalyzed per minute and 1 unit of enzyme activity.
HSP70 and HSP90 Gene Expression
PCR reactions were performed with TransStart Fastpfu DNA Polymerase (TransGen Biotech, Co. Ltd., Beijing, China) in 20 μL volumes containing 10 μL SYBR Green Mix, 2.0 μL Primer Mix, 3 μL Nuclease-free water, and 5 μL cDNA. The PCR amplifier ABI GeneAmp® 9,700 (Applied Biosystems Co., Ltd., Foster City, United States) was used. The HSP70 and HSP90 primers required for PCR amplification are listed in Table 1. The PCR cycle conditions were as follows: an initial denaturation step at 95°C for 15 min, followed by 35 cycles at 95°C for 30 s, 55°C for 30 s, and a final extension step at 72°C for 30 s.
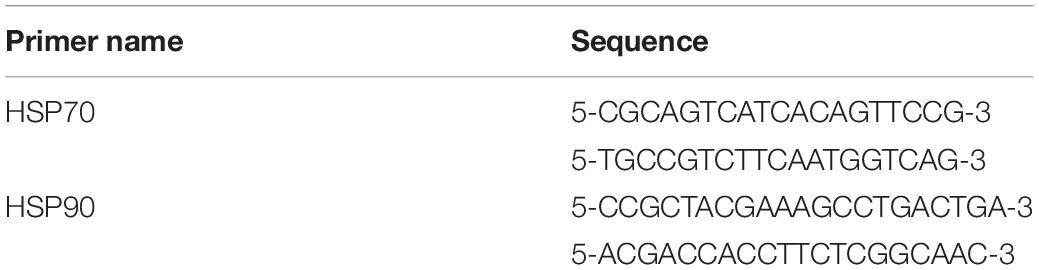
Table 1. Primers sequences for PCR for the heat shock protein gene expression.
Intestinal Microbiota Analysis
The intestine of six fish in each replicate treatment group were carefully excised. Gut contents were squeezed out, collected, and pooled to extract microbial DNA for deep sequencing (Ringø et al., 2006). All of the samples were placed into sterile polypropylene centrifuge tubes and frozen at −80°C until DNA extraction. Each sample was performed in triplicate. DNA extraction and PCR amplification were conducted using the methods of Gao et al. (2017). Microbial DNA was extracted from large yellow croaker intestinal samples using the E.Z.N.A. Soil DNA Kit (50) (Omega Inc., Norcross, United States) following the manufacturer’s instructions. To avoid bias, each sample was performed in triplicate, and extracts from the same sample were homogenized together. A Qubit® 2.0 fluorometer-Life Tech instrument (Invitrogen, United States) was used to measure the DNA concentration. The integrity of the DNA was verified using 2% agarose gel electrophoresis, while the concentration of the DNA samples was checked using the NanoDrop procedure (ND-2000, Thermo Fisher Scientific Co. Ltd., Shanghai, China). Extracted DNA was stored at −80°C until analysis.
The V3-V4 universal primers required for the NovaSeq PE250 sequencing platform were used for PCR amplification. The PCR cycle conditions were as follows: an initial denaturation step at 95°C for 5 min, followed by 27 cycles at 95°C for 30 s, 55°C for 30 s, 72°C for 45 s, and a final extension step at 72°C for 10 min. The following primers were used for amplification: 338F 5′-TGCTGCCTCCCGTAGGAGT-3′ and 806R 5′-GGACTACHVGGGTWTCTAAT-3′.
After the PCR amplification of the intestinal DNA, gel electrophoresis was performed to check for the desirable DNA band. Then, a Qubit2.0 DNA testing kit (Invitrogen, United States) was used for cutting and quantification according to the manufacturer’s instructions, and the DNA was sent to the company for deep sequencing. Deep sequencing was performed with a NovaSeq PE250 sequencing platform. The paired-end technology was provided by Genepioneer Biotechnologies Co., Ltd, Nanjing, China.
For gut microbiota analysis, the Novaseq PE250 sequencing platform (Genepioneer Biotechnologies Nanjing Co., Ltd., China) was used for deep sequencing and subsequent data analysis. Firstly, the effective sequences of all samples were obtained according to barcode, then the paired reads were spliced into a sequence according to the overlap relationship between PE reads, and then the quality of reads was filtered by quality control. Finally, a high quality sequence of each sample was obtained, and Uchime in Usearch was used to remove the chimera. Data de-multiplexing methods and parameters were as follows: the samples were distinguished according to the barcode and primer at the beginning and the end of the sequence, and the sequence direction was adjusted, barcode allowed zero mismatches and a maximum primer mismatches of 2. According to the overlap relation between PE reads, the pairwise reads were joined into a sequence by using the software pandaseq v 0.9.0. The minimum overlap length is 10 bp, the maximum allowable mismatch ratio in the lap region of the spliced sequence is 0.2, which filtered the non-conforming sequence. Using PRINSEQ v 0.20.4, the bases with mass values below 20 in the tail of read were filtered, and 5% of the total length of the sequence was filtered out. USEARCH software with uchime were used to remove chimeras compared to the Silver database.
Sequences with ≥ 97% similarity were assigned to the same OTUs. Representative sequences for each OTU were screened for further annotation. Taxonomic classifications for each OTU were analyzed using the Silva classifier that clustered sequences with 97% similarity and a 0.80 confidence threshold. To analyze the differences in community composition between samples, permutational MANOVA analysis was conducted based on the Bray-Curtis distance. All of these indices were calculated using the adonis function of the R vegan package (Version 3.2). Bacterial taxa differentially represented between two groups at the phylum taxonomic level were identified by linear discriminant analysis (LDA) coupled with effect size (LEfSe) (Segata et al., 2011). Because there was no remarkable difference in species, the LEfSe analysis is not showed in the Results. To obtain bacterial metabolic functional traits, PICRUSt 2 (Phylogenetic Investigation of Communities by Reconstruction of Unobserved States) was applied to predict the functional profiles of microbial communities in all samples (Langille et al., 2013).
Statistical Analysis
The antioxidant enzymatic activities were analyzed by one-way analysis of variance (ANOVAs). Tukey’s test was used for multiple comparisons. We considered differences significant when P < 0.05. Data are presented as means ± SD. SPSS v19.0 (SPSS Inc., Chicago, United States) was used for all statistical analysis.
Results
Enzyme Activities
The variation trends of SOD in intestine, liver, and muscle were similar (Figure 1A). When the water temperature dropped from 12 to 8°C, the activities of SOD in liver and muscle increased significantly (P < 0.05). After being kept at 8°C for 3 days, the activities of SOD in liver and muscle decreased significantly (P < 0.05), while the activity of SOD in intestine was not significantly different (P > 0.05). When the temperature recovered from 8 to 12°C, SOD activity in the intestine and liver was significantly decreased (P < 0.05), while SOD activity in the muscle was not significantly different (P > 0.05). SOD activity in the liver and muscle was still significantly higher than that of the control group (P < 0.05), while SOD activity in the intestine was not significantly different from that of the control group (P > 0.05).
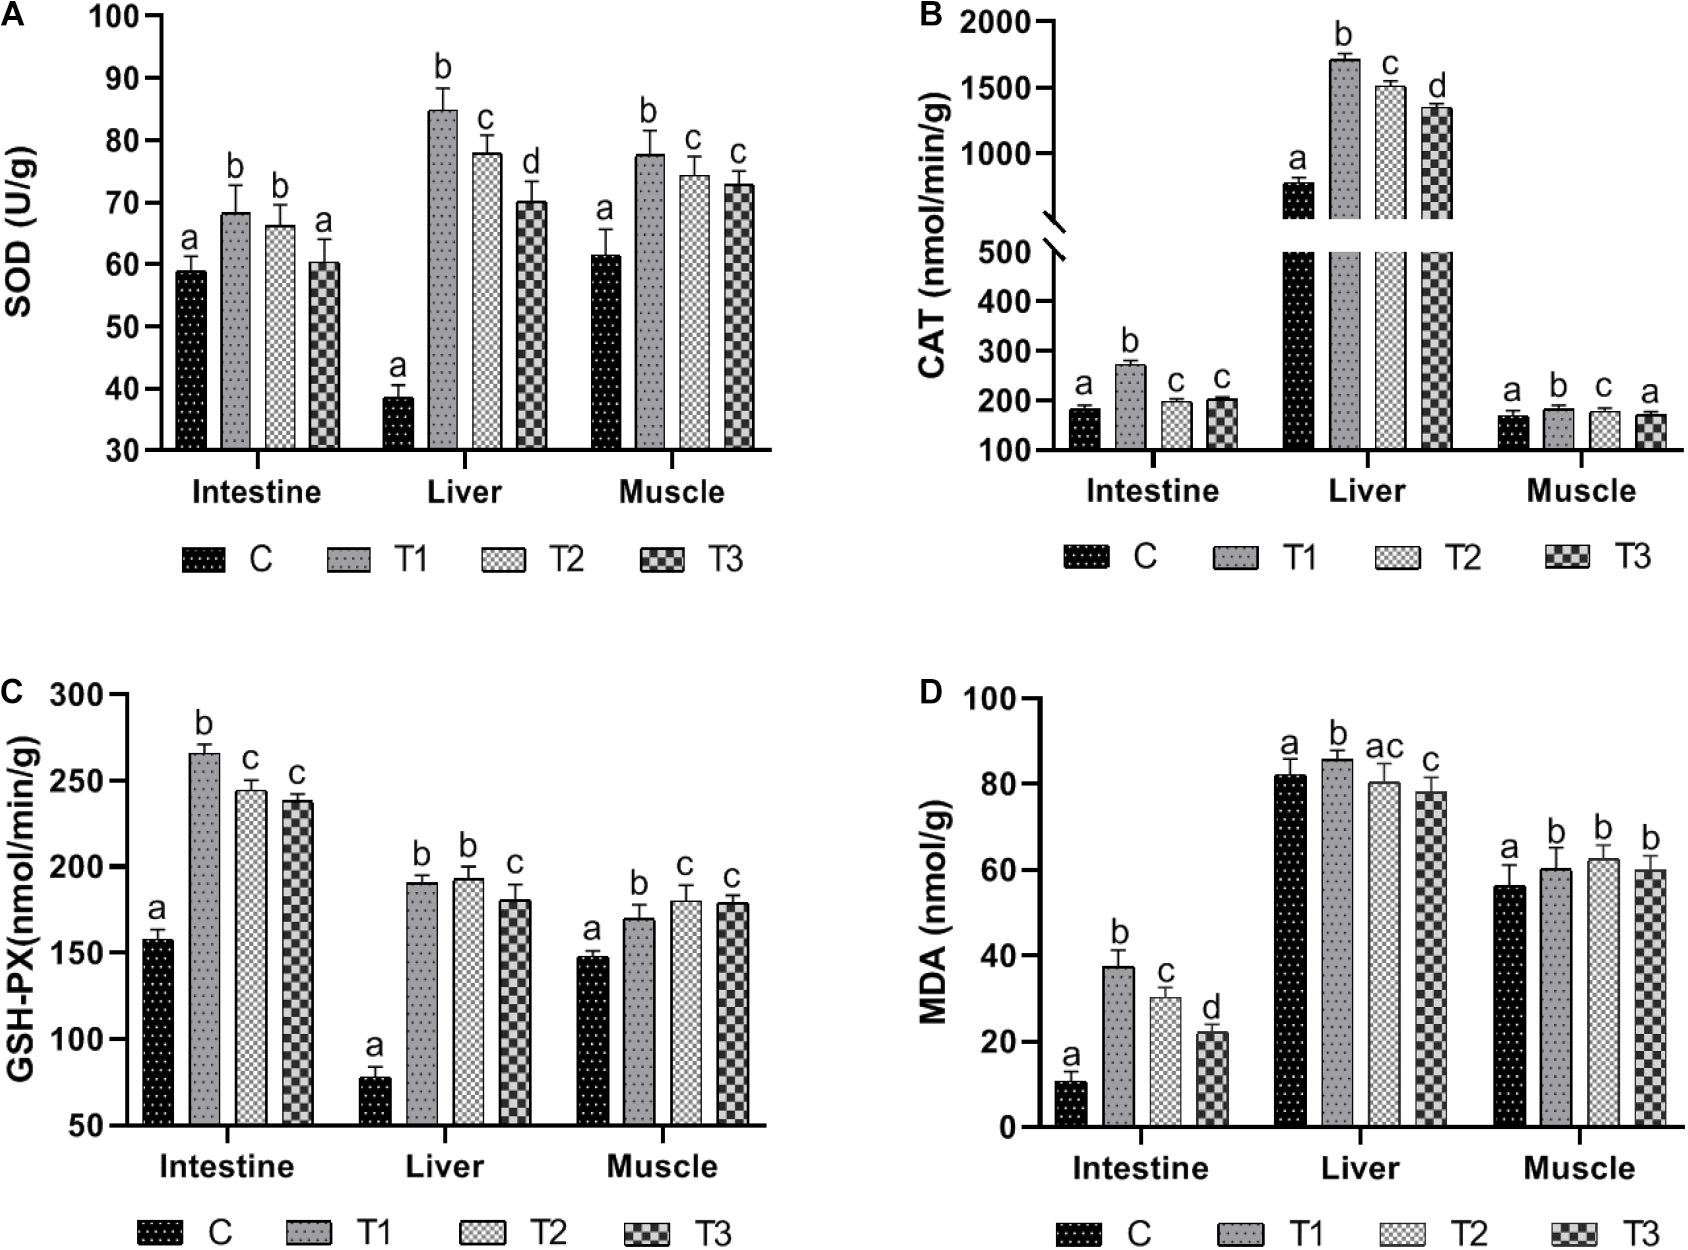
Figure 1. The antioxidant enzymes activities and MDA content in large yellow croaker after temperature variation. (A–D) Represents the SOD activity, the CAT activity, the GSH-PX activity and the MDA content, respectively. Columns with different letters are significantly different (P < 0.05). C represents the control group where the fish were kept at 12°C at the beginning of the experiment; T1 represents the group sampled on the first day when the water temperature reached 8 from 12°C; T2 represents the group sampled when the fish had been kept at 8°C for 3 days; T3 represents the group sampled when the water temperature was increased to 12 from 8°C. The data are presented as the mean ± SD (n = 3).
CAT activity changed remarkably as the temperature fluctuated (Figure 1B). CAT activity of the intestine, liver, and muscle increased significantly when the water temperature dropped from 12 to 8°C (P < 0.05). When fish were exposed to 8°C for 3 days, CAT activity of intestines, liver, and muscle was significantly reduced (P < 0.05). When the water temperature increased from 8 to 12°C, the CAT activity of the intestine had no significant change (P > 0.05) but was significantly higher than that of the control group (P < 0.05), while CAT activity of liver and muscle decreased significantly (P < 0.05). CAT activity in liver was significantly higher than that of the control group (P < 0.05), There was no significant difference in CAT activity in muscle between the experimental and the control groups (P > 0.05).
During the cooling process from 12 to 8°C, the activity of GSH-PX in intestine, liver, and muscle was significantly increased (P < 0.05) (Figure 1C). After 3 days at 8°C, the activity of GSH-PX in intestines was significantly decreased (P < 0.05), while the activity of GSH-PX in muscles was significantly increased (P < 0.05). There was no significant difference in the activity of GSH-PX in liver (P > 0.05). After increasing from 8 to 12°C, the activity of GSH-PX in liver was significantly decreased (P < 0.05), while the activity of GSH-PX in intestine and muscle was not significantly changed (P > 0.05). At this time point, the activity of GSH-PX in intestine, liver, and muscle was significantly higher than in the control group (P < 0.05).
In the process of cooling from 12 to 8°C, the MDA contents in the intestine, liver, and muscle were significantly higher (P < 0.05) (Figure 1D). At a constant 8°C 3 days later, MDA contents in the intestine and liver decreased significantly (P < 0.05), while MDA content in muscle had no significant change (P > 0.05). When the temperature increased from 8 to 12°C, MDA content in the intestine and liver decreased significantly (P < 0.05) and was significantly higher than that of the control group (P < 0.05), while MDA content in the muscle showed no significant change (P > 0.05) but was significantly higher than that of the control group (P < 0.05).
Gene Expression of Heat Shock Protein 70 and 90
The variation trends of HSP70 and HSP90 with temperature were similar. During the cooling process from 12 to 8°C, the expression levels of HSP70 and HSP90 in liver were significantly increased (P < 0.05) (Figures 2A,B). After maintaining the temperature at 8°C for 3 days, the expression levels of HSP70 and HSP90 in liver were significantly decreased (P < 0.05). After increasing from 8 to 12°C, the expression levels of HSP70 and HSP90 in liver were significantly increased (P < 0.05) and were significantly higher than that in the control group (P < 0.05).
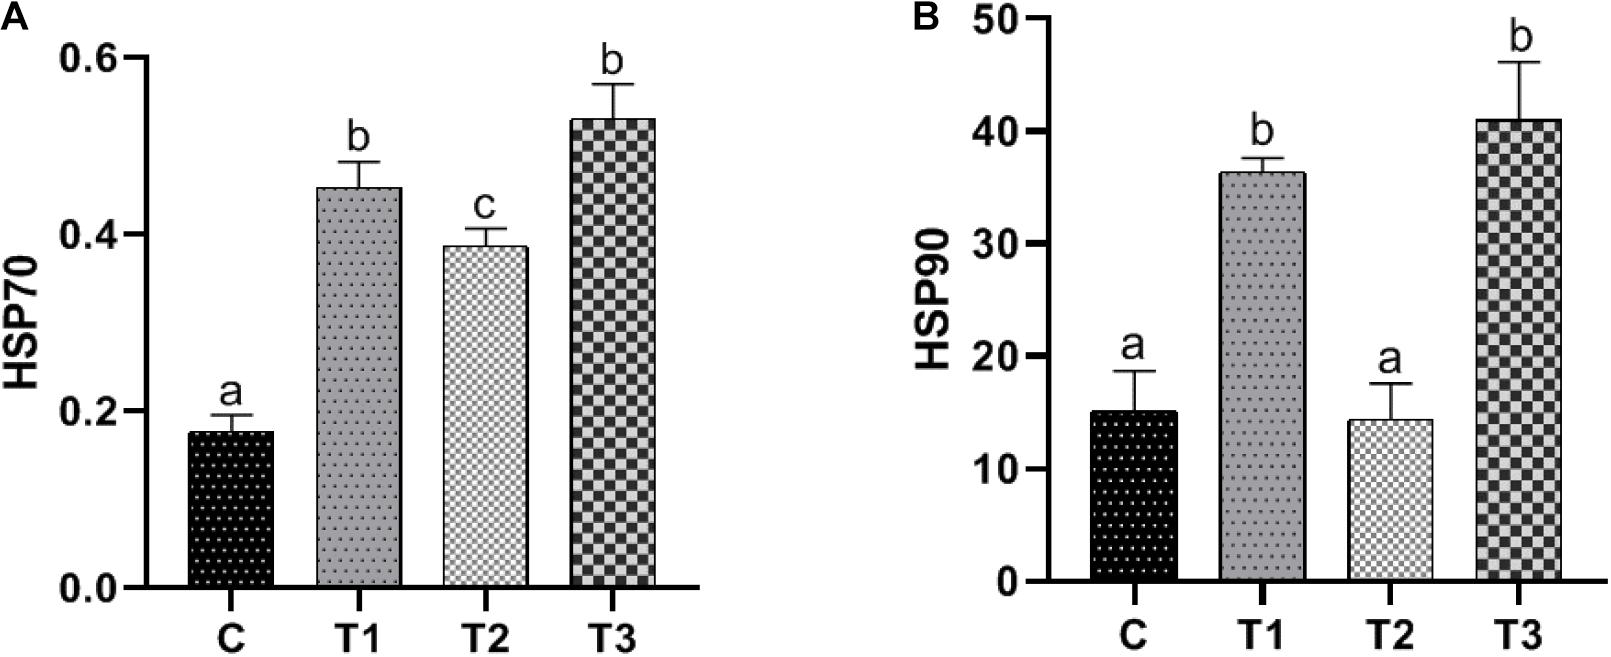
Figure 2. Effect of temperature variation on gene expression of heat shock protein 70 and 90 in the liver of large yellow croaker. (A,B) Represents gene expression of heat shock protein 70 and 90 in the liver of large yellow croaker. Columns with different letters are significantly different (P < 0.05). C represents the control group where the fish were kept at 12°C since the beginning of the experiment; T1 represents the group sampled on the first day when the water temperature reached 8 from 12°C; T2 represents the group sampled after the fish were kept at 8 for 3 days, and T3 represents the group sampled after the water was heated to 12°C from 8°C. The data are presented as the mean ± SD (n = 3).
Intestinal Microbiota Analysis
The Chao1 and observed species estimator values in group T2 were slightly higher than those of the control group, although the difference was not significant (P > 0.05) (Table 2), indicating similar taxon richness in the two groups. The Shannon index and Simpson index were nearly the same in the control and T2 groups, indicating similar community diversity (P > 0.05). This supported the trend described above. As an indicator of sequencing depth, Goods coverage in both the control group and T2 group were close to 1, meaning that the sequence depth had basically covered all species in the two samples, and there was no significant difference (P > 0.05).
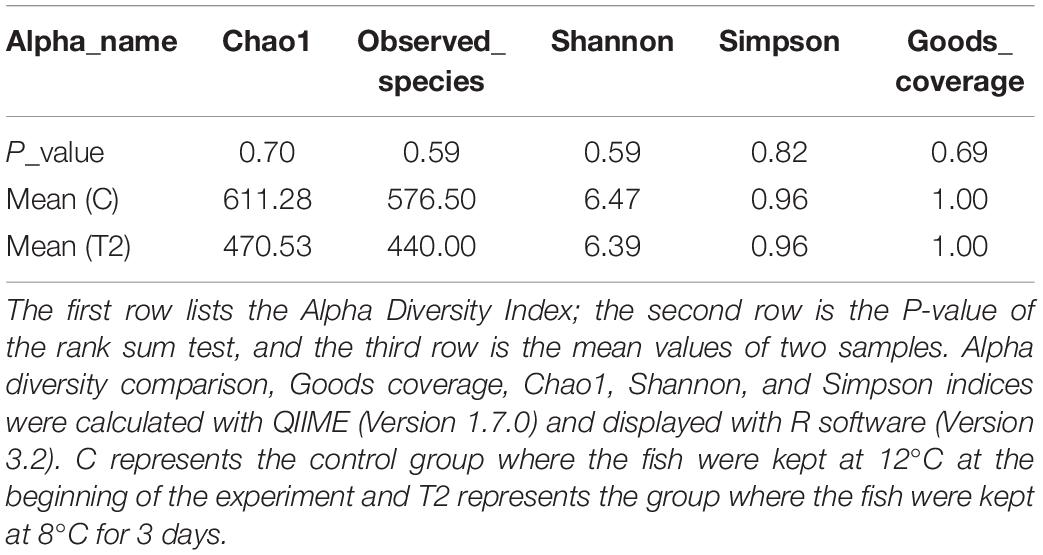
Table 2. Alpha diversity indices of two groups.
The most abundant OTUs within the two groups are shown in Figure 3. The dominant phyla in two groups were assigned based on the relative abundance of the assigned reads. At the phylum level, Proteobacteria, Firmicutes, and Bacteroidetes seemed to dominate in both the control and the T2 groups (Figure 3). The main phyla observed in the control group (relative prevalence of phyla are listed in parentheses) were as follows: Proteobacteria (43.31%), Firmicutes (20.76%), Bacteroidetes (16.20%), Actinobacteria (4.52%), Tenericutes (4.47%), Planctomycetes (2.91%), and Patescibacteria (2%). In contrast, the most abundant OTUs related to the T2 group were sequences related to Proteobacteria (39.86%), Firmicutes (23.57%), Bacteroidetes (16.84%), Actinobacteria (4.81%), and Tenericutes (4.27%).
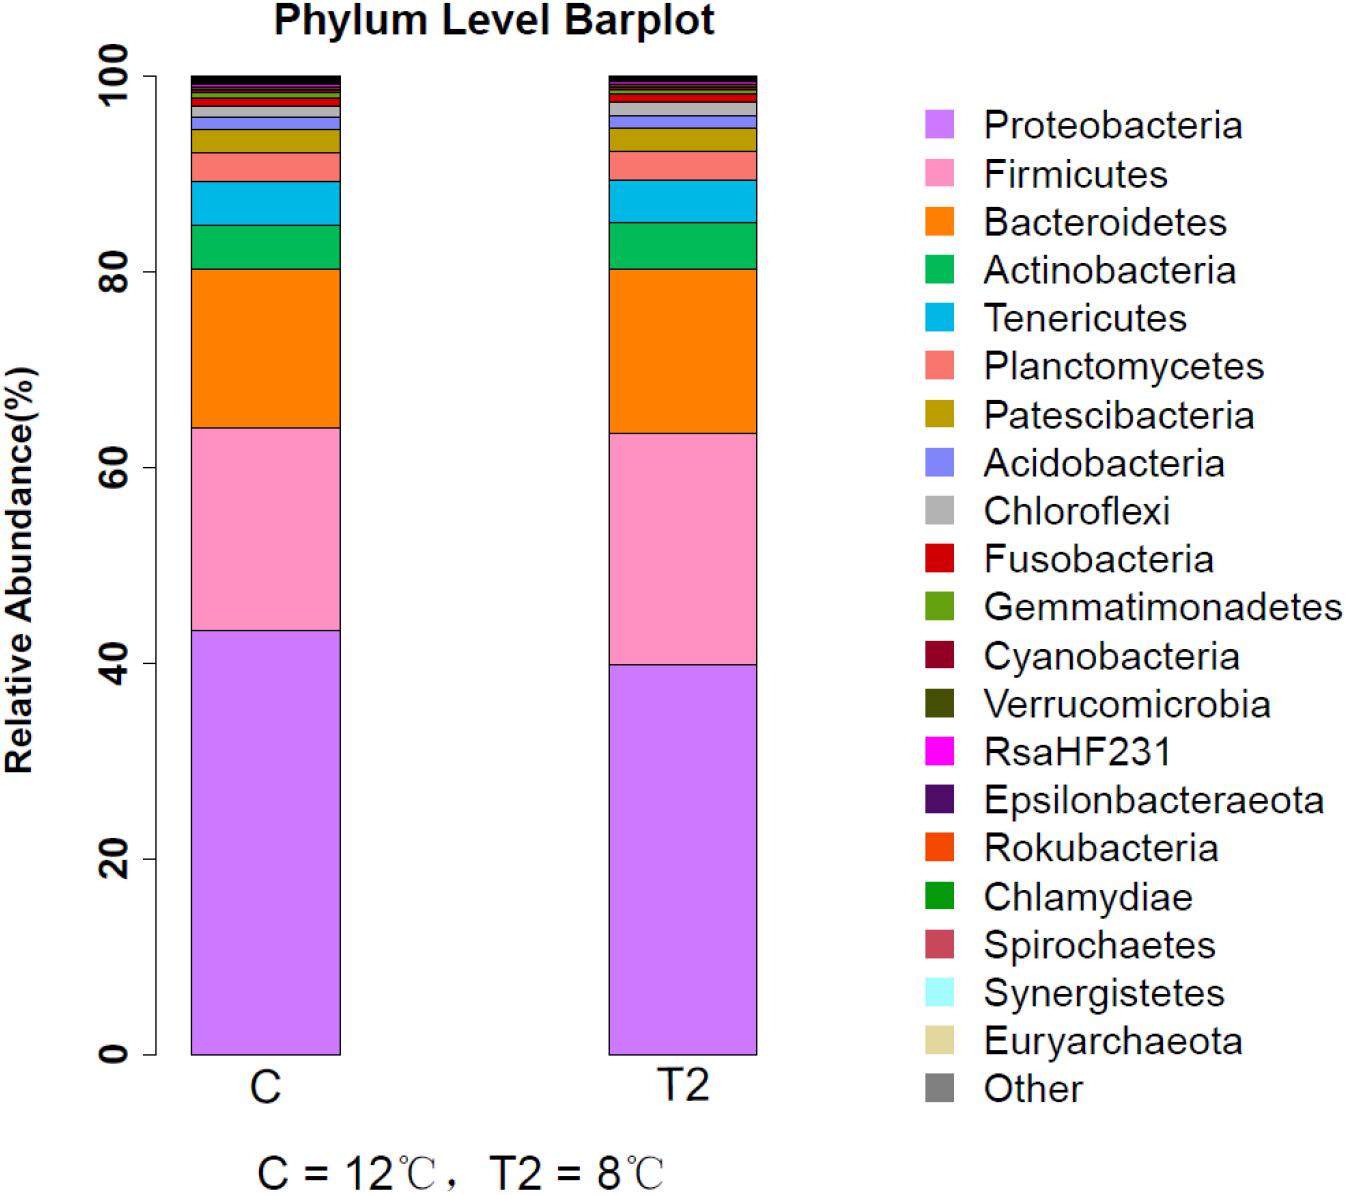
Figure 3. Relative abundance of intestinal microbiota in large yellow croaker by phylum. C represents the control group where the fish were kept at 12°C at the beginning of the experiment and T2 represents the group where the fish were kept at 8°C for 3 days.
At the genus level, Citrobacter, Bacteroides, and Sphingomonas seemed to dominate in both the control group and the T2 group (Figure 4). The following genera were observed in the control group: Citrobacter (11.53%), Bacteroides (8.88%), Sphingomonas (9.78%), Streptococcus (7.27%), Haemophilus (4.42%), Candidatus Bacilloplasma (4.05%), and Geobacillus (3.10%). While in the T2 group, the most abundant OTUs were sequences related to Citrobacter (11.01%), Bacteroides (9.19%), Sphingomonas (8.15%), Streptococcus (7.71%), and Haemophilus (4.58%).
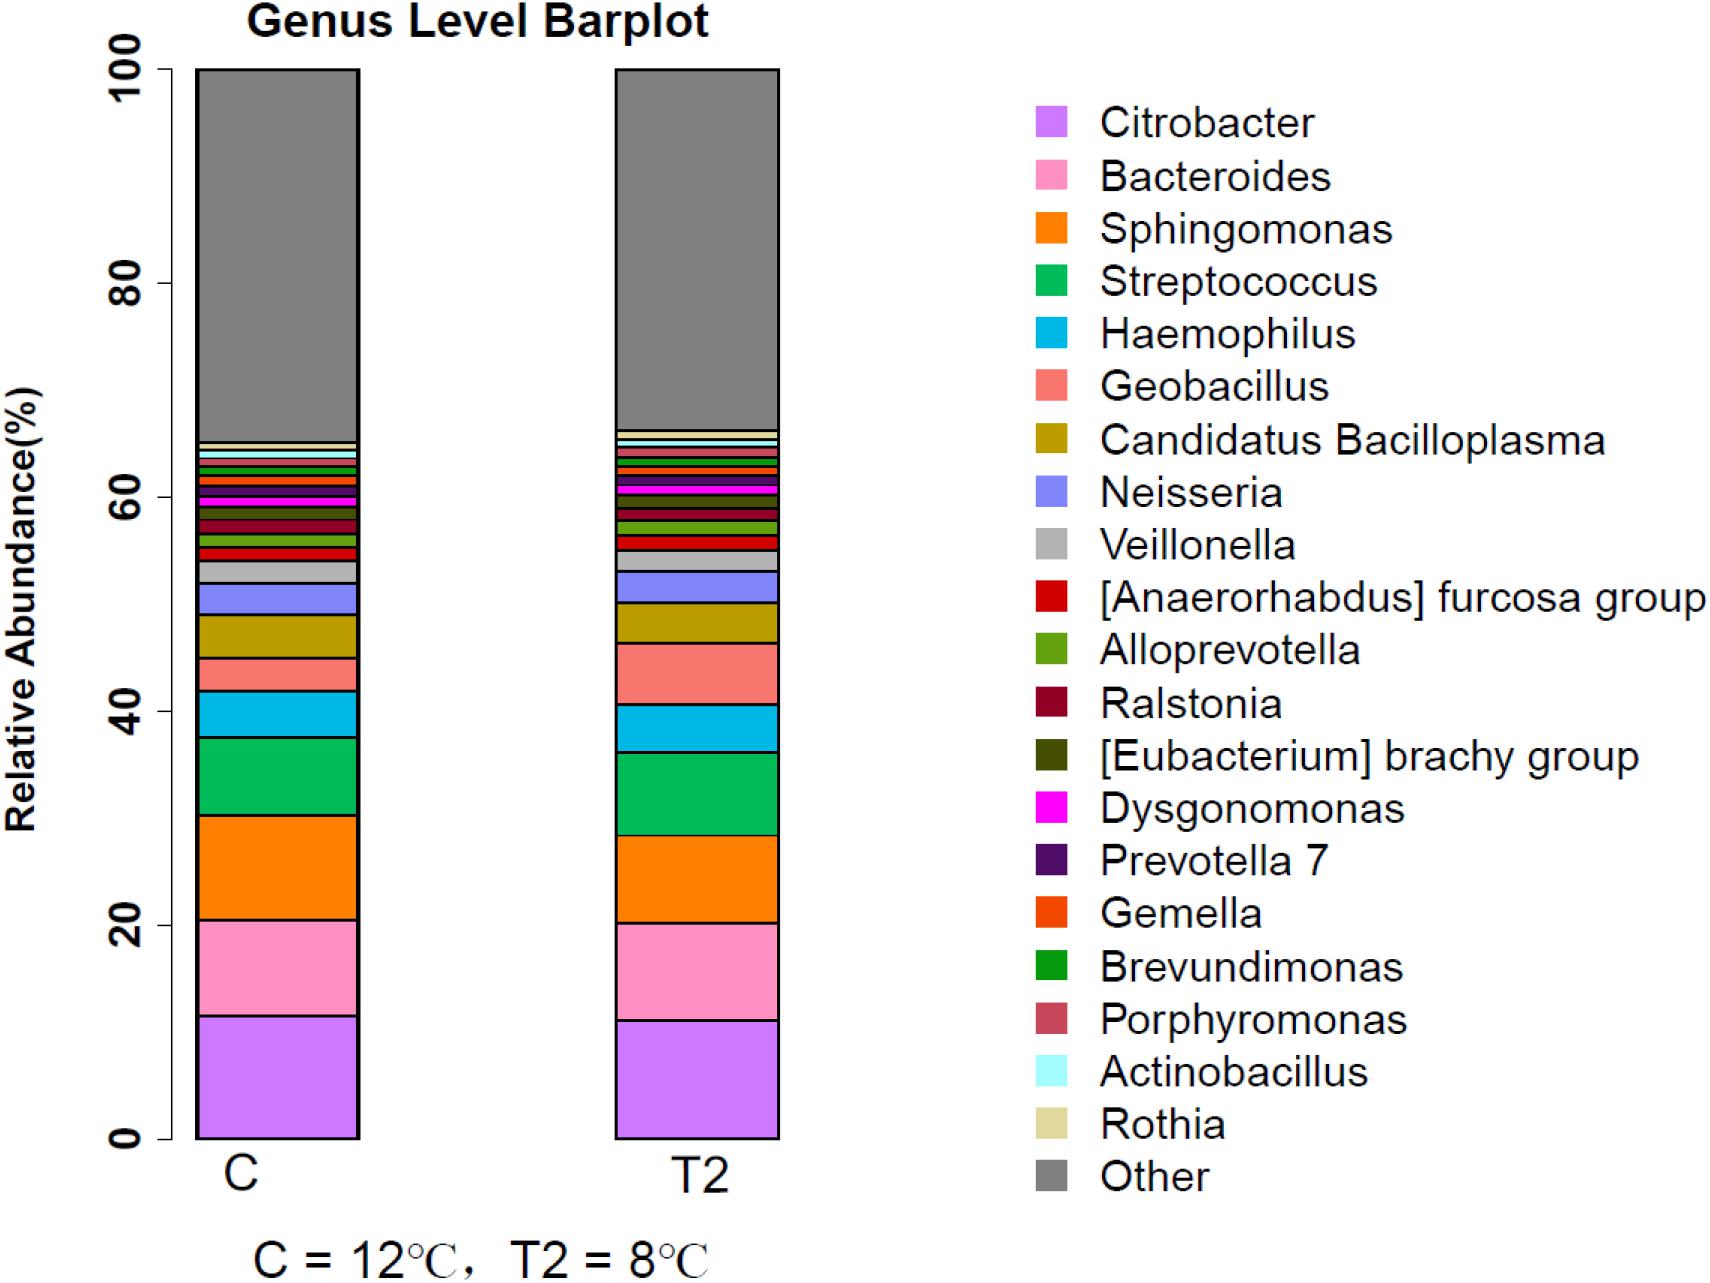
Figure 4. Relative abundance of intestinal microbiota in large yellow croaker by genus. C represents the control group where the fish were kept at 12°C since the beginning of the experiment and T2 represents the group where the fish were kept at 8°C for 3 days.
The Venn diagram (Figure 5) illustrates the unique and shared OTUs in the T2 group and the control group. The T2 group had 171 unique OTUs, while the control group had 398 unique OTUs. The number of OTUs shared between groups C and T2 was 1,001, and the percentage of OTUs that were shared in groups C and T2 was 63.76%. The total richness for all groups was 1,570.
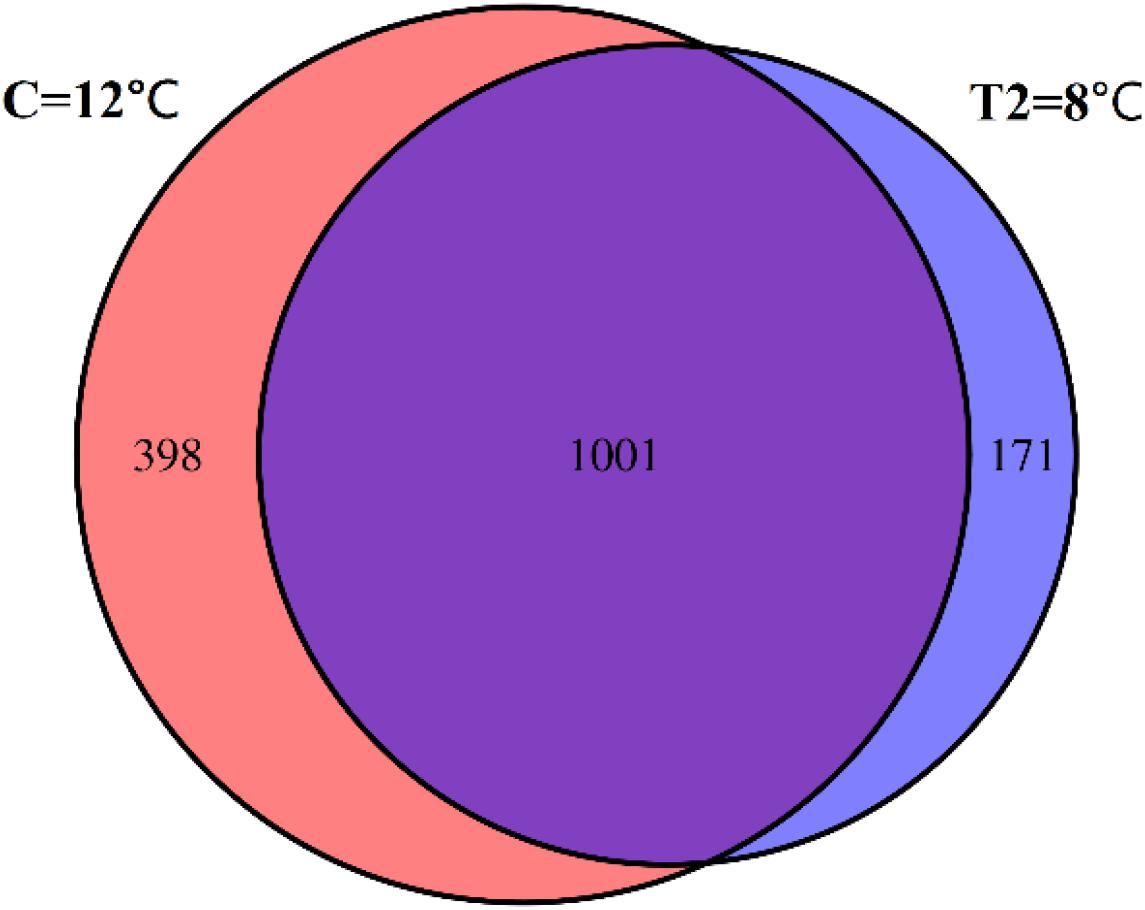
Figure 5. Venn diagram showing the unique and shared OTUs in the control group (C) and the T2 group (T2). The number of OTUs in group C is 1,399. The number of OTUs in group T is 1,172. The number of OTUs shared between groups C and T2 is 1,001. The total richness for all groups is 1,570.
The Adonis test showed that the P-value equalled 0.472, and R2 = 0.089, indicating that there was no significant difference between the control and T2 groups. The results of a principal component analysis (PCA) also indicated a relatively small alteration of the microbiota by temperature (Figure 6).
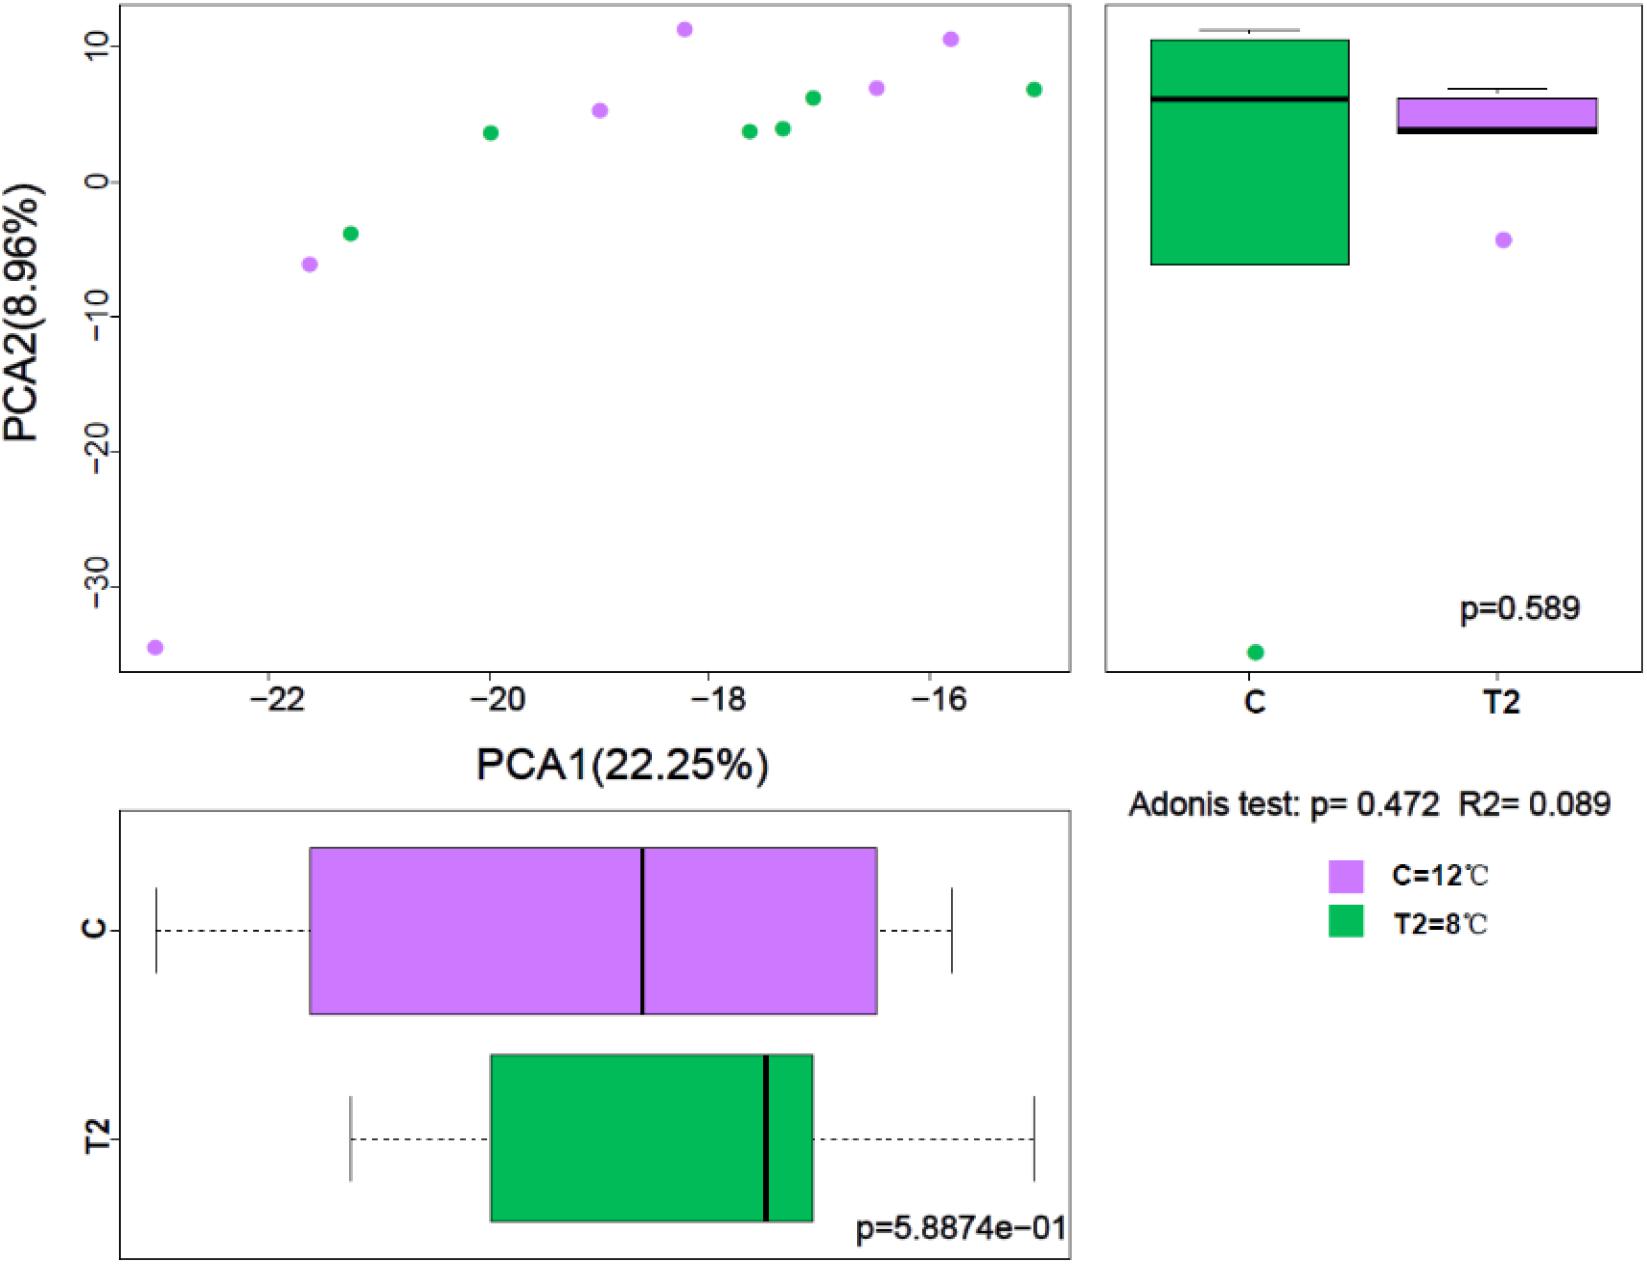
Figure 6. Adonis test of intestinal microbiota samples of large yellow croaker. C represents the control group where the fish were kept at 12°C since the beginning of the experiment and T2 represents the group where the fish were kept at 8°C for 3 days.
Discussion
Temperature is one of the most important environmental factors affecting the survival of aquatic organisms, and it has obvious effects on metabolism. A rapid change in temperature can directly affect the antioxidant systems of aquatic organisms (Martínez-lvarez et al., 2005). Kammer et al. (2011) reported that SOD plays an important role in the protection of the three-spined stickleback (Gasterosteus aculeatus) exposed to low-temperature stress by preventing the oxidation of enzymes and membranes. A number of studies have examined the effects of low-temperature stress on fish antioxidant systems. Meng et al. (2014) observed significant increases in SOD and CAT activities in both muscle and hepatopancreas tissues of crabs in response to low-temperature stress. He et al. (2015) revealed that hepatic GSH-PX activity was higher in the low temperature group than the control group at all-time points. Malondialdehyde (MDA), produced by lipid peroxidation, is thought to be a biomarker of oxidative stress by causing oxidative damage to cell membranes (Liu et al., 2011). Qiu et al. (2011) demonstrated that acute low temperatures could induce elevate levels of MDA in plasma of the shrimp L. vannamei. Our results were consistent with those of previous studies, as SOD, CAT, GSH-PX, and MDA levels in the intestines, liver, and muscles of the large yellow croaker significantly increased when the temperature dropped from 12 to 8°C. These results indicated that the acclimation of large yellow croaker to low temperature was accompanied by oxidative stress. Antioxidant defense mechanisms are strengthened to protect cells from the harmful effects of oxidative stress at low temperatures. However, the study by Kong et al. (2012) showed that the activities of SOD, CAT, and GSH-PX gradually declined with decreasing temperature. This may have been due to the changes in antioxidant enzymes under cold stress varying with the type, intensity, and duration of stress (Yang et al., 2010; Kammer et al., 2011; Kong et al., 2012).
Previous studies have shown that low temperature reduces the structural stability of proteins, leading to denaturation (Hochachka and Somero, 2002). Heat shock proteins (HSPs) serve as potential biomarkers of the response of fish toward temperature stress. HSPs are responsive to conditions such as cold stress (Sharma et al., 2017). Previous studies of poikilothermic animals such as Cyprinus carpio, Sparus sarba, Portunus Trituberculatus, and Perna viridis found that HSP70 and HSP90 were up-regulated under cold stress (Ali et al., 2003; Deane and Woo, 2005; Urian et al., 2011; Meng et al., 2014). As in previous studies, the expression levels of HSP70 and HSP90 proteins in the large yellow croaker were significantly increased from 12 to 8°C in this study (P < 0.05). The elevated expression of HSPs at 8°C indicated increased levels of protein damage and the ability of the cells to respond adaptively to the cold stress (Lindquist, 1986; Pörtner, 2002). However, when the temperature increased from 8 to 12°C, the expression levels of HSP70 and HSP90 genes in the yellow croaker were significantly increased (P < 0.05), indicating that the expression of heat shock protein changed with the increase in temperature. The extent of HSP induction is generally proportional to the intensity of cold stress (Hochachka and Somero, 2002).
Temperature is one of the most important environmental factors affecting the growth and development of microorganisms, and microorganisms are most often selected as models for studies of the effects of temperature on biological processes (Aragno, 1981). In this study, we observed that the species richness and diversity of the intestinal microbiota decreased in the treatment group compared to the control group. We found that the dominant phylum in the large yellow croaker was the Proteobacteria (Figure 3). This is consistent with previous research (Huber et al., 2004; Wu et al., 2010; Sullam et al., 2012). This suggests that most species of fish gut bacteria come from this taxon, as has been demonstrated previously (Rawls et al., 2006; Nayak, 2010). Compared with the control group, the abundance of Proteobacteria in the intestine of the T2 group was decreased, and the abundance of Firmicutes and Bacteroidetes increased, consistent with the results of previous experiments (Li et al., 2020). However, Chevalier et al. (2015) suggested that the abundance of Proteobacteria was increased and the Bacteroidetes decreased in cold-exposed mice, and this may have been caused by different thermoregulation mechanisms between endotherms and ectotherms. There are many factors that influence the microbial diversity in the gut, including diet, immune status, gut environment, and temperature (Faith et al., 2011; Koren et al., 2012; David et al., 2014). Temperature is a factor affecting fish metabolism (Clark et al., 2013; Schulte, 2015; Enders and Boisclair, 2016). There have been some studies of the relationship between temperature and gut microbiota of ectotherms (Kohl and Yahn, 2016; Bestion et al., 2017). Large yellow croaker exposed to low temperature changed the composition of the intestinal microbiota, and this was beneficial for increasing energy intake during cold weather. Rong (2012) showed that the lower the temperature was, the greater the effect on the intestinal microbiota of Apostichopus japonicus. Soriano et al. (2018) showed that the cold environment seemed to have a significant negative effect on S. lalandi gut microbiota. In our experiment, large yellow croaker stopped feeding at 12°C, so the change of microbiota during the experiment was due to the change in the water temperature. Neuman et al. (2016) have shown that environmental temperature influences fish intestinal communities of Salmo salar than a diet. No significant changes indicated that the short-term cooling had little effect on the intestinal microbiota.
Conclusion
The results indicated that low temperature stress affected the antioxidant enzyme activity, the expression of HSP70 and HSP90, and the composition of intestinal microbiota in large yellow croaker. Further research is needed to elucidate the mechanisms of physiological adaptation to low temperature in the large yellow croaker.
Data Availability Statement
The datasets presented in this study can be found in online repositories. The names of the repository/repositories and accession number(s) can be found below: NCBI SRA BioProject, accession no: PRJNA743598.
Ethics Statement
The animal study was reviewed and approved by Zhejiang Ocean University.
Author Contributions
HLv drafted the manuscript. HLv and YL conducted the experiment. HLi and XY conducted formal analysis. PW and XQ made investigation. YG and WL conceived the study. ZC instructed the experiment. All authors checked and edited the final manuscript.
Funding
This study was financially supported by the National Key Research and Development Project (2019YFD0900901), the Project of Science and Technology of Zhoushan (2019C21016 and 2018C3108), 2020 Second Municipal Modern Fisheries Development Project, Document No. 21 of the Zhoushan Treasury Bureau (2020), Cooperative Extension Plan of Major Agricultural Technologies in Zhejiang province (2020XTTGSC04), and the Natural Science Foundation of Zhejiang province (LY18C190010).
Conflict of Interest
The authors declare that the research was conducted in the absence of any commercial or financial relationships that could be construed as a potential conflict of interest.
Publisher’s Note
All claims expressed in this article are solely those of the authors and do not necessarily represent those of their affiliated organizations, or those of the publisher, the editors and the reviewers. Any product that may be evaluated in this article, or claim that may be made by its manufacturer, is not guaranteed or endorsed by the publisher.
Acknowledgments
We thank LetPub (www.letpub.com) for its linguistic assistance during the preparation of this manuscript.
References
Ali, K. S., Dorgai, L., Abraham, M., and Hermesz, E. (2003). Tissue-and stressor-specific differential expression of two hsc70 genes in carp. Biochem. Biophys. Res. Commun. 307, 503–509. doi: 10.1016/S0006-291X(03)01206-3
Aragno, M. (1981). Responses of microorganisms to temperature. Physiol. Plant Ecol. I 12, 339–369. doi: 10.1007/978-3-642-68090-8_12
Bestion, E., Jacob, S., Zinge, L., Gesu, L. D., Richard, M., White, J., et al. (2017). Climate warming reduces gut microbiota diversity in a vertebrate ectotherm. Nat. Ecol. Evol. 1:161. doi: 10.1038/s41559-017-0161
Chevalier, C., Stojanovic, O., Colin, D. J., Suarez-Zamorano, N., Tarallo, V., Veyrat-Durebex, C., et al. (2015). Gut microbiota orchestrates energy homeostasis during cold. Cell 163, 1360–1374. doi: 10.1016/j.cell.2015.11.004
Clark, T. D., Sandblom, E., and Jutfelt, F. (2013). Aerobic scope measurements of fishes in an era of climate change: respirometry, relevance and recommendations. J. Exp. Biol. 216, 2771–2782. doi: 10.1242/jeb.084251
David, L. A., Maurice, C., Carmody, R. N., Gootenberg, D. B., Button, J. E., Wolfe, B. E., et al. (2014). Diet rapidly and reproducibly alters the human gut microbiome. Nature 505, 559–563. doi: 10.1038/nature12820
Deane, E. E., and Woo, N. Y. S. (2005). Cloning and characterization of the hsp70 multigene family from silver sea bream: modulated gene expression between warm and cold temperature acclimation. Biochem. Biophys. Res. Commun. 330, 776–783. doi: 10.1016/j.bbrc.2005.03.039
Enders, E. C., and Boisclair, D. (2016). Effects of environmental fluctuations on fish metabolism: Atlantic salmon Salmo salar as a case study. J. Fish Biol. 88, 344–358. doi: 10.1111/jfb.12786
Faith, J. J., McNulty, N. P., Rey, F. E., and Gordon, J. I. (2011). Predicting a human gut microbiota’s response to diet in gnotobiotic mice. Science 333, 101–104. doi: 10.1126/science.1206025
Gao, Y., He, J., He, Z., Li, Z., Zhao, B., Mu, Y., et al. (2017). Effects of fulvic acid on growth performance and intestinal health of juvenile loach Paramisgurnus dabryanus (Sauvage). Fish Shellfish Immunol. 62, 47–56. doi: 10.1016/j.fsi.2017.01.008
He, J., Qiang, J., Yang, H., Xu, P., Zhu, Z., and Yang, R. (2015). Changes in the fatty acid composition and regulation of antioxidant enzymes and physiology of juvenile genetically improved farmed tilapia Oreochromis niloticus (L.), subjected to short-term low temperature stress. J. Therm. Biol. 53, 90–97. doi: 10.1016/j.jtherbio.2015.08.010
Hochachka, P. W., and Somero, G. N. (2002). Biochemical Adaptation: Mechanism and Process in Physiological Evolution. New York, NY: Oxford University Press.
Huber, I., Spanggaard, B., Appel, K. F., Rossen, L., Nielsen, T., and Gram, L. (2004). Phylogenetic analysis and in situ identification of the intestinal microbial community of rainbow trout (Oncorhynchus mykiss,Walbaum). J. Appl. Microbiol. 96, 117–132. doi: 10.1046/j.1365-2672.2003.02109.x
Ji, L. (2014). Effect of Continuous Cooling on Serum Physiological, Biochemical Index and Molecular Mechanism of Adult Scophthalmus maximus L. Ph. D thesis. Qingdao: Ocean University of China.
Kammer, A. R., Orczewska, J. I., and O’Brien, K. M. (2011). Oxidative stress is transient and tissue specific during cold acclimation of threespine sticklebac. J. Exp. Biol. 214, 1248–1256. doi: 10.1242/jeb.053207
Kohl, K. D., and Yahn, J. (2016). Effects of environmental temperature on the gut microbial communities of tadpoles. Environ. Microbiol. 18, 1561–1565. doi: 10.1111/1462-2920.13255
Kong, X., Wang, G., and Li, S. (2012). Effects of low temperature acclimation on antioxidant defenses and ATPase activities in the muscle of mud crab (Scylla paramamosain). Aquaculture 370, 144–149. doi: 10.1016/j.aquaculture.2012.10.012
Koren, O., Goodrich, J. K., Cullender, T. C., Spor, A., Laitinen, K., Bäckhed, H. K., et al. (2012). Host remodeling of the gut microbiome and metabolic changes during pregnancy. Cell 150, 470–480. doi: 10.1016/j.cell.2012.07.008
Langille, M. G. I., Zaneveld, J., Caporaso, J. G., McDonald, D., Knights, D., Reyes, J. A., et al. (2013). Predictive functional profiling of microbial communities using 16S rRNA marker gene sequences. Nat. Biotechnol. 31, 814–821. doi: 10.1038/nbt.2676
Li, H., Qu, J., Li, T., Wirth, S., Zhang, Y., Zhao, X., et al. (2018). Diet simplification selects for high gut microbial diversity and strong fermenting ability in high-altitude pikas. Appl. Microbiol. Biotechnol. 102, 6739–6751. doi: 10.1007/s00253-018-9097-z
Li, J., Rui, J., Li, Y., Tang, N., Zhan, S., Jiang, J., et al. (2020). Ambient temperature alters body size and gut microbiota of Xenopus tropicalis. Sci. China Life Sci. 63, 915–925. doi: 10.1007/s11427-019-9540-y
Lin, L. L., and Janz, D. M. (2006). Effects of binary mixtures of xenoestrogens on gonadal development and reproduction in zebrafish. Aquat. Toxicol. 80, 382–395. doi: 10.1016/j.aquatox.2006.10.004
Lindquist, S. (1986). The heat-shock response. Annu. Rev. Biochem. 55, 1151–1191. doi: 10.1146/annurev.bi.55.070186.005443
Liu, X., Xi, Q., Yang, L., Li, H., Jiang, Q., Shu, G., et al. (2011). The effect of dietary Panax ginseng polysaccharide extract on the immune responses in white shrimp, Litopenaeus vannamei. Fish Shellfish Immunol. 30, 495–500. doi: 10.1016/j.fsi.2010.11.018
Lushchak, V. I., and Bagnyukova, T. V. (2006). Temperature increase results in oxidative stress in goldfish tissues. 1. Indices of oxidative stress. Comp. Biochem. Physiol. 143, 30–35. doi: 10.1016/j.cbpc.2005.11.017
Martínez-lvarez, R. M., Morales, A. E., and Sanz, A. (2005). Antioxidant defenses in fish: biotic and abiotic factors. Rev. Fish Biol. Fish. 15, 75–88. doi: 10.1007/s11160-005-7846-4
Meng, X., Liu, P., Li, J., Gao, B., and Chen, P. (2014). Physiological responses of swimming crab Portunus trituberculatus under cold acclimation: antioxidant defense and heat shock proteins. Aquaculture 434, 11–17. doi: 10.1016/j.aquaculture.2014.07.021
Ming, J., Xie, J., Xu, P., Liu, W., Ge, X., Liu, B., et al. (2010). Molecular cloning and expression of two HSP70 genes in the Wuchang bream (Megalobrama amblycephala Yih). Fish Shellfish Immunol. 28, 407–418. doi: 10.1016/j.fsi.2009.11.018
Mladineo, I., and Block, B. A. (2009). Expression of Hsp70, Na+/K+ ATP-ase, HIF-1α, IL-1β and TNF-α in captive Pacific bluefin tuna (Thunnus orientalis) after chronic warm and cold exposure. J. Exp. Mar. Biol. Ecol. 374, 51–57. doi: 10.1016/j.jembe.2009.04.008
Nayak, S. K. (2010). Role of gastrointestinal microbiota in fish. Aquac. Res. 41, 1553–1573. doi: 10.1111/j.1365-2109.2010.02546.x
Neuman, C., Hatje, E., Zarkasi, K. Z., Smullen, R., Bowman, J. P., and Katouli, M. (2016). The effect of diet and environmental temperature on the faecal microbiota of farmed Tasmanian Atlantic Salmon (Salmo salar L.). Aquac. Res. 47, 660–672. doi: 10.1111/are.12522
Pörtner, H. O. (2002). Climate variations and the physiological basis of temperature dependent biogeography: systemic to molecular hierarchy of thermal tolerance in animals. Comp. Biochem. Physiol. A Mol. Integr. Physiol. 132, 739–761. doi: 10.1016/S1095-6433(02)00045-4
Qiu, J., Wang, W., Wang, L., Liu, Y., and Wang, A. (2011). Oxidative stress, DNA damage and osmolality in the Pacific white shrimp, Litopenaeus vannamei exposed to acute low temperature stress. Comp. Biochem. Physiol. C Toxicol. Pharmacol. 154, 36–41. doi: 10.1016/j.cbpc.2011.02.007
Rawls, J. F., Mahowald, M. A., Ley, R. E., and Gordon, J. I. (2006). Reciprocal gut microbiota transplants from zebrafish and mice to germ-free recipients reveal host habitat selection. Cell 127, 423–433. doi: 10.1016/j.cell.2006.08.043
Ringø, E., Sperstad, S., Myklebust, R., Refstie, S., and Krogdahl, Å (2006). Characterization of the microbiota associated with intestine of Atlantic cod (Gadus morhua L.): the effect of fish meal, standard soybean meal and a bioprocessed soybean meal. Aquaculture 261, 829–841. doi: 10.1016/j.aquaculture.2006.06.030
Rong, X. (2012). Impacts of Environmental Factors on the Intestinal Micromicrobiota of Apositchopus japonicus and its Association with Bacterial Diseases. Ph. D thesis. Qingdao: Ocean University of China.
Schulte, P. M. (2015). The effects of temperature on aerobic metabolism: towards a mechanistic understanding of the responses of ectotherms to a changing environment. J. Exp. Biol. 218, 1856–1866. doi: 10.1242/jeb.118851
Segata, N., Izard, J., Waldron, L., Gevers, D., Miropolsky, L., Garrett, W. S., et al. (2011). Metagenomic biomarker discovery and explanation. Genome Biol. 12:R60. doi: 10.1186/gb-2011-12-6-r60
Sharma, J. G., Singh, S. P., and Chakrabarti, R. (2017). Effect of temperature on digestive physiology, immune-modulatory parameters, and expression level of Hsp and LDH genes in Catla catla (Hamilton, 1822). Aquaculture 479, 134–141. doi: 10.1016/j.aquaculture.2017.05.031
Song, Z., Liu, J., Zhuang, P., Wang, Y., Zhang, L., Hu, Y., et al. (2015). Influence of low-temperature stress on the antioxidant enzymes activities and malondialdehyde contents in liver of juvenile Siganus guttatas. Mar. Fish. 37, 142–150. doi: 10.3969/j.issn.1004-2490.2015.02.007
Soriano, E. L., Ramírez, D. T., Araujo, D. R., Gómez-Gil, B., Castro, L. I., and Sánchez, C. G. (2018). Effect of temperature and dietary lipid proportion on gut microbiota in yellowtail kingfish Seriola lalandi juveniles. Aquaculture 497, 269–277. doi: 10.1016/j.aquaculture.2018.07.065
Sullam, K., Essinger, S. D., Lozupone, C. A., O’Connor, M. P., Rosen, G. L., Knight, R., et al. (2012). Environmental and ecological factors that shape the gut bacterial communities of fish: a meta-analysis. Mol. Ecol. 21, 3363–3378. doi: 10.1111/j.1365-294X.2012.05552.x
Tremaroli, V., and Bäckhed, F. (2012). Functional interactions between the gut microbiota and host metabolism. Nature 489, 242–249. doi: 10.1038/nature11552
Turnbaugh, P. J., Hamady, M., Yatsunenko, T., Cantarel, B. L., Duncan, A., Ley, R. E., et al. (2009). A core gut microbiome in obese and lean twins. Nature 457, 480–484. doi: 10.1038/nature07540
Urian, A. G., Hatle, J. D., and Gilg, M. R. (2011). Thermal constraints for range expansion of the invasive green mussel, Perna viridis, in the southeastern United States. J. Exp. Zool. A Ecol. Genet. Physiol. 315, 12–21. doi: 10.1002/jez.644
Wang, Y., Zhu, Y., and Chen, Z. (2011). A meta-analysis of the effects of temperature variation on antioxidant defenses in fish. Ecol. Sci. 30, 301–308.
Wu, S., Gao, T., Zheng, Y., Wang, W., Cheng, Y., and Wang, G. (2010). Microbial diversity of intestines and mucus in yellow catfish (Pelteobagrus fulvidraco). Aquaculture. 303, 1–7. doi: 10.1016/j.aquaculture.2009.12.025
Keywords: low temperature, antioxidant enzymes, HSP, microflora, large yellow croaker
Citation: Lv H, Liu Y, Li H, Yin X, Wang P, Qu X, Gao Y, Li W and Chu Z (2021) Modulation of Antioxidant Enzymes, Heat Shock Protein, and Intestinal Microbiota of Large Yellow Croaker (Larimichthys crocea) Under Acute Cold Stress. Front. Mar. Sci. 8:725899. doi: 10.3389/fmars.2021.725899
Received: 16 June 2021; Accepted: 30 July 2021;
Published: 19 August 2021.
Edited by:
Youji Wang, Shanghai Ocean University, ChinaReviewed by:
Ronghua Li, Ningbo University, ChinaBrad Buckley, Portland State University, United States
Jun Wook Hur, Kunsan National University, South Korea
Copyright © 2021 Lv, Liu, Li, Yin, Wang, Qu, Gao, Li and Chu. This is an open-access article distributed under the terms of the Creative Commons Attribution License (CC BY). The use, distribution or reproduction in other forums is permitted, provided the original author(s) and the copyright owner(s) are credited and that the original publication in this journal is cited, in accordance with accepted academic practice. No use, distribution or reproduction is permitted which does not comply with these terms.
*Correspondence: Yang Gao, avgy1982@hotmail.com; Weiye Li, 17536260@qq.com