Understanding Sea Level Processes During Western Mediterranean Storm Gloria
 Begoña Pérez-Gómez1*
  Manuel García-León1,2
  Javier García-Valdecasas3
  Emanuela Clementi4
  César Mösso Aranda2
  Susana Pérez-Rubio1
  Simona Masina4
  Giovanni Coppini5
  Rafael Molina-Sánchez6
  Angel Muñoz-Cubillo7 Ana García Fletcher7 José Francisco Sánchez González8
  Agustín Sánchez-Arcilla2
  Enrique Álvarez Fanjul1
- 1Puertos del Estado, Madrid, Spain
- 2Laboratori d’Enginyeria Marítima, Universitat Politècnica de Catalunya BarcelonaTech (LIM/UPC), Barcelona, Spain
- 3Oritia & Boreas, Granada, Spain
- 4Ocean Modeling and Data Assimilation Division, Centro Euro-Mediterraneo sui Cambiamenti Climatici, Bologna, Italy
- 5Ocean Predictions and Applications, Centro Euro-Mediterraneo sui Cambiamenti Climatici, Lecce, Italy
- 6Departamento de Ingeniería del Transporte, Territorio y Urbanismo, ETSI de Caminos, Canales y Puertos, Universidad Politécnica de Madrid, Madrid, Spain
- 7Ministerio para la Transición Ecológica y el Reto Demográfico, Madrid, Spain
- 8Centro de Estudios de Puertos y Costas (CEDEX), Madrid, Spain
In January 2020, the storm Gloria hit the Western Mediterranean Sea causing severe coastal damages, destruction of infrastructures, flooding and several casualties. This extreme event was characterized by strong Eastern winds, record-breaking waves heights and periods, and a storm surge that locally beat the record along Valencia’s coastline. This paper analyses the dynamic evolution of sea level during this storm. The study employs both the in situ data and the operational forecasts of the PORTUS early warning system. Tide gauge data are analyzed on the different temporal scales that contribute to total sea level: long-term and seasonal, tides and storm surges, and higher frequency oscillations. It was found that, due to the unusual long wave periods, infragravity waves were generated and dominate the high frequency energy band, contributing significantly to extreme sea level records. This is a relevant finding, since this kind of oscillations are usually associated with larger basins, where swell can develop and propagate. The impact of sea level rise is also analyzed and considered relevant. A multi-model ensemble storm surge forecasting system is employed to study the event. The system was able to correctly forecast the surge, and the measured data were always inside the confidence bands of the system. The differences of the results obtained by the available operational forecasting system integrated into the ensemble, including those from Copernicus Marine Service, are described. All the models provided useful forecasts during the event, but differences with measured data are described and connected with the known limitations in physics (for example, barotropic vs. baroclinic) and set-up of the models (model domain, lack of tides and different inverse barometer implementations at the open boundaries amongst others).
Introduction
On January 19th-24th 2020, the Spanish Mediterranean coast was hit by the storm Gloria, one of the most extreme meteorological events ever recorded in the region. A strong North-South atmospheric pressure gradient, linked to a record breaking high atmospheric pressure system centered over the British Islands (1050 hPa), was the driver of exceptional Eastern winds from the Ligurian Sea to the Eastern coast of the Iberian Peninsula. Red warnings for coastal meteorological phenomena (wind, waves, and surges) were released by AEMET (Agencia Estatal de Meteorología) and PdE (Puertos del Estado) for most of the coastline of the Balearic Islands, Catalonia and the Valencian Community between January 19th and 20th, extended to January 21st in Catalonia. Orange or yellow level notices were issued for the rest of the Mediterranean coastlines. Several buoys beat their record of significant wave height, that reached 8.44 m at Valencia buoy (see AEMET Report, 2020; De Alfonso et al., 2021, for a detailed meteorological and wave description of the storm). A mostly wind-driven storm surge was observed along the coastline of Spanish mainland, combined with a significant wave setup contribution at specific spots (Ebro Delta, between Valencia and Denia), according to Amores et al. (2020).
The storm Gloria wreaked havoc on the coastline: according to a statement released by the Spanish Ministers Council of January 28th of 2020, the combination of strong winds and heavy rain caused storm surge, inland flooding and mudslides across the country, leaving 14 casualties and 3 more missings. The Copernicus Emergency Management Service (EMS) reported that Gandía and Valencia harbors were closed to shipping traffic. The storm surge swept 3 km inland, devastating rice paddies and coastal features in the Ebro river delta, and major damage was caused to beaches around Barcelona and Valencia. Gloria also caused a strong storm flooding at several locations along the east coast of mainland Spain. According to Global Catastrophe Recap, the Gloria storm caused significant damage to agriculture, infrastructure, and both private and commercial property. The insurance sector received more than 11,600 claims worth EUR76 million. Total economic losses were estimated to be around EUR200 million, mainly in Catalonia and Valencia, the two most affected regions. Wave overtopping was the main source of problems at the Balearic Islands, where the magnitude of the storm surge or sea level contribution was secondary.
As for any extreme meteorological event, the final extent of coastal impacts depends on a complex combination of factors (coastal morphology, infrastructures, population, and economic activities), and meteorological and oceanographic variables interacting at different spatial and temporal scales (e.g., precipitation, atmospheric pressure, wind, waves, currents and sea level). Coastal sea level is a main driver of most of these impacts. Its temporal and spatial variability is caused by different forcing mechanisms acting at different timescales that combine local or coastal processes with larger scale signals (Woodworth et al., 2019). Understanding the role of these different coastal sea level processes is especially important during extreme events like Gloria. For this, tide gauges are a key source of information due to their location at the coast (inside harbors), the length of their time series and their high sampling frequency, especially in recent years. Part of the sea level signal, on timescales of hours and days, is operationally forecasted with numerical models of different characteristics and complexity (storm surge, circulation, wave-storm surge or fully coupled models). Both tide gauge data and models are therefore important components of early warning systems such as PORTUS, used in this study, that combine real time observations and forecasts of sea level, waves, wind and currents.
The approach followed in this work is to divide the sea level signal in three different timescales: (i) hourly to daily: tide and non-tidal component (surge); (ii) long-term, interannual and seasonal; and (iii) high frequency (minutes, seconds). An introduction to these processes, with focus on the Western Mediterranean (WM) Sea, is presented below:
• Hourly to daily processes:
Hourly sampling tide gauges data have been typically enough to measure tide and surge components, and the basis of many studies of extreme sea levels. In the WM, characterized by a micro-tidal regime, the non-tidal component, mainly driven by meteorological agents, is commonly dominant. Short-term sea level forecasts of this component are available in the area through different storm surge forecasting systems (Nivmar system from PdE: Álvarez-Fanjul et al., 2001, Mètèo France storm surge forecasting system: Pasquet et al., 2014, 2017). These systems have been traditionally based on barotropic 2-D models forced by atmospheric pressure and wind, that reproduce the magnitude of sea level increase (storm surge) during extreme events with typical timescales of hours and days.
Concern about climate change impact on sea level rise (SLR) and on the potential increase of sea level related hazards have led to develop storm surge hindcasts in this region (Ratsimandresy et al., 2008) and projections under different climate scenarios (Marcos et al., 2011; Androulidakis et al., 2015; Lin-Ye et al., 2020). Despite the general agreement of these different studies on a general storminess attenuation in the area, several extreme events like Gloria have recently raised concerns about the vulnerability of these coasts to storms that typically hit the area between September and May.
Waves can also contribute to extreme sea levels recorded by tide gauges, at hourly timescales, as already proposed by Charnock (1955); Stewart (1974). In fact, several studies have paid attention to this topic in recent years (Bertin et al., 2015; Melet et al., 2018; Bonaduce et al., 2020). The following wave-induced processes could affect sea level during a storm surge: (i) Stokes-Coriolis drift and consequent mass transport (Stokes, 1847; Hasselmann, 1970); (ii) wave induced effect on the wind stress, due to momentum exchange (Staneva et al., 2017); and (iii) wave setup (Longuet-Higgins and Stewart, 1962; Bowen et al., 1968). Determining the magnitude of these contributions to extreme sea levels recorded by a tide gauge is not straightforward and out of the scope of this contribution, although Amores et al. (2020) found a significant wave set-up contribution during this storm. Still a research topic, other factors such as location or sampling rate of the tide gauge may complicate their identification.
• Long term, interannual and seasonal processes:
Extreme sea levels are affected by mean sea level (MSL: monthly and annual means) and its long-term evolution over decades, as well as by interannual and seasonal changes that are particularly important in the Mediterranean. The main contributors to these changes are the steric component (changes in density due to temperature and salinity changes), the mass component and the atmospheric component (Gomis et al., 2006). In the Mediterranean the evolution of MSL is affected by the lateral mass transport flux through the Strait of Gibraltar (Pinardi et al., 2014), leading to trend values that may differ from the global estimated trend (Ablain et al., 2019: 3.35 ± 0.4 mm/year for the altimetry period). Bonaduce et al. (2016) found for the Mediterranean basin a mean sea level positive trend of 2.44 ± 0.5 mm/year, based on satellite altimetry and tide gauge data for the period 1993-2012.
Tide gauges sea level trends may differ from this basin mean and from altimetry open ocean values, mainly due to the lack of temporal and spatial resolution of satellite data near the coast. Besides, their relative sea level trends (vertical land movement not corrected) are important for assessing the impact of extreme meteorological events on the coast. However, the small number of stations with sufficiently long time series, and the problems of datum stability, malfunctions or gaps over several decades of operation, make data processing and interpretation difficult. From PdE tide gauge records in the study area (Figure 1B), relative MSL has increased at a rate from 2.1 mm/year in Málaga to 5.7 mm/year in Barcelona for the period 1993-2019. This latter trend would imply a relative MSL increase at this point of 15 cm in 27 years, which would have important consequences on the extent of flooding and coastal erosion caused by waves. On top of this multi-decadal variation, interannual and intra-annual sea level variations play a key role on the final consequences of a storm. In the WM the tide gauge derived seasonal cycle has an average amplitude of 6 to 8 cm, with maximum sea levels in October/November and minimum sea levels around February/March (Tsimplis et al., 2005; Pérez-Gómez, 2014).
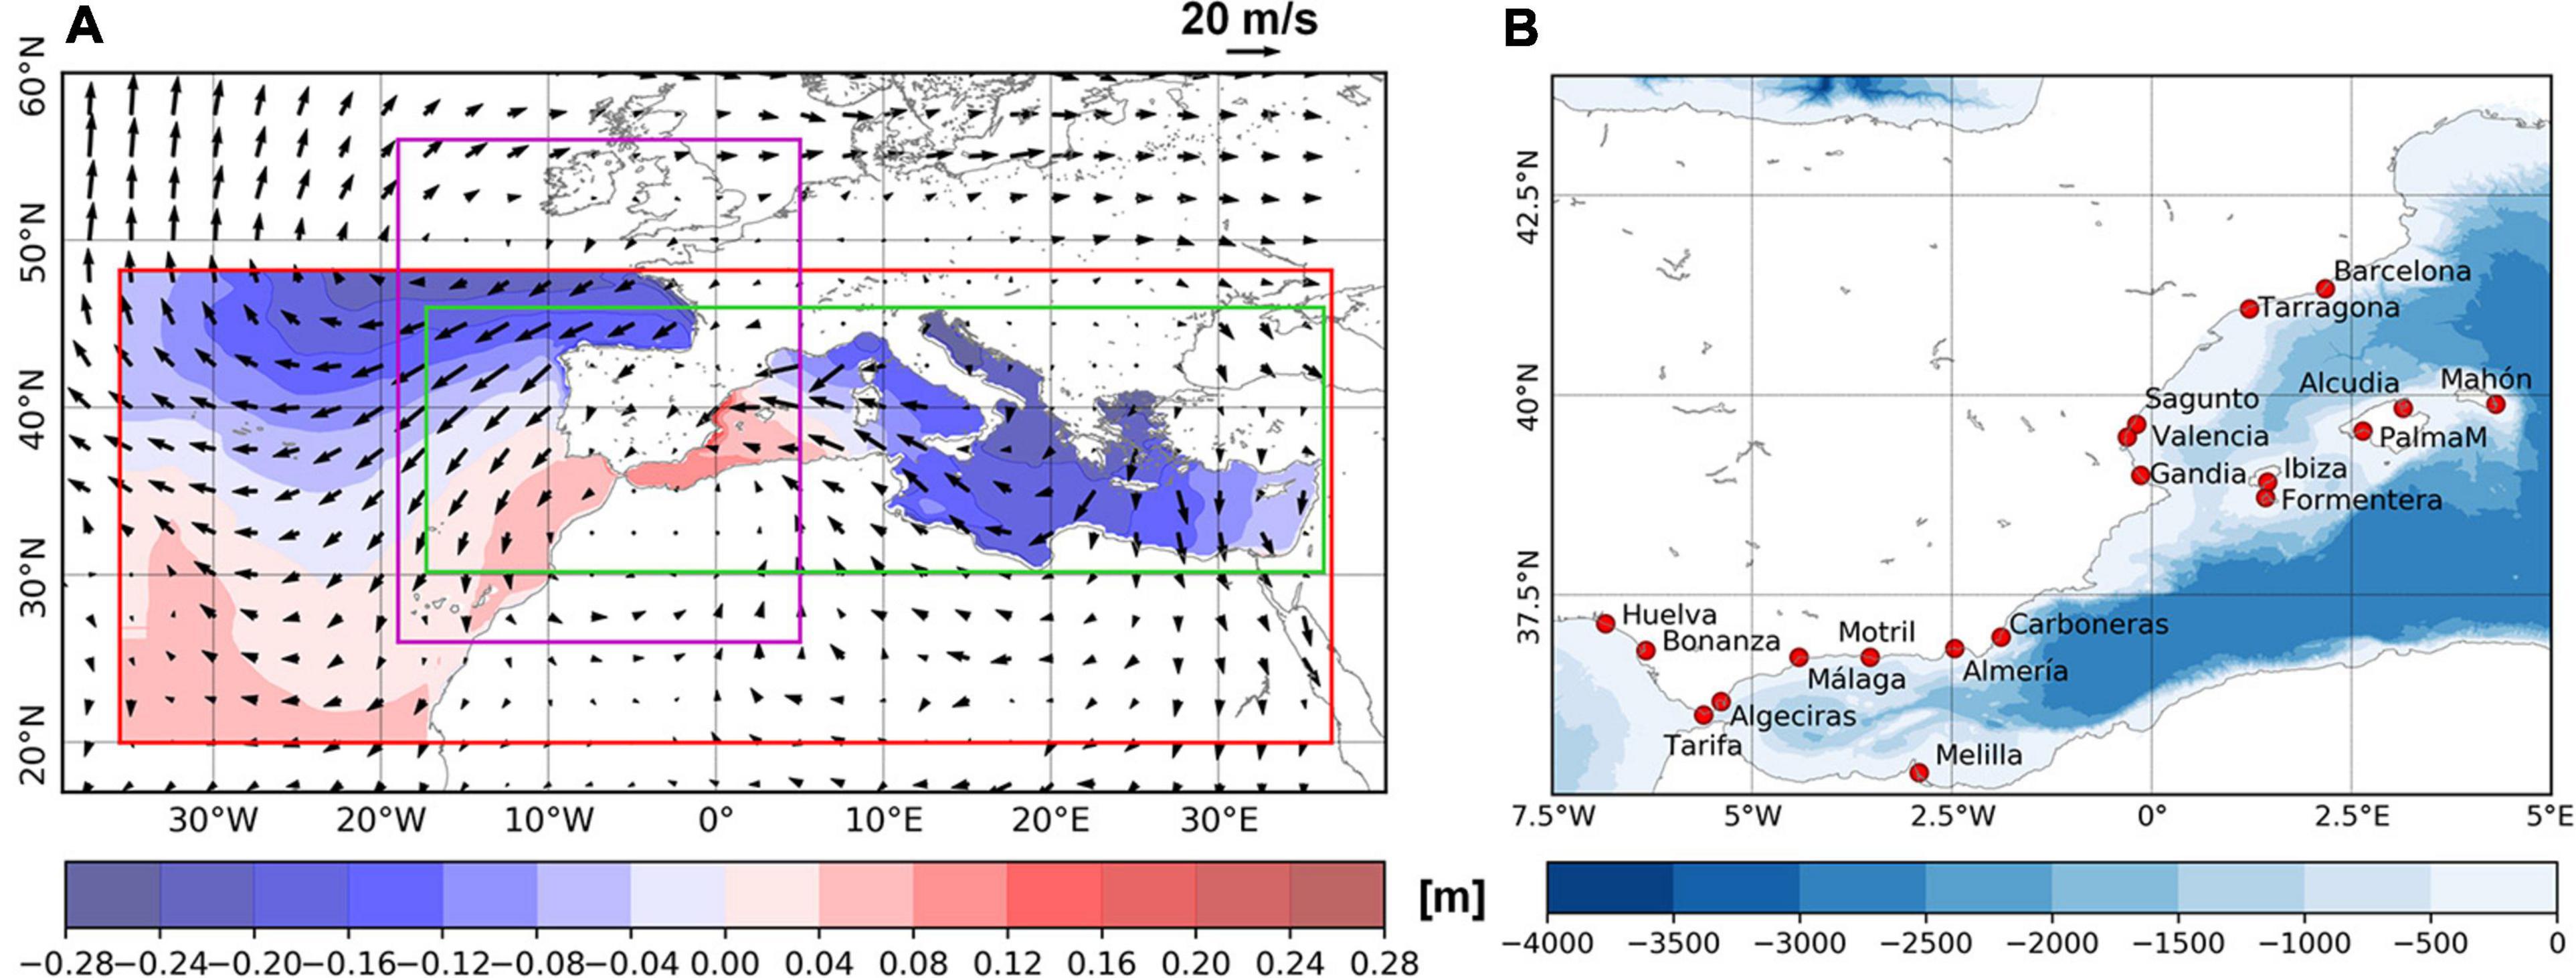
Figure 1. (A) Daily averaged surge forecast from the Nivmar system during the Gloria storm-peak (2020/01/21). The colored areas show the positive (red scale) and negative (blue scale) surges. Units in meters. The black vector field represents the daily averaged wind fields from the ECMWF-IFS system. The rectangles show the domains of the three regional forecasts systems being used: in red, Nivmar; in green, MedFS and in magenta, IBI-MFS. (B) Red dots: List of the REDMAR tide gauges at the WM. The color bar shows the bathymetry elevation, in meters.
• High frequency processes:
Sea level oscillations with periods of the order of minutes can be present and also contribute to local extreme sea levels. Very often, these oscillations are infragravity waves (periods of 30 s - 5 min) generated by non-linear interactions of swell waves approaching the coast (Munk, 1949, 1962). Their amplification through resonance in some bays and harbors (Longuet-Higgins and Stewart, 1962; Wu and Liu, 1990; Herbers et al., 1995) may be a problem for anchored boats and port operations. Such oscillations are a well-known hazard, for example, along the North coast of Spain, where well developed swell waves from the Atlantic are usually present. Yet, infragravity waves have not been usually associated with the WM coast, where wind-sea waves are dominant and swell periods are significantly smaller than in the Atlantic. Other types of oscillations, named meteotsunamis, are common in this area. With larger periods (5 min to hours) and linked to sudden atmospheric pressure changes caused by atmospheric gravity waves, pressure jumps, frontal passages, or squalls, these oscillations reach their largest amplitudes (up to 1 m) in the Balearic Islands (Monserrat et al., 2006; Jansá et al., 2007; Rabinovich, 2009; Vilibić et al., 2014), typically under calm weather conditions, and during the summer months. Both infragravity waves and meteotsunamis behave as small tsunami-like waves, linked to strong currents and intermittent inundation that may increase the impact and damages of storms along the coast (Sheremet et al., 2014). Detection and characterization of these oscillations, as for tsunamis, is easier today thanks to the lower sampling rates of tide gauges (<1 min), a standard requirement of tsunami warning systems for sea level data exchange.
The primary motivation of this study is to explore the different coastal sea level processes involved during the Storm Gloria. To accomplish this, our objective is threefold: (i) to exploit the full potential of PdE PORTUS system, regarding sea level variability, by assessing its performance as an early warning system, and by analyzing its historical in situ data and advanced products at different timescales; (ii) to determine the reliability of coastal sea level forecasts from different operational models, and the probabilistic forecast obtained by their combination through a multi-model sea level forecast system (ENSURF); (iii) to put the storm Gloria results in context, by comparison with past historical events, to identify common patterns in the drivers, and the role of the sea level processes on the extent of coastal damages.
PORTUS novel tools employed in this work include operational detection and characterization of some of the mentioned sea level components from coastal observations and the use of a multi-model Bayesian technique to integrate different overlapping operational models. A consistent decomposition of temporal scales from WM tide gauges has revealed their relative importance during this event, and the presence of high frequency sea level oscillations in the infragravity band, that beat their historical record at several stations. From a forecasting point-of-view, the different storm surge forecasts from existing operational systems demonstrate that, even with the same atmospheric forcings, different ocean physics (barotropic, baroclinic, etc.) and parameterizations (bulk formulas) can lead to different solutions. In this case, an ensemble approach can be a suitable option for integrating multi-model solutions into a single message, that bounds uncertainty and provides a better forecast than any other individual member.
The manuscript is structured as follows: Section “Materials and Methods” describes the observational data, tools and operational models employed in the investigation, as well as the methodology followed. Section “Results” presents the results based on the tide gauge data analysis at different timescales and the validation of storm surge forecasts by the different models, including the comparison with the performance during another recent storm. Finally, discussion of the main findings, limitations of the study, conclusions and future work are included in Section “Discussion.”
The paper is one of a series of studies that assess the performance of the PORTUS system and Copernicus Marine Service (CMEMS) products for different variables and aspects of the storm Gloria: record wave heights from buoys and wave models (De Alfonso et al., 2021); validation of currents, temperature and salinity of the CMEMS regional model for the Iberia Atlantic coast (IBI) (Sotillo et al., 2021); and performance of HF-radar measurements (Lorente et al., 2021).
Materials and Methods
The research is based on data and products from PdE PORTUS system, a visualization tool and early warning system that integrates in situ data from PdE observational platforms with regional, coastal and local wave and circulation models. The measurements and derived products used in this work come mainly from PdE tide gauge network (REDMAR). Wave data from PdE buoys near the tide gauges are also used in section “High Frequency Processes,” when describing high frequency sea level oscillations. Most of this in situ data (wave data, 1-min and hourly sea levels) are integrated in the Copernicus Marine Service System in situ Thematic Assembly Centre (CMEMS INS TAC).
Sea level variations on timescales of hours/days are operationally forecasted in the region through barotropic and baroclinic models. PORTUS sea level forecasting system combines PdE regional storm surge forecasts with the sea level solutions provided by the CMEMS Marine Forecasting Centers for the IBI (Iberia Atlantic coast) and the MED (Mediterranean) regions (Sotillo et al., 2015; Clementi et al., 2019). The three solutions, integrated with a Bayesian technique in the multi-model system ENSURF, have been compared to tide gauge data during the storm Gloria. Their performance has been analyzed and linked to their differences (forcing, resolution, etc.), for a better understanding of the storm surge component during this event. A comparative analysis in terms of forecasted sea levels was also performed with another storm, prior to Gloria, and named Dora, that hit the coast on December 5th, 2019. The different behavior of the models during this second event sheds light on the reasons for their different performance.
Coastal Sea Level Observations
Coastal sea level data from the REDMAR network have been analyzed for different timescales, from near-real time to delayed mode products with diverse sampling rates. This network has been operational since 1992 and it is composed today of 40 stations, 16 of which in the Spanish Mediterranean coast (Figure 1B). Between 2005 and 2009 the network was upgraded to new radar sensors that transmit 1-min averaged sea level data, every minute. Local wave integrated parameters are also computed from the 2 Hz raw radar data and included, every 20-min, in the data transmission. Some stations provide 1-min averaged atmospheric pressure and wind. An automatic quality control applied in near-real time (every 15 min) allows detection and flagging of most evident errors (isolated spikes, out of range values, and constant values). Sea level data are integrated in the alert system in place for waves and sea levels, including an automatic detection algorithm for sea level oscillations with periods of several minutes (tsunami-like waves) (Pérez-Gómez et al., 2013; Pérez-Gómez et al., 2016). This system sends automatic messages to PdE staff whenever waves, sea level and oscillations exceed predetermined thresholds at each station.
In addition, 2 Hz raw data from the radar sea level sensors are transmitted hourly to PdE, for a more detailed analysis and exploitation of higher frequency sea level oscillations (HFSLO hereafter) by a software (NivMarHF) implemented in 2019 (García-Valdecasas et al., 2020). This novel application allows a better characterization of these oscillations (e.g., infragravity waves: 30 s - 5 min periods, not well captured with 1-min real time data). The tool applies low and high pass digital filters to remove oscillations outside the 0.0333 − 0.000277 Hz frequency band (30 s – 1 h). Filtered data is analyzed in the time domain to provide information regarding the amplitudes and periods of the oscillations during an hour time frame. Maximum and average of the highest third HFSLO heights are calculated for every hour. A frequency domain analysis is done, to understand how energy is distributed among the mentioned frequency band. Two energy spectrums are calculated: a full 104 frequency energy spectrum along with a reduced four band spectrum. Finally, the tool identifies events whenever the HFSLO height exceeds the 98th percentile. This advanced product is displayed through the harbor visualization tool CMA, that includes a calendar to access historical events detected at each tide gauge.
The mentioned automatic quality control for 1-min sea level data includes the automatic computation of hourly sea levels and non-tidal residuals that will feed the operational storm surge forecasting system (see section “Operational Models Providing a Sea Level Solution in the Area”). As by-products, 5-min data are first obtained by averaging 1-min data (5-min was the original temporal sampling of tide gauges between 1992 and 2006) and hourly values are computed by means of a symmetrical filter of 54 points applied to 5-min data (as in Pugh, 1987). If tidal constants are available for the station, tide predictions for the observation period are computed, and hourly non-tidal residuals obtained by subtracting the tide from the hourly sea levels.
The rest of products from the REDMAR network are obtained annually in delayed mode. The Foreman software for tidal analysis and prediction is used (Foreman, 1977), generating a set of 69 harmonic constants for each year/station. Further steps for computing other standard sea level products are based on the ones applied by the University of Hawaii Sea Level center (computation of daily, monthly and annual extremes, means and tidal ranges). Additional statistical information is computed regularly and published in the network consolidated reports (annual percentiles of sea levels and residuals, trends of mean sea levels, extremes, harmonic constants and percentiles, surge and sea level variance, basic datum definitions, etc.). Both the quality control and delayed mode data processing follow existing published recommendations and best practices for in situ sea level observations (UNESCO/IOC, 2020).
Operational Models Providing a Sea Level Solution in the Area
A detailed description of the three regional operational forecasting systems employed in this study is presented below. Basic information on the models characteristics that may influence the sea level output is given in Table 1. In this article, the analyses will be based on the surge product. The sea level product exhibits better metrics due to the addition (but not explicitly modeled) of the tide gauge tidal harmonics into the signal. The surge product provides further insight on how the physical processes that were explicitly modeled were included.
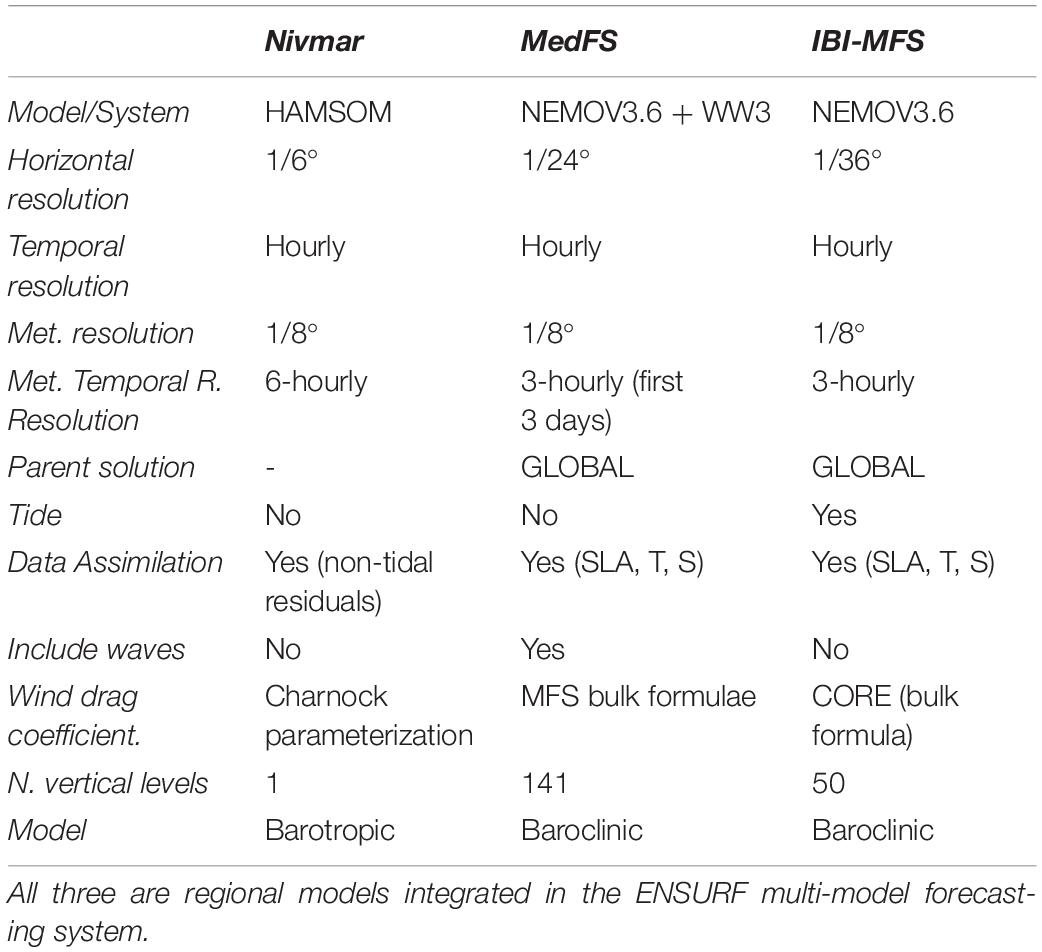
Table 1. Basic information of the different models providing a sea level solution that have been analyzed for the storm Gloria.
Nivmar Storm Surge Forecasting System
Puertos del Estado Nivmar system (Álvarez-Fanjul et al., 2001) is based on a 2D-barotropic implementation of the HAMSOM model (Backhaus and Hainbucher, 1987). It covers all the Spanish coast (Iberian coast, Canary, and Balearic Islands) and the whole Mediterranean Sea (red box in Figure 1A), with a variable size grid in the Atlantic boundary and a resolution of 10′ × 15′ min for the rest of the domain. The bathymetry employed is the DTM5 data set (GETECH, 1995). The model uses a finite difference semi-implicit scheme and is forced by six-hourly atmospheric pressure and wind fields extracted from the European Centre for Medium-Range Weather Forecasts (ECMWF) 1/8° hourly meteorological forecasts. Wind stress is computed with the Charnock parameterization (Charnock, 1955), based on a constant non-dimensional surface roughness or Charnock coefficient, α = z0gW2, where z0 is the roughness length, W the friction velocity and g the gravitational acceleration. For the bottom friction it makes use of a quadratic function in terms of the current velocity. At the open boundary (Atlantic border) pure isostatic response to atmospheric pressure is applied (inverse barometer effect). No tides are considered in the model.
At those locations with a tide gauge (main harbors), a nudging scheme makes use of near-real time tide gauge data from the last 7 days to correct low frequency signals (steric component) that are not present in the barotropic model, according to the following equation:
Where RES(t) is the output of the model (hourly surge), RES°(t) is the hourly surge recorded by the tide gauge and RESA(t) is the corrected surge forecast. Hourly surge from the tide gauge is automatically provided to the system by the automatic quality control described in “Coastal Sea Level Observations.”
Total sea level forecasts at coastal locations along the Spanish coast are computed by adding to the model surge output the tidal signal derived from the tide gauge station (if a tide gauge is available, practically at all main ports) or from the regional tidal atlas provided by LEGOS (COMAPI model) at the nearest point. This tide model has a resolution of 1′ × 1′ and provides a set of 37 harmonic constants at each grid point. The Nivmar system is run twice per day (00 H and 12 H cycles).
CMEMS Mediterranean Forecasting System
The Mediterranean Forecasting System (MedFS) is a numerical ocean prediction system that produces analyses, reanalyses and short term forecasts for the entire Mediterranean Sea and its Atlantic ocean adjacent areas (green box in Figure 1A) to better resolve the exchanges with the Atlantic Ocean at the Strait of Gibraltar. MedFS became operational in the late 90’s and was developed in several EU and National Framework programs (Pinardi et al., 2003; Tonani et al., 2008; Pinardi and Coppini, 2010) and since 2015 is part of the Copernicus Marine Service (CMEMS). MedFS operationally provides regular and systematic information about the physical state of the Mediterranean Sea in terms of temperature, salinity, sea level, currents and mixed layer depth at a resolution of 1/24° in horizontal and along 141 vertical levels. MedFS is composed of a coupled hydrodynamic-wave modeling system based on NEMO v3.6 and WaveWatch-III (WW3) v3.14 including an OceanVar assimilation scheme.
The hydrodynamic model implementation of the Mediterranean Sea is achieved by means of primitive equations solved using the time-splitting technique, non-linear free surface formulation and time-varying vertical z-star coordinates. The advection scheme for active tracers, temperature and salinity, is a mixed up-stream/MUSCL (Monotonic Upwind Scheme for Conservation Laws; Van Leer, 1979) modified as in Oddo et al. (2009). The vertical diffusion and viscosity terms are a function of the Richardson number as parameterized by Pacanowsky and Philander (1981). The model interactively computes air-surface fluxes of momentum, mass, and heat using bulk formulae described in Pettenuzzo et al. (2010). A detailed description of other specific features of the model implementation can be found in Tonani et al. (2008, 2014), Oddo et al. (2009, 2014), Clementi et al. (2017b).
The atmospheric forcing used in MedFS are from operational analysis and forecast fields from ECMWF at 1/8° horizontal resolution and 6 h (3 h for the first 3 days of forecast) temporal frequency. In particular the following atmospheric fields are used to compute MedFS bulk formulae: wind speed, temperature, cloud cover, specific humidity, atmospheric pressure and precipitation.
The wave model is implemented using 24 directional bins (15° directional resolution) and 30 frequency bins (ranging between 0.05 Hz and 0.7931 Hz) to represent the wave spectral distribution. It takes into consideration the surface currents for wave refraction but assumes no interactions with the ocean bottom.
The coupling between the hydrodynamic and the wave model is achieved by an online hourly two-way coupling and consists in exchanging the following fields: NEMO sends to WW3 the air-sea temperature difference and the surface currents, while WW3 sends to NEMO the neutral drag coefficient used to evaluate the surface wind stress. More details on the model coupling and on the impact of the coupled system on both wave and circulation fields can be found in Clementi et al. (2017a).
A 3D-variational data assimilation scheme, called OceanVar, which was initially developed by Dobricic and Pinardi (2008) and further improved for a wide range of ocean data assimilation applications (Storto et al., 2015) is used to correct the hydrodynamic model solutions. The code is highly efficient since it is designed by using hybrid MPI-OPENMP parallelization techniques (Cipollone et al., 2020). The system makes use of trivariate EOFs (Empirical Orthogonal Functions) as a part of the static background error covariance matrix. EOFs are computed in every grid point for the sea surface height, temperature and salinity using a 3 years simulation in order to capture the recent variability in the Mediterranean Sea.
CMEMS IBI Forecasting System
The CMEMS forecasting system for the IBI (Iberia - Bay of Biscay - Ireland) region (IBI-MFS) provides operational regional short-term (5-days) hydrodynamic forecasts of a range of physical parameters (sea level, currents, temperature, and salinity) since 2011 (Sotillo et al., 2015). The system extends between 26 and 56°N and 19°W-5°E (magenta domain in Figure 1A). IBI-MFS is based on an eddy-resolving NEMO (Madec and NEMO team, 2008) model application (v3.6) that includes high-frequency processes required to reproduce regional-scale processes, with a horizontal resolution of 1/36°. NEMO solves the three-dimensional finite-difference primitive equations in spherical coordinate discretized on an Arakawa C-grid and 50 geopotential vertical levels (z-coordinate), assuming hydrostatic equilibrium and Boussinesq approximation. The steep slopes characteristic of the IBI zone are handled with partial bottom cell representation of the bathymetry (through a composite of ETOPO2 and GEBCO8).
The IBI-MFS is nested into the CMEMS Global solution, using daily fields at the open boundary conditions. Tides are also added at the boundaries by using 11 tidal harmonics. Atmospheric pressure component is also included, by assuming pure isostatic response at the open boundaries (inverse barometer approximation). Additionally, IBI uses a SAM2-based data assimilation scheme (Brasseur et al., 2005) to estimate periodically initial conditions by constraining the model with several datasets: (i) altimeter data (i.e., along-track sea level anomalies); (ii) in situ temperature and salinity vertical profiles; and (iii) satellite-derived sea surface temperature.
The system is forced with high-frequency 1/8° hourly meteorological forecasts provided by the ECMWF. Tri-hourly fields are used to compute surface stresses, surface heat (latent and sensible) and freshwater fluxes (evaporation-precipitation) via the CORE empirical bulk formulae (Large and Yeager, 2004). The following atmospheric variables are used: 10-m winds, surface pressure, 2-m temperature, relative humidity, precipitation, shortwave and longwave radiative fluxes.
Multi-Model Sea Level Forecast at Spanish Harbors
A multi-model system named ENSURF (ENsemble SURge Forecast) has been operational in PdE since 2018. First implemented by Deltares in the North Sea for integration of operational sea level forecasts in the region, PdE combined the Nivmar system with new operational baroclinic models for the first time in Pérez-Gómez et al. (2012). Today, the system combines sea level from Nivmar and CMEMS regional operational models in the region, to generate a probabilistic sea level forecast at the main harbors (Pérez González et al., 2017; Pérez-Gómez et al., 2019). ENSURF employs the Bayesian Model Average (BMA) technique (Beckers et al., 2008) to generate improved forecasts and their confidence interval at locations with tide gauges: the individual forecasts obtained from existing operational models at a particular site are combined with different weights obtained from its performance assessment results in a recent training period (7 days in this case). This requires near-real time access to tide gauge data and automatic quality control of these data (as required for the Nivmar system), and specific data tailoring of model outputs as will be described below. ENSURF is also a valuable operational validation tool that allows a detailed assessment of the skills of different models to forecast coastal sea levels.
The objective of the BMA is to generate an overall forecast probability density function (PDF) from the individual PDF’s of each model, where the individual weights represent the probability that a particular model will give the correct forecast. In this way, the overall forecast mean, for station s and time tfc can be obtained from:
where w(k) and forecast(k,s,tfc) are the weight and forecast for model k respectively. The technique is applied to the surge or non-tidal residual component of sea level because this can be approximated by a normal distribution (which is not the case for total sea level including tides, especially for strong semidiurnal regimes). So, we need to detide the observations from tide gauges, and from model data for those models providing total sea level. This could be considered a limitation but in practice, it is the best way of optimizing the final total sea level forecast, by using the tidal component obtained from historical tide gauge observations at each site. In its current implementation for the Spanish Mediterranean coast ENSURF uses the three regional scale models described in previous Section “Nivmar Storm Surge Forecasting System,” “CMEMS Mediterranean Forecasting System,” and “CMEMS IBI Forecasting System.” As the IBI-MFS model includes tides, this is the only source in the system that needs to be previously detided. This is done at each model grid point with the same software used to detide tide gauge data (Foreman, 1977).
Sea level detiding with harmonic analysis requires at least 1 year of data to obtain all relevant harmonic constants. Still, sometimes tidal energy may remain in the resulting surge signal due to unresolved non-deterministic components of the tide (Bernier and Thompson, 2015). This may affect the lowest frequencies, e.g., due to seasonal variations linked to stratification changes (Müller et al., 2014) but also higher frequencies, due to non-linear tide-surge interaction (Horsburgh and Wilson, 2007). In ENSURF, after frequency analysis of the initial residuals obtained by subtraction of the high frequency (>30 h–1) tidal signal, the frequencies f > 15 h–1 have been filtered out as the best approach to deal with the tidal remnant. This is applied to all data sources (models and observations) to ensure that the same frequencies are involved before their combination in the BMA (Pérez González et al., 2017).
The nudging technique applied to the HAMSOM model output in the Nivmar system is essential to correct the low frequency steric sea level signal not included in the model. This is particularly the case in the Mediterranean Sea, where the magnitude of this signal and the seasonal cycle is relatively high in relation to other processes. This should not be necessary in the baroclinic models that include these sea level processes. Pérez González et al. (2017) demonstrated that, although new baroclinic models have improved their skills to solve steric processes, nudging still proves to play a key role in improving their performance. Therefore, in this new implementation of ENSURF in PdE, the nudging approach is applied also to the baroclinic sources before integration in the BMA.
The sea level forecast provided by the system is a combination of the Nivmar solution available very early in the morning (the deterministic forecast is run twice, at 00 and 12 UTC) and the probabilistic forecast generated by ENSURF in the afternoon, when the baroclinic forecasts are ready to be integrated in the BMA. Finally, the BMA forecasted surge and its 90% confidence interval are added to the tide prediction at the harbor to output the final probabilistic total sea level forecast.
Models Validation
Performance of the ENSURF system was assessed by inter-comparison of the different models and the BMA forecasted surge with the surge derived from tide gauge observations during the event. For this, plots of time series evolution and Taylor diagrams were generated for each station, including computation of the mean bias (B), maximum error (MX) and Coefficient of Efficiency (COE) for each forecast. The Coefficient of Efficiency (COE) (Legates and McCabe, 1999, 2013) is obtained as:
Where Pi and Oi refer to the computed and observed signals respectively, N is the number of time records and (–) is the mean operator. A perfect model has a COE = 1. Despite COE has no lower bound, a value of COE = 0.0 implies that the model is no more able to predict the measured values than does the measured mean. Consequently, for negative COE values, the computed signal performs worse than the measured mean in predicting the variations in the observed signal. The Taylor diagram provides information of correlation, normalized standard deviation and centered root mean square error at each tide gauge.
Results
Analysis of Different Timescales and Processes From Coastal Sea Level Observations
While coastal damages were reported all along the WM coasts, sea levels measured by tide gauges (TGs hereafter) were only particularly extreme at the region of Valencia (Gandía, Sagunto, and Valencia TGs), followed by the South of Catalonia (Tarragona TG). This contrasts with the record-breaking measured wave heights (see De Alfonso et al., 2021), that seems to make waves the main driver of coastal problems during this event. Still, a detailed analysis of different timescales of sea level variability as provided by TGs, and their spatial variation, has helped to understand its role during the storm Gloria.
Figure 1B shows the REDMAR TGs in the region of study. Barcelona, Valencia and Málaga have the longest time series, with 28 years of data (starting in mid-1992 or 1993), followed by Ibiza (17 years, starting in 2003), Motril (15 years, starting in 2005), and Almería (14 years, starting in 2006). Sagunto, Gandía and Melilla were installed in September 2007 (13 years of data). All the stations in the Balearic Islands and Algeciras (Strait of Gibraltar) started their operation in 2009 (around 10 years of data). The sea level radar sensors, that provide lower temporal sampling data (2 Hz) and therefore additional information on the higher frequencies and local waves, were all installed from 2006.
Hourly and Daily Timescales: Surge and Tide
Figure 2 shows sea levels recorded by TGs during the storm Gloria (18th to 24th of January). On the top panels for each station, 1-min (black) and hourly (magenta) total sea levels above the local Tide Gauge Datum (TGD) are presented, as well as maximum 99th (green) and 99.95th (red) annual percentiles from historical hourly values. The figure shows the importance of the sampling rate for assessing the magnitude and characteristics of the extreme, especially at those stations where important sea level oscillations with periods of several minutes are observed. In this section, only filtered hourly values (frequencies < 0.5 cycles/hour) are considered.
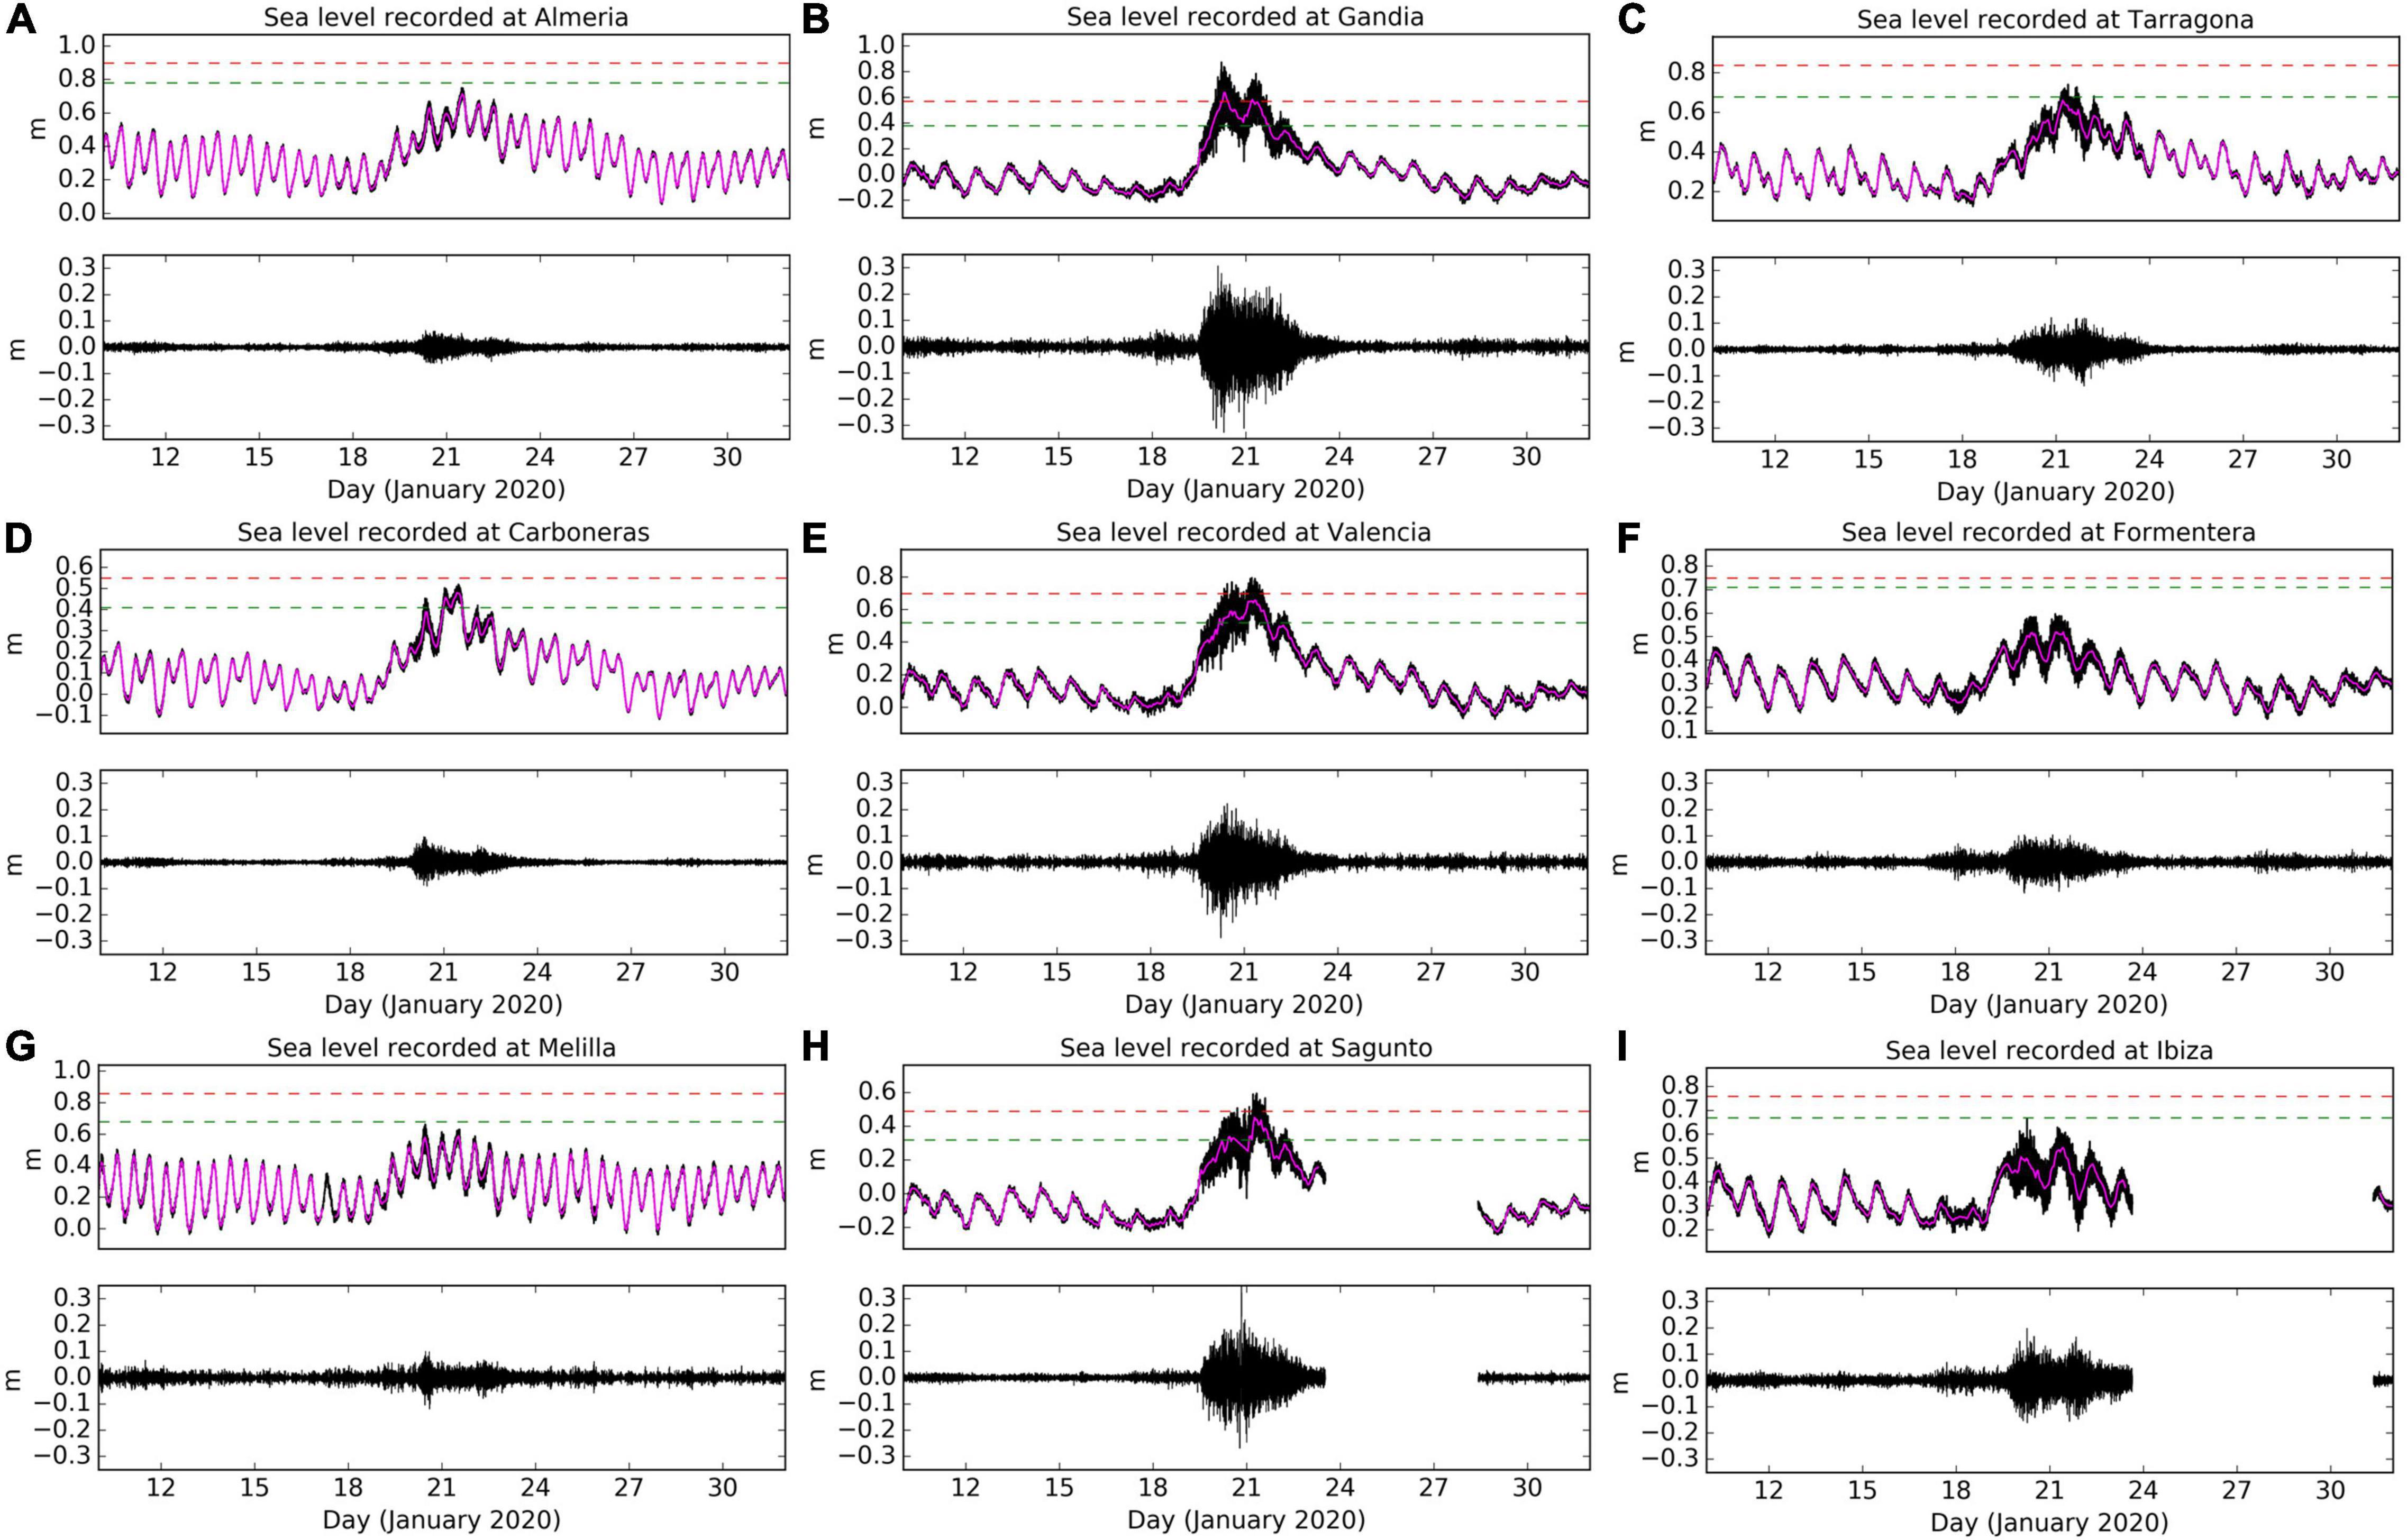
Figure 2. Sea levels recorded during storm Gloria by TGs at Almería (A), Gandía (B), Tarragona (C), Carboneras (D), Valencia (E), Formentera (F), Melilla (G), Sagunto (H), and Ibiza (I). Upper plots for each station show: 1-min data (black), hourly data (magenta), 99th percentile (green line) and 99.95th percentile (red line). Sea levels are referred to each Tide Gauge Datum (TGD). Bottom plots for each station show 1-min high-pass filtered data (same scale for all the stations).
The largest increase of sea level during Gloria was recorded at Gandía, Valencia and Sagunto TGs (Figures 2B,E,H), followed by Tarragona and Carboneras. The sea level increase was small or even negligible at the rest of stations (in the Alboran Sea, Strait of Gibraltar, the Balearic Islands, and Barcelona). This is confirmed by the magnitude of the surge or non-tidal residual: when de-tiding hourly data, the surge component was found to reach 54 cm above Mean Sea Level (MSL) at Gandía, 47 cm at Valencia, 43 cm at Sagunto, 35 cm at Tarragona and 15 cm at Barcelona. Surge values between 12 and 17 cm above MSL were recorded in the Alboran Sea (Almería, Carboneras, Málaga, and Melilla stations) and <10 cm above MSL in the Balearic Islands (Ibiza, Palma, Alcudia, Mahón, and Formentera). Hourly total sea level beat the historical record only at Gandía (64 cm above TGD), well above the second highest value (59 cm) recorded in 2010 (time series 2007-2020), while in Valencia and Sagunto the maximum hourly value was the third one since 2007 (below 2014 and 2010 maximum values in both cases). Aligned with these results, Figure 2 shows that hourly sea levels exceeded the 99th percentile at Carboneras, Gandía, Valencia and Sagunto; while the 99.95th percentile was surpassed only at Gandía. Interestingly, in Barcelona the maximum reached only 55 cm above the TGD, very far from the historical records at this harbor (e.g., 81.2 cm in 2019 and 78.9 cm in 2001). The sea level was over the 99th percentile for at least two days in Gandía, Valencia and Sagunto.
Due to the microtidal regime of the WM, very small tidal ranges (5 - 30 cm) are expected. The amplitude of the main semidiurnal tide (M2) decreases significantly along the Spanish coast, from the Strait of Gibraltar (around 40 cm) to Alicante (zero amplitude, close to an amphidromic point), increasing slightly again to the North, until around 4.5 cm in Barcelona. Around Valencia and the Balearic Islands the amplitudes of the main diurnal tides (O1, K1) are similar or larger than the ones of M2 (mixed and diurnal tides) (Table 2). However, timing of tide and surge can still be important depending on the area.
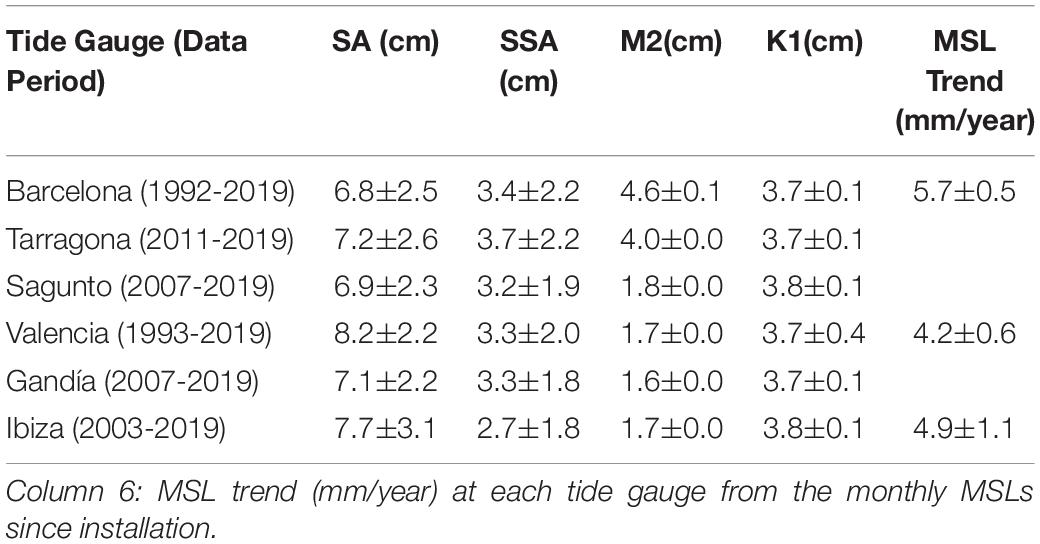
Table 2. Columns 2-5: amplitude of annual (SA), semiannual (SSA), main semidiurnal (M2), and diurnal (K1) harmonic constants, obtained from averaging the annual harmonic analysis for the history of each tide gauge.
Figures 2, 3 show the contribution of the tide to total sea levels at the different stations during Gloria. The storm hit the coast immediately after the last quarter of the moon (neap tides), making the tidal amplitude even smaller. The maximum value in Gandía (64 cm above TGD) was recorded on January 20, 8:00 GMT, when the forecasted tide was less than 5 cm above the TGD. Nevertheless, we still see some tidal contribution to total sea levels during the storm: a second peak of 58 cm was recorded in Gandía on January 21, 5:00 GMT, that could be related to the diurnal tidal oscillation at this site (Figure 3C). The tide contribution was larger in Tarragona, according to its larger tidal amplitude: the maximum value (65 cm above TGD) was recorded on January 21, 6:00 GMT, concomitant with a high tide that reached 31 cm (nearly 50% of the signal). Finally, in Barcelona, the diurnal tide nearly dominates the sea level variability during Gloria, as reflected by the three similar maxima (around 55 cm above TGD) recorded at around 6:00 GMT on 21, 22, and 23 of January, when the maximum tide reached 39, 41, and 42 cm above TGD, respectively.
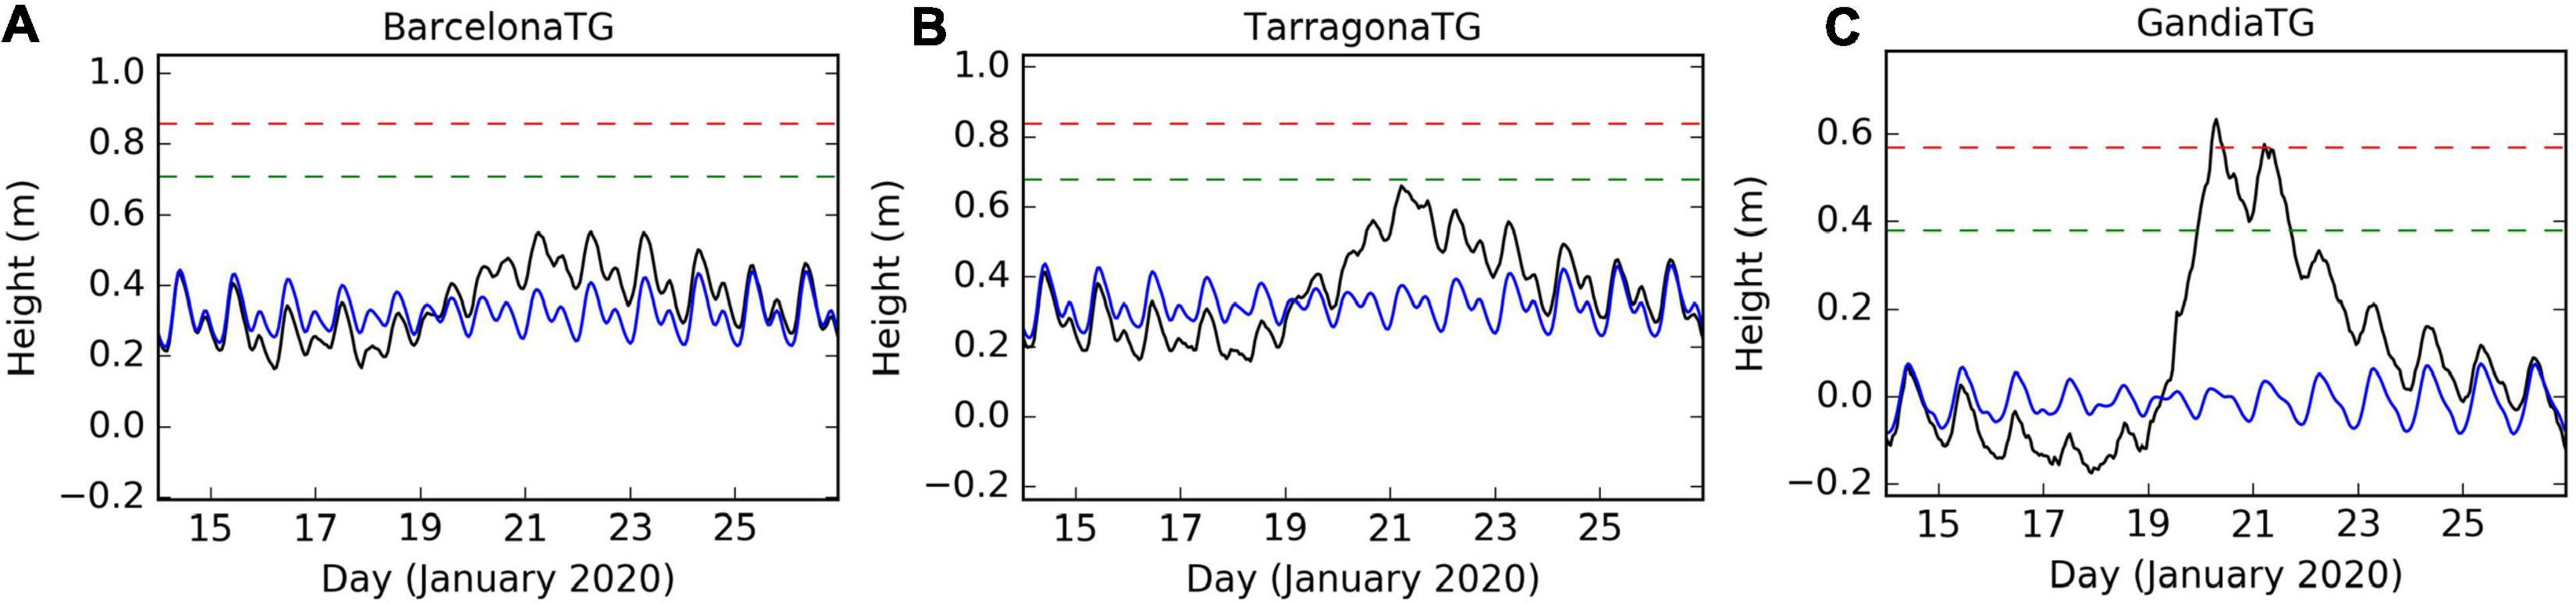
Figure 3. Hourly sea levels (black line) and tide (blue line) obtained for Barcelona (A), Tarragona (B), and Gandía (C) TGs during the storm Gloria. 99th (green dashed line) and 99.95th (red dashed line) percentiles included. Sea levels are referred to each TGD.
The data reflect the spatial variability of the tide and surge contributions. While the surge component was dominant at Gandía, Valencia, and Sagunto, the tide had a similar or larger contribution in the northern stations of Tarragona and Barcelona, with a smaller surge. The spatial variability of extreme sea levels during Gloria is confirmed by computing their return periods. Extreme analysis of historical hourly data applied to Barcelona and Valencia TGs (Peak Over Threshold method and fit to a Weibull distribution) revealed that the Valencia maximum value (68 cm above TGD) corresponds to the 26.9 return period if storm Gloria is not considered, and 21.8 years return period if this storm is included in the analysis. Conversely, in Barcelona, the maximum hourly value recorded during Gloria (55 cm above TGD) corresponds to a return period of just 1 year.
Seasonal, Interannual, and Long-Term Processes
The seasonal cycle, ultimately caused by the annual cycle of solar radiation, is mainly composed of annual (Sa) and semiannual (Ssa) cycles related to the meteorological forcing, heat content and circulation patterns. Table 2 shows Sa and Ssa amplitudes as derived from harmonic analysis for several TGs in Figure 1B. The annual signal clearly dominates the seasonal cycle in the WM (up to 8 cm amplitude), one of the areas with the largest seasonal cycle of the Spanish coast. Figure 4 shows the average, standard deviation, maximum and minimum of monthly MSLs during the whole historical record at Barcelona, Gandía, Valencia and Tarragona. The average represents the seasonal cycle which peaks between October and November and reaches its lowest values between February and March. This means that a storm surge event may lead to higher total sea levels during the months of October and November. However, there is a strong interannual variability of the cycle in this region, mainly related to the meteorological forcing, as can be deduced from the higher variability of the standard deviation and the maximum and minimum MSLs during the winter months.
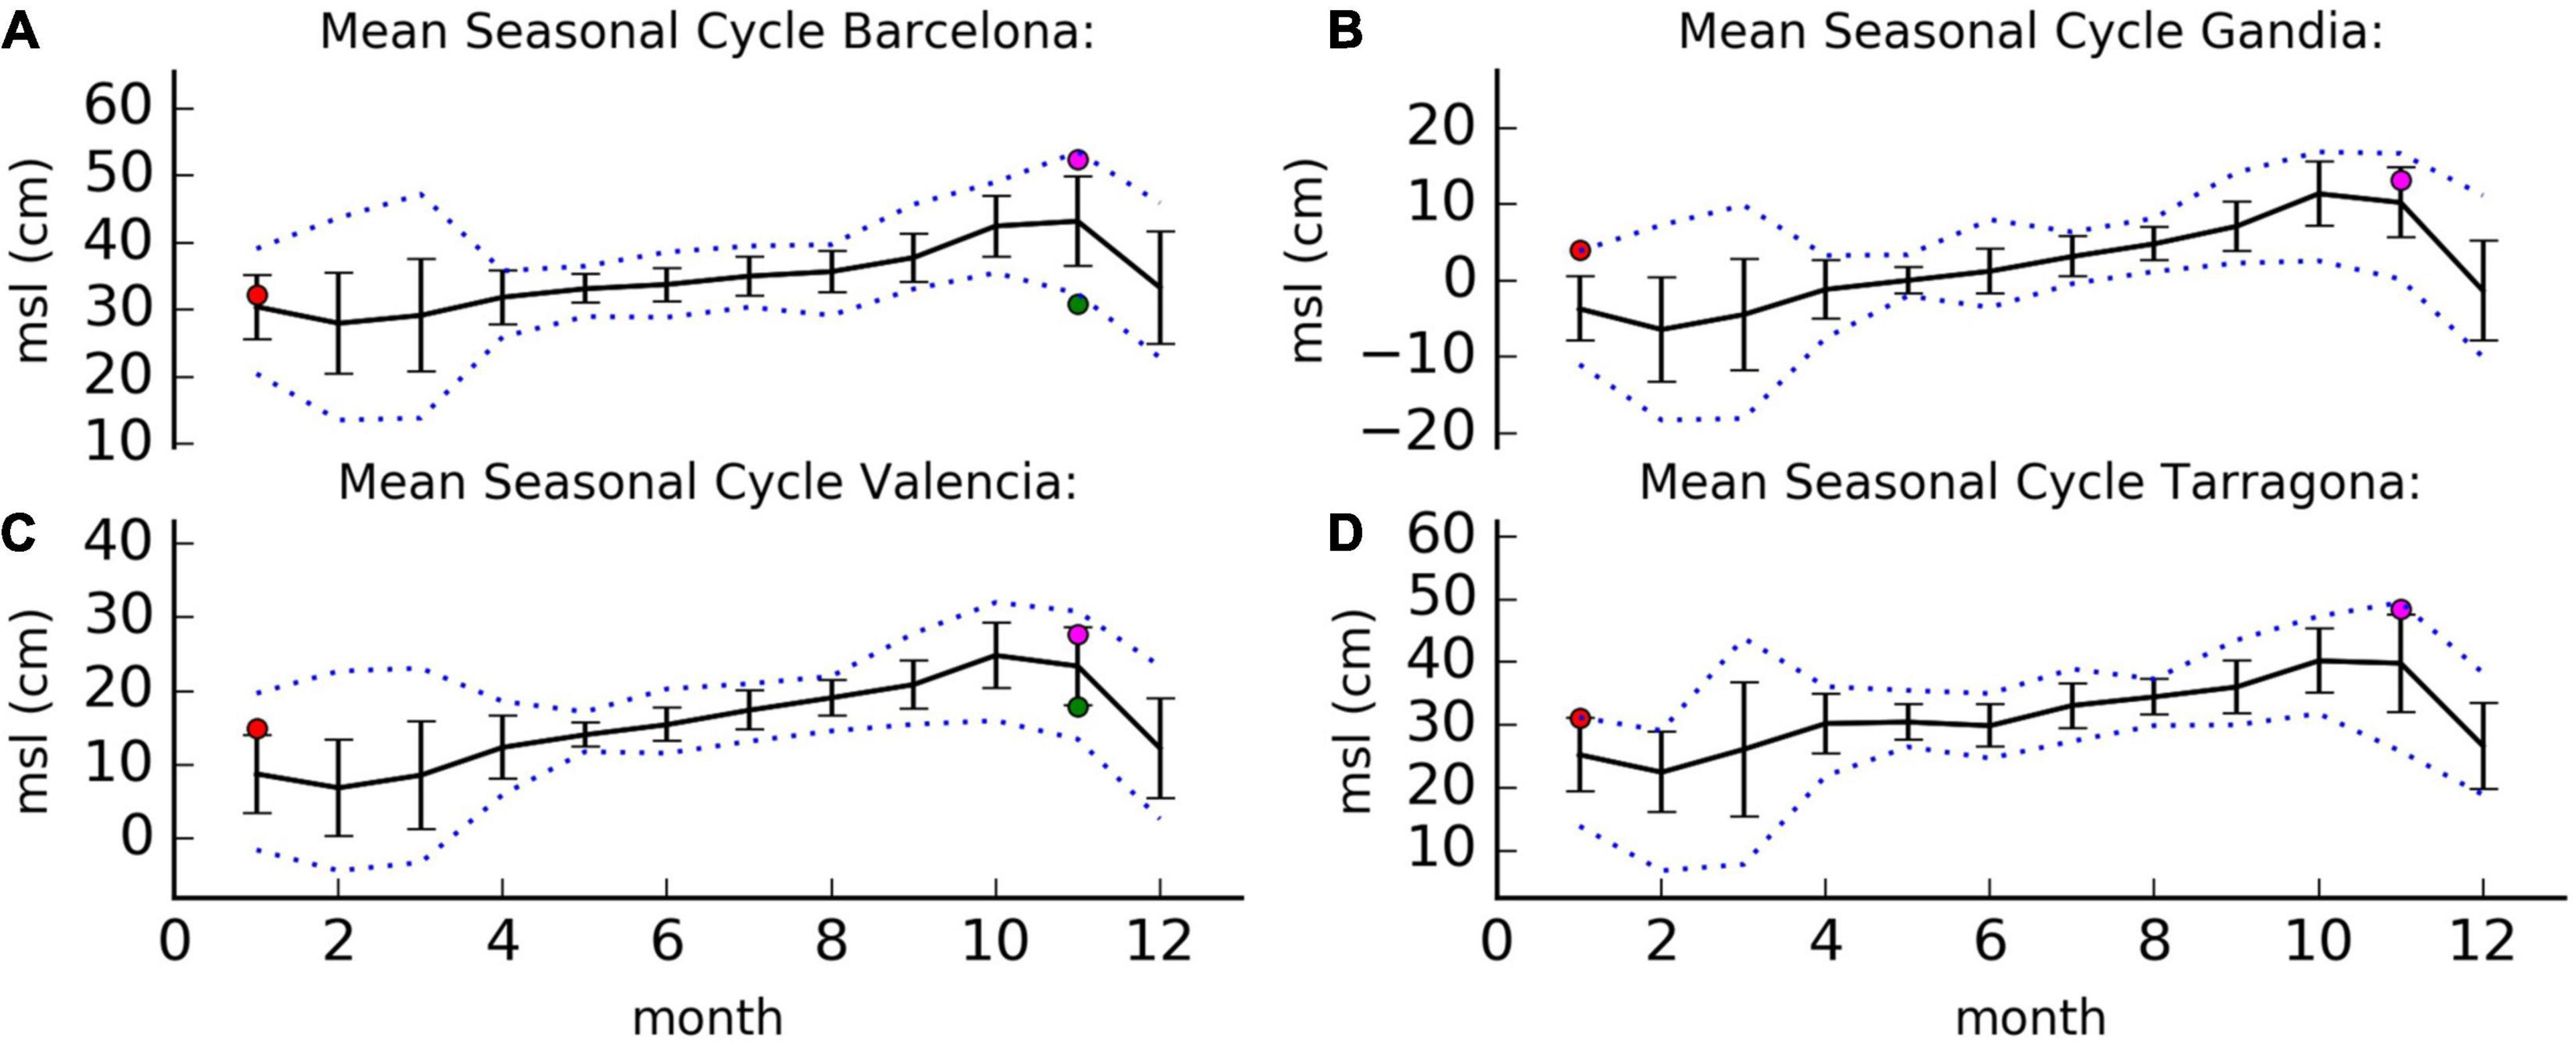
Figure 4. Mean seasonal cycle obtained by averaging monthly MSLs during the whole historical record at Barcelona (A), Gandía (B), Valencia (C), and Tarragona (D). Black line: averaged monthly means and standard deviation; blue dashed line: maximum and minimum monthly value. Red dot: monthly mean for January 2020 (Gloria). Magenta dot: monthly mean for November 2019. Green dot: monthly mean for November 2001.
January 2020 MSL is represented by a red dot in Figure 4. This is the maximum January MSL at Gandía and Tarragona, with records starting in 2007 and 2011 respectively, but not at Barcelona and Valencia, with data since 1993. Other two months potentially affected by known extreme events have been added to this figure: November 2019 (magenta dot) and November 2001 (green dot, only available at Barcelona and Valencia). November 2019 MSL is not only the maximum November MSL for Barcelona and Tarragona, but also their maximum MSL in the record, and higher than January 2020 at the four stations. Due to seasonal changes, January MSL is lower than the November one. However, due to long term mean sea level rise, the January 2020 MSL (red dot in Figure 4) is higher than the November 2001 MSL (green dot in Figure 4). Hence, an extreme storm surge happening in January is nowadays more dangerous than if it would have happened in the past.
According to the relative MSL trends obtained from Barcelona, Valencia and Ibiza TGs (Table 2), the overall relative SLR (RSLR) in 27 years may have reached up to 15 cm at some coastal locations of the Spanish Mediterranean coast. Over this higher MSL, all relevant sea level oscillations discussed here, from higher frequencies to seasonal variations, will take place. The same surge magnitude would generate total extreme sea levels up to 15 cm higher today than in 1993. This value is also very close to the range of variation of the seasonal cycle. If this surge occurs during the lowest part of the cycle (around February), the impact of the long-term RSLR will be less important and partially compensated. On the contrary: if it happens around November, the final impact will be aggravated.
The temporal evolution of monthly MSLs for Valencia and Barcelona, the longest records of the REDMAR network, is shown in Figures 5A,C. The intra-annual and interannual variability of the seasonal cycle is evident here. Common patterns are found in the two stations, due to the large spatial coherence of MSLs: e.g., lowest MSL on February 1997, 2000, and 2012, and highest MSL on November 2010, 2014, 2018, and 2019. Positive relative sea level trends are observed for the two stations, which differ by 1.5 mm/year. The temporal evolution of the 99.95th annual percentiles is displayed in Figures 5B,D for the same stations: similar positive trends are observed with peak values in 2010 and 2015 and lowest values in 2005 and 2017. Interestingly not all the individual events mentioned in this section correspond to these peak values that reflect the month averaged conditions. Despite the magnitude of the coastal impacts, it is evident that the storm Gloria did not occur in the “worst” month of the year in terms of MSL, and that it did not contribute to a high 99.95th percentile in 2020. In this particular case, long term RSLR would have played a more important role on the coastal damage caused by waves than the phase of the seasonal cycle. These findings also reinforce the convenience of analyzing individual extreme events that may not be reflected in the highest percentiles time series.
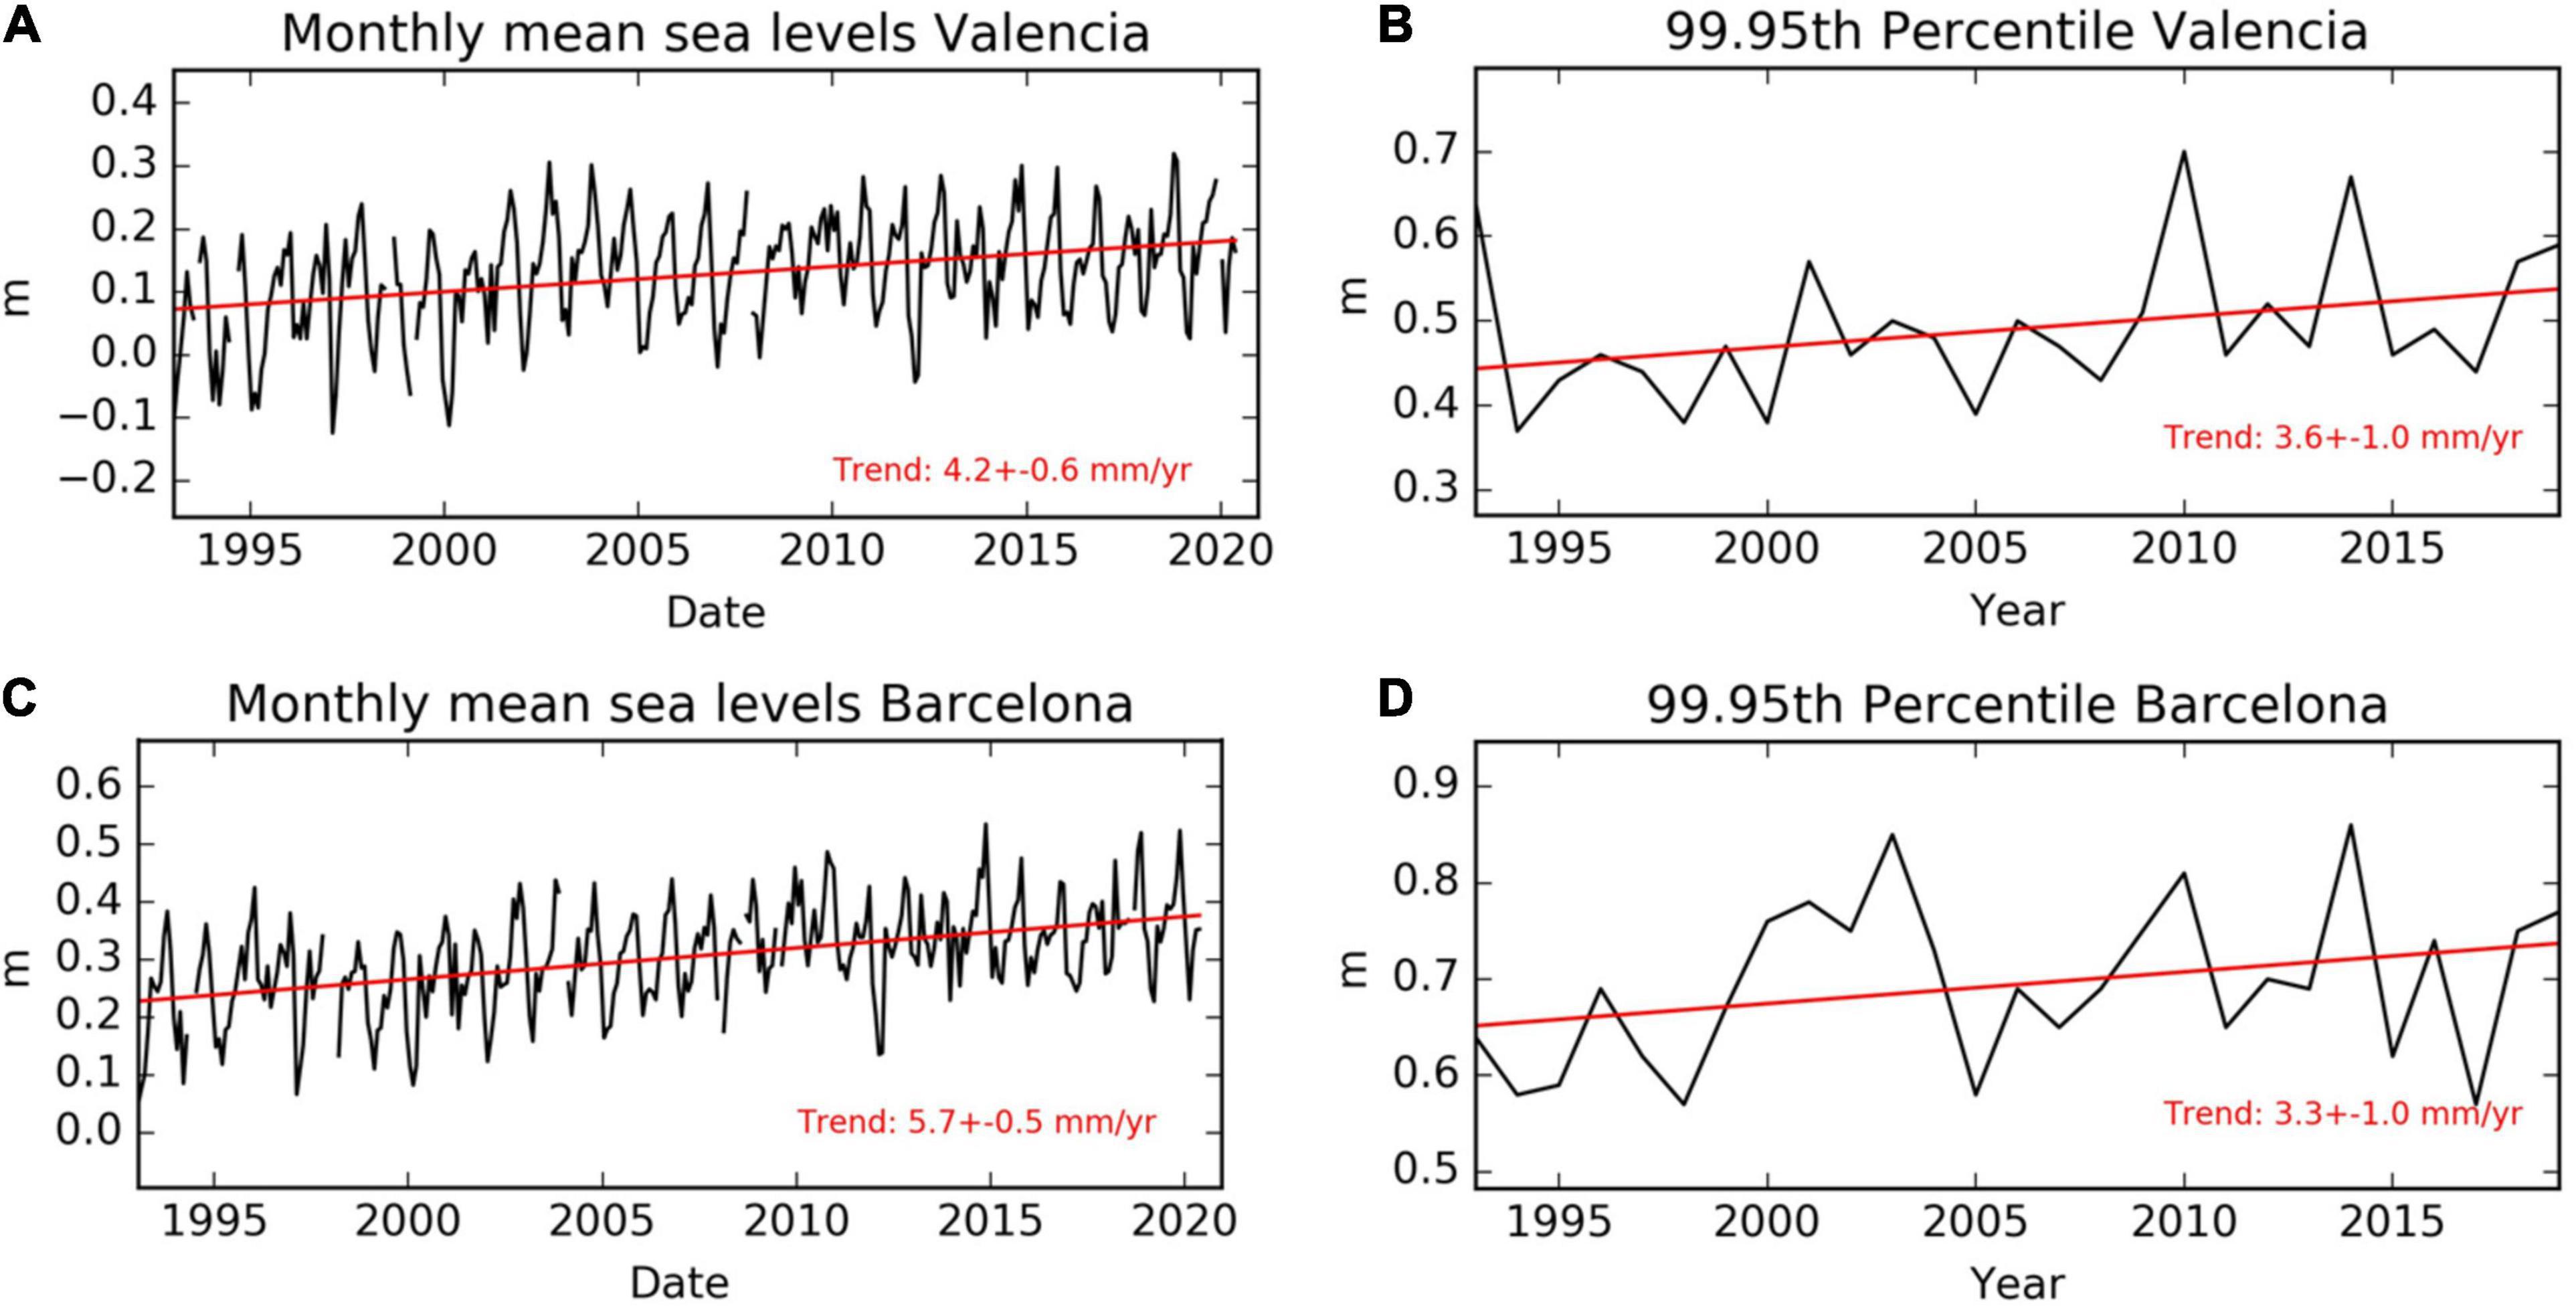
Figure 5. Long term evolution of monthly MSLs and 99.95th annual percentiles at Valencia (A,B) and Barcelona (C,D). Sea levels are referred to TGD. In red: linear regression fit and trend in mm/year.
High Frequency Processes
One advantage of the TGs used in this study is that they measure waves (<30 s) and high frequency sea level oscillations (HFSLO’s: 30 s - 1 h). Both can contribute significantly to flooding events and coastal damage. In this section we will describe these two contributions at the stations.
The waves recorded at the TGs represent very local wave conditions that cannot be extrapolated to other points but reflect very well the waves’ penetration into the ports. During Gloria, local significant wave height Hm0 reached 1.74 m at Tarragona, 1.36 m at Sagunto, 2.11 m at Valencia (beating the historical record), and 1.03 m at Gandía. Peak periods Tp were very long for the area, reaching 12.68 s at Tarragona and 12.89 s at Valencia. Note that these local waves will depend strongly on the tide gauge location inside the harbor. Tarragona, Sagunto and Valencia are the ones most exposed to the open ocean wave conditions, particularly extreme during this storm (De Alfonso et al., 2021).
Additionally, once the waves are filtered out, it is also evident that during this storm several TGs displayed HFSLOs, which added up to 50 cm variability on minute timescales to hourly sea levels (Figure 2, top panels at each station). The 1-min high-pass filtered data in Figure 2 (bottom panels) show that these HFSLOs were larger at Gandía, Valencia and Sagunto, precisely those stations with larger and even record-breaking total sea level increase, and where PdE oscillations alert system issued red alerts. To a lesser extent, the HFSLOs were also present at Tarragona and at the Balearic Islands (Ibiza and Formentera), while their magnitude was very small at the Southern part of the WM (Alboran Sea). Based on 1-min sampling data, total sea level surpassed significantly the 99.95th percentile of hourly data at Gandía (at the maximum of the oscillations during two days), Valencia and Sagunto. In Tarragona they overcame the 99th percentile that had not been reached by the maximum hourly value. Therefore, the potential contribution of these HFSLOs to coastal erosion and flooding cannot be ignored and underpins the importance of using a high sampling rate for a complete understanding and characterization of extreme sea level events and inundation processes.
This is consistent with the results of NivMarHF tool (see Section “Coastal Sea Level Observations”) during Gloria. Most REDMAR TGs in the WM coast recorded HFSLOs that were clearly over the 98th percentile in terms of oscillation amplitude, and that were automatically detected and flagged as events. Maximum HFSLO amplitude (Hmax: maximum oscillation amplitude in 1 h) reached record values since installation of the new radar sensors in Valencia (90 cm), Sagunto (57 cm), and Ibiza (60 cm). Tarragona and Gandía recorded their 5th maximum Hmax in its whole time series. These values are affected by any oscillation or seiche with periods within 30 s - 1 h and could therefore reflect response to different forcing mechanisms.
The four-band spectrum generated by NivMarHF provides additional clues on the origin of the HFSLOs. Figure 6A shows an example for Tarragona TG, where the 30 s - 5 min band (infragravity band) is clearly dominant throughout Gloria. Figure 6B shows the spectrogram signal excluding wind waves (<30 s), where the energy increase at the infragravity time window is clear during the storm. The same is observed in all the stations during Gloria. It is important to note that, in all cases, the energy evolution of the 30 s - 5 min band is highly correlated in time with the height of the waves measured by the tide gauges, becoming practically zero when the waves heights decrease (not shown).
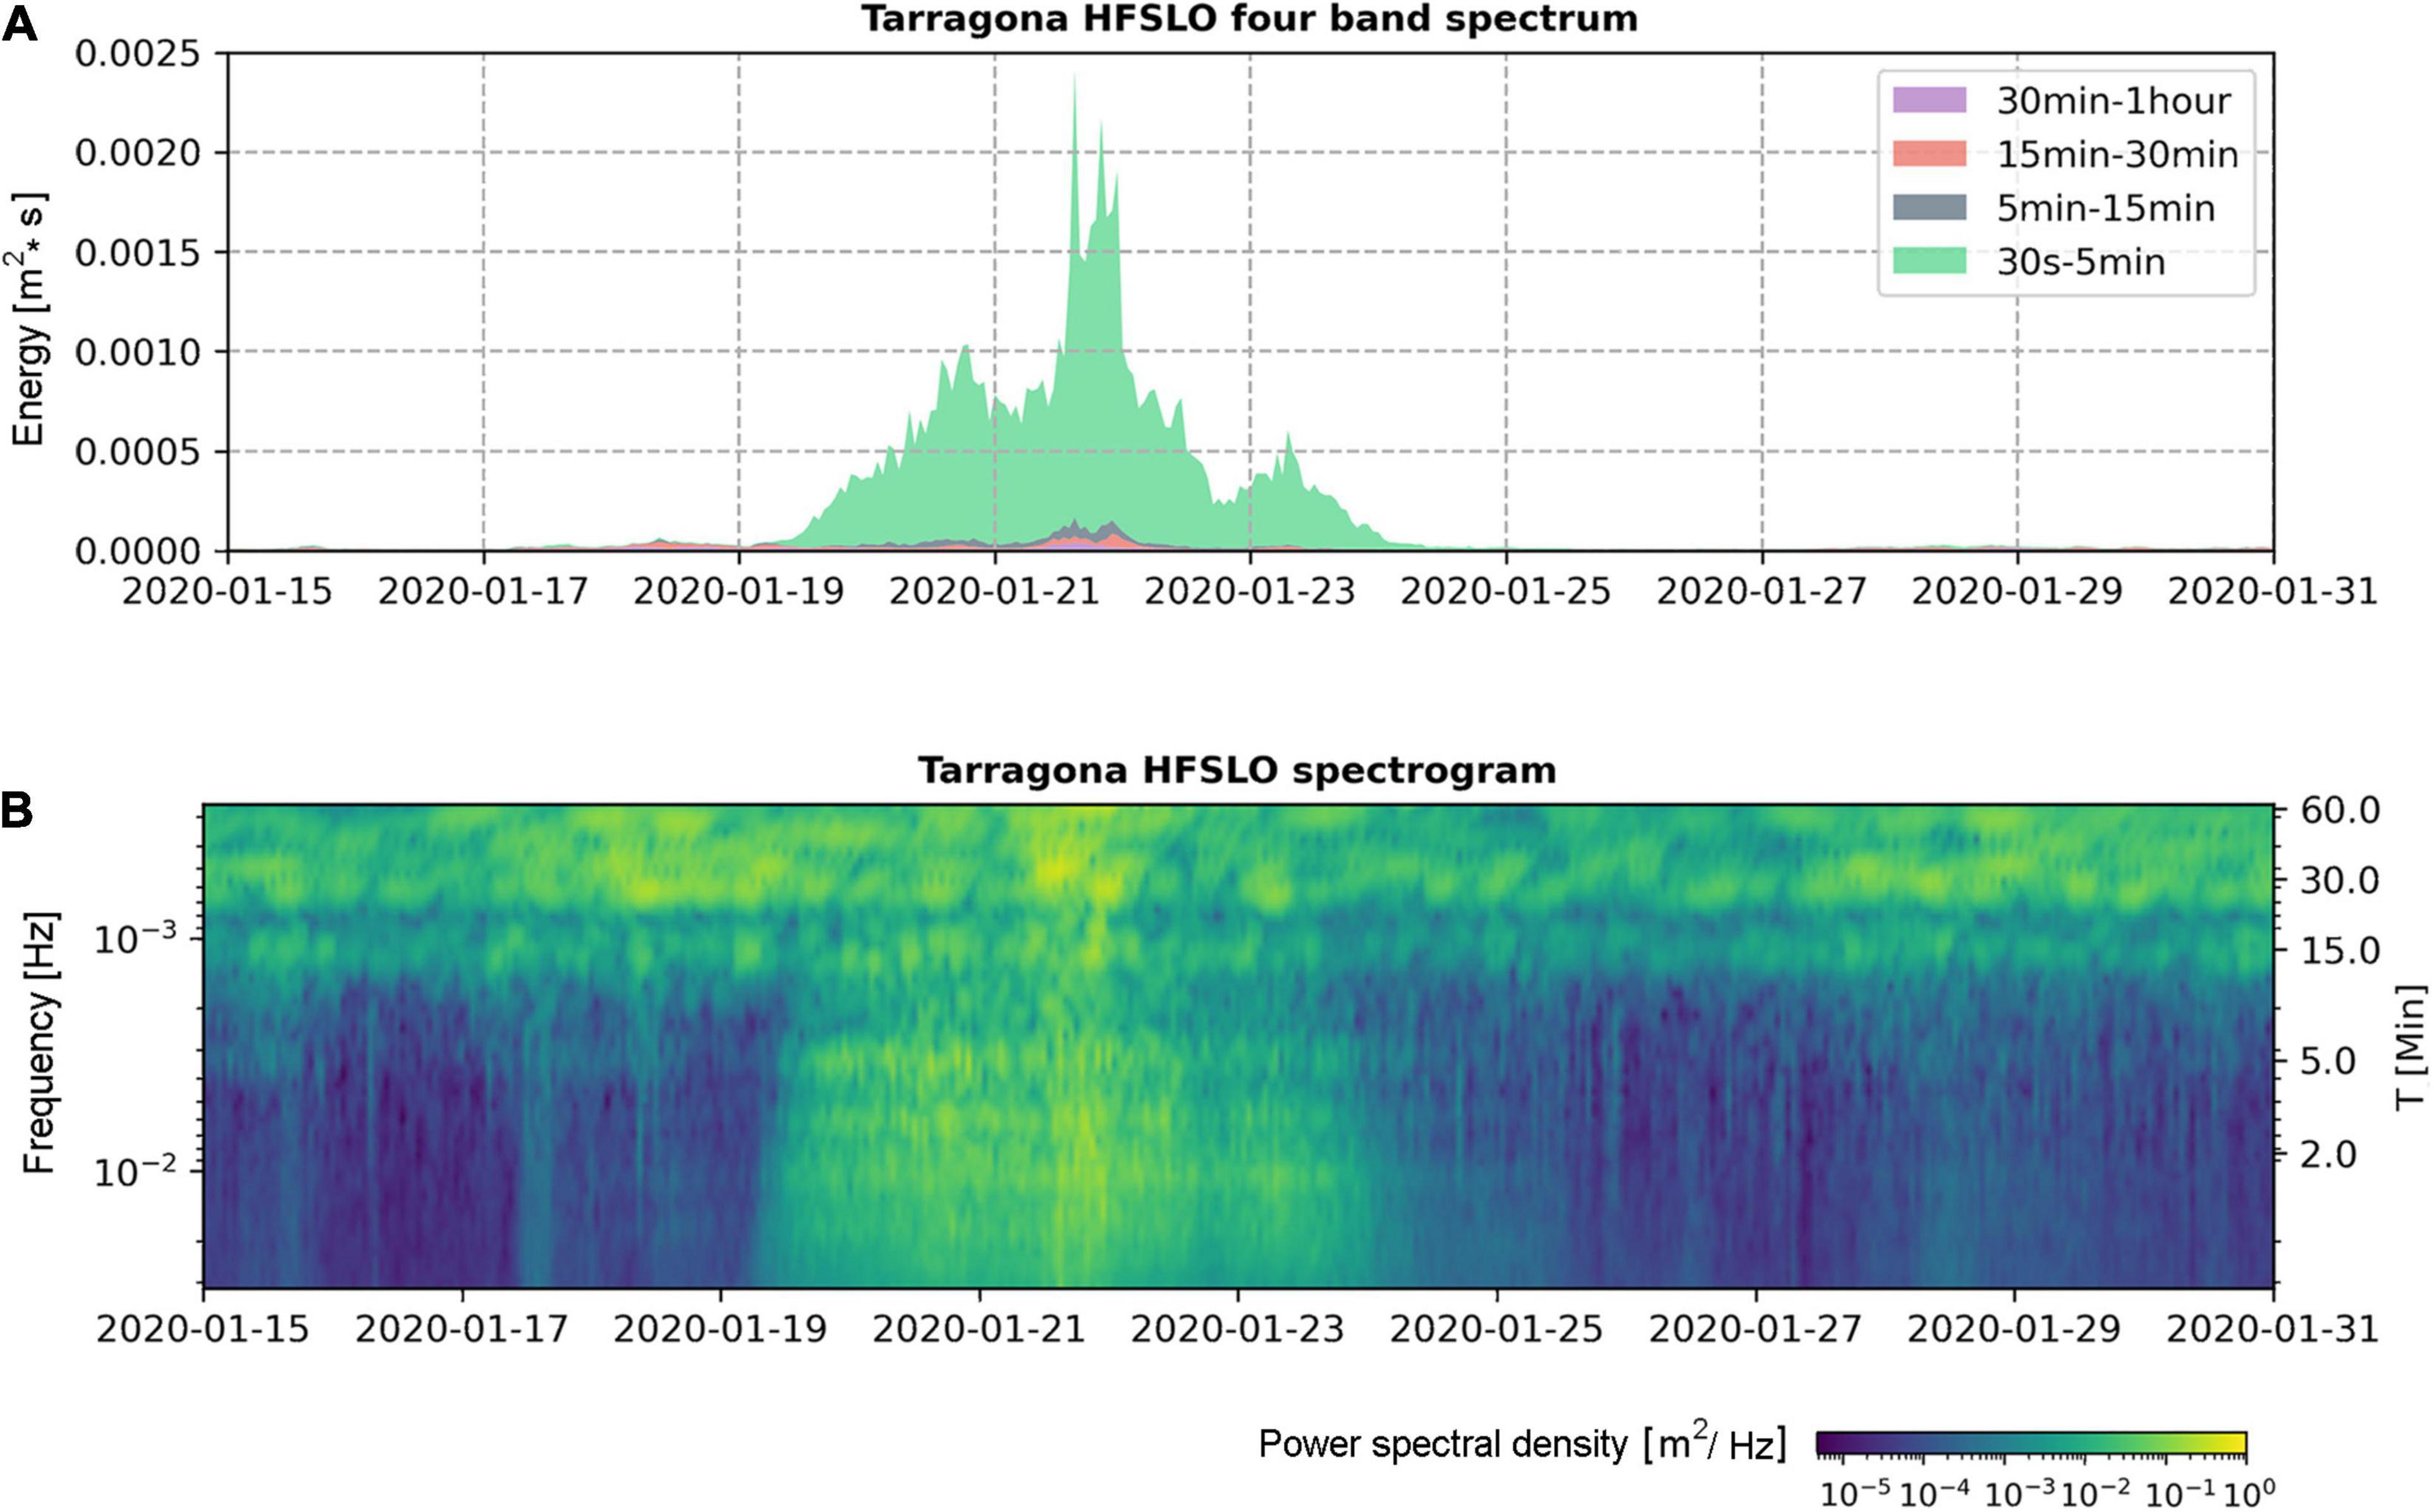
Figure 6. HFSLO four band spectrum (A) and spectrogram (B) for Tarragona tide gauge during the storm Gloria. Data from PdE NivMarHF tool.
In support of this, record-breaking mean wave periods (Tm02) over 9 s were recorded by PdE buoys near Tarragona, Valencia, and Cape Begur (De Alfonso et al., 2021), with Tp reaching a maximum of 12 s and sustained values over 10 s for several days in Tarragona. These are record breaking high values for the WM, where the limited size of the basin does not facilitate wave propagation over long distances and swell development, leading to wave periods significantly lower than the ones in the Iberian Peninsula Atlantic coastline. Interestingly, Gloria shares this feature with the abovementioned storm of November 2001, with Tp’s up to 12-13 s. That event was milder in terms of wave height but generated larger storm surges and similar coastal damage (Gómez et al., 2002).
As stated in the introduction, meteotsunamis are frequent in this region, but they occur during the summer, under calm weather conditions, and generate oscillations of longer periods (>10 min) in the TGs used here.
Study of the detailed spectral response and its temporal evolution, as it changes throughout the event, is beyond the scope of this contribution. However, from individual hourly spectra also provided by NivMarHF (not shown), while the increase of energy affected the whole infragravity band, peak energy tended to be found around: 1.5 min and 4.5 min at Tarragona, 1.2 and 5.1 min at Valencia, 1.3 and 5.2 min at Sagunto, 4.5 min at Gandía, 1.8 and 7.1 min at Ibiza.
To explore in more detail the connection with swell, Figure 7 shows the infragravity band energy plotted against the wave mean periods Tm02, measured by the closest buoy at several stations. Gloria maximum values between 15 and 30 of January 2020 are identified with circle markers. This figure reveals a clear connection between larger wave periods at the buoys and stronger infragravity oscillations inside most of the ports, something well known at the Iberian Peninsula Atlantic coasts, but unadvertised before for the Mediterranean. Tarragona, Valencia and Gandía are the stations that reach the highest values of energy in the 30 s - 5 min band, showing historical record values during Gloria at Valencia, Sagunto and Ibiza. The infragravity band energy response is significantly lower in Barcelona.
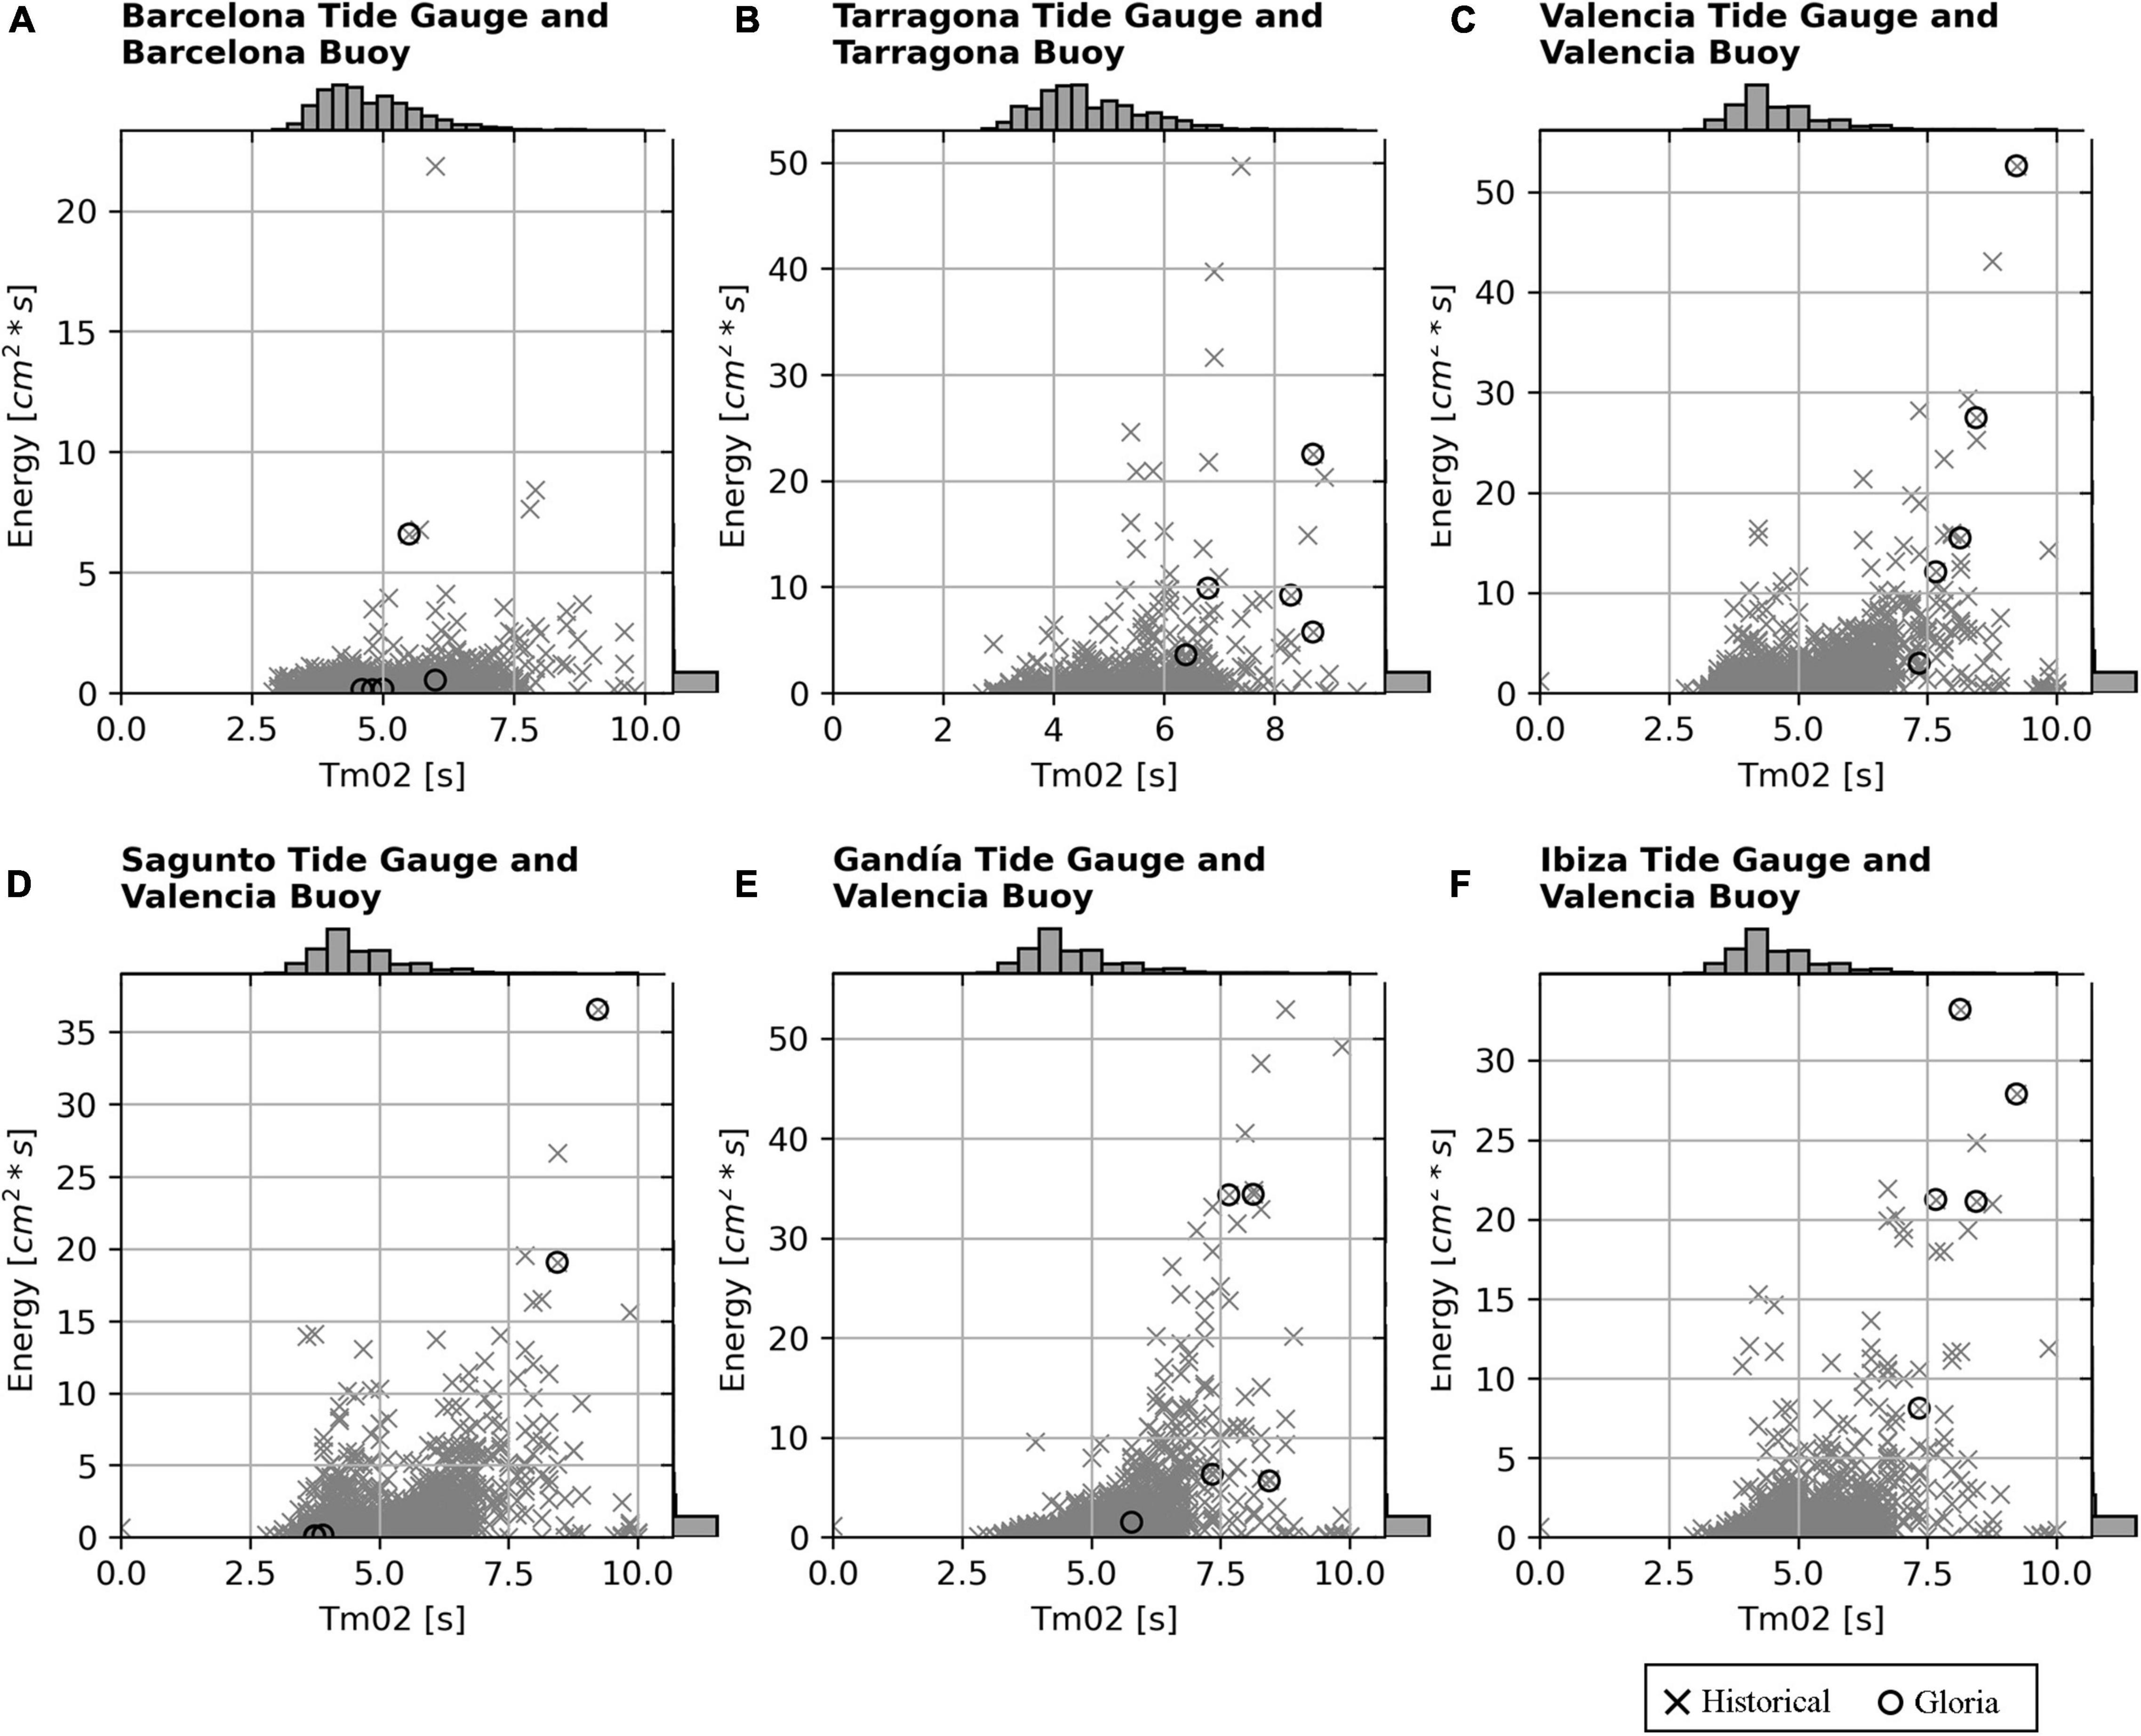
Figure 7. Infragravity band (30 s-5 min band) energy at tide gauges, vs Tm02 at the closest buoy, for the historical tide gauges record at Barcelona (A), Tarragona (B), Valencia (C), Sagunto (D), Gandía (E), and Ibiza (F). The historical maximum energy in this band was recorded in Valencia, Sagunto and Ibiza during Gloria.
In order to put in context the importance of the oscillations in this band, Figure 8 shows instead HFSLO Hmax plotted against the wave mean periods Tm02 measured by the closest buoy. It can be seen that Hmax over 50 cm are rare and practically never reached in Barcelona (except an isolated point). Highest values, over 1 m, are occasionally found at Tarragona and Valencia, followed by Gandía (up to 80 cm), Sagunto and Ibiza (around 60 cm). During Gloria (black circles in the figures) the same stations that beat the infragravity band energy record, also beat their record in HFLSO Hmax (Valencia, Sagunto, and Ibiza). High values of Hmax are present under moderate wave mean periods in Barcelona, that should be further explored. But in most cases, despite HFSLO Hmax being computed for the whole 30 s - 1 h time window, Figure 8 reveals that long period waves, and therefore infragravity waves generation, seems to be a dominant contribution to the largest amplitude oscillations recorded at these ports.
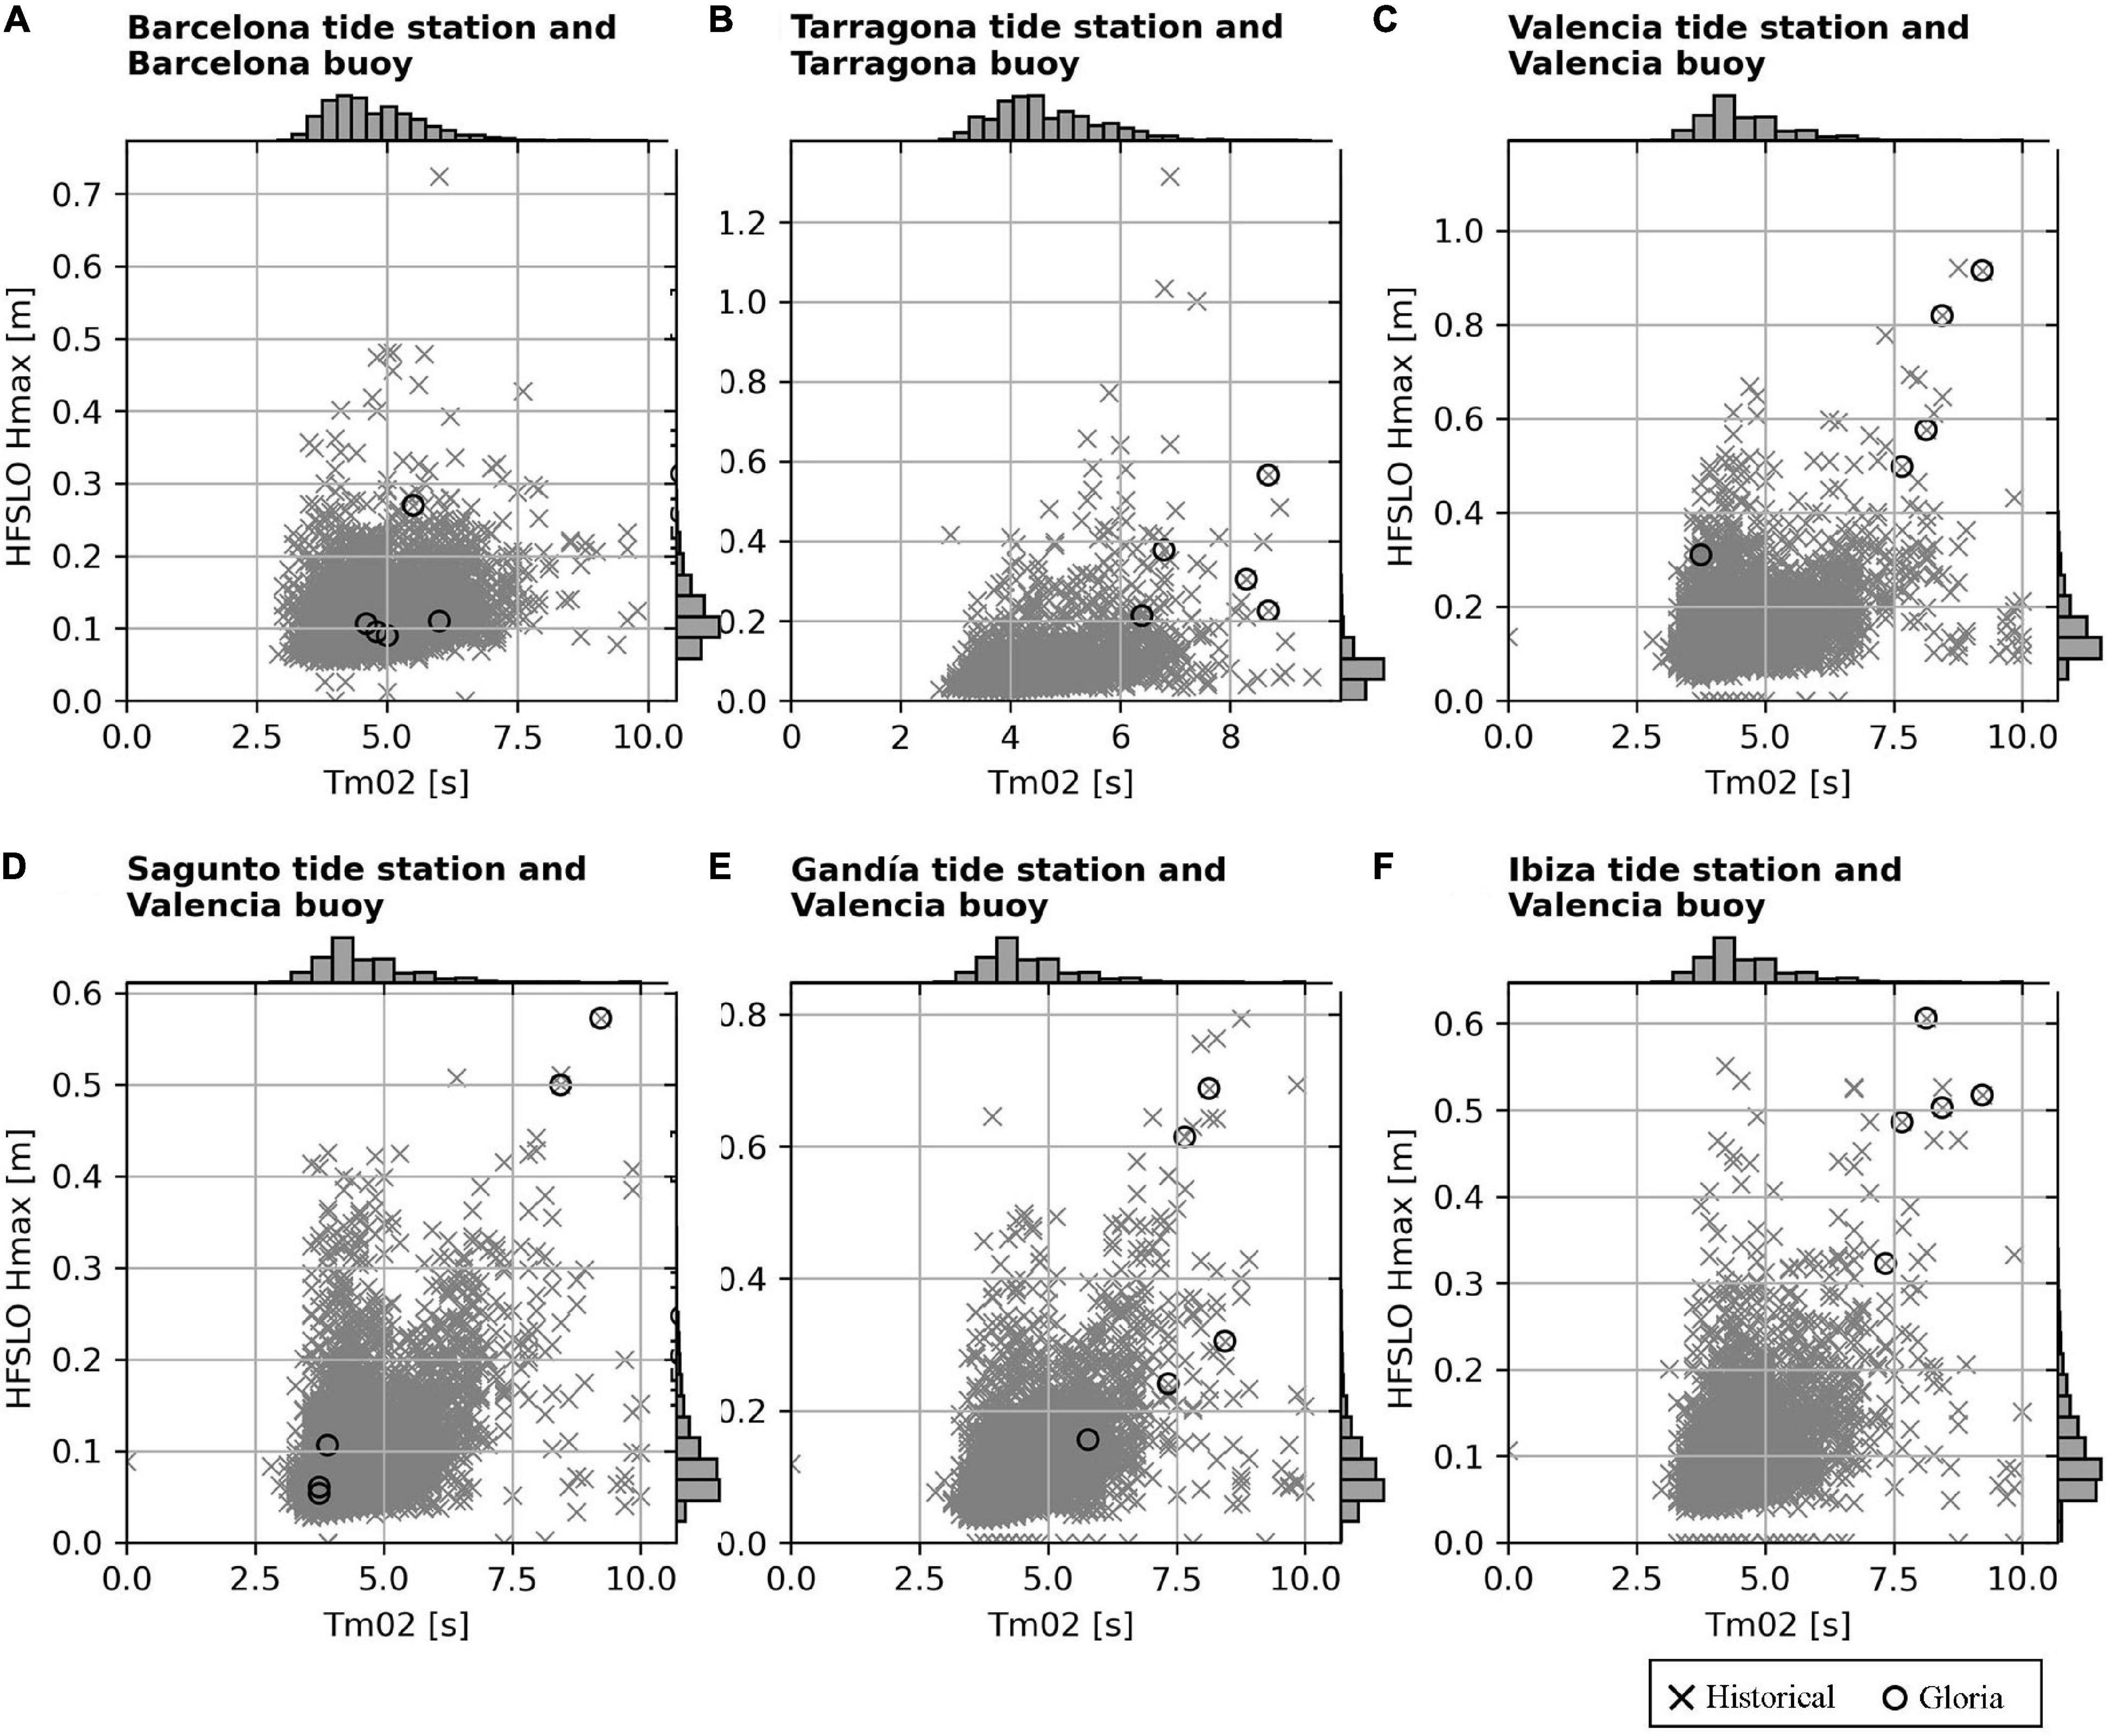
Figure 8. HFSLO Hmax (30 s-1 h) at tide gauges, vs Tm02 at the closest buoy, for the historical tide gauges record at Barcelona (A), Tarragona (B), Valencia (C), Sagunto (D), Gandía (E), and Ibiza (F). Black circles correspond to storm Gloria. For some of the stations (Valencia, Sagunto and Ibiza), the maximum value of Hmax was recorded during Gloria. At other stations (Tarragona) the maximum value does not correspond to this storm.
Despite the need of further analysis of these HFSLO’s and products from the new NivMarHF tool, the results during Gloria point to the generation of infragravity waves associated to the long wave periods as the main candidate for the observed oscillations in minutes timescales at several TGs.
Assessment of the Operational Models on Forecasting Sea Levels
This section addresses the performance of CMEMS and PORTUS operational models on forecasting sea levels during storm Gloria, and a comparative study with their performance during the previous storm Dora. For the sake of clarity, only the surge component is presented, although ENSURF forecasts total sea level, as described in “Multi-Model Sea Level Forecast at Spanish Harbors.” It is important to stress that these results show the individual skills after ENSURF pre-processing steps including the nudging technique, which simultaneously solves the bias problem due to model sea level output with undefined datum. Being all the models treated in the same way, the Nivmar solution would represent the mean sea level pressure (MSLP) and wind-driven storm surge contribution.
Hence, each ensemble member provides a storm-surge signal, mainly differing in the spatial domain of each model and their intrinsic physics (see Figure 1 and Table 1). None of these models addresses high frequency processes (see Section “High Frequency Processes”), neither fully wave-coupling. Also, even though the spatio-temporal resolutions of the atmospheric forcings differ, all of them use the same model (ECMWF-IFS). This last issue eases the intercomparison among different sea-level forecasts because the atmospheric surface fields (winds and MSLP) share similarities.
Figures 9, 10 show how all models correctly reproduce the basic features of the storm in terms of sea level residuals. The best statistical behavior corresponds, depending on the station, to ENSURF or MedFS, being generally Nivmar the less accurate system for this storm.
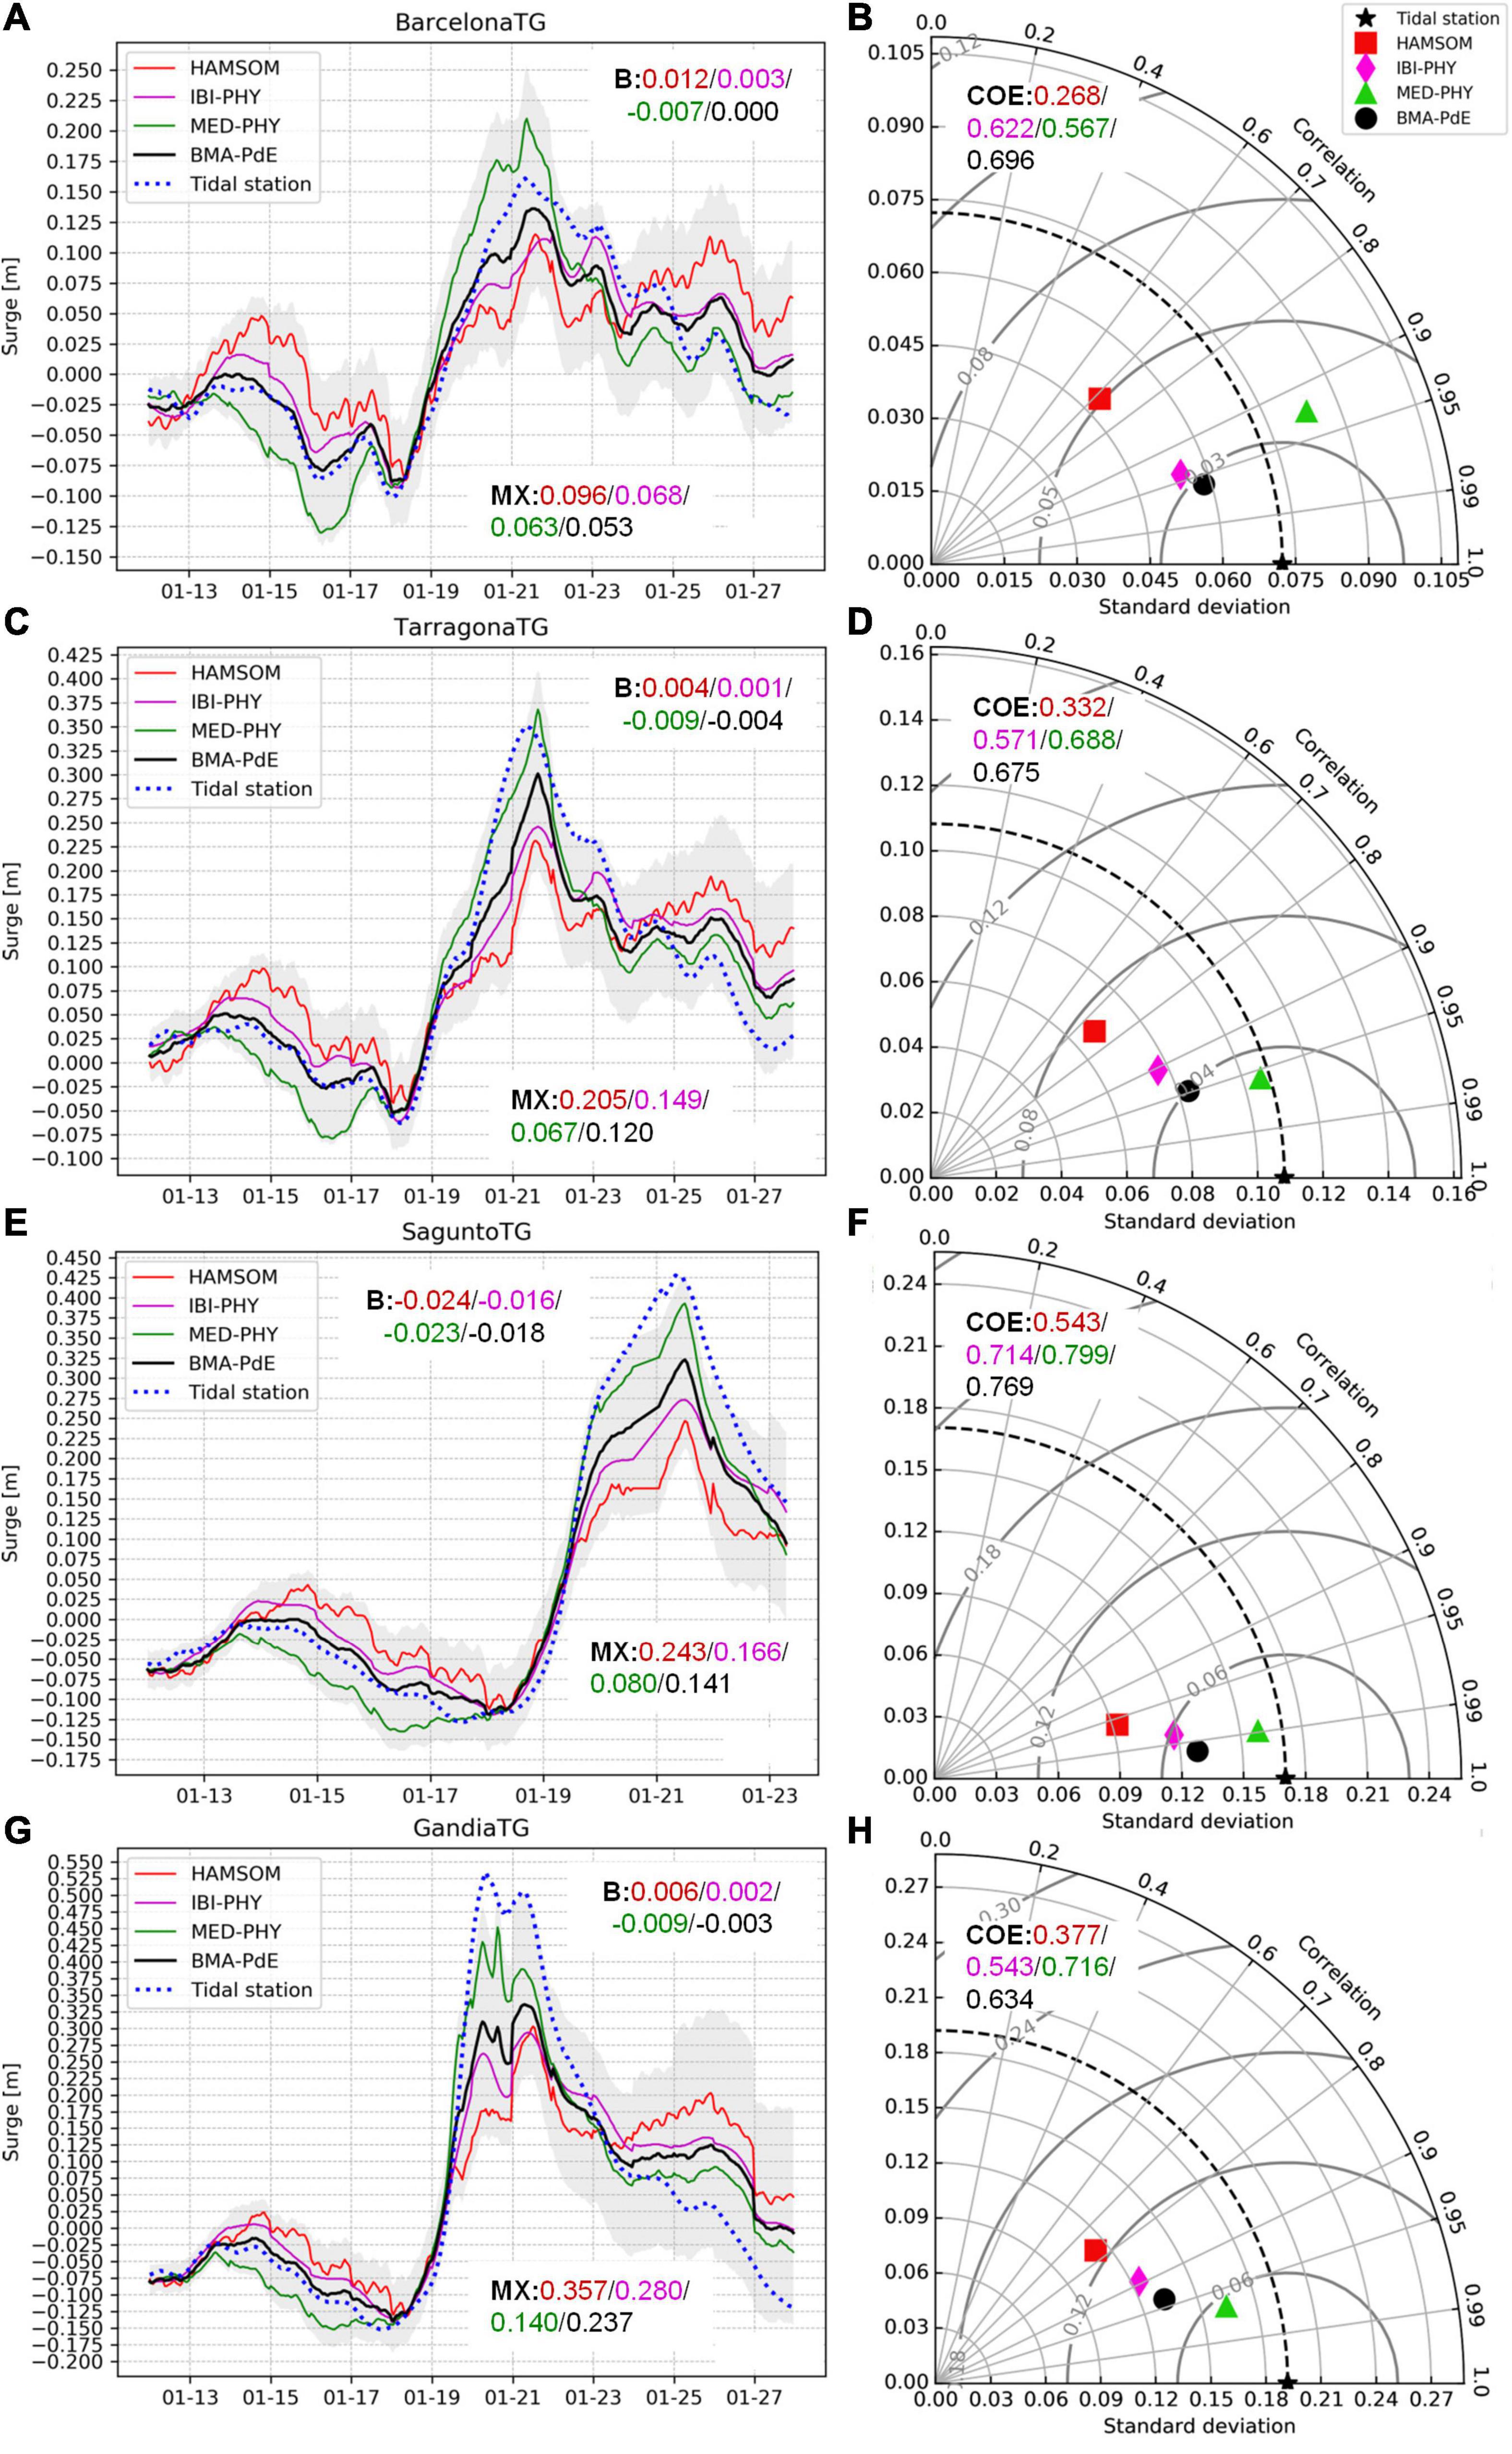
Figure 9. Results of the ENSURF system at several TGs during the storm Gloria: Nivmar (red), IBI-MFS (magenta), MedFS (green), BMA-PdE (black), and observations (blue). Left: surge time series at Barcelona (A), Tarragona (C), Sagunto (E), and Gandía (G). B is the mean bias for each model, in meters (same chromatic index). MX is the maximum error, in meters. The gray areas enclose the 5-95th percentiles of the ENSURF system. Right panels: Taylor diagrams at Barcelona (B), Tarragona (D), Sagunto (F), and Gandía (H). Legend: Nivmar (red square), IBI-MFS (magenta rhombi), MedFS (green triangle), BMA (black dot). COE is the Coefficient of Efficiency for each model (dimensional).
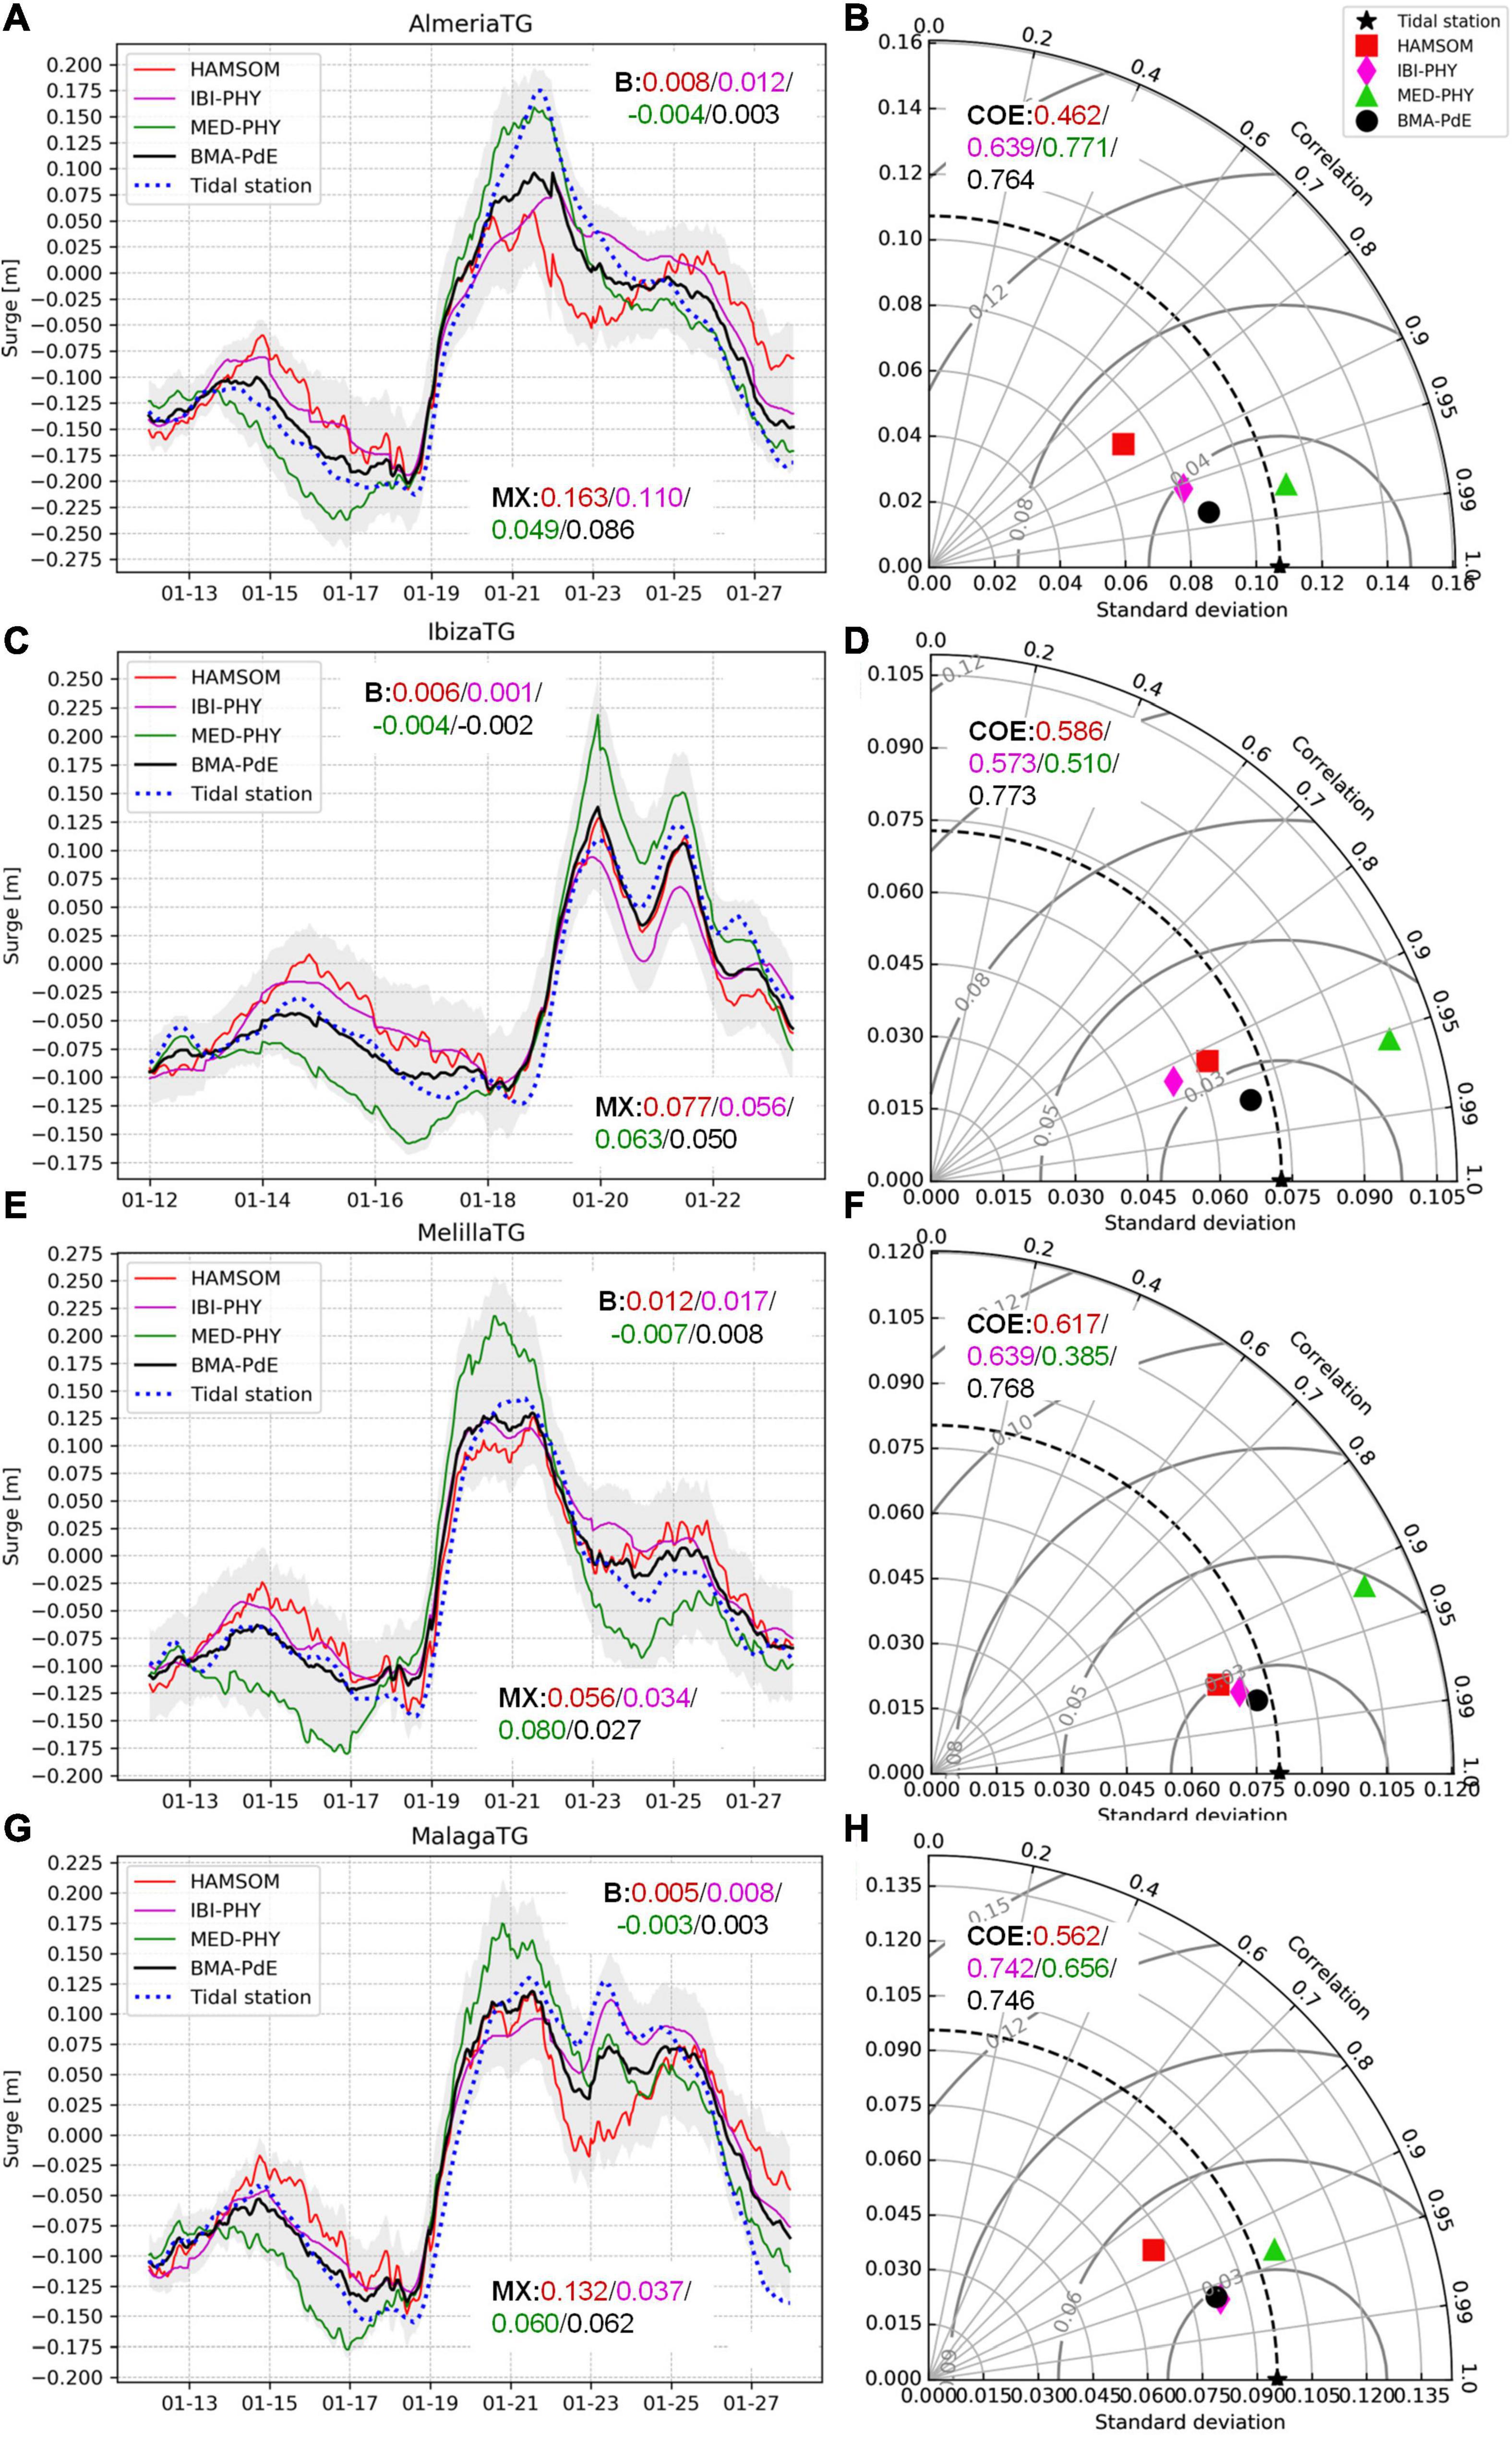
Figure 10. Results of the ENSURF system at several TGs during the storm Gloria: Nivmar (red), IBI-MFS (magenta), MedFS (green), BMA-PdE (black) and observations (blue). Left panels: surge time series at Almería (A), Ibiza (C), Melilla (E), and Málaga (G). B is the mean bias for each model, in meters (same chromatic index). MX is the maximum error, in meters. The gray areas enclose the 5-95th percentiles of the ENSURF system. Right panels: Taylor diagrams at Almería (B), Ibiza (D), Melilla (F), and Málaga (H). Legend: Nivmar (red square), IBI-MFS (magenta rhombi), MedFS (green triangle), BMA (black dot). COE is the Coefficient of Efficiency for each model (dimensional).
It is important to note that analysis of other storms can show different behavior of the forecasting systems. For other historical events, Nivmar has been shown as the most accurate system. This is reflected in the behavior of the BMA system, which does not rely on a single model and is the result of the previous statistical training, demonstrating that all considered models are of interest for studying the surges in the region. This fact will be highlighted with the description of the behavior of the systems at the storm Dora.
ENSURF produced accurate results during the Gloria event, although underestimating the main peak in the most affected areas (specially Sagunto, Gandía, and Almería). In regions where the peak was not so extreme, like Melilla or Málaga, ENSURF outperforms the rest of the models. For example, at Barcelona the BMA shows better statistical values than both IBI-MFS and MedFS (COE = 0.696 vs. 0.622 and 0.567, respectively). It is also important to remark that the surge lies, for all stations, inside the confidence band predicted by ENSURF. The reliability of the uncertainty estimation demonstrates the importance and benefit of the multi-model ensemble method.
For all the stations, the MedFS is producing the largest surge of all the models. At points with a very large surge, like Almería, Gandía and Sagunto, this produces the more accurate reproduction of the peak of the storm. At Gandía, where the highest surge was recorded, around 54 cm, the underestimation is 14 cm (Figures 9G,H). Nevertheless, in other points with lower values on the peak, like Ibiza, the MedFS forecast severely overshoots the measurements.
IBI-MFS is, for all stations, producing worse statistical results for Gloria than MedFS and ENSURF. At the peak of the storm, the IBI-MFS is producing a much smaller surge than MedFS. Similarly, Nivmar severely underestimated the main peak of the storm, and the analysis of the Taylor diagram shows that in general, it had a relatively poor performance during this particular event.
As mentioned before, the relative performance of the models depends on the event. To put Gloria model performance in context, another relevant storm, Dora (2nd December - 6th December 2019), is analyzed. This event featured a 1002 hPa cyclone at the SW Med (i.e., from Balearic Islands to the African coastline) that was constrained by two severe anticyclones: (i) the Azores anticyclone (1030 hPa at its center) and (ii) a second one at Central-Eastern Europe, with a pressure center of 1032 hPa. Throughout Dora, waves were more moderate than at Gloria (Hs = 4.2 m at Tarragona buoy); but the surge was relatively high, at some tidal stations, even higher than at Gloria. Surges from 30 to 43 cm were measured at Catalonia and Valencia coasts. The storm surge was mainly driven by the surface atmospheric pressure gradients and the severe winds (around 15-17 m/s in the NW Med).
Performance of the different models and the BMA during Dora are displayed in Figures 11, 12. In general, the Taylor diagrams show that all three systems and the BMA have closer distances among themselves than during Gloria. Their standard deviation do not deviate excessively from the measurements, and the surge signals exhibit comparative growth/decay phases. Also, the diagrams show that the BMA performs systematically better than any individual model. Correlation ranges between 0.95 and 0.99, and the maximum error is found at Sagunto (7.7 cm, with a surge close to 41 cm). Note that Nivmar outperforms the other ensemble members in those stations close to the low-pressure system (Ibiza and Melilla). The bias is even lower than at the BMA (1.2 cm vs. 1.8 cm at Melilla; -0.2 cm vs. 0.4 cm at Ibiza), and similar COEs are obtained (0.808 vs. 0.867, 0.681 vs. 0.663; at both stations). This behavior is not casual and will be further addressed in the Discussion Section.
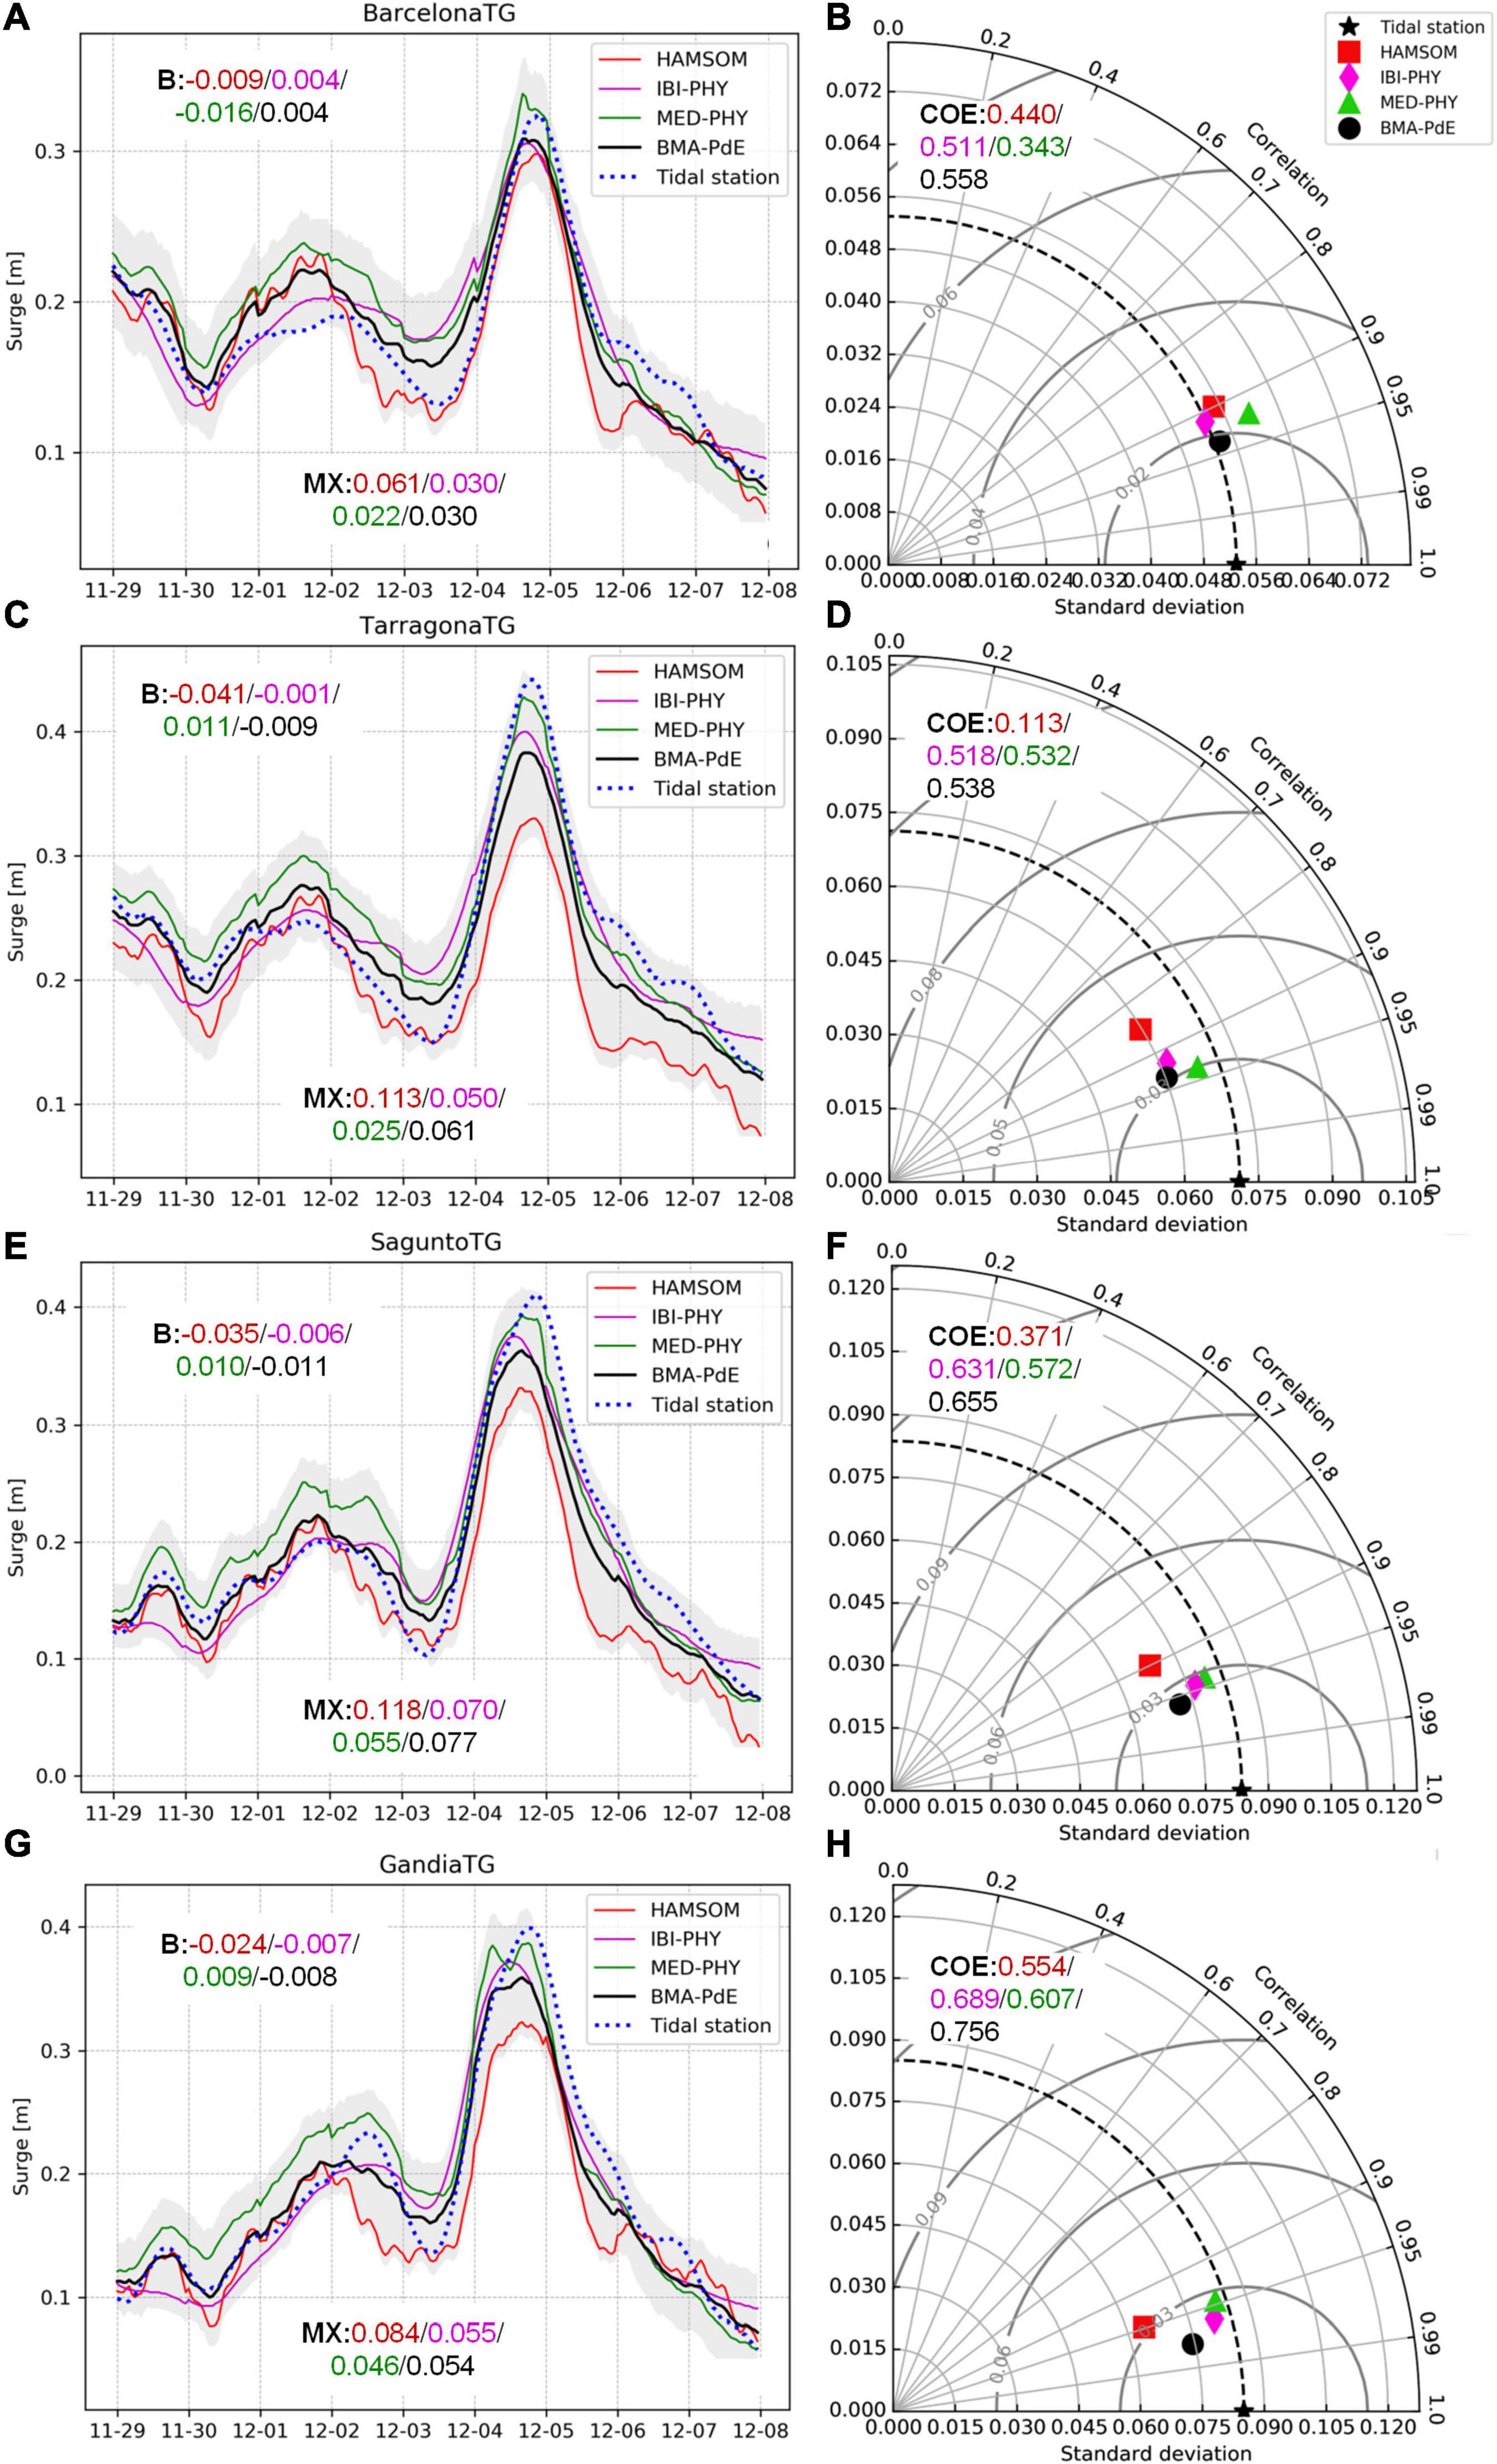
Figure 11. Results of the ENSURF system at several TGs during storm Dora: Nivmar (red), IBI-MFS (magenta), MedFS (green), BMA-PdE (black), and observations (blue). Left panels: surge time series at Barcelona (A), Tarragona (C), Sagunto (E), and Gandía (G). B is the mean bias for each model, in meters (same chromatic index). MX is the maximum error, in meters. The gray areas enclose the 5-95% percentiles of the ENSURF system. Right panels: Taylor diagrams at Barcelona (B), Tarragona (D), Sagunto (F), and Gandía (H). Legend: Nivmar (red square), IBI-MFS (magenta rhombi), MedFS (green triangle), BMA (black dot). COE is the Coefficient of Efficiency for each model (dimensional).
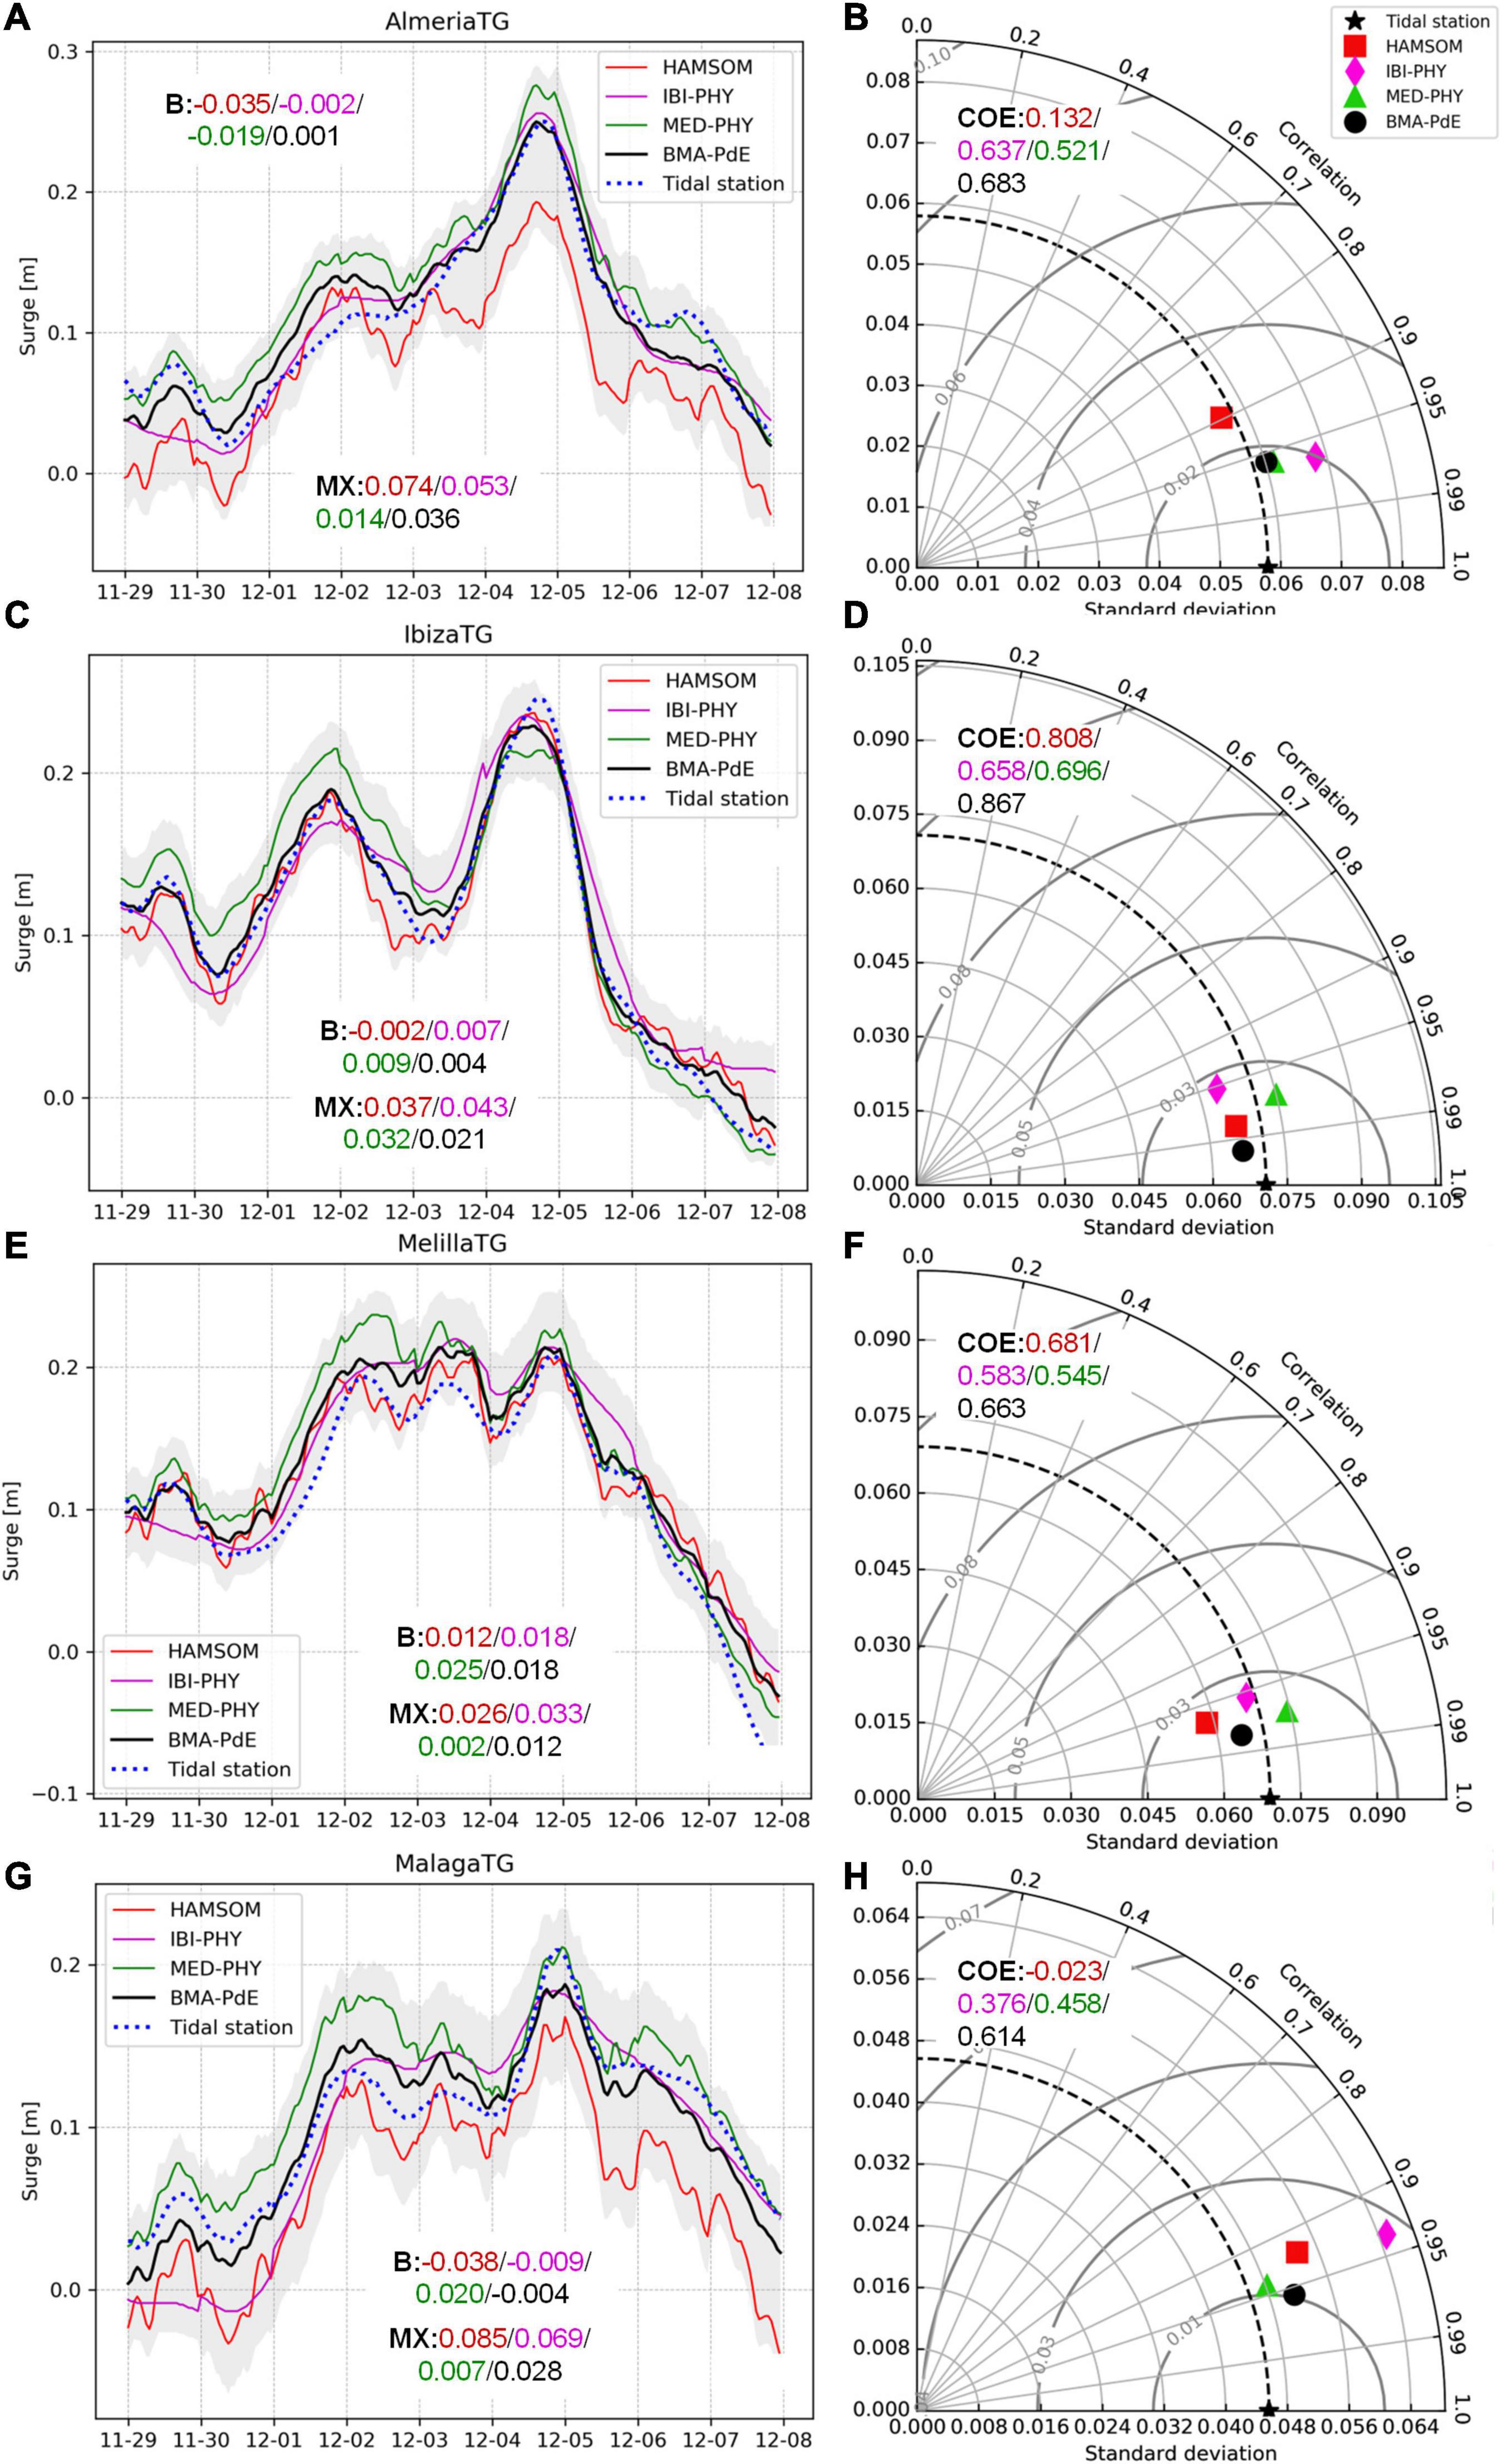
Figure 12. Results of the ENSURF system at several TGs during storm Dora: Nivmar (red), IBI-MFS (magenta), MedFS (green), BMA-PdE (black), and observations (blue). Left panels: surge time series at Almería (A), Ibiza (C), Melilla (E), and Málaga (G). B is the mean bias for each model, in meters (same chromatic index). MX is the maximum error, in meters. The gray areas enclose the 5-95% percentiles of the ENSURF system. Right panels: Taylor diagrams at Almería (B), Ibiza (D), Melilla (F), and Málaga (H). Legend: Nivmar (red square), IBI-MFS (magenta rhombe), MedFS (green triangle), BMA (black dot). COE is the Coefficient of Efficiency for each model (dimensional).
As in the case of Gloria, IBI-MFS presents worse metrics than MedFS and ENSURF; though, the surge peak was better handled in this event (maximum error at Sagunto, with 7 cm). MedFS produces the highest peaks during the extremes, tending to adjust better in locations with higher surges. This is the case for Barcelona, Tarragona, Sagunto, Gandía and Málaga, where the storm peak was better handled by the MedFS (with maximum errors down to 5 cm).
Discussion
We have performed a detailed analysis of sea level processes associated with the record-breaking storm Gloria, based on available observational data and operational forecasts in the WM coast. The study has allowed us to identify the capacities and limitations of the different elements contributing to PORTUS early warning system, in terms of sea level monitoring and forecasting.
Coastal Sea Level Observations
Detailed inspection of coastal sea level data from the REDMAR network has revealed important facts about the degree of exceptionality of sea level during this extreme event, and its potential to aggravate coastal damage caused by Gloria extraordinary waves. Use of different sampling rates and products is needed to dissect the main sea level processes taking place at different timescales, from high frequency oscillations (minutes, seconds), through tide and surge (hours, days) to longer term variations (seasonal, interannual and long term MSL rise). The large number of TGs in the area, their historical records and PORTUS sea level products and tools provide a comprehensive and valuable source of information for this kind of analysis.
The first important finding is that, despite the extension of the coastal damage during this storm, the magnitude of the storm surge component during Gloria was found to be exceptional only near Valencia. The record of total sea level was only beaten at Gandía TG, where the surge reached 54 cm above MSL, followed by Valencia and Sagunto nearby stations. However, this could be affected by the length of the historical record, shorter in Gandía (starting in 2007) than in Valencia (starting in 1993). The surge was moderate at the North and South WM, and practically negligible, according to observations, at the Balearic Islands. The estimated return periods from the longest records (Barcelona and Valencia) differ in more than 20 years between both stations (in Barcelona, the maximum sea level during Gloria, with a return period of 1 year, wouldn’t be considered as an extreme in many studies). Interestingly, despite the small amplitude of the tide in the WM, it still contributes and modulates the peaks during the storm, especially along the Catalonia coast. This contribution was however limited by the coincidence of Gloria with the neap tides.
Analysis of monthly MSLs shows the importance of the phase of the seasonal cycle, dominated by an annual signal that reaches up to 8 cm of amplitude in the WM. With a maximum of the average cycle between October and November, and a minimum between February and March, the storm Gloria happened in a favorable month in terms of MSL. This advantage was compensated, however, by the effect of long-term SLR, as revealed by comparing Gloria with another exceptional storm, in terms of coastal damage, that hit this coast in November 2001: monthly MSL in January 2020 at Valencia and Barcelona was higher than monthly MSL in November 2001. According to estimates of future SLR for 2100: 35 cm to 60 cm (IPCC, 2013), this effect will be aggravated in the coming years. Note that SLR may surpass the magnitude of the maximum surge during Gloria (54 cm). This will have a huge impact on several coastal areas, where RSLR doubles or even triples the open ocean SLR, due to subsidence. For instance, in the Ebro Delta wetlands, the RSLR ranges from 5 to 8 mm/year (Ibáñez et al., 2010), what could lead to an increase of 80 cm in MSL in 2100.
Higher frequency processes in seconds-minutes timescales (HFSLOs) can significantly change the perception of final extreme sea levels and add significant sea level variability to hourly sea levels. Nowadays, tsunami warning requirements have increased the availability of <1 min sampling data from TGs, and consequently our capability of understanding other sea level hazards such as infragravity waves and meteotsunamis, strongly linked to severe coastal erosion, flooding and harbor operation problems. PORTUS includes automatic detection and alert messages for this type of oscillations, as well as for sea level and waves. Red alerts were issued during Gloria, when their amplitude was over 50 cm at the same stations with the highest surge contribution (Valencia, Gandía, and Sagunto). These HFSLOs overpassed the highest percentiles that had not been reached by hourly sea levels at other stations, like Tarragona.
The new operational tool for characterization of 2 Hz data from TGs in PdE (NivMarHF) offers a new range of possibilities to detect and understand these processes in near-real time. The tool has shown an increase of the infragravity band energy (30 s - 5 min) at most of the stations, including those where the surge was less important (e.g., Tarragona or Ibiza), beating the historical record in Valencia, Ibiza and Sagunto. This energy band is typically excited when infragravity waves are generated by swell propagation. The bi-modal wave spectra and record-breaking long periods during storm Gloria (De Alfonso et al., 2021) would be consistent with the presence of infragravity waves, especially between Tarragona and Gandía, including the Ebro Delta, despite the traditional assumption that they are not generated in the Mediterranean Sea. The novel dataset provided by NivMarHF has allowed plotting oscillations amplitude and infragravity band energy against mean wave periods from nearby buoys, for the whole time series. The exercise revealed that long period waves seems to be the main forcing for the generation of the largest oscillations recorded at several ports. Finally, the influence of resonance effects is beyond the scope of this study, and should be further explored, for this and other historical events, already detected and characterized with NivMarHF tool.
Forecast Systems
As seen in previous sections, the model forecasting systems were able to provide a good solution for the evolution of the surge. This section takes advantage of this fact to further explore surge event dynamics and describe in detail the difference between the model solutions. Here ENSURF is not considered, since we are more interested in the dynamic response information provided by the numerical models.
All forecasting systems have well known limitations; Nivmar, operational since 1998, is based on a 2D barotropic model and has a limited spatial resolution. Therefore, all baroclinic mesoscale sea level signals are not present, and large scale patterns due to changes in baroclinic currents or heat content differences between regions of the domain are missing. MedFS does not include tides and, more relevant for this discussion, the Atlantic open boundary is not considering the inverse barometer effect. IBI-MFS is not solving the whole Mediterranean and, therefore, its response to atmospheric pressure is non-optimal for this basin, since it is well known that the response at any Mediterranean sea level station depends on the balance of atmospheric pressure at the eastern and western sub-basins (Tsimplis et al., 2005). On top of that, only MedFS is considering waves, but in a limited way, only taking into account the wave modification of the drag coefficient.
In order to simplify the discussion, we will focus on those models running on the same geographical domain, and showing the best and worst statistical behavior, the MedFS and the Nivmar. Additionally, in order to obtain more solid conclusions, the discussion is extended to the other event treated in this work, the storm Dora.
For a better understanding of the spatial response of the models to the meteorological situation, maps of residuals have been produced. Figure 13 shows the residuals maps forecasted by MedFS and Nivmar during Gloria and Dora main peaks, and their differences. In order to establish a common reference point for the two models, the mean sea level computed from years 2018 and 2019 was subtracted from the raw model outputs. Note that in this case the models outputs are not corrected by the nudging technique applied by the ENSURF system (Figures 9–12).
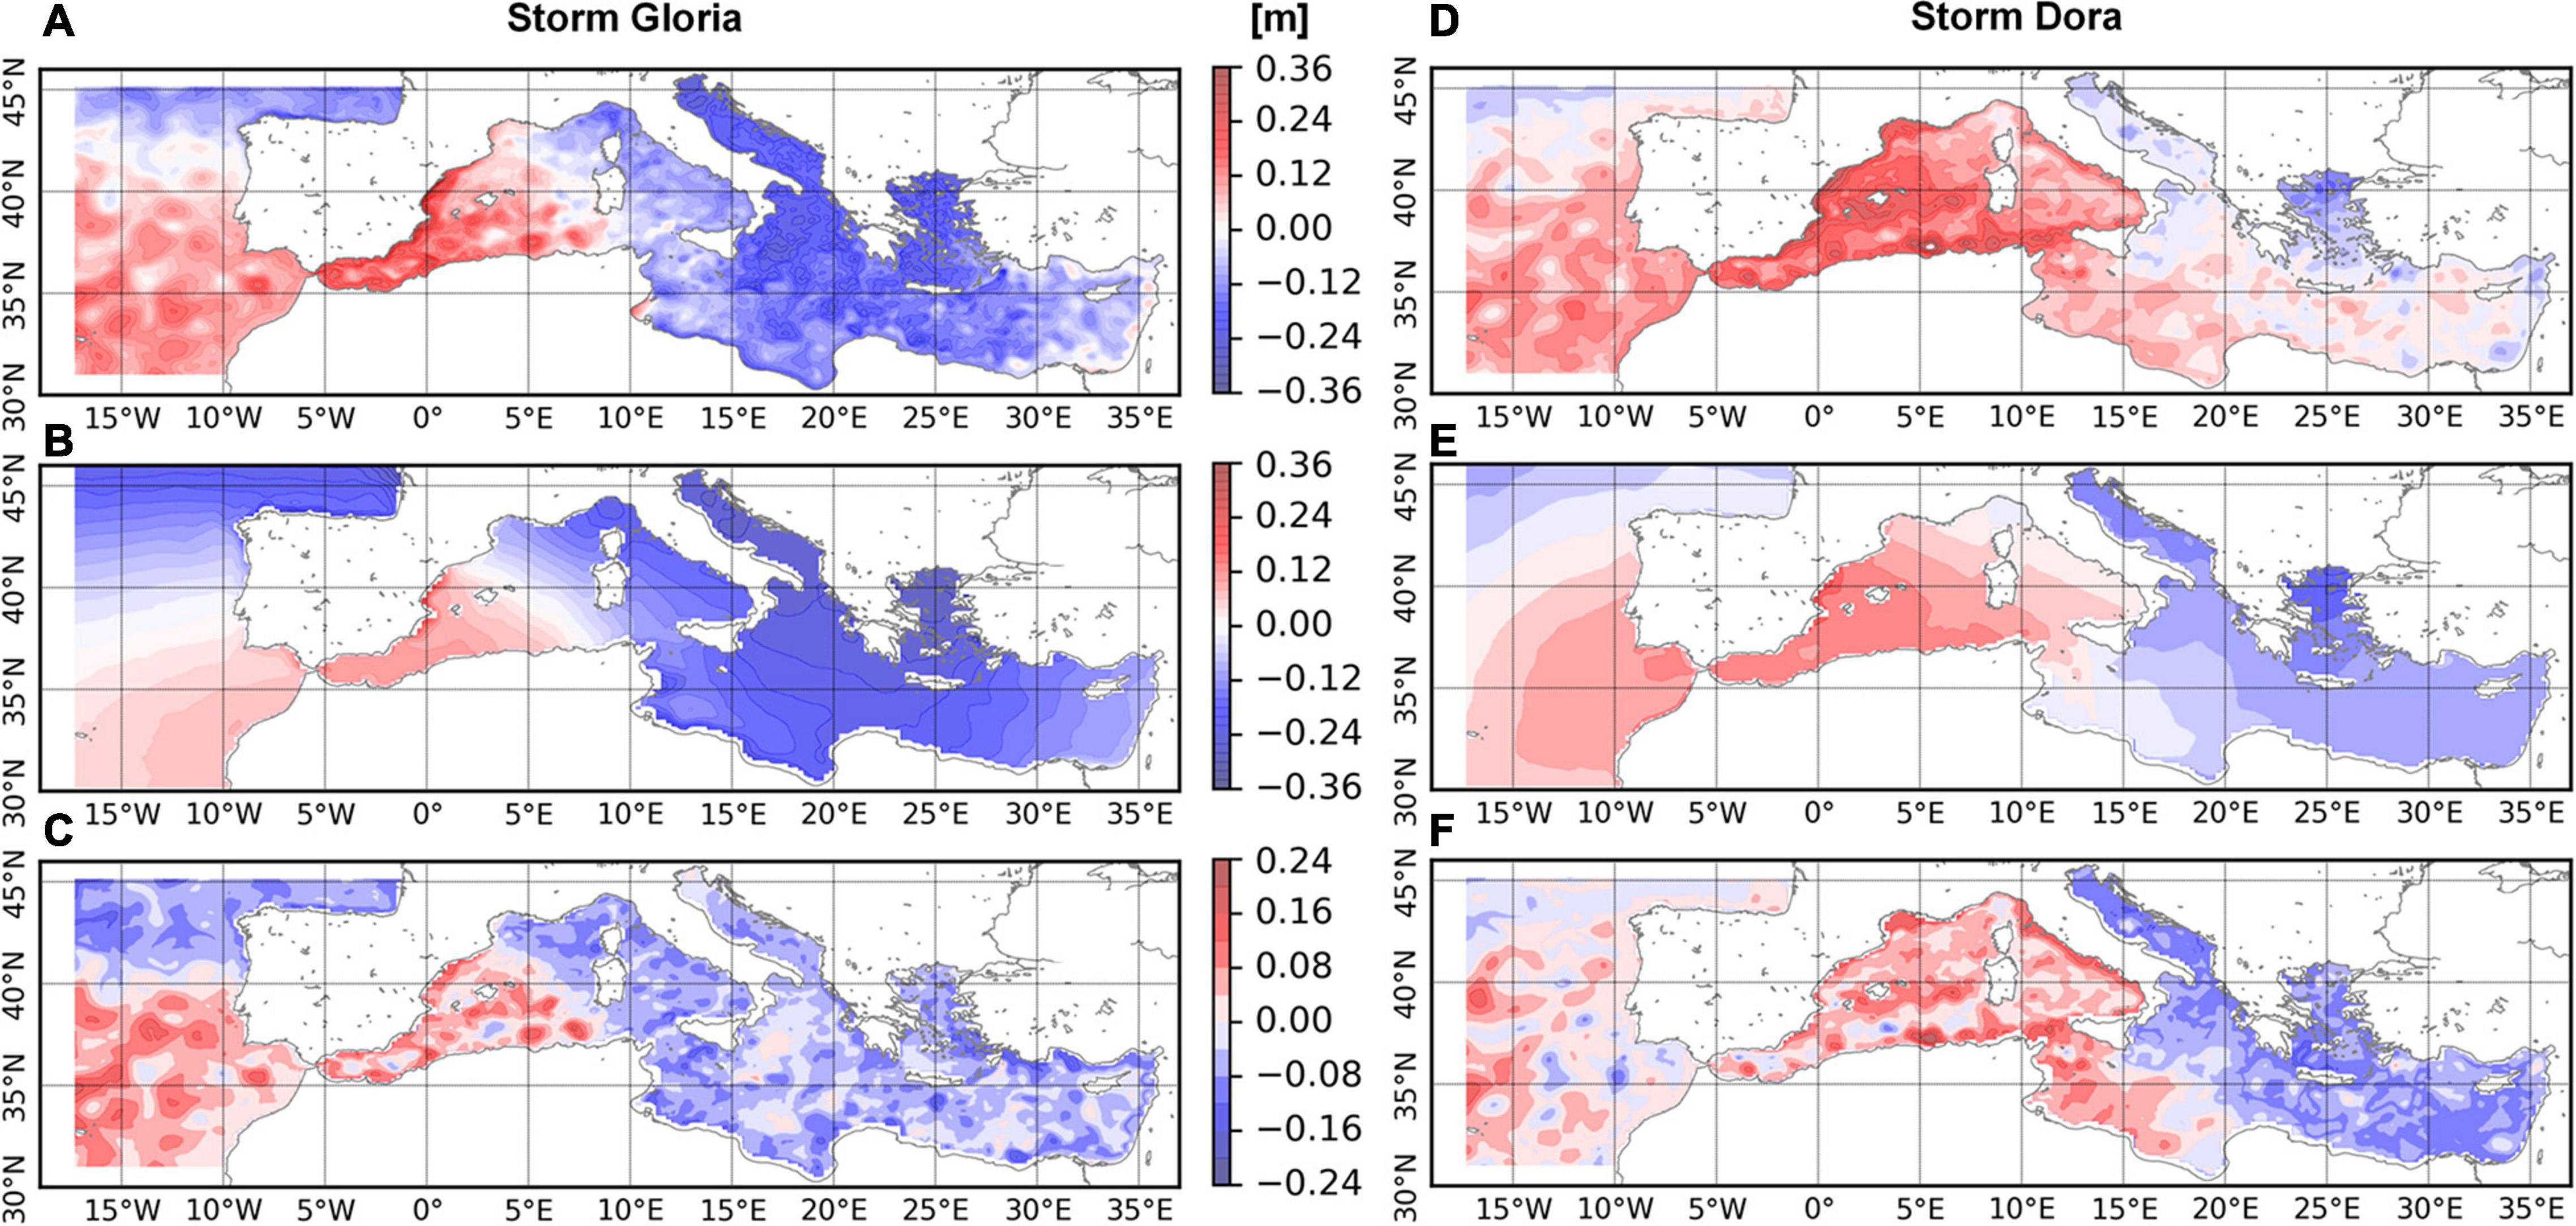
Figure 13. Left panels: Storm Gloria: hourly non-tidal residuals from MedFS (A), Nivmar (B), and differences (C) at 2020/01/20 08:00 UTC. Right panels: Storm Dora: hourly non-tidal residuals from MedFS (D), Nivmar (E), and differences (F) at 2019/12/04 18:00 UTC. Units in meters.
For both models, the sea level residual maps have similar characteristics, with higher values on the WM, responding properly to the low pressures dominant on the Alboran Sea on both events. On top of that, the effect of the wind is clearly visible on the Iberian Peninsula Mediterranean coast, where a narrow band of higher residuals can be found, especially in the region of Gandia. This is due to the effect of the strong winds but is also linked with the presence of a wider continental shelf in this part of the coast (it is well known that the magnitude of the wind induced surge is more relevant in shelf seas).
Nevertheless, there are important differences, as can be seen in panels C and F. First, Nivmar is generating a much smoother output, as a result of being a barotropic system, not considering the mesoscale baroclinic activity. More relevant for the discussion is the fact that the differences between Eastern and Western Mediterranean are larger on the MedFS than in Nivmar, both in magnitude and extension. The limit between the region of positive and negative surge is located more eastern in the MedFS system, and the magnitude of the surge is larger in the whole area studied with the TGs. This is fully consistent with the higher values of the residuals forecasted by MedFS for both storms. Therefore, the residual maps show that these differences are due to sub-basin scale differences, and not to local or wind induced phenomena.
When analyzing how this area of higher residual affects the comparison with the TGs shown on the previous section, it is important to keep in mind that, as mentioned, all model data used in Figures 9-12 is treated by nudging (bias correction) between modeled and measured residuals of the previous days, as in Nivmar system. This technique (Álvarez-Fanjul et al., 2001) improves the system capability to provide accurate forecasts by diminishing the errors in any low frequency signal (with a period larger than one day). In the case of Gloria, the main peak of the storm unfolds at the beginning of the storm. Therefore, the effect of the nudging on this peak is very low, since on previous days the difference between models and TGs was small, due to the absence of surge. Therefore, in the case of Gloria, the comparison with TGs on the peak tends to show directly the model behavior. As can be expected from the maps, the MedFS produces higher surges for all TGs in the region. This explains the behavior previously described: in those points where the surge is higher, the MedFS captures properly the peaks, while in regions with lower surges, the model tends to overestimate. On the other hand, the peak studied at Dora unfolds after others of similar magnitude developed on previous days. Under this scenario, the nudging correction is having a considerable impact on the time series values for the studied peak, and the differences and errors on the models are therefore much less dramatic, as seen in Figures 11, 12, even when the magnitude of the differences in the surge is similar for the region covered by TGs on the maps in Figures 13C,F. Also, a possible explanation for the best performance of Nivmar in Dora is that the atmospheric pressure contribution is comparatively higher than in Gloria, and Nivmar resolves very well this component.
When trying to understand the raw model differences in Figure 13, it is very relevant to analyze the results on the Atlantic side of the domain. The large differences on this part of the domain are clearly related to the absence of inverse barometer effect on MedFS. As a result, the residuals at the Gulf of Cádiz region are much higher than in Nivmar. This extra elevation affects the sea level residuals at the WM basin through sub-inertial transport at the straits of Gibraltar. Therefore, the higher values shown by MedFS of the residual on the WM and the higher geographical extension of this region toward the east could be partially explained by this system limitation. It could be the case that the correct reproduction of the Gloria peak at the stations with higher surge by MedFS is a result of this effect. On the other hand, there could be legit differences in surge magnitude and extension as computed by MedFS due to heat content that cannot be considered by Nivmar. It is difficult to estimate the relative importance of both contributions, but the MedFS system is going to be improved soon by including both tides and inverse barometer effects at the Mediterranean open boundary. With this new configuration, the surge solution provided by this system will improve and it will be straightforward to analyze the effect of the heat content differences. Finally, although not included in this discussion, it is interesting to note that the more similar behavior of both IBI-MFS and Nivmar during both events is consistent with the fact that, in both cases, the effect of atmospheric pressure is correctly considered on the Atlantic side by means of inverse barometer effect.
As mentioned in the introduction, the systems are not fully coupled with waves. Only MedFS has a partial coupling, affecting the wind stress computation. In order to explore how relevant this is, a sensitivity analysis was performed with MedFS. Same model set-up (forcings and configuration) was re-run, but decoupling WW3 from the circulation model, and using instead an equivalent wind drag formula than IBI-MFS. The results presented a similar sea level pattern than the operational set-up, with a reduction of the surge of around 2-4 cm at most TGs. Note that at Tarragona TG, differences between IBI-MFS and MedFS reach almost 15 cm at the storm peak. Consequently, though MedFS wind drag coefficients were higher than the ones obtained with CORE bulk formula, this was not the primary reason for the mismatch among models.
Hypothetically, a combination of all wave induced effects described in the introduction, could contribute to improve the results on events like Gloria on the systems that are underestimating the peak. This is beyond the scope of the present paper and will be studied in future works.
On the other hand, it is important to emphasize that all models should include tides, as IBI-MFS, to be able to resolve all non-linear local interactions between tide and surge. This will be soon solved in MedFS. However, along the Spanish coast the tide-surge interactions are very small or negligible, due to the narrow shelf (Álvarez-Fanjul et al., 2001), and especially in the WM due to the microtidal regime. This is confirmed by the amplitudes of the higher order tidal constituents like M4 derived from the tide gauges employed in this study, which are lower than 1 cm.
During the Gloria event, there were 4 coastal and harbor circulation models operational in the WM (SAMOA system: Sotillo et al., 2020). These systems are not yet integrated in ENSURF and its performance in terms of sea level is not presented here. As these systems include tides, the assessment approach followed in this work would be different. Validation with total sea level data confirms, however, that they correctly outperform the IBI parent solution (not shown).
As a result of this discussion, it is clear that all models are providing a satisfactory forecast, but are also showing their limitations. This is especially significant for this comparison, since all the systems use the same atmospheric fields, and reinforces the importance of the techniques developed at Portus to provide an improved forecast on the region: the multi-model ensemble, able to provide a better solution and an estimation of uncertainty, and the bias correction based on in situ real time data.
Possible Effect of Previous Storm Dora on Gloria Coastal Impacts
Synchronicity of met-ocean forcings (waves, sea level, and wind) and specific state of the coast may unleash significant damages, even under low return periods. For instance, Guisado-Pintado and Jackson (2019) analyzed the clustering storm impact of two concurrent events in Five Finger Strand (NW Ireland coast). Storm Ophelia (2017) had high waves, but low sea level; and the eroded sand volume was close to 8300 m3. However, the later storm Hector (2018) eroded 13400 m3, despite the total wave energy being more moderate than in Ophelia. Hector storm peak coincided with a higher sea level and an already affected beach profile.
Despite the exceptional met-ocean forcings, coastal impacts due to Gloria were constrained by its initial coastal state, partly influenced by Dora. Main damages at Dora were produced at Tarragona and Gandia areas, the two zones in which the storm-surge was the largest (around 40 cm, Figure 11). Just finished beach nourishment works coincided with the onset of Dora at Gandía. The losses summed up to 110 thousand EUR; virtually, the whole sand budget that had been deployed (García, 2019).
Aerial photographs taken from Institut Cartogràfic i Geològic de Catalunya (ICGC, web map service available in ICGC, 2021) just after Dora, indicate erosion at several spots in the Ebro Delta. Specifically, in the Trabucador bar (Southern hemidelta), dune breaching and washover fans were found in the center of the barrier beach, a common post-storm feature in the area. Also, along the Delta, wave breaking can be observed at 130-200 m from the shoreline, at zones prone to accumulate eroded emerged sand as submerged bars (Gràcia et al., 2013).
The aftermath of Dora led to economic losses, and specific points were damaged prior to the arrival of Gloria. But the first storm also provided a natural defense against the extraordinary wave action from the second. The usual sand bars in post-storm dissipative beach profiles, are more efficient in dissipating wave action than the beach profile characteristic in late-summer (i.e., wider berm with a gentle slope and absence of sand bars). Hence, without the previous storm Dora, the “individual” coastal impacts of Gloria may have been worse, but it does not imply that the cumulative damage (i.e., the sum of the costs of a cluster of storms in a given season) would have been lower.
Future Work
The PORTUS sea level measuring component, the REDMAR tide gauge network, went through a massive improvement process during the last decade. The first major change was the one associated with hardware renovation, substituting the old acoustic sensors with new radar ones, more reliable, accurate and able to measure at much higher frequency rate. The second one, equally important, was the development of NivMarHF software. Thanks to this new tool, the potential of the 2 Hz data to provide insight into the sea level processes is now being unleashed, as demonstrated in this paper. In the short future, all the measurements accumulated during the last years will be explored with this tool to gain more statistical understanding of the phenomena described in this work.
The PORTUS forecasting system, with all the components included on the multi-model ENSURF ensemble, has demonstrated its ability to forecast events like Gloria and provide a reliable confidence interval for the residuals evolution. Nevertheless, there is also room on the modeling side for improvement and to increase our understanding of phenomena like Gloria.
High resolution modeling, only briefly discussed in this paper, is mandatory to understand properly the influence of waves on sea level. For example, wave set-up and coupling effects between circulation and waves could be much better understood by running high resolution models on the coastal domains adjacent to tide gauges.
This paper has demonstrated the importance of infragravity waves in the study of sea level processes in the WM area. Before the renovation of the measuring network, based on the installation of the radar tide gauges, the study of this process was not possible due to the previously existing poor frequency sampling instruments. Therefore, it is important to consider the development of forecasting systems for these phenomena at the Mediterranean ports. PdE, in collaboration with other institutions, is developing at this moment this capability for the Spanish Atlantic ports. When this initiative of development was launched, 3 years ago, the Mediterranean Ports were explicitly excluded, due to the now proven erroneous assumption that the short period waves in the Mediterranean were unable to trigger this range of oscillations. A major result of this work will be to reconsider this decision for future developments and expand the new infragravity wave forecast to the Mediterranean ports.
Closely associated with all the ranges of high frequency oscillations, the resonance answer inside the ports must also be carefully addressed in order to understand all the activity in this frequency range.
The MedFS will be upgraded soon, including tides and inverse barometer effect at the Atlantic open boundaries. This will for sure have a positive effect on its ability to reproduce storm surge phenomena, specially on the WM. Once this improvement will become operational, ENSURF system will provide an excellent platform to monitor the expected improvement.
This paper suggested that Dora storm might have had a beneficial effect on minimizing the damages produced by Gloria. In order to verify this hypothesis, further work with high resolution coastal erosion models would be necessary.
Finally, the analysis on seasonal and long term sea level trends is suggesting a worrying scenario for the evolution of our coastline and its associated infrastructures. It is mandatory to expand our knowledge of these processes by downscaling IPCC scenarios to the proper resolution, where coastal erosion phenomena and other negative impacts, such as reduction of operational capabilities of the ports, could be properly addressed. Several initiatives in this sense are already being developed, like the ECCLIPSE project1.
Data Availability Statement
All in situ observations and modeled data are available through the PdE PORTUS System. Additionally, hourly tide gauge data, in situ buoys data, and CMEMS MEDFS and IBI-MFS products are also publicly available in CMEMS catalog.
Author Contributions
BP-G, EÁF, RM-S, AS-A, and GC contributed to the conceptualization, methodology, design, and structure of the manuscript. BP-G, MG-L, JG-V, EC, and CMA wrote the original draft and carried out the formal analysis and investigation of the data. SP-R contributed to analysis of in situ data. SM and GC contributed to the investigation and contents on the modeling assessment. JFSG, AGF, and AM-C contributed to the impacts’ description. BP-G, MG-L, EÁF, EC, SM, RM-S, AS-A, and GC contributed to supervision, review, and editing. All the authors contributed to the article and approved the submitted version.
Conflict of Interest
JG-V was employed by company Oritia & Boreas S.L.
The remaining authors declare that the research was conducted in the absence of any commercial or financial relationships that could be construed as a potential conflict of interest.
The reviewer DB declared a shared program with several of the authors AS-A and GC at time of review.
Acknowledgments
This contribution has been possible thanks to the products provided by the Puertos del Estado PORTUS operational system and E.U. Copernicus Marine Service Information, more specifically, the NRT forecast products for the Mediterranean basin and the IBI area. In situ data from PdE tide gauges and buoys networks, also available through the CMEMS In Situ TAC, have been used.
Footnotes
References
Ablain, M., Meyssignac, B., Zawadzki, L., Jugier, R., Ribes, A., Spada, G., et al. (2019). Uncertainty in satellite estimates of global mean sea-level changes, trend and acceleration. Earth Syst. Sci. Data 11, 1189–1202. doi: 10.5194/essd-11-1189-2019
AEMET Report, (2020). Borrasca Gloria. Available online at: http://www.aemet.es/es/conocermas/borrascas/2019-2020/estudios_e_impactos/gloria (accessed August 30, 2020).
Álvarez-Fanjul, E., Pérez-Gomez, B., and Rodríguez, I. (2001). Nivmar: a storm surge forecasting system for Spanish waters. Sci. Mar. 65, 145–154. doi: 10.3989/scimar.2001.65s1145
Amores, A., Marcos, M., Carrió, D. S., and Gómez-Pujol, L. (2020). Coastal impacts of storm gloria (January 2020) over the Northwestern Mediterranean. Nat. Hazards Earth Syst. Sci. Discuss. [Epub ahead of print]. doi: 10.5194/nhess-2020-75
Androulidakis, Y. S., Kombiadou, K. D., Makris, C. V., Baltikas, V. N., and Krestenitis, Y. N. (2015). Storm surges in the Mediterranean Sea: variability and trends under future climatic conditions. Dyn. Atmos. Oceans 71, 56–82. doi: 10.1016/j.dynatmoce.2015.06.001
Backhaus, J. O., and Hainbucher, D. (1987). “A finite difference general circulation model for shelf sea and its applications to low frequency variability on the North European Shelf,” in Three Dimensional Model of Marine and Estuarine Dynamics, eds J. C. Nihoul and B. M. Jamart (Amsterdam: Elsevier), 221–244.
Beckers, J. V. L., Sprokkereef, E., and Roscoe, K. L. (2008). “Use of Bayesian model averaging to determine uncertainties in river discharge and water level forecasts,” in Proceedings 4th International Symposium on Flood Defence: Managing Flood Risk, Reliability and Vulnerability; 2008 May 6–8, Toronto.
Bernier, N. B., and Thompson, K. R. (2015). Deterministic and ensemble storm surge prediction for Atlantic Canada with lead times of hours to ten days. Ocean Model. 86, 114–127. doi: 10.1016/j.ocemod.2014.12.002
Bertin, X., Li, K., Roland, A., and Bidlot, J.-R. (2015). The contribution of short-waves in storm surges: two case studies in the Bay of Biscay. Cont. Shelf Res. 96, 1–15. doi: 10.1016/j.csr.2015.01.005
Bonaduce, A., Pinardi, N., Oddo, P., Spada, G., and Larnicol, G. (2016). Sea-level variability in the Mediterranean Sea from altimetry and tide gauges. Clim. Dyn. 47, 2851–2866. doi: 10.1007/s00382-016-3001-2
Bonaduce, A., Staneva, J., Grayek, S., Bidlot, J. R., and Breivik, Ø (2020). Sea-state contributions to sea-level variability in the European Seas. Ocean Dyn. 70, 1547–1569. doi: 10.1007/s10236-020-01404-1
Bowen, A. J., Inman, D. L., and Simmons, V. P. (1968). Wave ‘set-down’ and set-up. J. Geophys. Res. 73, 2569–2577. doi: 10.1029/JB073i008p02569
Brasseur, P., Bahurel, P., Bertino, L., Birol, F., Brankart, J. M., Ferry, N., et al. (2005). Data assimilation for marine monitoring and prediction: the MERCATOR operational assimilation systems and the MERSEA developments. Q. J. R. Meteorol. Soc. 131, 3561–3582. doi: 10.1256/qj.05.142
Charnock, H. (1955). Wind stress on a water surface. Q. J. R. Meteorol. Soc. 81, 639–640. doi: 10.1002/qj.49708135027
Cipollone, A., Storto, A., and Masina, S. (2020). Implementing a parallel version of a variational scheme in a global assimilation system at eddy-resolving resolution. J. Atmos. Ocean. Technol. 37, 1865–1876.
Clementi, E., Oddo, P., Drudi, M., Pinardi, N., Korres, G., and Grandi, A. (2017a). Coupling hydrodynamic and wave models: first step and sensitivity experiments in the Mediterranean Sea. Ocean Dyn. 67, 1293–1312. doi: 10.1007/s10236-017-1087-7
Clementi, E., Pistoia, J., Delrosso, D., Mattia, G., Fratianni, C., Storto, A., et al. (2017b). “A 1/24 degree resolution mediterranean analysis and forecast modelling system for the copernicus marine environment monitoring service,” in Proceedings of the Extended abstract to the 8th EuroGOOS Conference, Bergen.
Clementi, E., Pistoia, J., Escudier, R., Delrosso, D., Drudi, M., Grandi, A., et al. (2019). Mediterranean Sea Analysis and Forecast (CMEMS MED-Currents, EAS5 system) [Data set]. London: Copernicus Monitoring Environment Marine Service (CMEMS).
De Alfonso, M., Lin-Ye, J., García-Valdecasas, J. M., Pérez-Rubio, S., Luna, M. Y., Santos-Muñoz, D., et al. (2021). Storm gloria: sea state evolution based on in situ measurements and modeled data and its impact on extreme values. Front. Mar. Sci. 8:646873. doi: 10.3389/fmars.2021.646873
Dobricic, S., and Pinardi, N. (2008). An oceanographic three-dimensional variational data assimilation scheme. Ocean Model. 22, 89–105. doi: 10.1016/j.ocemod.2008.01.004
Foreman, M. G. G. (1977). Manual for tidal heights analysis and prediction. Can. Pac. Mar. Sci. Rep. 7:10.
García, S. (2019). 110 thousand euros in erosion losses in Denia beaches due to storm (in Spanish), La Marina Plaza. Available online at: https://lamarinaplaza.com (accessed May 13, 2021).
García-Valdecasas, J., Pérez-Gómez, B., and Molina, R. (2020). Operational tool for characterizing high-frequency sea level oscillations. Nat. Hazards 106, 1149–1167. doi: 10.1007/s11069-020-04316-x
GETECH (1995). Global DTM5, Geophysical Exploration Technology (GETECH). Leeds: University of Leeds.
Gómez, M., Alvarez-Fanjul, E., Carretero, J. C., Pérez-Gómez, B., Rodríguez, I., Serrano, O., et al. (2002). “Oceanographic and atmospheric análisis of the 10-16 November 2001 Storm in the Western Mediterranean,” in Proceedings of the IV Plinius Conference on Mediterranean Storms (Mallorca, October 2002), CDROM (Palma: University of the Balearic Islands).
Gomis, D., Tsimplis, M. N., Martín-Míguez, B., Ratsimandresy, A. W., García-Lafuente, J., and Josey, S. A. (2006). Mediterranean Sea level and barotropic flow through the Strait of Gibraltar for the period 1958–2001 and reconstructed since 1659. J. Geophys. Res. Oceans 111:JC003186.
Gràcia, V., García-León, M., Grifoll, M., and Sánchez-Arcilla, A. (2013). Breaching of a barrier under extreme events. The role of morphodynamic simulations. J. Coast. Res. 65, 951–956.
Guisado-Pintado, E., and Jackson, D. W. (2019). Coastal impact from high-energy events and the importance of concurrent forcing parameters: the cases of storm Ophelia (2017) and storm Hector (2018) in NW Ireland. Front. Earth Sci. 7:190.
Hasselmann, K. (1970). Wave-driven inertial oscillations. Geophys. Astrophys. Fluid Dyn. 1, 463–502. doi: 10.1080/03091927009365783
Herbers, T. H. C., Elgar, S., and Guza, R. (1995). Generation and propagation of infragravity waves. J. Geophys. Res. 1002, 24863–24872. doi: 10.1029/95JC02680
Horsburgh, K. J., and Wilson, C. (2007). Tide-surge interaction and its role in the distribution of surge residuals in the North Sea. J. Geophys. Res. 112:JC004033. doi: 10.1029/2006JC004033
Ibáñez, C., Sharpe, P. J., Day, J. W., Day, J. N., and Prat, N. (2010). Vertical accretion and relative sea level rise in the Ebro Delta Wetlands (Catalonia, Spain). Wetlands 30, 979–988.
ICGC (2021). Institut Cartogràfic i Geològic de Catalunya. Available online at: https://geoserveis.icgc.cat/servei/catalunya/costa/wms? (accessed March 30, 2021).
IPCC (2013). Climate Change 2013: The Physical Science Basis. Contribution of WorkingGroup I to the Fifth Assessment Report of the Intergovernmental Panel on ClimateChange. Cambridge: Cambridge University Press.
Jansá, A., Monserrat, S., and Gomis, D. (2007). The Rissaga of 15 June 2006 in Ciutadella (Menorca), a meteorological tsunami. Adv. Geosci. 12, 1–4. doi: 10.5194/adgeo-12-1-2007
Large, W. G., and Yeager, S. (2004). Diurnal to Decadal Global Forcing for Ocean and Sea-Ice Models: The Data Sets and Flux Climatologies. Boulder, CO: University Corporation for Atmospheric Research.
Legates, D. R., and McCabe, G. J. (1999). Evaluating the use of “goodness-of-fit” measures in hydrologic and hydroclimatic model validation. Water Resour. Res. 35, 233–241. doi: 10.1029/1998WR900018
Legates, D. R., and McCabe, G. J. (2013). A refined index of model performance: a rejoinder. Int. J. Climatol. 33, 1053–1056. doi: 10.1002/joc.3487
Lin-Ye, J., García-León, M., Gràcia, V., Ortego, M. I., Lionello, P., Conte, D., et al. (2020). Modeling of future extreme storm surges at the NW Mediterranean Coast (Spain). Water 12:472. doi: 10.3390/w12020472
Longuet-Higgins, M. S., and Stewart, R. W. (1962). Radiation stress and mass transport in gravity waves, with application to “surf beats.”. J. Fluid Mech. 13, 481–504. doi: 10.1017/S0022112062000877
Lorente, P., Lin-Ye, J., García-León, M., Reyes, E., Fernandes, M., Sotillo, M., et al. (2021). On the performance of High Frequency radar in the Western Mediterranean during the record-breaking Storm Gloria. Front. Mar. Sci. 8:645762. doi: 10.3389/fmars.2021.645762
Marcos, M., Jordá, G., Gomis, D., and Pérez Gómez, B. (2011). Changes in storm surges in southern Europe from a regional model under climate change scenarios. Glob. Planet. Change 77, 116–128. doi: 10.1016/j.gloplacha.2011.04.002
Melet, A., Meyssignac, B., Almar, R., and Le Cozannet, G. (2018). Under-estimated wave contribution to coastal sea-level rise. Nat. Clim. Change 8:234. doi: 10.1038/s41558-018-0088-y
Monserrat, S., Vilibić, I., and Rabinovich, A. B. (2006). Meteotsunamis: atmospherically induced destructive ocean waves in the tsunami frequency band. Nat. Hazards Earth Syst. Sci. 6, 1035–1051. doi: 10.5194/nhess-6-1035-2006
Müller, M., Cherniawsky, J. Y., Foreman, M. G. G., and von Storch, J.-S. (2014). Seasonal variation of the M2 tide. Ocean Dyn. 64:159. doi: 10.1007/s10236-013-0679-0
Munk, W. H. (1949). Surf beats. EOS Trans. Am. Geophys. Un. 30, 849–859. doi: 10.1029/TR030i006p00849
Oddo, P., Adani, M., Pinardi, N., Fratianni, C., Tonani, M., and Pettenuzzo, D. (2009). A Nested atlantic-mediterranean sea general circulation model for operational forecasting. Ocean Sci. Discuss. 6, 1093–1127.
Oddo, P., Bonaduce, A., Pinardi, N., and Guarnieri, A. (2014). Sensitivity of the Mediterranean sea level to atmospheric pressure and free surface elevation numerical formulation in NEMO. Geosci. Model Dev. 7, 3001–3015. doi: 10.5194/gmd-7-3001-2014
Pacanowsky, R. C., and Philander, S. G. H. (1981). Parameterization of vertical mixing in numerical models of tropical oceans. J. Phys. Oceanogr. 11, 1443–1451.
Pasquet, A., Michaud, H., Aouf, L., Baraille, R., Bru, C., Correard, S., et al. (2014). “Implémentation d’un nouveau modèle opérationnel de prévision des vagues et surcotes marines,” in Proceedings of the XIIIèmes Journées Nationales Génie Côtier – Génie Civil, Dunkerque, 149–158.
Pasquet, A., Michaud, H., Baraille, R., Jourdan, D., Biscara, L., Casitas, S., et al. (2017). “Modeling storm surges with HYCOM - an improvement of the French warning system,” in Proceedings of the 1st International Workshop on Waves, Storm Surges, and Coastal Hazards, Berlin.
Pérez González, I., Pérez-Gómez, B., Sotillo, M. G., and Álvarez-Fanjul, E. (2017). “Towards a new sea level forecast system in Puertos del Estado. Extended proceedings,” in Proceedings of the 8th EuroGOOS Conference, Bergen.
Pérez-Gómez, B. (2014). Design and Implementation of an Operational Sea Level Monitoring and Forecasting System for the Spanish Coast. Master Thesis. Cantabria: University of Cantabria.
Pérez-Gómez, B., Alvarez-Fanjul, E., Pérez, S., de Alfonso, M., and Vela, J. (2013). Use of tide gauge data in operational oceanography and sea level hazard warning systems. J. Oper. Oceanogr. 6, 1–18. doi: 10.1080/1755876X.2013.11020147
Pérez-Gómez, B., Brower, R., Beckers, J., Paradis, P., Balseiro, C., Lyons, K., et al. (2012). ENSURF: multi-model sea level forecast: implementation and validation results for the IBIROOS and Western Mediterranean regions. Ocean Sci. 8, 211–226. doi: 10.5194/os-8-211-2012
Pérez-Gómez, B., Manzano, F., Alvarez-Fanjul, E., González, C., Cantavella, J. V., and Schindelé, F. (2016). Lessons derived from two high-frequency sea level events in the Atlantic: implications for coastal risk analysis and tsunami detection. Front. Mar. Sci. 3:206. doi: 10.3389/fmars.2016.00206
Pérez-Gómez, B., Pérez González, I., Sotillo, M. G., and Álvarez-Fanjul, E. (2019). Retos de los sistemas de observación y predicción en los riesgos asociados al nivel del mar. Ribagua 6, 1–5. doi: 10.1080/23863781.2019.1595212
Pettenuzzo, D., Large, W. G., and Pinardi, N. (2010). On the corrections of ERA-40 surface flux products consistent with the Mediterranean heat and water budgets and the connection between basin surface total heat flux and NAO. J. Geophys. Res. 115:C06022. doi: 10.1029/2009JC005631
Pinardi, N., Allen, I., De Mey, P., Korres, G., Lascaratos, A., Le Traon, P. Y., et al. (2003). The Mediterranean ocean Forecasting System: first phase of implementation (1998-2001). Ann. Geophys. 21, 3–20. doi: 10.5194/angeo-21-3-2003
Pinardi, N., Bonaduce, A., Navarra, A., Dobricic, S., and Oddo, P. (2014). The mean sea level equation and its application to the mediterranean sea. J. Climate 27:6279. doi: 10.1175/JCLI-D-13-00139.1
Pinardi, N., and Coppini, G. (2010). Operational oceanography in the Mediterranean Sea: the second stage of development. Ocean Sci. 6, 263–267.
Rabinovich, A. B. (2009). “Seiches and harbour oscillations,” in Handbook of Coastal and Ocean Engineering, ed Y. C., Kim (Singapore: World Scientific Publishing), 193–236.
Ratsimandresy, A. W., Sotillo, M. G., Álvarez-Fanjul, E., Carretero Albiach, J. C., Pérez-Gómez, B., and Hajji, H. (2008). A 44-year (1958–2001) sea level residual hindcast over the Mediterranean Basin. Phys. Chem. Earth 33, 250–259. doi: 10.1016/j.pce.2007.02.002
Sheremet, A. T., Staples, F., Ardhuin, S., Suanez, and Fichaut, B. (2014). Observations of large infragravity wave runup at Banneg Island, France. Geophys. Res. Lett. 41, 976–982. doi: 10.1002/2013GL058880
Sotillo, M. G., Cailleau, S., Lorente, P., Levier, B., Aznar, R., Reffray, G., et al. (2015). The MyOcean IBI ocean forecast and reanalysis systems: operational products and roadmap to the future Copernicus Service. J. Operat. Oceanogr. 8, 1–18. doi: 10.1080/1755876X.2015.1014663
Sotillo, M. G., Cerralbo, P., Lorente, P., Grifoll, M., Espino, M., Sanchez-Arcilla, A., et al. (2020). Coastal ocean forecasting in Spanish ports: the SAMOA operational service. J. Operat. Oceanogr. 13, 37–54. doi: 10.1080/1755876X.2019.1606765
Sotillo, M. G., Mourre, B., Mestres, M., Lorente, P., Aznar, R., García-León, M., et al. (2021). Evaluation of the operational CMEMS and coastal downstream ocean forecasting services during the storm Gloria (January 2020). Front. Mar. Sci. 8:644525. doi: 10.3389/fmars.2021.644525
Staneva, J., Alari, V., Breivik, Ø, Bidlot, J. R., and Mogensen, K. (2017). Effects of wave-induced forcing on a circulation model of the North Sea. Ocean Dyn. 67, 81–101. doi: 10.1007/s10236-016-1009-0
Storto, A., Masina, S., and Navarra, A. (2015). Evaluation of the CMCC eddy-permitting global ocean physical reanalysis system (C-GLORS, 1982-2012) and its assimilation components. Q. J. R. Meteorol. Soc. 142, 738–758. doi: 10.1002/qj.2673
Tonani, M., Pinardi, N., Dobricic, S., Pujol, I., and Fratianni, C. (2008). A high-resolution free-surface model of the Mediterranean Sea. Ocean Sci. 4, 1–14. doi: 10.5194/os-4-1-2008
Tonani, M., Teruzzi, A., Korres, G., Pinardi, N., Crise, A., Adani, M., et al. (2014). “The Mediterranean Monitoring and Forecasting Centre, a component of the MyOcean system,” in Proceedings of the 6th Int. Conference on EuroGOOS 4-6 October 2011, eds H. Dahlin, N. C. Fleming, and S. E. Petersson (Sopot: Eurogoos Publication).
Tsimplis, M., Álvarez-Fanjul, E., Gomis, D., Fenoglio, L., and Pérez-Gómez, B. (2005). Mediterranean Sea level trends: atmospheric pressure and wind contribution. Geophys. Res. Lett. 32:L20602. doi: 10.1029/2005GL023867
UNESCO/IOC (2020). Quality Control of in situ Sea Level Observations: A Review and Progress Towards Automated Quality Control, Vol. 1. Paris: UNESCO.
Van Leer, B. (1979). Towards the ultimate conservative difference scheme, V. A second order sequel to godunov’s method. J. Comp. Phys. 32, 101–136. doi: 10.1016/0021-9991(79)90145-1
Vilibić, I., Monserrat, S., and Rabinovich, A. B. (2014). Meteorological tsunamis on the US East Coast and in other regions of the World Ocean. Nat. Hazards 74, 1–9. doi: 10.1007/s11069-014-1350-x
Woodworth, P. L., Melet, A., and Marcos, M. (2019). Forcing factors affecting sea level changes at the coast. Surv. Geophys. 40, 1351–1397. doi: 10.1007/s10712-019-09531-1
Keywords: Storm Gloria, sea level processes, tide gauges, multi-model forecast, storm surge, infragravity waves, coastal impact
Citation: Pérez-Gómez B, García-León M, García-Valdecasas J, Clementi E, Mösso Aranda C, Pérez-Rubio S, Masina S, Coppini G, Molina-Sánchez R, Muñoz-Cubillo A, García Fletcher A, Sánchez González JF, Sánchez-Arcilla A and Álvarez Fanjul E (2021) Understanding Sea Level Processes During Western Mediterranean Storm Gloria. Front. Mar. Sci. 8:647437. doi: 10.3389/fmars.2021.647437
Received: 29 December 2020; Accepted: 26 April 2021;
Published: 08 June 2021.
Edited by:
Ivica Vilibic, Institute of Oceanography and Fisheries (IZOR), CroatiaReviewed by:
Michela De Dominicis, National Oceanography Centre, United KingdomDavide Bonaldo, Consiglio Nazionale Delle Ricerche (CNR), Italy
Copyright © 2021 Pérez-Gómez, García-León, García-Valdecasas, Clementi, Mösso Aranda, Pérez-Rubio, Masina, Coppini, Molina-Sánchez, Muñoz-Cubillo, García Fletcher, Sánchez González, Sánchez-Arcilla and Álvarez Fanjul. This is an open-access article distributed under the terms of the Creative Commons Attribution License (CC BY). The use, distribution or reproduction in other forums is permitted, provided the original author(s) and the copyright owner(s) are credited and that the original publication in this journal is cited, in accordance with accepted academic practice. No use, distribution or reproduction is permitted which does not comply with these terms.
*Correspondence: Begoña Pérez Gómez, bego@puertos.es