Exploring Temporal Variability in the Southern Benguela Ecosystem Over the Past Four Decades Using a Time-Dynamic Ecosystem Model
 Lynne J. Shannon1*
  Kelly Ortega-Cisneros1,2,3
  Tarron Lamont4,5
  Henning Winker6,7
  Robert Crawford4 Astrid Jarre1
  Marta Coll8
- 1Department of Biological Sciences, University of Cape Town, Cape Town, South Africa
- 2Department of Ichthyology and Fisheries Science, Rhodes University, Grahamstown, South Africa
- 3Institute for Coastal and Marine Research, Nelson Mandela University, Port Elizabeth, South Africa
- 4Oceans and Coasts Research, Department of Environment, Forestry and Fisheries, Cape Town, South Africa
- 5Department of Oceanography, University of Cape Town, Cape Town, South Africa
- 6Department of Environment, Forestry and Fisheries, Cape Town, South Africa
- 7Centre for Statistics in Ecology, Environment and Conservation, Department of Statistical Sciences, University of Cape Town, Cape Town, South Africa
- 8Institute of Marine Science (ICM-CSIC), Barcelona, Spain
This paper presents a new, updated, temporally dynamic Ecosim model for the Southern Benguela (1978–2015) by capturing recent advancements in our understanding of the dynamics and newly available data series from an additional decade of research in the region. The paper documents the model development and the thinking behind incorporating a newly available upwelling index, and observed fishing effort as important drivers of modeled ecosystem dynamics. The most sensitive predator-prey interactions were identified and vulnerabilities (of prey to predators) were estimated to improve model fit to field observations under each scenario. Sardine interactions with prey and predators were consistently found to be sensitive interactions in model fitting, accounting for at least 40% of the most sensitive trophic interactions in the southern Benguela modeled food web. Model fits to data were improved by a total of 85% reduction in sum of squares when upwelling effects on large phytoplankton availability to zooplankton and small pelagic fish was incorporated, geographic shifts in sardine distribution were captured by means of altered availability of sardine to predators, corresponding vulnerabilities of prey to predators were estimated, and an additional, small, hypothetical forcing function was fitted to small phytoplankton production. African penguin and Cape gannet fits to data series were improved by incorporating a recently published bird Food Availability Index, although model fits of several fish groups then deteriorated, emphasizing the need for additional empirical species-specific functional response studies. Attempts at fitting the full area model to either west coast or south coast time series did not improve overall model fits, highlighting limitations of the current non-spatialized model in describing coast-specific dynamics. This study shows promise in unraveling the observed dynamics of the Benguela upwelling ecosystem, and points to the importance of exploring spatially disaggregated approaches, in particular the new foraging habitat capacity of the Ecospace approach, to improve our understanding of processes whereby variability in upwelling influences dynamics of the Southern Benguela ecosystem. This is important in reconciling knowledge needed to manage fisheries and to protect marine biodiversity by means of ecosystem-based management in South Africa, and to advance management advice under future scenarios of climate change.
Introduction
The Benguela upwelling system is one of four major eastern boundary current systems in the world. The southern Benguela is a well-studied upwelling ecosystem bounded by the warm Agulhas current to the south and east, and the northern Benguela upwelling area off Namibia to the north. It is influenced by strong, wind-driven upwelling, which results in high biological productivity and supports several important commercial fisheries including the small pelagics, hake and squid fisheries but also an important small-scale sector.
Variability in the southern Benguela is high on a monthly, interannual and decadal scale, and populations of many species in the system reflect the high variability of the system (Cochrane et al., 2009) and thus predictions on the dynamics of the system and its populations can be challenging (e.g., Shannon et al., 2006; Travers and Shin, 2010). In the last two decades, substantial changes in environmental variables have been observed in this system, including changes in sea surface temperature, upwelling intensity, incidence of harmful algal blooms and extreme events (Rouault et al., 2010; van der Lingen et al., 2016; Lamont et al., 2018) among others. For example, the Agulhas Current has warmed by 0.2–0.4°C throughout the year over the period 1982–2009 (Rouault et al., 2010). The total cumulative upwelling (TCU) and the number of upwelling days in the Agulhas Bank significantly increased between 1979 and 2014, while a linear, albeit non-significant trend in the TCU has been identified for the southern Benguela (Lamont et al., 2018).
In the southern Benguela, changes in the distribution and abundance of several species of ecological and commercial importance have been recorded, and have been related to fishing and environmental changes (Blamey et al., 2015). Eastward shifts have been observed in the distribution of sardine, anchovy, West Coast rock lobster and kelp (e.g., Roy et al., 2007; Cockcroft et al., 2008; Bolton et al., 2012; Watermeyer et al., 2016). Anchovy Engraulis encrasicolus showed an eastward shift in distribution in 1996, and more than 50% of its biomass is now located east of Cape Agulhas (Coetzee et al., 2018). This distributional change is believed to be environmentally driven, attributed to a decrease in sea surface temperature in the inner shelf of the Agulhas Bank to the east of Cape Agulhas (Roy et al., 2007). The eastward distributional shift of West Coast rock lobster Jasus lalandii resulted in severe impacts on the fishery and local communities (Cockcroft et al., 2008). The distributional shift coincided with a decrease in the somatic growth of West Coast Rock lobster and an increase in the occurrence of lobster walk-outs, suggesting that these changes were environmentally driven (Cockcroft et al., 2008).
Zooplankton abundance has shown considerable variability in the southern Benguela and has been related to changes in the abundance of their predators. Copepod abundance increased from 1950 to the late 1990s in the southern Benguela (Verheye et al., 1998, 2016; Hutchings et al., 2012). This trend was attributed to the decrease in small pelagics fish after the start of the fishery and to increased productivity. Similarly, a decline in copepod biomass has been recorded in the Agulhas Bank since 1996 including the biomass of the dominant large copepod in the Agulhas Bank Calanus agulhensis (Huggett et al., 2019). It is likely that the eastward shift in the distribution of small pelagics increased predation pressure on copepods and resulted in decreased copepod abundance in the area. Higher proportions of Calanus agulhensis over the past 3 years, indicating a possible reversal of the previously noted trend, was synonymous with below average biomass of both anchovy and sardine east of Cape Agulhas (Huggett et al., 2019).
Ecosystem models are being widely applied to quantify food web dynamics and ecosystem responses to multiple drivers (e.g., Travers-Trolet et al., 2014; Corrales et al., 2018; Ortega-Cisneros et al., 2018a). Ecopath with Ecosim (EwE, Walters et al., 1999; Christensen and Walters, 2004) models fitted to time series data are proving to be useful tools for providing the ecosystem context for ecosystem-based fisheries management (EBFM; Heymans et al., 2016) in their ability to capture food web responses to environmental and fisheries drivers, both past (e.g., Shannon et al., 2004a, 2009; Watermeyer et al., 2008) and future (Serpetti et al., 2017; Corrales et al., 2018).
The aim of this study was to revise, update and re-fit the existing EwE models of the Southern Benguela (Shannon et al., 2004a, 2008; Smith et al., 2011) based on advancements in our understanding of dynamics and new available data sources emerging from an additional decade of research in the region. This paper documents the model and the thinking behind this modeling process involved in the development of the new time-dynamic trophic model of the Southern Benguela. The model was designed to facilitate future model testing of alternative management scenarios under scenarios of climate change, to assist developing future spatial-temporal modeling efforts and to provide a tool for use in further unpacking key trophic interactions currently under closer inspection by colleagues in the region.
Materials and Methods
Model Construction and Functional Groups
The Ecopath with Ecosim (Walters et al., 2000) modeling approach was used to construct an improved and updated food web model of the Southern Benguela ecosystem, following guidelines of best practice as outlined in Heymans et al. (2016). The existing models of the Southern Benguela extend from the Orange River mouth in the north west (29°S) to 28°E (East London) in the south east (Shannon et al., 2004a), spanning an area of 220,000 km2 (Figure 1) and the years 1978–2003 (Shannon et al., 2008). These were expanded and updated to 2015, from 31 to 48 living model groups, comprising 26 fish groups and 7 top predators (see Table 1). The single phytoplankton model group previously used (Shannon et al., 2004a, 2008) was subdivided into two groups: small phytoplankton (Phytoplankton 1) < 10 μm and larger phytoplankton (Phytoplankton 2) > 10 μm, based on Probyn (1992). This disaggregation was performed to incorporate bottom-up environmental processes as a key driver in upwelling systems such as the Benguela.
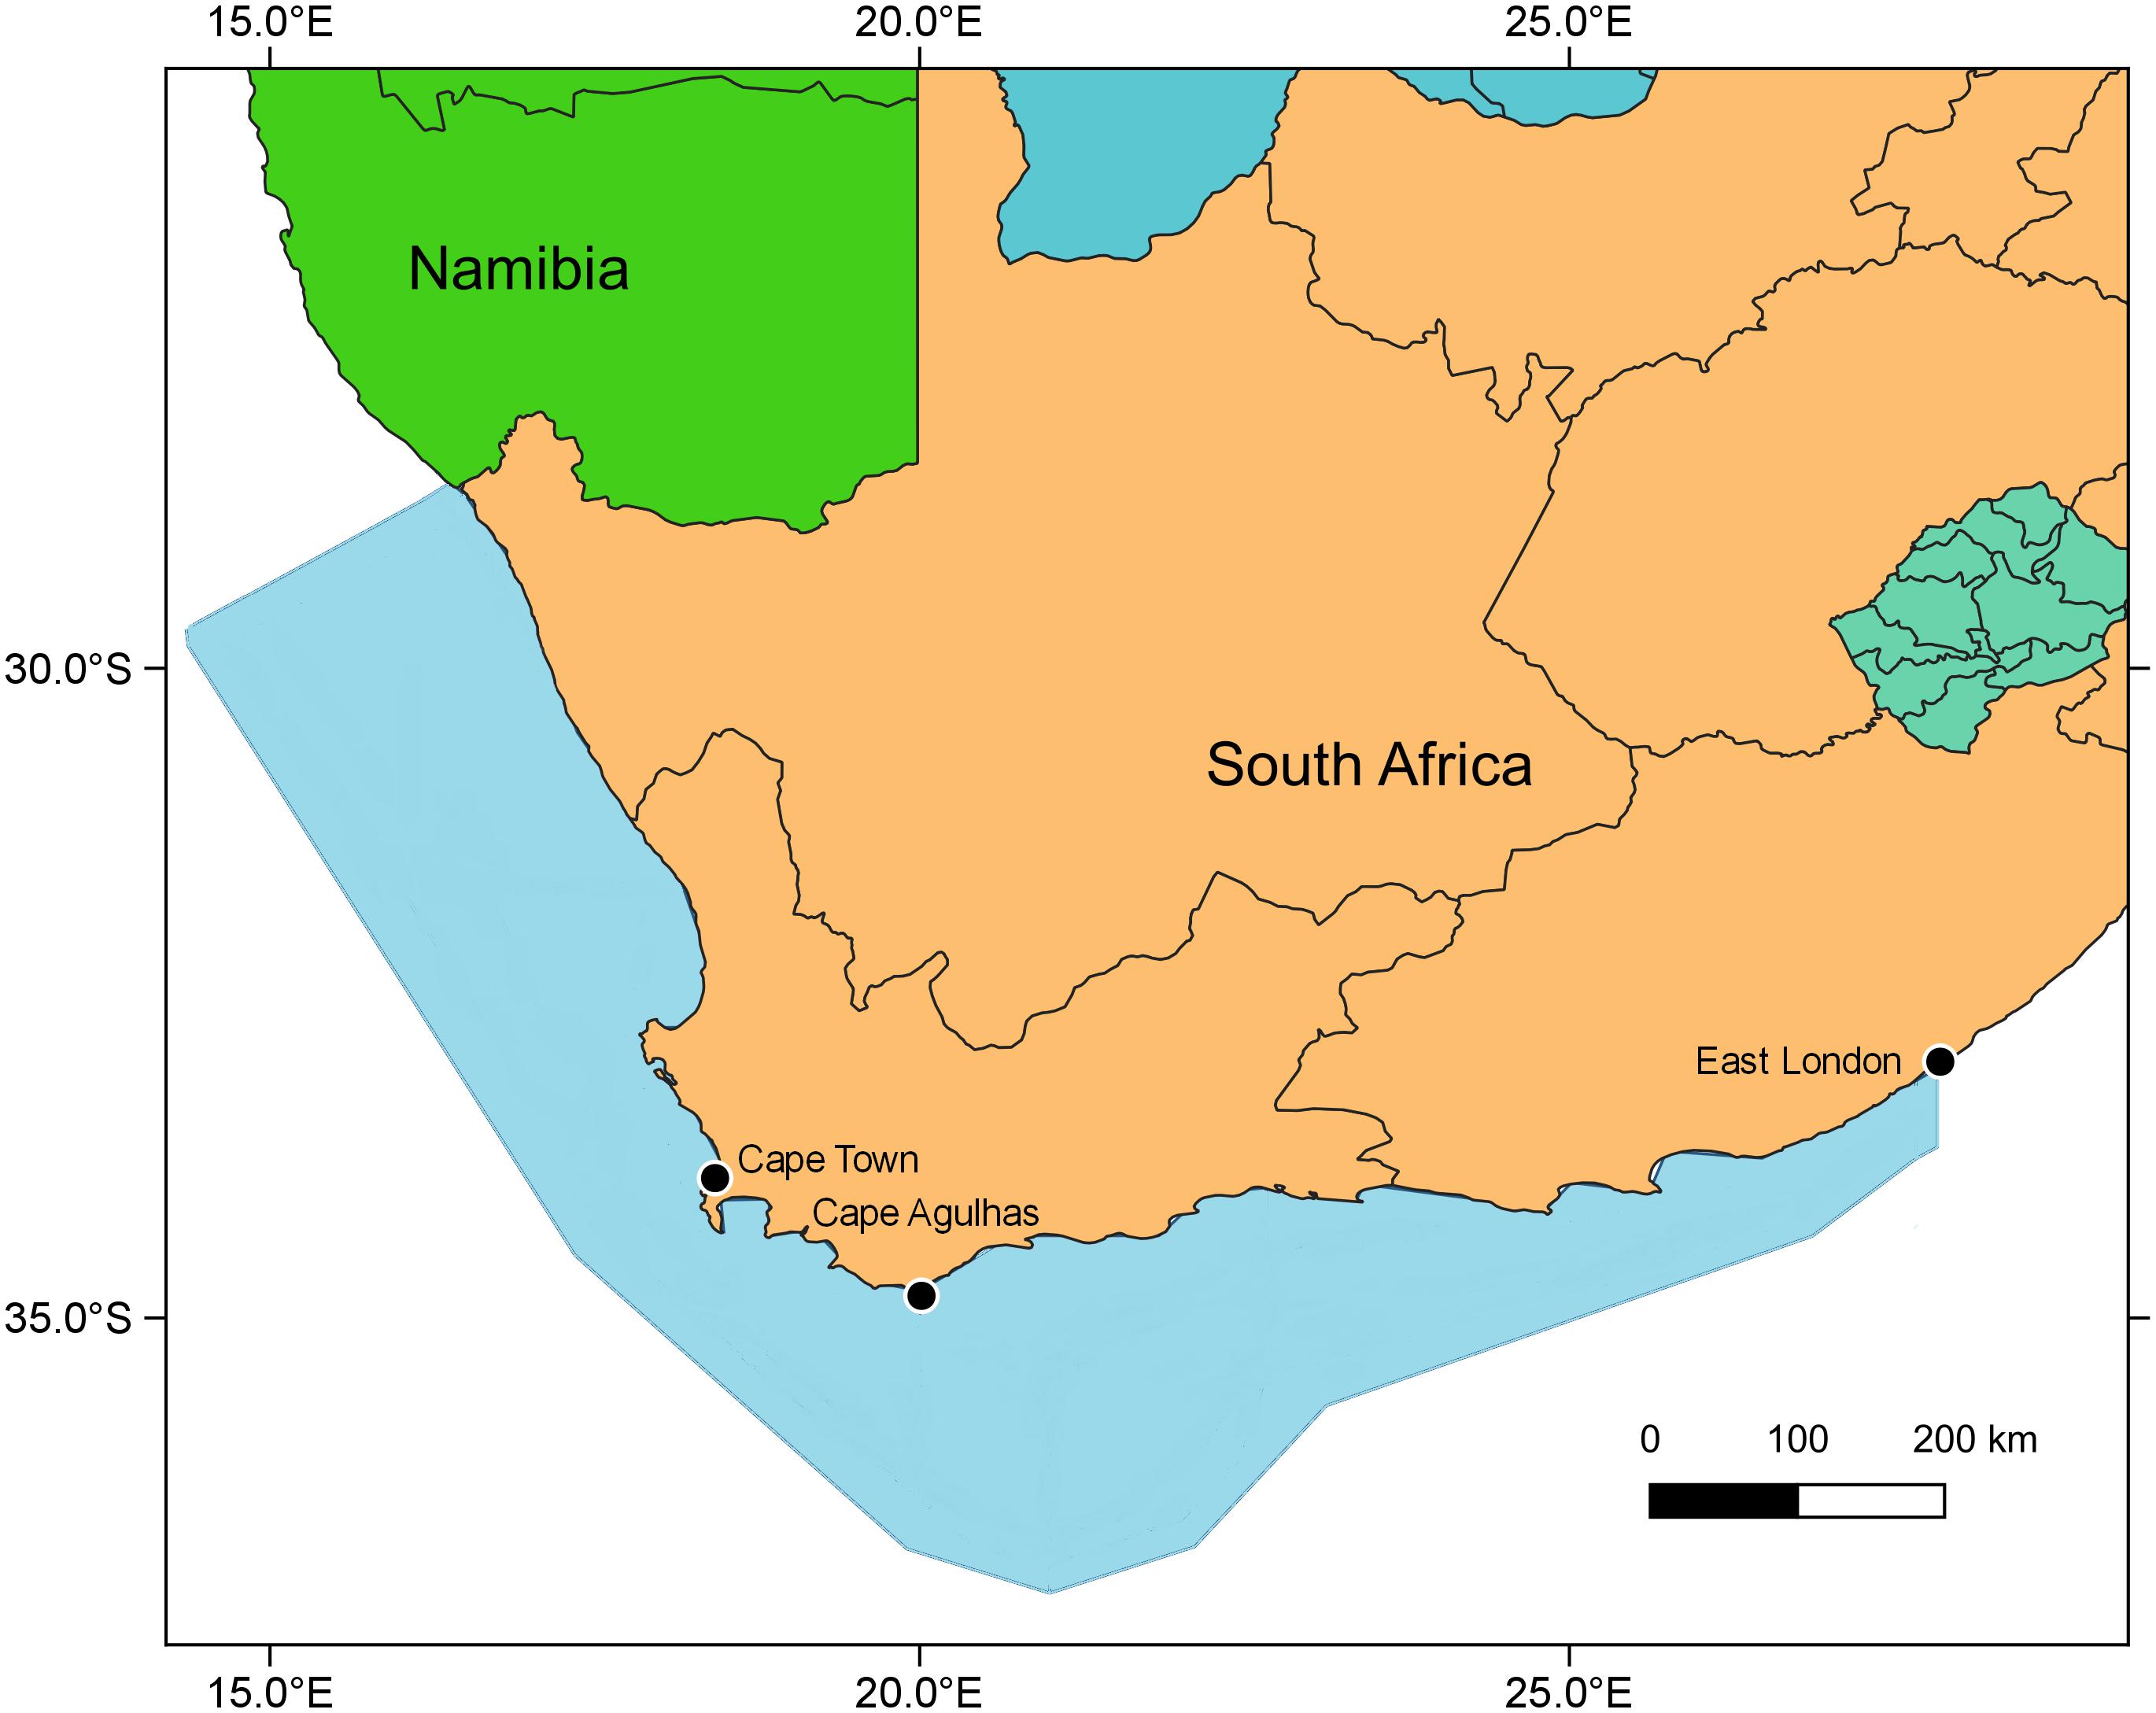
Figure 1. Map showing modeled area (blue shaded) and Cape Agulhas, determining the boundary between the west coast vs. the south coast subsystems of the Southern Benguela ecosystem (Hutchings et al., 2009; Watermeyer et al., 2016).
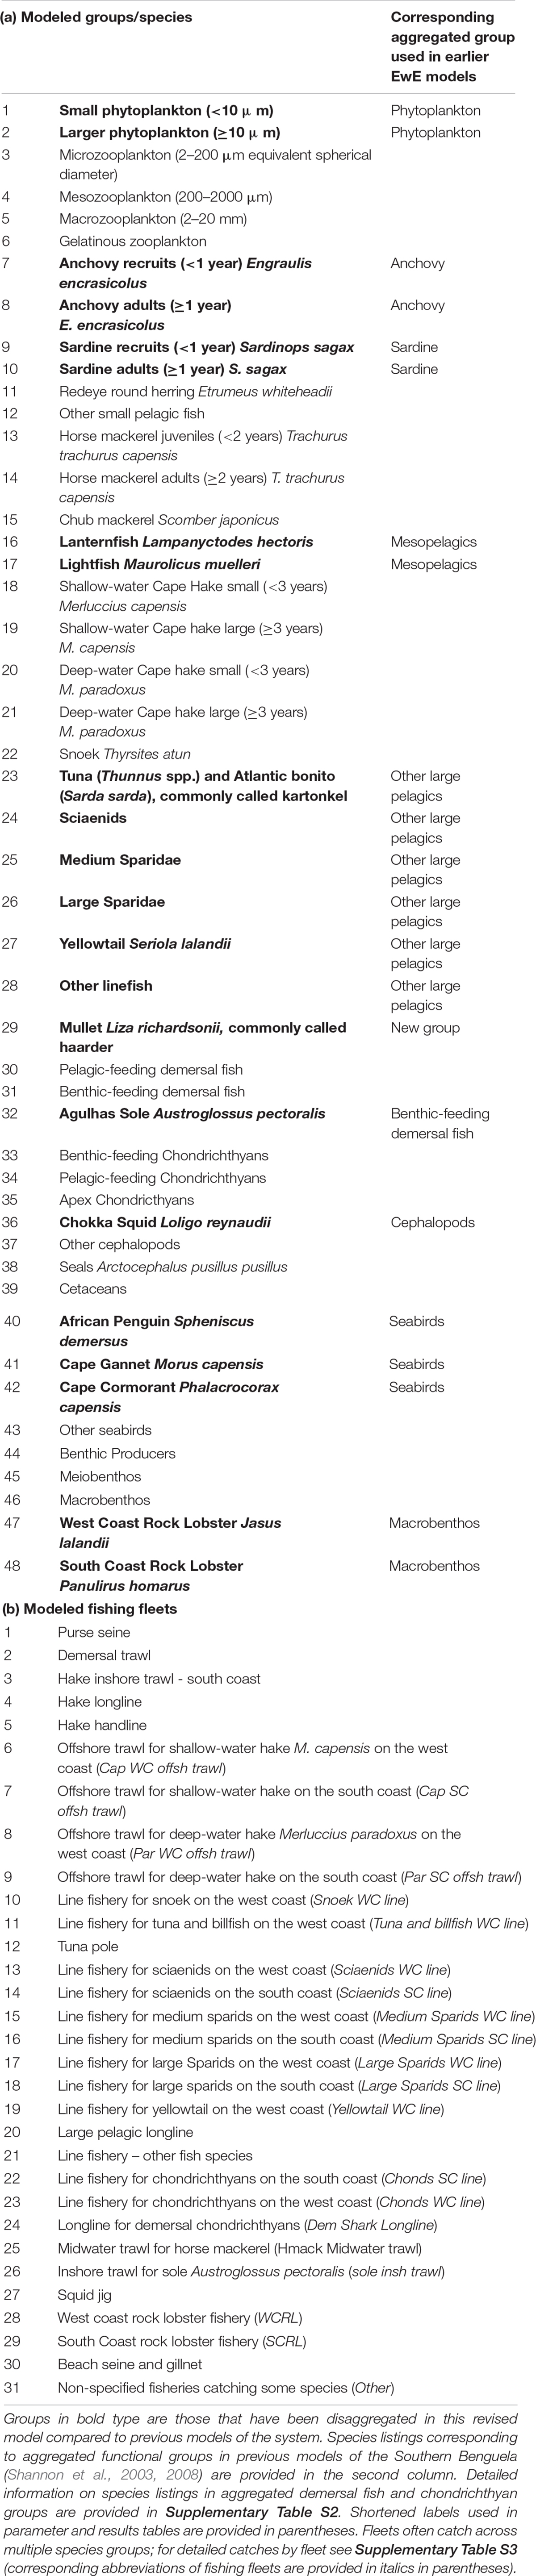
Table 1. Revised species and fishing fleet aggregation: (a) species groups and (b) fishing fleets modeled.
Pelagic fish are pivotal in the functioning of upwelling ecosystems, regulating the flow of energy up and down the food web (Cury et al., 2000). Multi-stanza groups (Supplementary Table S1) were added for anchovy and sardine in the revised model presented herein, to facilitate future fisheries management simulations to explore the extent to which fisheries and predators compete for small pelagics. For both anchovy and sardine, two stanzas were modeled: (i) recruits (under 1 year old) and (ii) adults (1 year and older). In the case of sardine, the adult stanza includes several year classes as sardine are longer lived. Mesopelagic fish were disaggregated in the revised model since relative abundances of lanternfish (Lampanyctodes hectoris) and lightfish (Maurolicus muelleri) have been changing over the past decade (DAFF, unpublished data; Janet Coetzee, personal Communication), and since there is a move to target lanternfish using midwater trawling on the West Coast (ANON, 2016).
The importance of modeling key predators of small pelagic fish as separate entities to ascertain possible dependencies of predators on forage fish has been well noted by Koehn et al. (2016). To facilitate model versatility for future simulation modeling for management/conservation purposes, the three most abundant breeding seabirds off South Africa, namely African Penguin Spheniscus demersus, Cape Gannet Morus capensis, and Cape Cormorant Phalacrocorax capensis, previously included in a single seabird group, were accommodated as separate model groups. African penguin is categorized as Endangered according to the IUCN classification, Cape Gannet was classified as Endangered but it has been suggested that the species be reclassified as Vulnerable based on recent trends in the northern Benguela (Sherley et al., 2019), and Cape Cormorant is Vulnerable. The “other seabirds” model group comprised breeding (resident) or more common migrant seabirds excluding the afore-mentioned three species (Crawford et al., 1991). Consideration was given to splitting the “Detritus” group into two: “normal detritus” and “discarded fish including offal.” However, to preserve the origin of the fish scavenged during fishing operations (e.g., Ryan and Moloney, 1988; Wickens et al., 1992; Watkins et al., 2008) in food web analyses, a single “detritus” group was retained and fish (in particular hake) scavenged from nets by seabirds and seals was considered as “live” consumption despite being mostly offal from “large hake” caught by trawlers (Grémillet et al., 2008). Available cetacean data were too sparse to warrant splitting into resident cetaceans and migratory cetaceans, or even into toothed and baleen whales.
In the case of predatory line fish (“traditional” boat-based, hand-line caught species), species relative abundance and effort time series were disaggregated by region according five functional groups based on objective clustering techniques and standardization procedures described in Winker et al. (2013, 2014) and Blamey et al. (2015) (see Table 1). Mullet was modeled as a separate functional group since it occurs inshore and in bays. Demersal fish were modeled as before (Shannon et al., 2004a) with the exception of Agulhas Sole (Austroglossus pectoralis), an important commercial species in the inshore trawl fishery on the South Coast, now modeled as a separate group. This decision was taken in anticipation of fisheries management simulation testing in future studies. West coast sole (Austroglossus microlepis) was retained in the general “benthic-feeding demersal fish” model group.
Model diets previously used for setting the 1978 model (Shannon et al., 2004a, 2008) were assumed in this study, with updates to account for species disaggregation and revised dietary knowledge, where applicable and as documented in the Supplementary Material Section 4 and Supplementary Table S4.
Best practices guidelines available for EwE models were followed during the model development (Heymans et al., 2016). The “prebal” approach (Link, 2010) was invoked to check for any obvious inconsistencies or peculiarities in the base (1978) model of the Southern Benguela. While “prebal” serves as a useful set of guidelines and warning signals as to potential problems in construction of food web models (Heymans et al., 2016), the various guidelines need to be viewed in the context of the system under consideration, and in light of the objectives of the model under development.
Fitting the Model to Data Time Series
Fitting of the revised Ecosim model of the Southern Benguela food web (1978–2015) was undertaken following previous procedures (Shannon et al., 2004a), but in this study fished groups were driven by 13 time series of fishing effort and two time series of fishing mortality, and model trajectories of biomass and landings outputs for 1978–2015 were compared to over 50 catch, abundance, and mortality time series (Supplementary Table S5). These data series were the best available at the start of this study, and the ones for which we were able to secure access to at the time. Before continuing with model fitting, general model structure was checked against guidelines provided by Link (2010) (Supplementary Material Section 6). To aid in the model fitting process, an estimate of relative uncertainty associated with the model parameters was also made (Supplementary Material Section 7). Model pedigree was estimated using the classification system in Ecopath, which takes into account the likely degree of uncertainty that various parameter sources infer. These scores were used to assist in weighting of time series for model fitting. Subsequently, most of the catch, abundance (mostly biomass), mortality and fishing effort time series assembled (Supplementary Table S5) were used in model fitting with the exception of survey-based spawner biomass series for anchovy and sardine [instead, stock assessment (modeled) time series were used as per the “Status of the South Africa Marine Fishery Resources, 2014” report]. In the case of anchovy and sardine, combined west and south coast estimates of biomass and harvest proportion were used.
Using Ecosim (Walters et al., 1997) “Fit to Time Series” routines, the most sensitive predator-prey interactions were identified and vulnerabilities (of prey to predators) were estimated to improve model fit to data series of field observations. The automated stepwise routine to explore EwE model fitting to available time series (Scott et al., 2016) was used as a means of identifying a suitable number and combination of vulnerability and primary production anomaly parameters that would facilitate fitting of the Southern Benguela model.
Initial Sequential Model Fitting Incorporating an Upwelling Anomaly
As mentioned in the introduction, TCU per year (m–3 s–1 100 m–1) in the Southern Benguela was higher in mid-1990s and decreased again in the 2000s, but in the latter part of the timeseries, there were more years where upwelling exceeded the long-term mean (from Lamont et al., 2018; Figure 2). Annual means were computed, from July of one calendar year to June of the following calendar year, such that the full upwelling cycle was captured in a single annual value. These annual means were then used to drive primary production changes in the model via a forcing function (Upwell) on large-celled phytoplankton following Lockerbie and Shannon (2019), and then only was an additional hypothetical environmental anomaly applied to small phytoplankton. The latter was fitted using the routine available in Ecosim to estimate an environmental forcing function applicable to primary production to improve fit of the model to observed time series data. We applied this routine to estimate additional environmental forcing that modified the dynamics of small-celled phytoplankton production in an attempt to further refine model fitting by emulating additional environmental “noise” in the ecosystem.
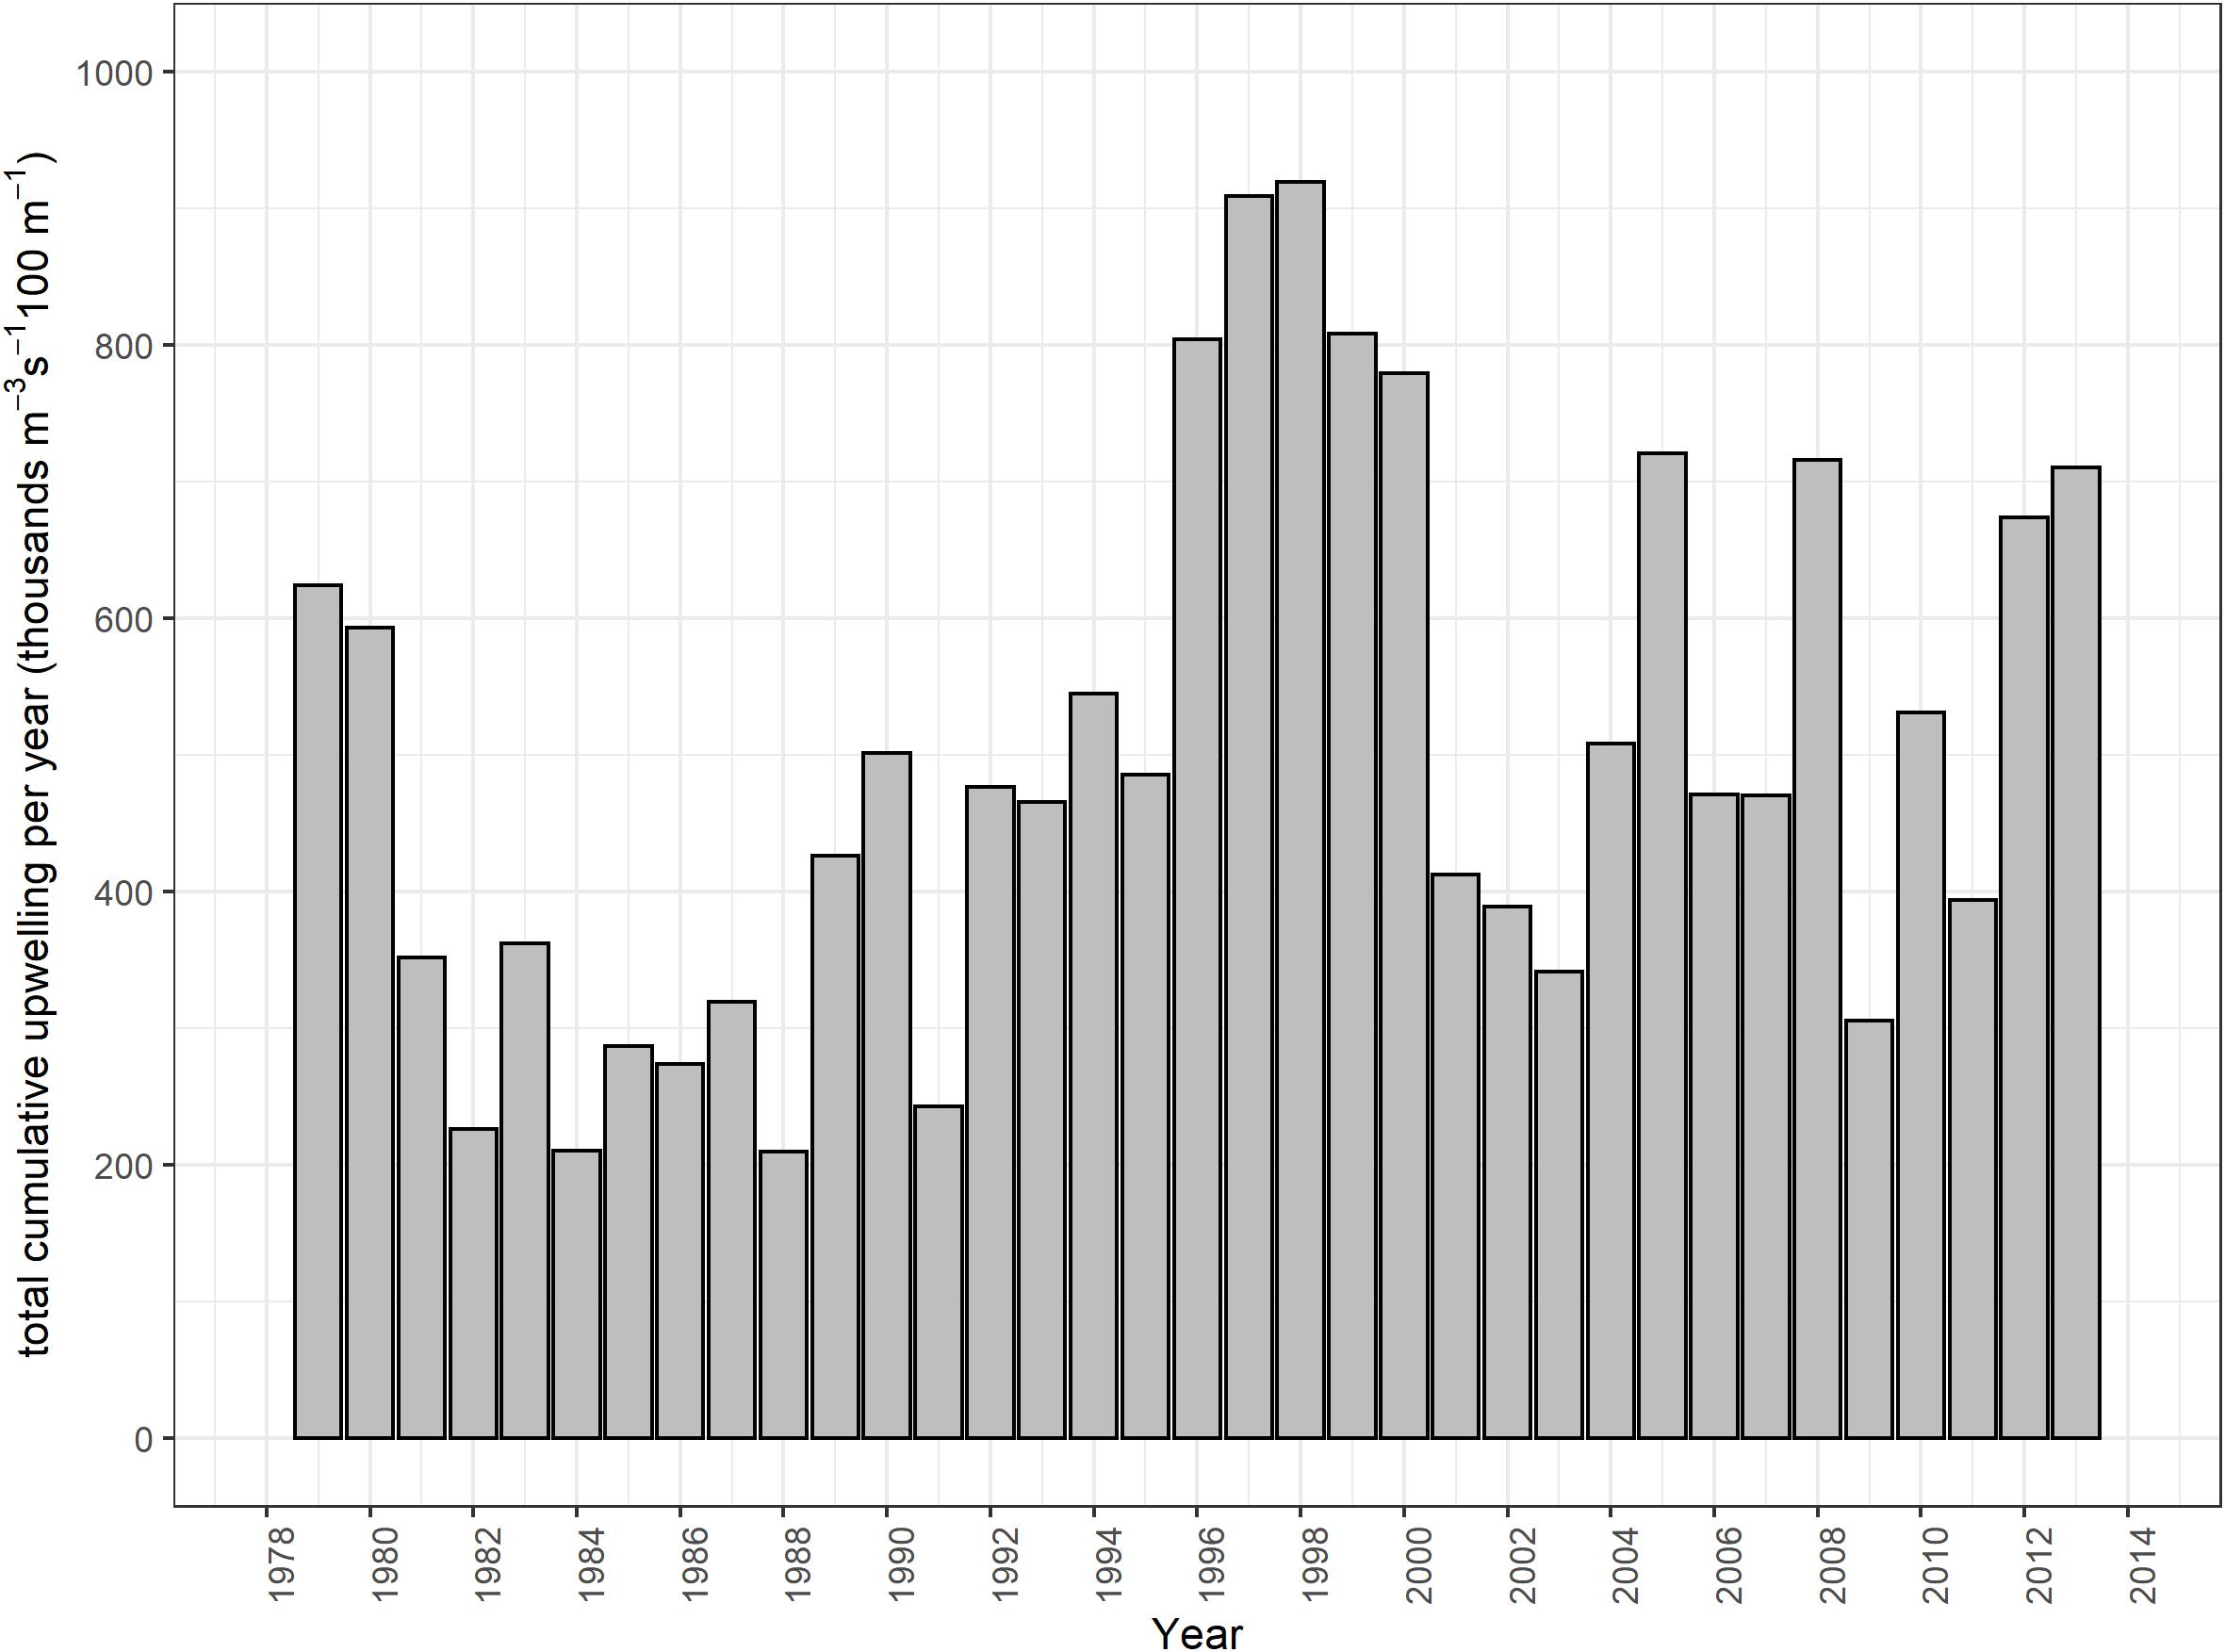
Figure 2. Total cumulative upwelling per year (m–3 s–1 100 m–1) in the Southern Benguela (replotted from Lamont et al., 2018).
Weighting of Time Series Corresponding to Focus Model Groups
An initial weighting of time series was explored in a second fitting process in which sardine, anchovy, penguin, hakes and line fish were all afforded higher weightings (weightings1 in Supplementary Table S8) in an attempt to better capture the ecosystem effects of observed small pelagic fish and key predator dynamics.
Refined Fitting Process to Include Sardine and Anchovy Availability on the West Coast
In order to account for the change in availability of small pelagic fish to predators in the 2000s due to the observed southward and eastward shift that was reflected in several fish resources off South Africa (Watermeyer et al., 2016), spatial change in forage fish availability was modeled as follows:
– A forcing function based on TCU (Upwell) was applied to large-celled phytoplankton production, and vulnerability parameters for predator-prey interactions were estimated,
– A forcing function based on the modeled relative proportion of sardine spawners west of Cape Agulhas (Carryn de Moor, personal communication; Figure 3) was applied to the availability of juvenile and adult sardine to all their predators,
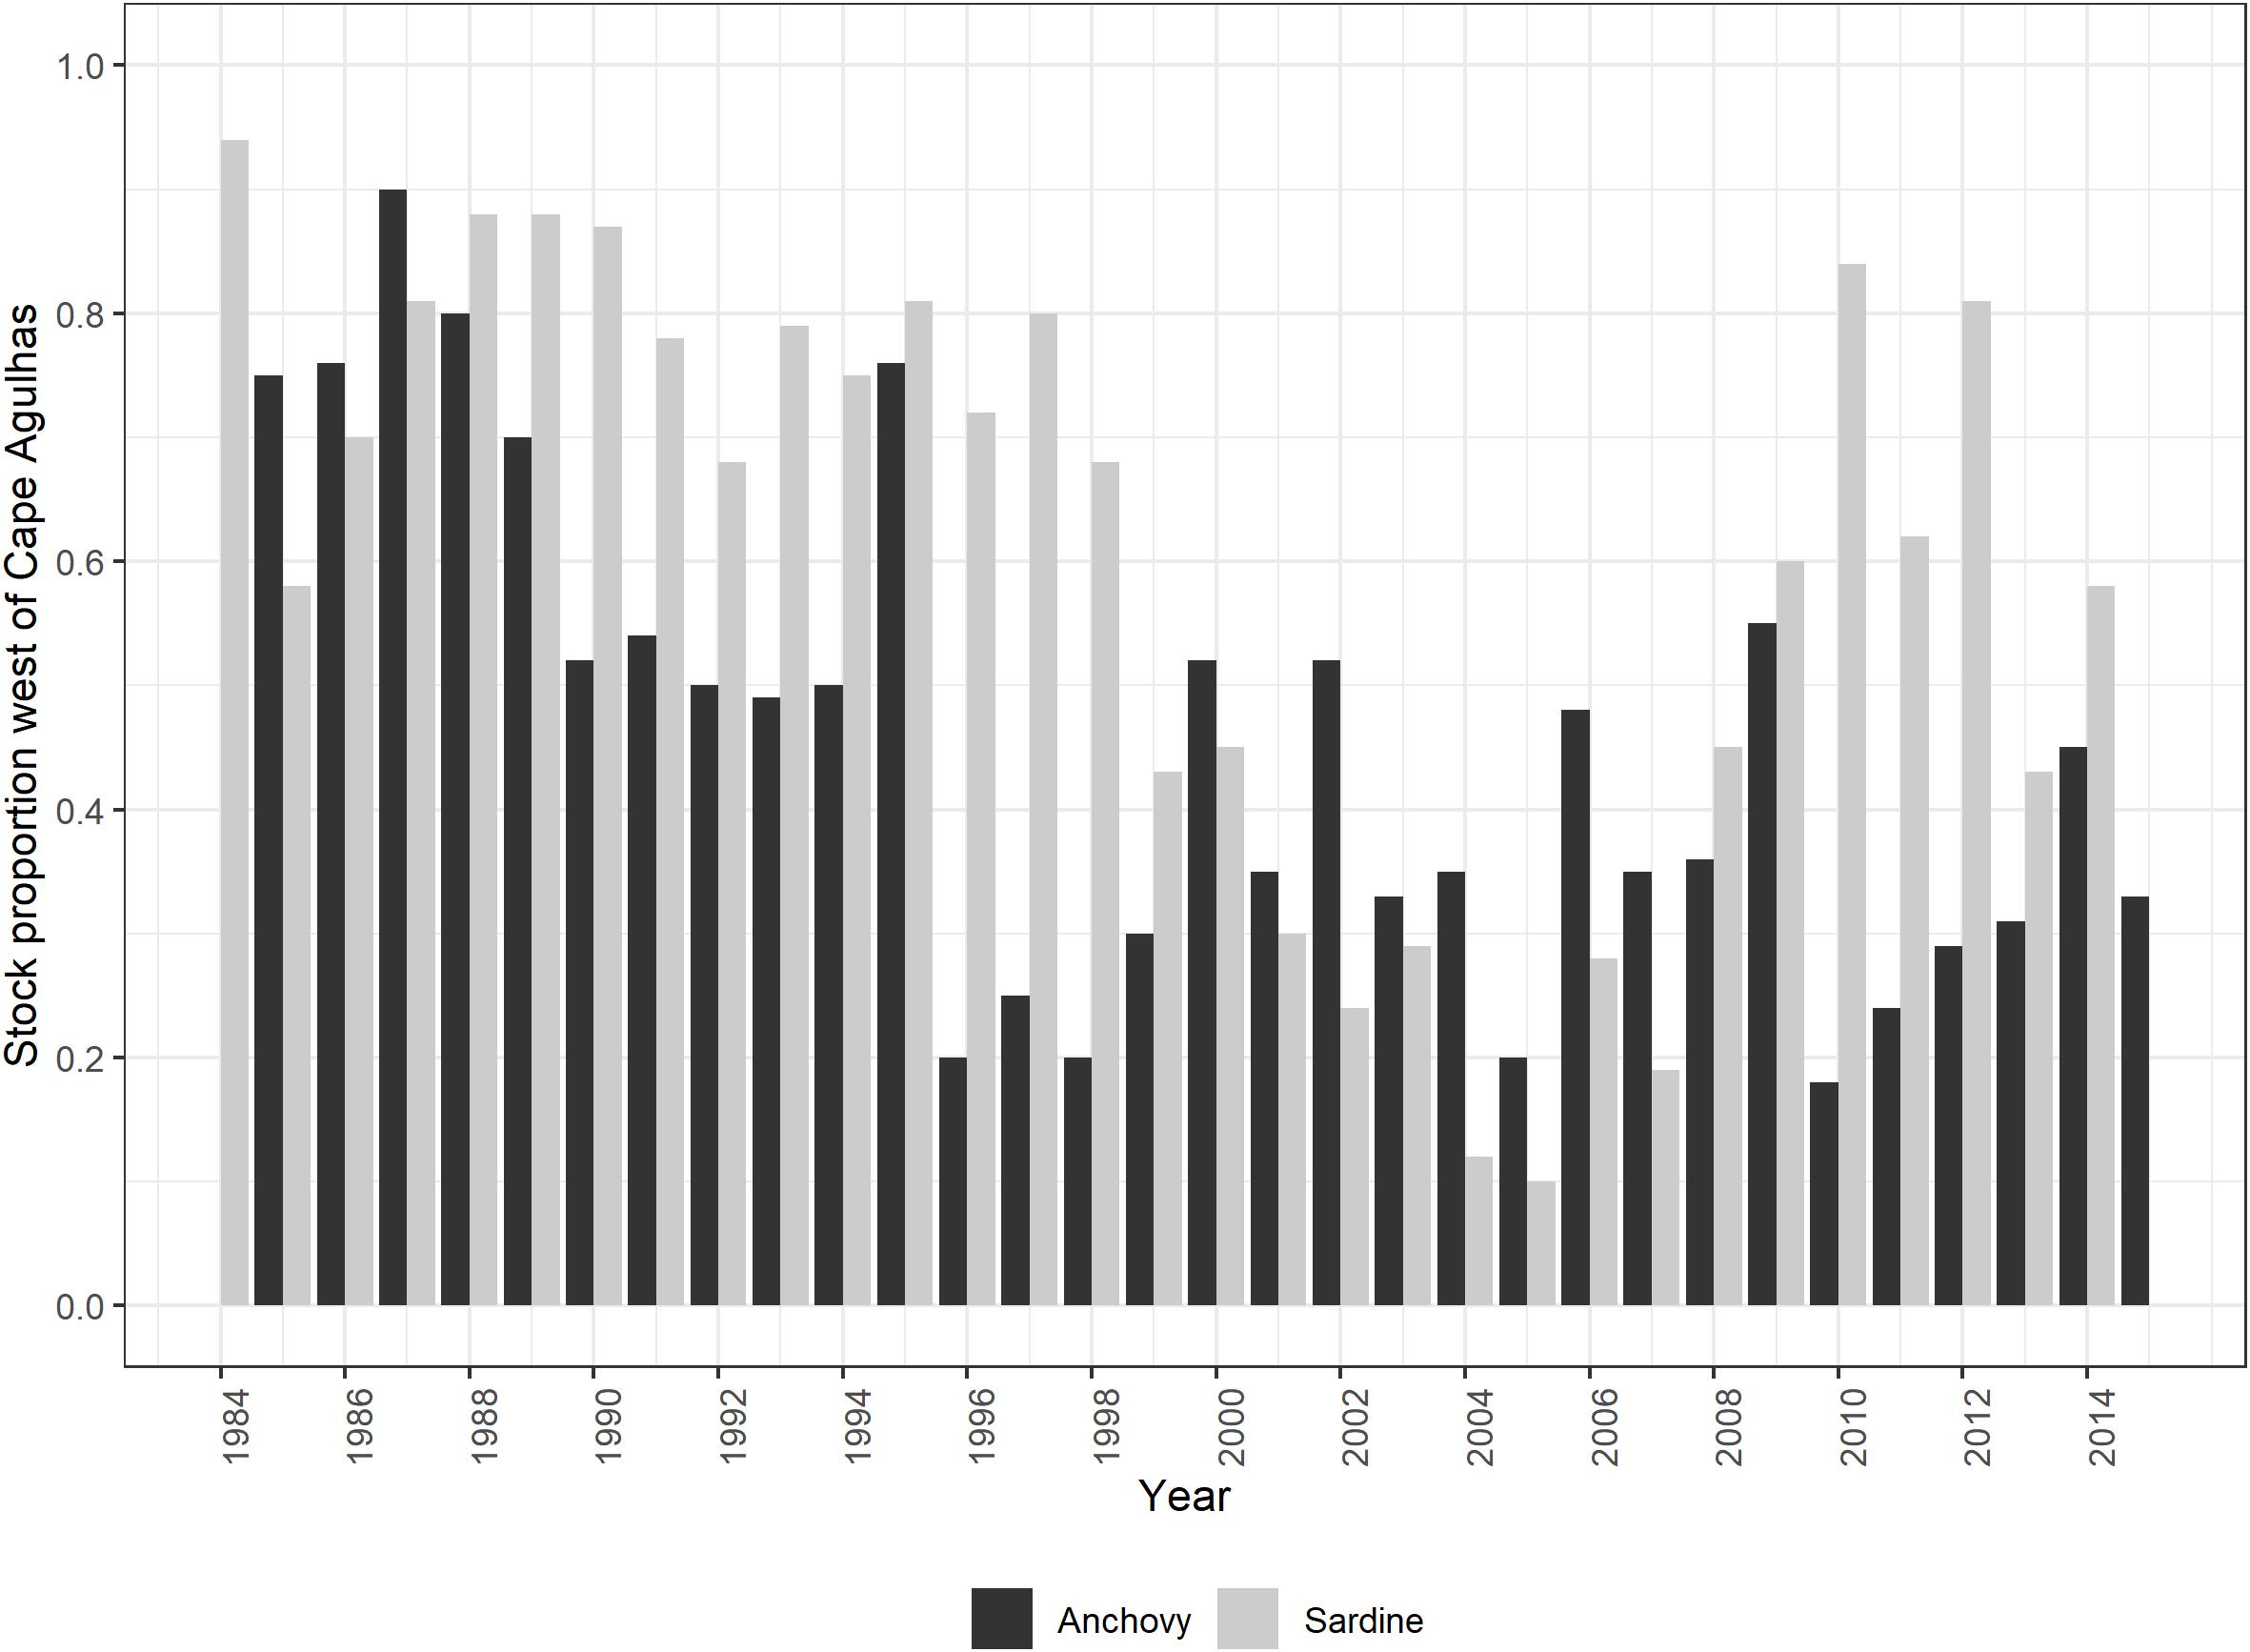
Figure 3. Relative proportion of the total spawner biomass found to the west of Cape Agulhas: based on November survey biomass series for anchovy (from Figure 1 of FISHERIES/2016/JUL/SWG-PEL/22REV2) and model-predicted sardine south coast component in November each year (based on the aforementioned divided by survey bias, Carryn de Moor, personal communication).
– A forcing function based on relative anchovy biomass surveyed in November west of Cape Agulhas (Coetzee et al., 2016; Figure 3) was applied to the availability of anchovy recruits and spawners to all their predators,
– A forcing function based on the Food Availability index of Crawford et al. (2019) was applied to anchovy and sardine availability to their predators and its inverse was applied to affect additional mortality of African penguins,
– Finally, a hypothetical, model-fitted environmental anomaly was incorporated on small phytoplankton to fine-tune model fits, which mainly improved fits of anchovy data series (refer to explanation in section “Initial Sequential Model Fitting Incorporating an Upwelling Anomaly”).
Further Exploring Alternative Weighting of Time Series
Under different weightings of the relative importance of time series in fitting the Southern Benguela model, the following simulation procedure was adopted once the fishing effort/mortality time series had been read in:
– Total cumulative upwelling (Upwell) was used to directly force large-celled phytoplankton production and the most sensitive predator-prey interactions were identified and vulnerability of prey to predators estimated to improve model fit to data series of field observations
– A small, additional, hypothetical environmental anomaly was fitted to small-celled phytoplankton to refine model fits, especially to anchovy biomass data series.
All in all, results of 17 different model fitting scenarios are reported and discussed in an attempt to achieve an acceptable fit of the temporal ecosystem model to observed time series of catch and abundance. In each scenario, factors such as weighting of time series, vulnerability of a prey group to a predator, and environmental anomalies affecting primary productivity were sequentially added in attempts to improve model fit to observations.
Results
The Revised 1978 Southern Benguela Food Web
Parameters (input to the model or estimated by the model) for the revised and updated model of the Southern Benguela ecosystem in 1978 are tabulated (Table 2 and Supplementary Tables S1–S4). As part of the “prebal” process, parameter spread and ecosystem characteristics in terms of flow rates were checked for consistency with general trophic principles and ecosystem characteristics from global models using the Prebal model routine in Ecopath, and found to be consistent with the guiding principles proposed by Link (2010) and Heymans et al. (2016) (for details, see Supplementary Material section 6). The trophic flow diagram summarizes the complex trophic web between trophic level 3 and 5, reflecting the importance of forage fish for a diverse assemblage of predatory species in this system (Figure 4). A discrepancy between isotope-derived and stomach content-derived estimates of trophic levels of anchovy, sardine and redeye in the Benguela was previously noted by van der Lingen and Miller (2011). Isotope studies showed greater trophic separation between redeye and the other two species in the period 2008–2010, than between anchovy and sardine, whereas assumed diet compositions previously modeled redeye to be feeding from a similar trophic level to anchovy (Shannon et al., 2003, 2004a). In the current revised model where anchovy are modeled in two stanzas each (Supplementary Table S1), anchovy recruits are feeding low in the food web (at the same level as juvenile sardine, Table 1), whereas adult anchovy are feeding higher but still slightly lower in the food web than redeye, so that overall, anchovy and redeye comparisons are more in line with the initial isotope studies. It should be noted that trophic levels are dynamic, and those of small pelagics depend greatly on the structure of the phyto-and zoo-plankton communities over the period being examined. For example, simply comparing modeled trophic levels between the 1978 base model and the end of the fitted period, viz. 2015, we see that the trophic level of small pelagics can vary by up to 21% (detailed results not shown).
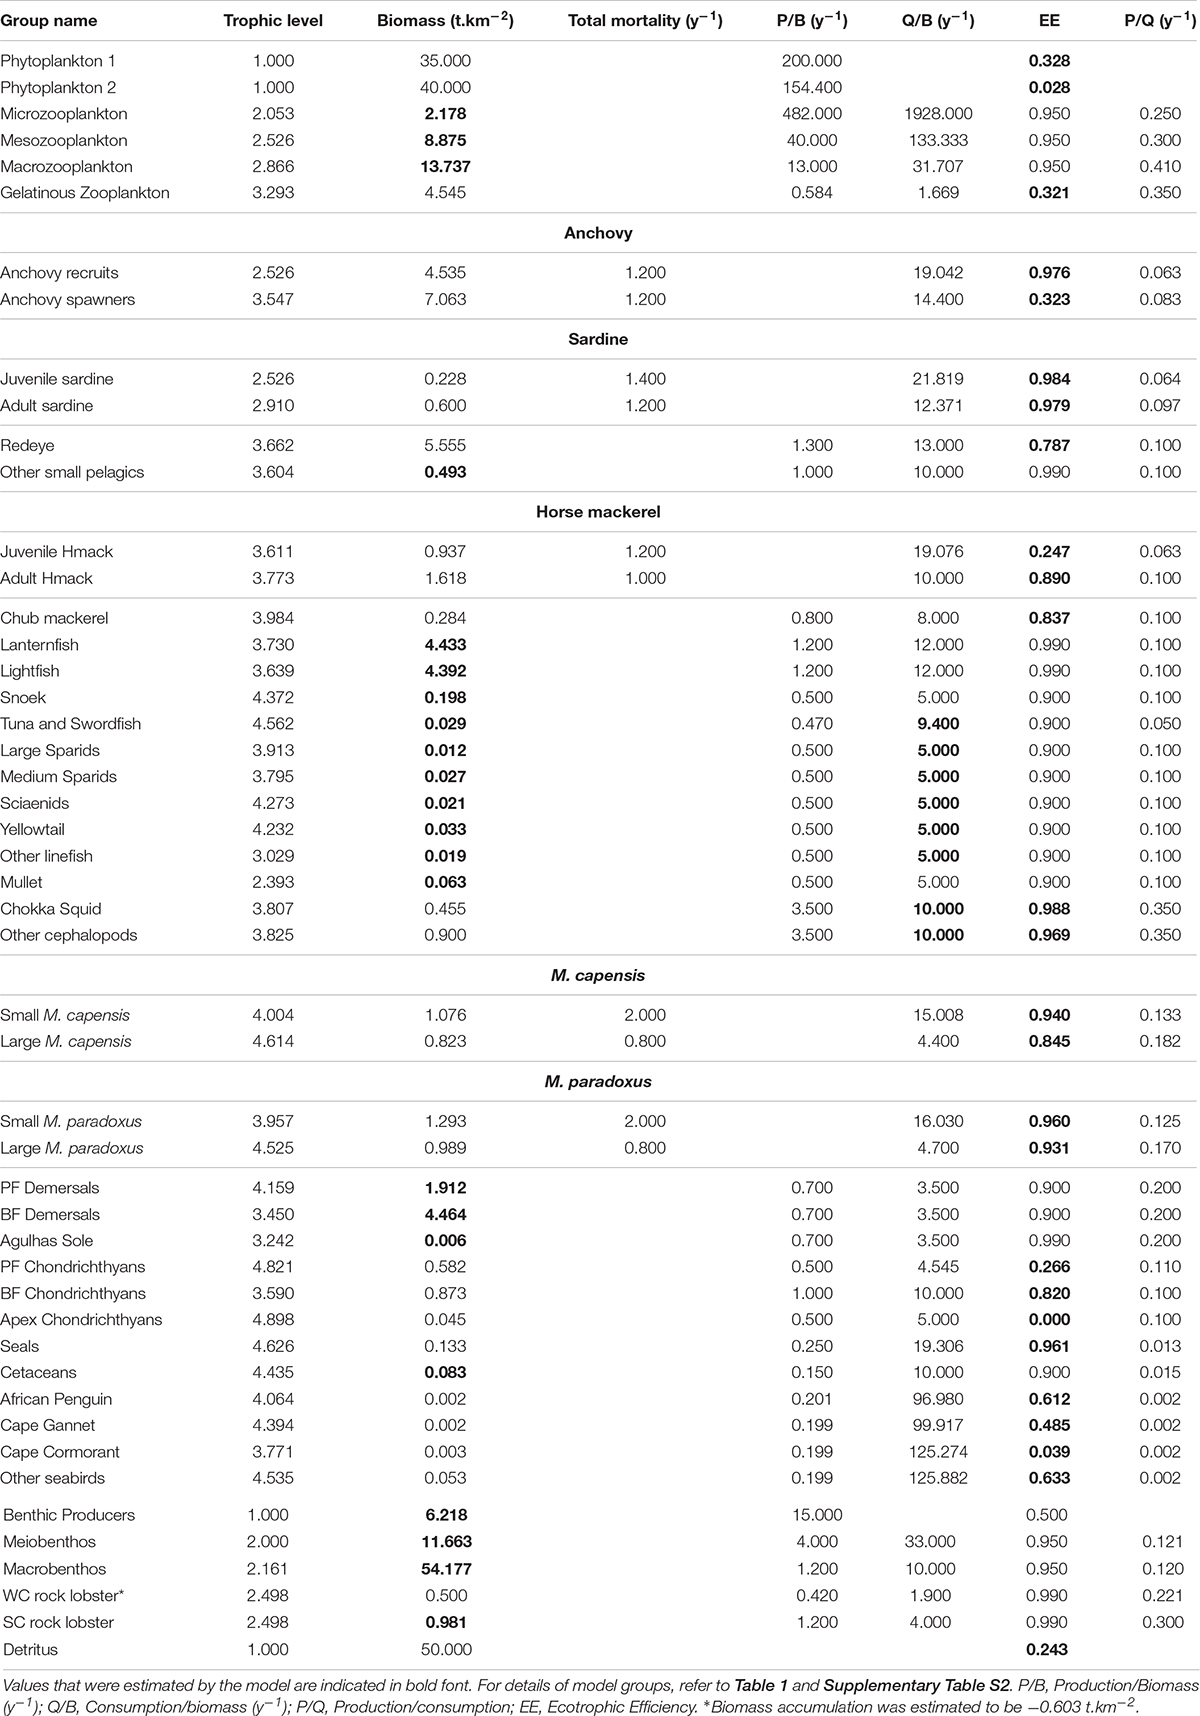
Table 2. Balanced parameters for the revised model of the Southern Benguela in 1978.
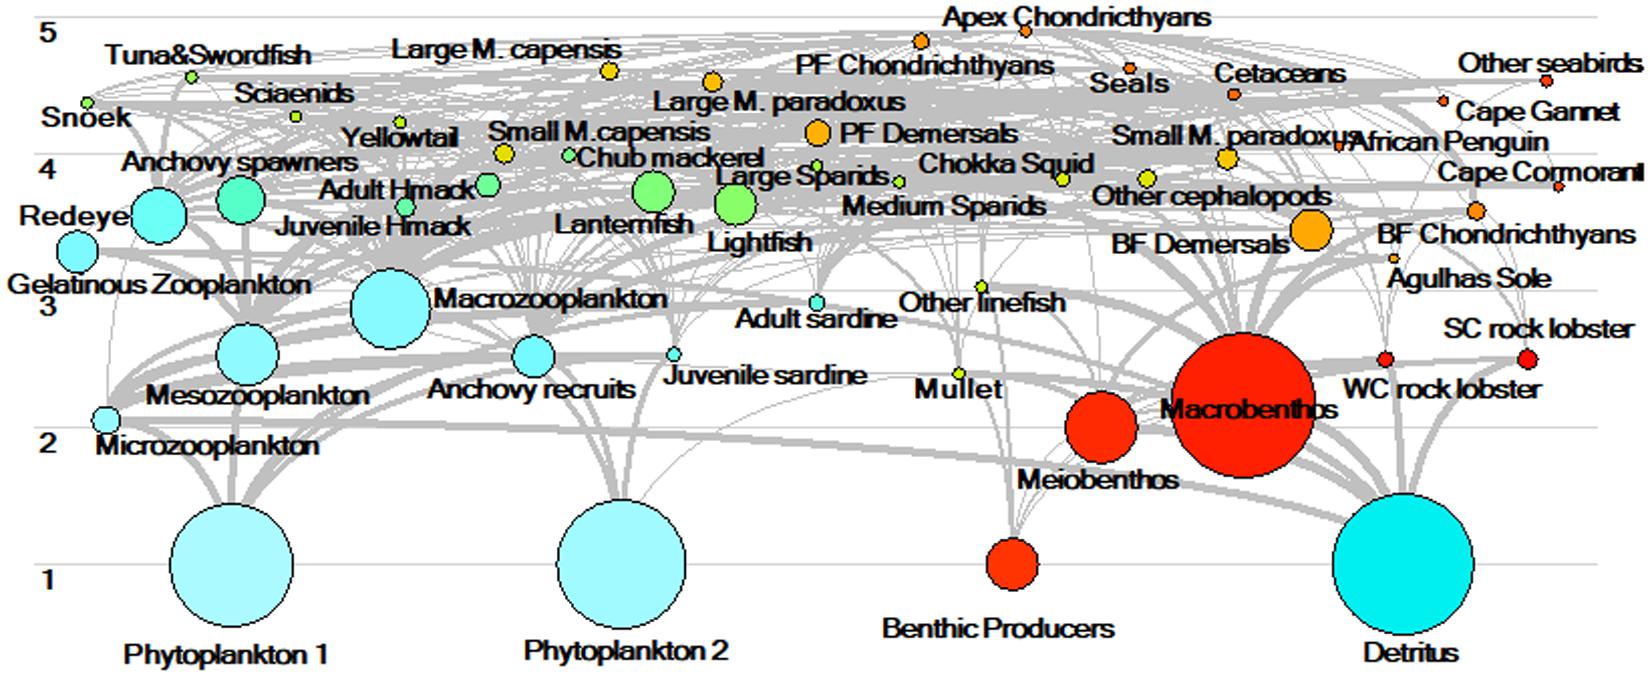
Figure 4. Schematic of the trophic flows through the Southern Benguela food web estimated for 1978. Circles representing functional groups and are proportionally scaled according to biomass in 1978.
Fitting the Model to Data Time Series
Through automated, stepwise fitting, the “best” model [lowest Akaike information criterion (AIC) and Sum of Squares (SS)] was obtained when fishing was incorporated, vulnerability estimates for the 40 most sensitive predator-prey interactions made, and an environmental anomaly with 18 spline points estimated and applied to the small phytoplankton model group to improve model fits to time series data. These numbers of vulnerabilities and spline points were used in subsequent model fitting as reported below. The time series were given equal weightings in this exploratory, automated model fitting (scenario 1, Table 3).
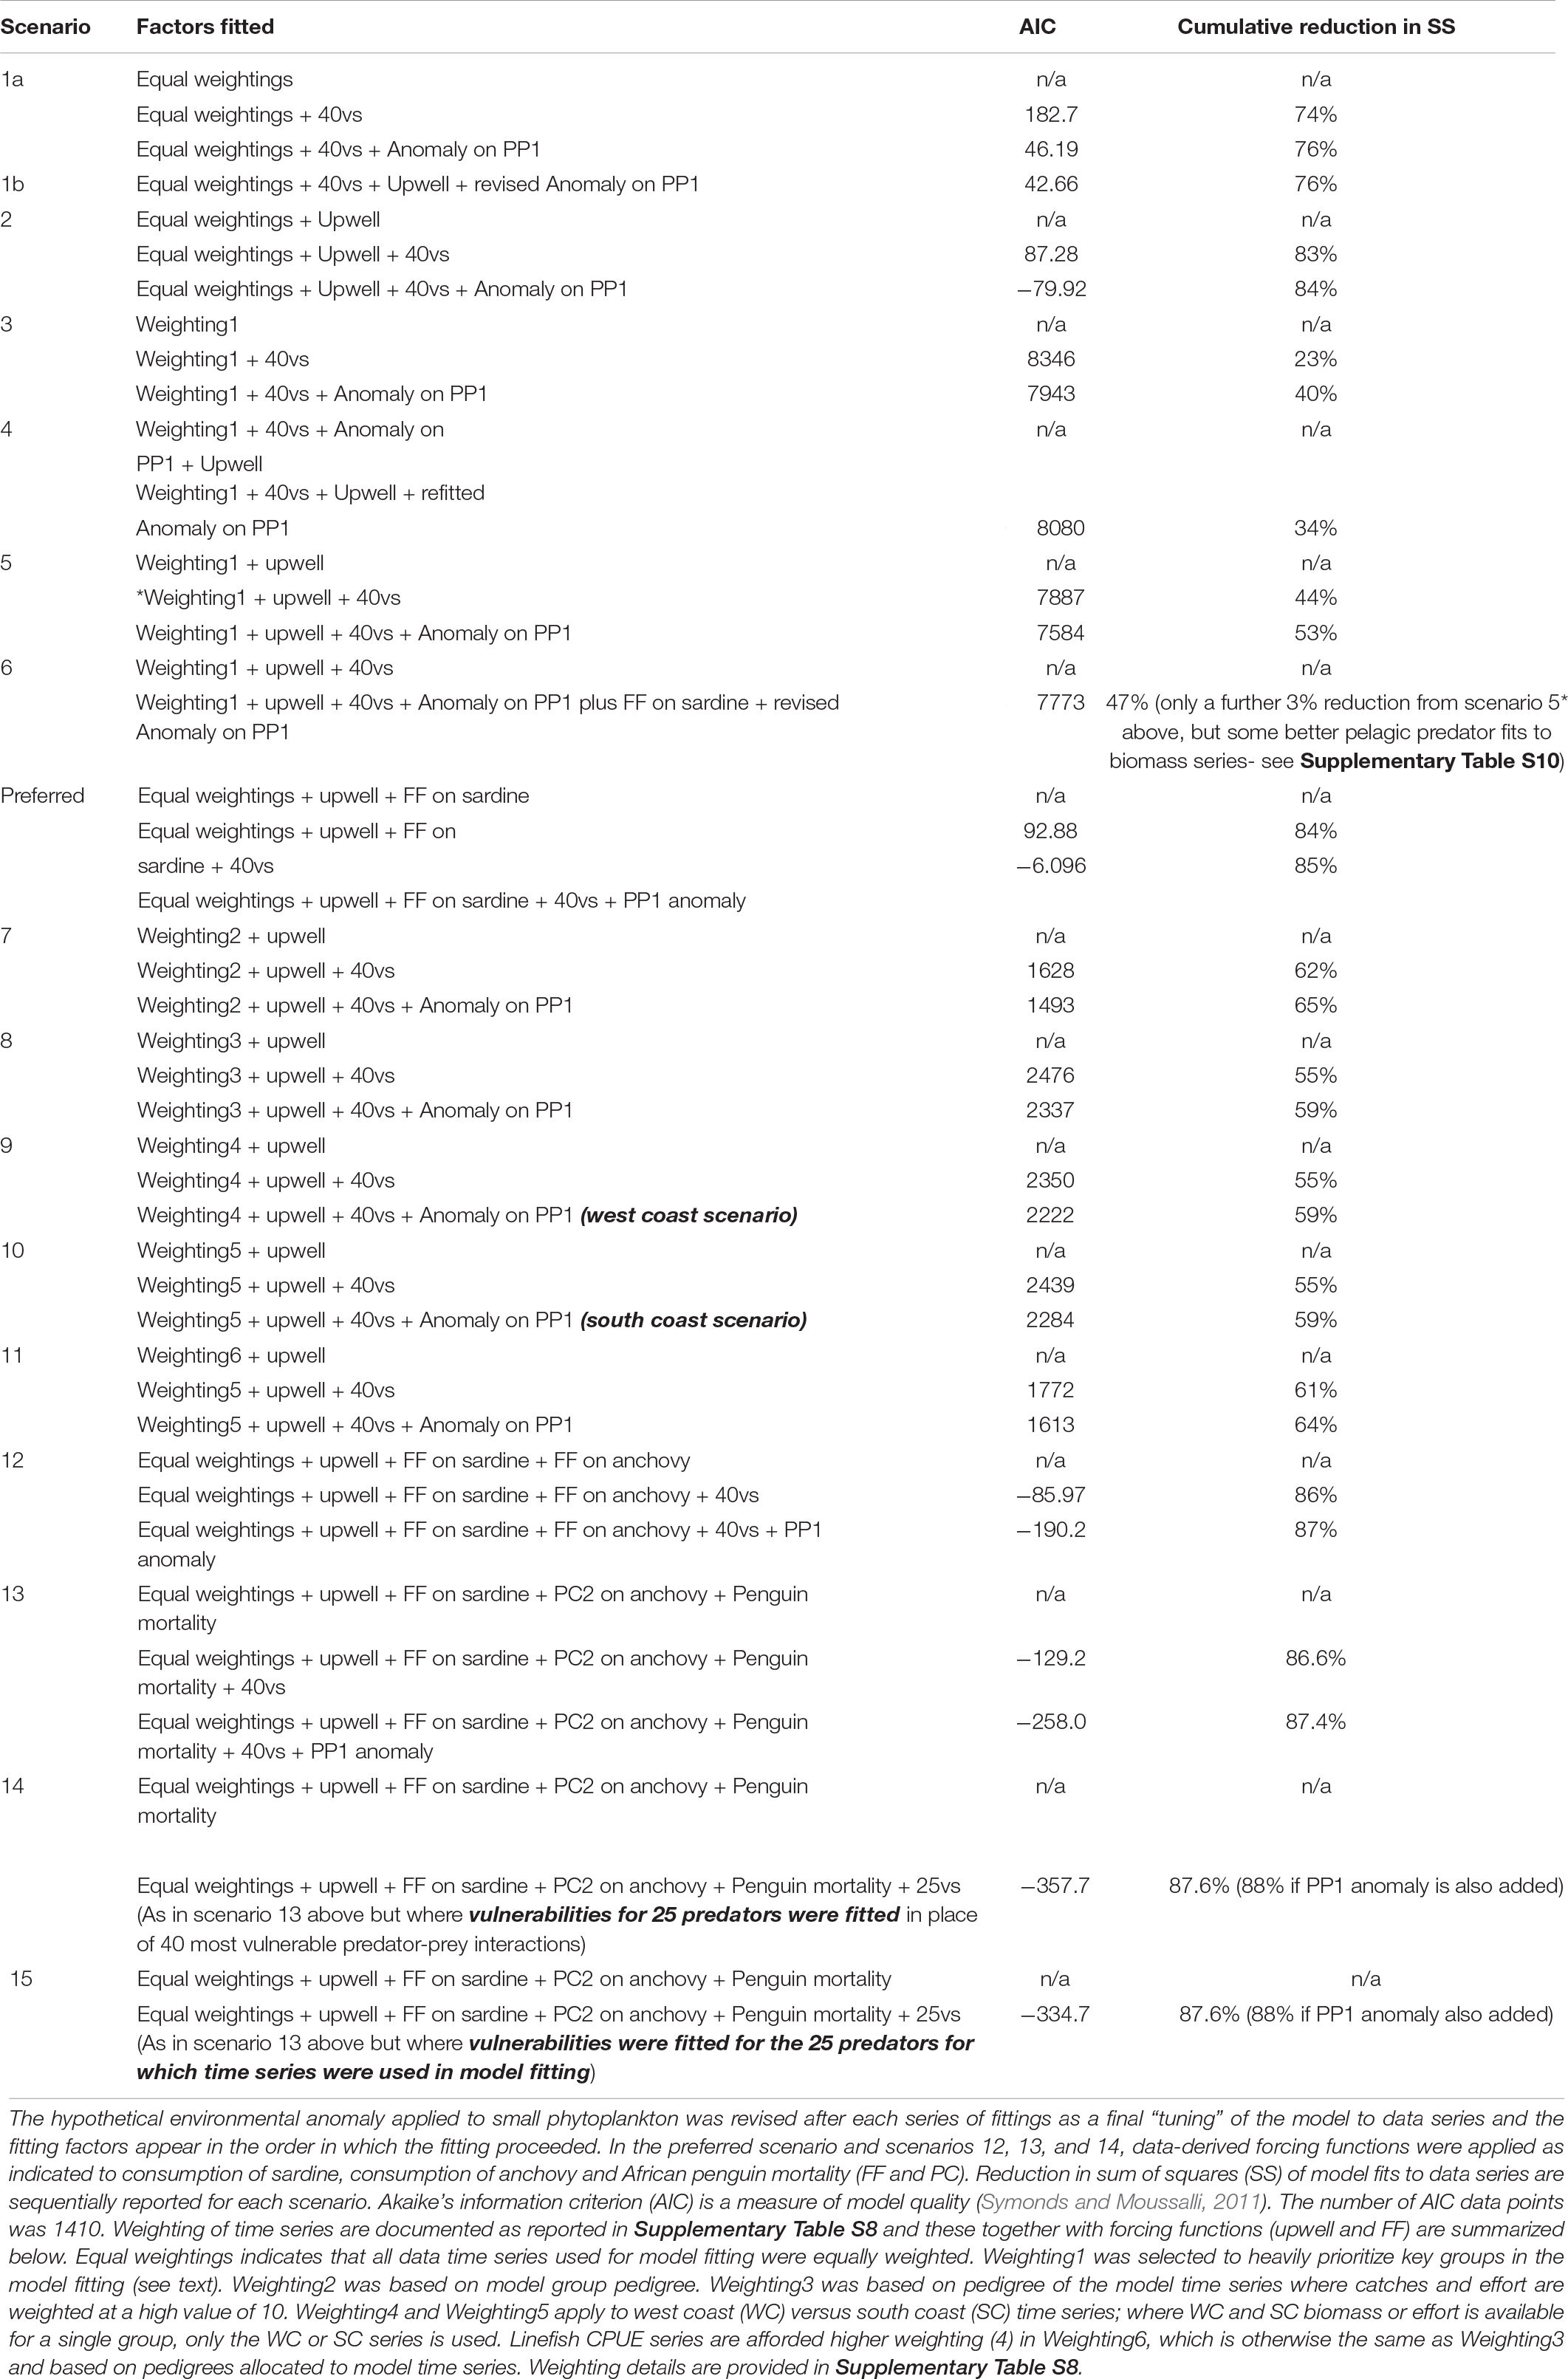
Table 3. Scenarios examined to improve model fit to data, when the data-derived upwelling anomaly (upwell – see footnote) is applied to large phytoplankton (apart from in Scenario 1), 40 vulnerabilities are fitted for the most influential predator-prey interactions (40vs) and a hypothetical environmental anomaly (18 spline points) is applied to small phytoplankton (Anomaly on PP1).
Initial Sequential Model Fitting Incorporating an Upwelling Anomaly
With Total Upwelling used to force large-celled phytoplankton production, estimating vulnerabilities for the 40 most sensitive predator-prey interactions enabled SS to be reduced by 83% (under equal weighting of time series, scenario 2, Table 3). Nevertheless, fits of birds and large pelagics were not good (plots not shown).
Weighting of Time Series Corresponding to Focus Model Groups
As intended, the weighting strategy aimed to improve pelagic fish-predator model representation (weightings1 in Supplementary Table S8) improved model fits to most line fish data series as well as to the endangered African Penguin. When fishing effort series alone drove temporal dynamics of model groups, the overall model fits were still poor for most groups, but were reduced by 44% (scenario 5, Table 3) when vulnerability of prey to predators was fine-tuned (for the 40 most sensitive interactions) under observed fisheries and total upwelling driver series. A further 9% reduction in SS was achieved when a hypothetical anomaly was fitted to small phytoplankton, yielding an overall reduction of 53% in sum of squares (Table 3). As expected, model fits were not improved to the same extent when vulnerabilities were tuned before upwelling was incorporated (scenario 4).
Refined Fitting Process to Include Sardine and Anchovy Availability on the West Coast
The simple sardine availability function applied to sardine-predator interactions assuming equally weighted time series (preferred scenario) yielded the same% reduction in SS of model fits to data series as obtained under Scenario 2 (85% SS reduction, Table 3). However, closer inspection of model plots (Figure 5) showed that modeled anchovy and sardine adults and recruit series were up to 37% better correlated to data series in the preferred scenario than without the sardine availability function (Supplementary Table S9). Similarly, African penguins and adult hake of both species showed greatly improved model fits to data. Most model linefish groups on the west coast correlated more closely with data when sardine availability function was included, but this was not the case for some south coast linefish groups; only large sparids on the south coast improved in model fit.
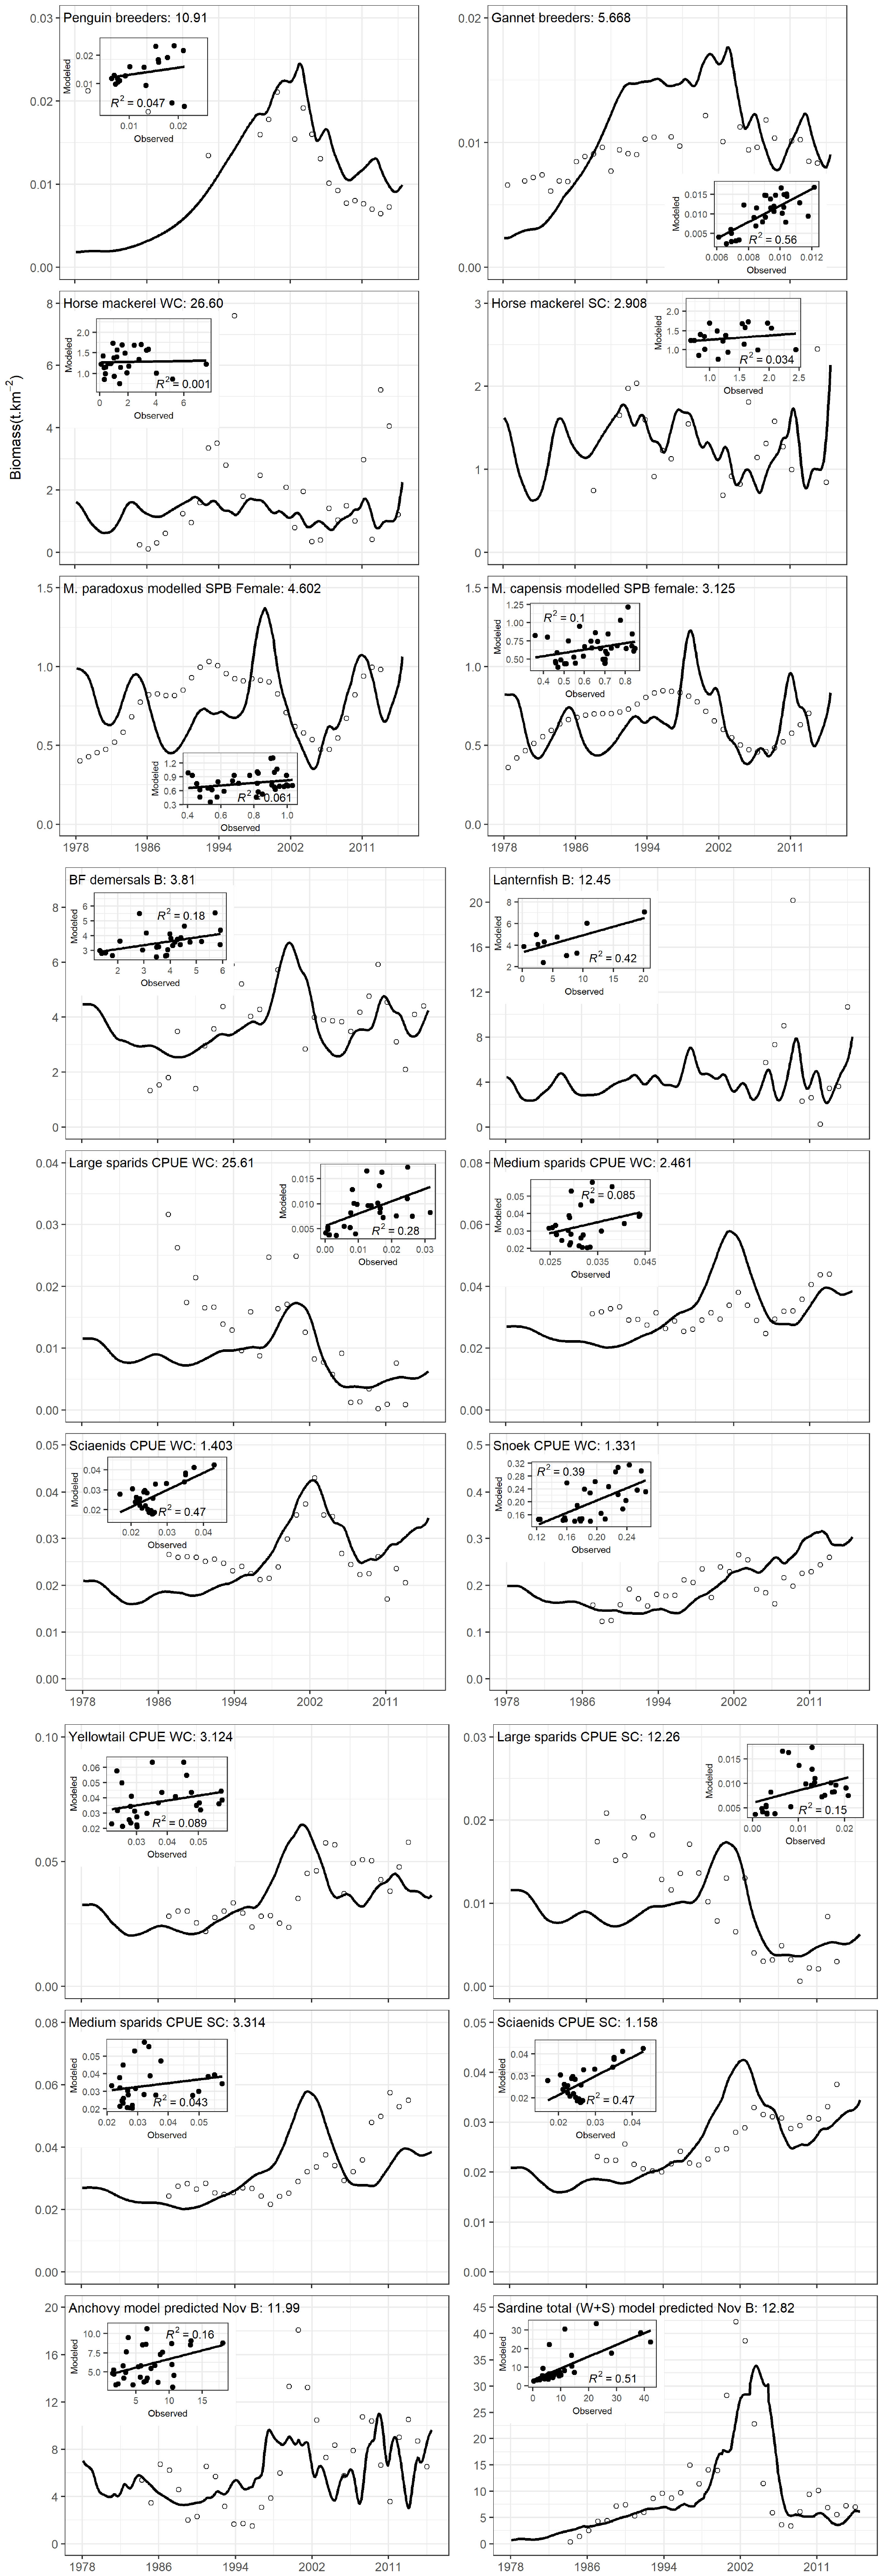
Figure 5. Model fits of anchovy and sardine, and predators dependent on them in the preferred model fitting scenario. The contribution of each group to model sum of squares is provided on the plots. The figure is split into three sections to facilitate inclusion of scatterplots for each model-observation time series pair, and the R2 of each correlation is provided.
By contrast, under weighting1 to strengthen importance on focus model groups (weighting 1 in Supplementary Table S7; Scenario 6 in Table 3), SS of fits of the model to time series was reduced by only 47% (Table 3). However, model fits to data were improved for several sardine predators, in particular penguins, adult M. paradoxus and yellowtail which increased in model-data correlations by 39, 80, and 71% respectively (Supplementary Table S10). Nevertheless, model fit to data series for anchovy and sardine, and several other predators deteriorated despite efforts to enhance these groups by heavier weighting of their data time series.
When, in addition to a sardine availability function, an availability function was applied to anchovy consumption across all predators, based on the proportion of anchovy spawner biomass surveyed west versus south of Cape Agulhas (Coetzee et al., 2016), model fits to data series of anchovy and sardine recruits, medium sparids and yellowtail improved (Table 3, scenario 12 and Supplementary Table S11). However, model fits to anchovy and sardine spawner biomass, penguins, adult hake, large sparids and sciaenids were much poorer (Supplementary Table S11 and Supplementary Figures S3, S4).
Extensive model scenarios (details not shown) were run in an attempt to best incorporate information contained in the Food Availability Index of Crawford et al. (2019). Initially, a forcing function based on this index was applied only to sardine and/or anchovy – bird interactions, but model fits were most improved when the simple sardine availability index used in the previous scenarios was retained, the Food Availability Index (Crawford et al., 2019) applied to availability of anchovy across all model predators, and the inverse of this function applied to “other mortality” of African Penguins (Scenario 13, Table 3). However, although incorporation of this index in this way greatly improved model fits to data series for penguins and medium sparids on the south coast, and to a lesser extent for gannets, fits were poorer for most other groups in this scenario (Supplementary Table S11 and Supplementary Figures S5, S6).
Further Exploring Alternative Weighting of Time Series
Model trajectories of biomass and landings outputs for 1978–2015 were compared to time series (Supplementary Table S5) of catches, biomass (with the exception of survey-based spawner biomass series for anchovy and sardine, as above) and mortality time series, and model AIC and Sum of Squares (SS) (Table 3) as well as data-model plots per functional group (not shown apart from the “preferred scenario” in Figure 6) were examined for different time series weightings. None of the selected and carefully reasoned time series weighting scenarios improved overall models fits; SS of model fits to data were reduced by a maximum of 65% in scenario 7 (weighting2 based on model pedigree), and 64% in scenario 11 (weighting6 in which linefish CPUE series are afforded higher weighting), compared to an 84% and 85% reduction in SS respectively in scenario 2 and the preferred scenario, both of which assume equal weighting of time series. Furthermore, including only west coast series or only south coast series for model groups where coast-disaggregated series were available did not improve model fits overall either (SS reduction remained at 59%, scenarios 3–5, Table 3).
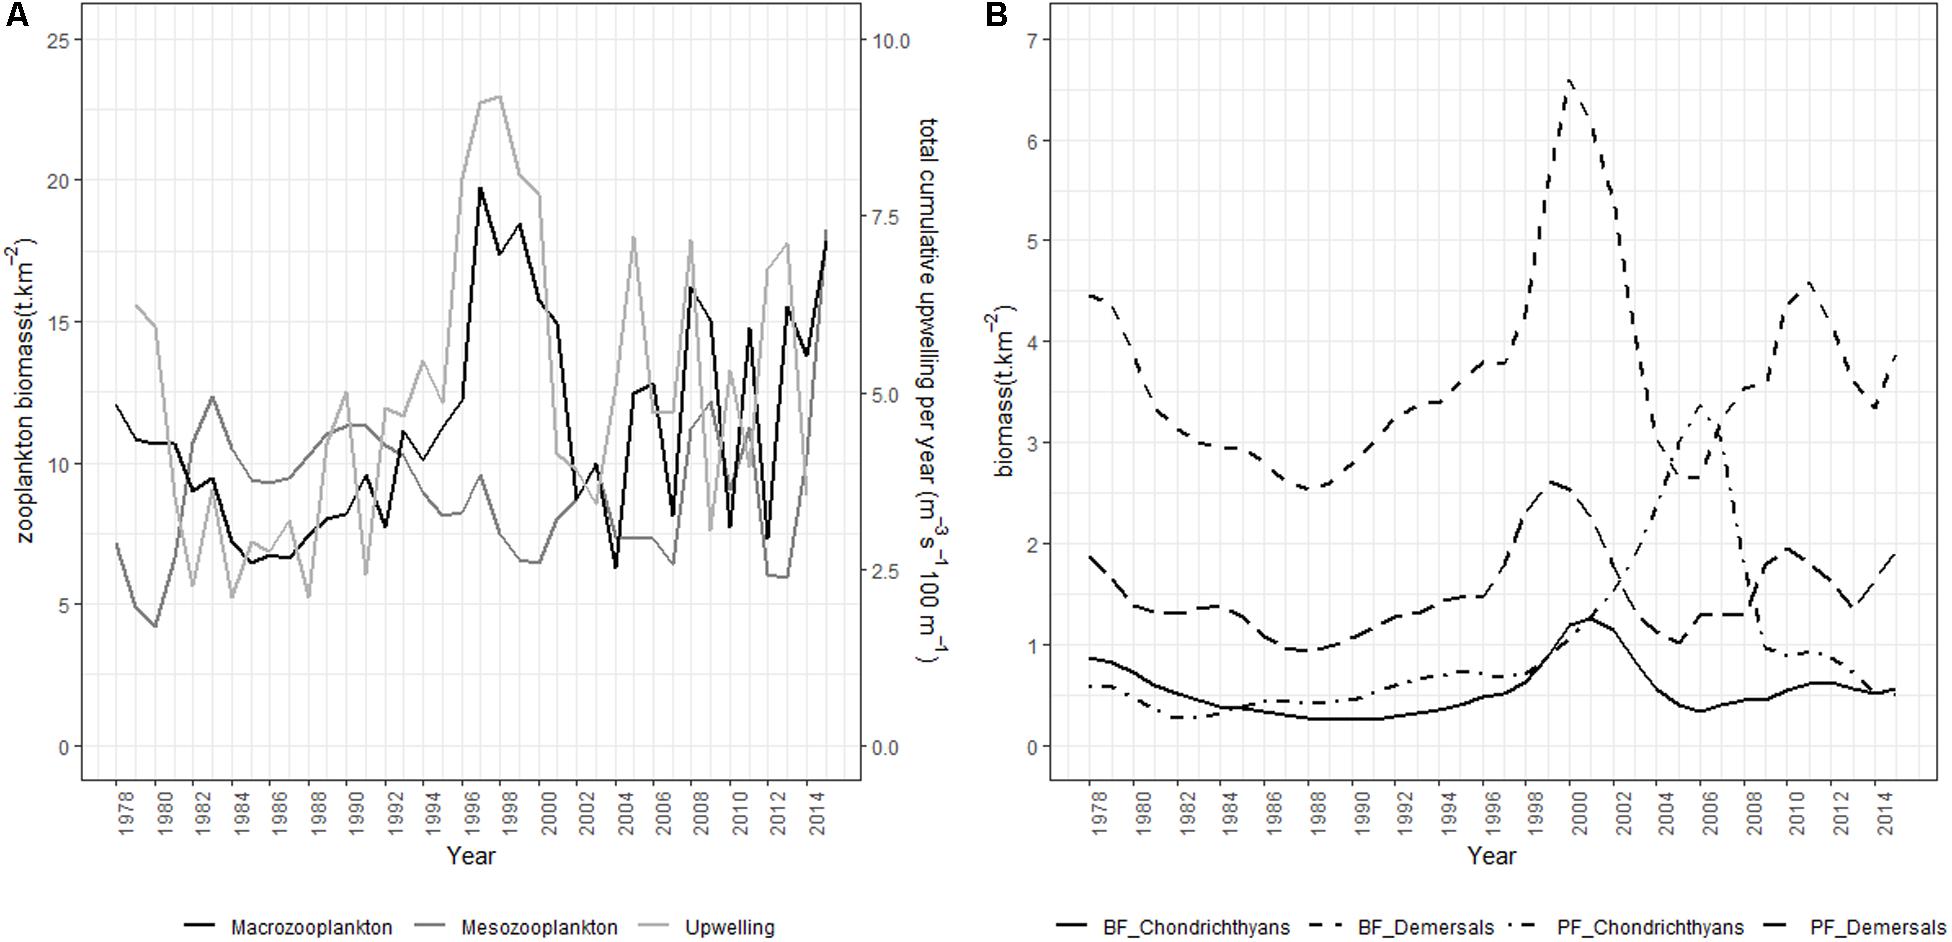
Figure 6. Model trajectories from the preferred Southern Benguela model fitting scenario showing (A) meso-and macro-zooplankton dynamics in relation to total cumulative upwelling, and (B) demersal and chondrichthyan stock dynamics.
Where indicated by upwell, a forcing function is applied to large phytoplankton based on Lamont et al. (2018) cumulative upwelling series (Table 3). In the preferred scenario and scenarios 12 and 13, forcing factors derived from the proportion of sardine and anchovy respectively modeled or surveyed west of Cape Agulhas (Coetzee et al., 2016; Carryn de Moor, personal communication) are applied to juvenile and adult sardine and anchovy interactions with their predators (FF). In scenario 13, a forcing function/its inverse derived from the Food Availability Index of Crawford et al. (2019) is applied to juvenile and adult anchovy consumption by predators/African penguin mortality respectively (PC2).
Flow Control
Sardine dominated 40% of the 40 most sensitive predator-prey interactions searched for during model fitting. Vulnerability estimation found sardine to exert top-down flow control on small phytoplankton, whereas microzooplankton exerted bottom-up control on sardine in model fitting (Supplementary Table S12). In the absence of any forcing functions, model fitting requires that sardine and anchovy control microzooplankton trophically. Bottom–up control emerged for sardine on Sciaenids, African penguins, Cape gannet, Cape Cormorant and other seabirds (Supplementary Table S12). Several predators exerted top-down control on sardine, including horse mackerel, yellowtail, small hake, other cephalopods and pelagic-feeding chondrichthyans. No interactions between anchovy and its predators were found when searching for the 40 most sensitive predator-prey interactions with or without environmental forcing incorporated into the model fits (Supplementary Table S12 and others not shown). An additional two vulnerability scenarios were explored in which the same vulnerability setting was applied to interactions between a specific predator and all its prey groups. Firstly, vulnerabilities were fitted for 25 predators in place of the 40 most sensitive predator-prey interactions (scenario 14). In a second instance, vulnerabilities were fitted for the 25 predators for which time series were used in model fitting (scenario 15). These scenarios yielded poorer model fits of the key species anchovy and sardine, and unrealistic trajectories of tuna and swordfish in recent years, despite large reduction in overall model SS (Table 3). Further, model fits in scenario 14 were poorer for sciaenids, snoek, horse mackerel and hake. Nevertheless, fitted vulnerabilities in the first instance suggested bottom-up flow control for Sciaenids, African penguin, Cape gannet and deep-water hake, and top–down by yellowtail, snoek, small shallow water Cape hake and chondrichthyans, in good agreement with the 40v-scenarios modeled. In the second instance, bottom-up flow control was estimated for anchovy, sardine juveniles, horse mackerel, lightfish, large hakes, demersal fish, chokka squid and Cape gannet, whereas chub mackerel, adult sardine, lanternfish, snoek, yellowtail, small shallow-water Cape hake and African Penguins were estimated to exert top-down control on their prey. The outliers here compared to previous scenarios are top-down control by African penguin (v = 19) and lanternfish (V > 1000), suggesting these two groups may be far from their carrying capacities in this model configuration.
Discussion
To date, the dual, interacting contributions of both fishing and environmental variability in driving observed dynamics in the Southern Benguela ecosystem have been highlighted by means of ecosystem modeling (Shannon et al., 2004b; Travers-Trolet et al., 2014; Ortega-Cisneros et al., 2018b) and using survey-based (Shannon et al., 2010) and modeled-derived (Fu et al., 2018) indicators. Building on previous Ecosim modeling (Shannon et al., 2004a, 2008; Smith et al., 2011), a more detailed disaggregation of the southern Benguela food web was possible given the more extensive abundance and catch time series data available. These expanded data series were used to improve the model resolution of the Southern Benguela ecosystem, and to further explore food web processes underpinning observed ecosystem dynamics. In our study, internal model food web dynamics were modeled in two ways, namely by means of parameterizing predator-prey interactions described in terms of vulnerabilities of prey to predators, and by means of direct forcing of sardine and anchovy availability to its predators. These internal predator-prey dynamics are themselves affected by, and interact with, both environmental and fishing drivers. Here, estimated fishing effort series were used to drive over half of the 31 model fishing fleets, and upwelling effects were modeled by forcing applied to large phytoplankton production. Together, modeling these three key drivers produced model ecosystem dynamics that compared favorably to several of the observed catch, abundance and mortality time series data available for the Southern Benguela.
To elaborate further, reasonable overall fit of small pelagic predators to available catch and abundance time series data was obtained by (i) allocating equal weightings to all time series used (while excluding modeled anchovy and sardine recruitment in billions, and excluding coast-specific modeled anchovy and sardine November biomass series), (ii) incorporating an upwelling anomaly based on annual means of TCU reported in Lamont et al. (2018) applied to large phytoplankton productivity, and iii) applying a forcing function derived from the relative proportion of sardine spawner biomass on the west coast (based on Coetzee et al., 2016, modified to account for survey bias, Carryn de Moor, personal communication) to modify availability of sardine (juveniles and adults) to predators. Subsequently, the 40 most sensitive predator-prey interactions were parameterized in terms of vulnerability to predation, to improve model fits. Finally a small, model-estimated hypothetical forcing function was fitted to small phytoplankton in lieu of non-specified environmental variability, in an attempt to further improve model fit to data series.
Upwelling intensity and variability both increased on the west and south coasts of South Africa in the first part of the 1990s (Blamey et al., 2012). Upwelling drives productivity in the Benguela, affecting prey abundance of fish and top predators (Hutchings et al., 2009), specifically mediated through small pelagic fish which link plankton productivity to predators in upwelling food web (e.g., Cury et al., 2000; Roy et al., 2001). van der Sleen et al. (2018) successfully fitted a GAM model to describe the relationship between anchovy recruitment and the December-March cumulative upwelling in the southern Benguela. In our modeling study, this same upwelling index, averaged annually (Lamont et al., 2018), was incorporated through forcing of large phytoplankton productivity, which feeds through the model food web via zooplankton dynamics. Copepod abundance on the west coast of South Africa increased between 1950 and the late 1990s, likely reflecting reduced predation pressure by small pelagic fish over the period, together with long-term intensification of coastal upwelling (Verheye and Richardson, 1998; Verheye et al., 1998). Between 1988 and 2003, a decline in abundance of large copepods was measured off South Africa, with a concomitant increase in abundance of small copepods (Huggett et al., 2009), likely related to both offshore warming and increased predation pressure exerted by small pelagics in the early 2000s when forage fish abundance was unusually high (Hutchings et al., 2009). In our non-spatialized model, small copepods are included in the mesozooplankton model group, which indeed showed a three-fold increase between 2000 and 2015, as well as a slight long-term increase over the modeled time period (1978–2015) despite west and south coast trajectories not being separated in our model (Figure 6A).
Southern Benguela ecosystem dynamics were fitted for the period 1978 to 2015, spanning the period of ecosystem changes including ecosystem regime shifts. Since the 1980s, declines and geographical shifts in distribution have been observed in several species off South Africa, and have been related to fishing and environmental changes (Blamey et al., 2014). For example, as recommended by Griffiths (2000), line fishing effort was severely reduced from 2000 onward following declaration of an emergency in this fishery. There have been indications that silver kob Argyrosomus inodorus and carpenter Argyrozona argyrozona are responding positively to reduced catches (Winker et al., 2013). These trends are captured by increasing Ecosim model abundances of Sciaenidae and medium Sparids respectively (Figure 5). Demersal fish off South Africa’s west coast have exhibited changes over time, with indications of ecosystem shifts in the early 1990s and mid-2000s (Atkinson et al., 2011). These authors found increases in some fast-growing species of eels and fish, and declines in slow-growing, long-lived species such as chondrichthyans, attributing the changes to environmental drivers (temperature being the key) in combination with indirect trophic effects of fishing (Atkinson et al., 2011). In the fitted Ecosim model, increases in benthic-feeding and pelagic-feeding demersal fish and pelagic-feeding demersal chondrichthyans were captured in the 1990s, whereas demersal fish and benthic-feeding chondrichthyans declined in the early 2000s and model pelagic-feeding chondrichthyans increased (Figure 6B). Both species of Cape hake have been showing mixed trends since the 1960s (Rademeyer et al., 2008; Atkinson et al., 2011), but the ecosystem model fitted passably to stock assessment model series for recent decades (Figure 5). Relative abundances of anchovy and sardine were recorded to have shifted from predominantly west coast to greater proportions being found off the south and east coasts of South Africa (van der Lingen et al., 2002; Fairweather et al., 2006). Watermeyer et al. (2016) showed parallel, although smaller increases in the proportion of redeye, chub mackerel, kingklip, yellowtail, and chokka squid located east of Cape Agulhas between 1985 and 2008, and deduced from system connectivity indices that the period 2003–2008 was likely one of change. This supported the early signals of change previously reported in demersal fish data series (Atkinson et al., 2011), winds, upwelling and bottom oxygen depletion levels (Howard et al., 2007; Blamey et al., 2012; Jarre et al., 2015).
By considering the ecosystem holistically and elucidating key interactions, this modeling study has expounded on several of the key predator-prey relationships in the southern Benguela food web, which have been receiving careful attention by other colleagues in the area. Our study underlines the strong influence of sardine on the food web dynamics of the Southern Benguela. Predator-prey interactions involving sardine accounted for 40% of the 40 most sensitive predator-prey interactions in the Southern Benguela model, emphasizing the pivotal role that sardine play in controlling flow of energy in the Southern Benguela food web. This was captured in the model fitting process through applying a forcing function on all interactions between sardine as prey, and their predators; here, a simple forcing was invoked that was based on the proportion of sardine spawners located west of Cape Agulhas each year. Anchovy-predator interactions were absent from the 40 most sensitive predator-prey interactions identified in this study. The greater relative importance of sardine trophically compared to anchovy was further highlighted by our finding that a similar availability function explored in the case of anchovy, based on proportion of anchovy spawner biomass surveyed west of Cape Agulhas, only improved model fit for penguins and anchovy, but reduced model fit for adult sardine, hake adults and most linefish groups (Supplementary Table S11).
Availability of forage fish to predators needs further careful consideration. In the Benguela, seabirds particularly are closely associated with the dynamics of small pelagic fish. All three seabird species that rely heavily on sardine and anchovy as key prey species have been classified as endangered (Cape gannets, Cape cormorants and African penguins). Crawford et al. (2019) have undertaken Principal Component (PC) analyses of South African seabird diet and life history measures. PC1 showed an alternation between sardine and anchovy in the diet; PC2 contrasted good (when either anchovy or sardine was available) and poor (when gannets needed to eat saury offshore, or hake offal) foraging regimes. PC2 was significantly related to numbers of gannet and Cape cormorant breeders, and to adult penguin survival. Using PCA results (PC2 in particular, which captures prey availability), the authors proposed a Forage Availability Index. As expected, this seabird-focused index was found to be helpful in improving model fits for African penguin and Cape gannet, and via unexpected ecosystem feedbacks also medium sparids, but did not improve model fits to data series for small pelagics or linefish (Supplementary Table S11 and Supplementary Figures S5, S6), emphasizing the importance of establishing a series of species-specific functional response relationships based on empirical data, to be incorporated to improve ecosystem model fits across several key functional groups simultaneously. A particular future focus research area should be closer examination of the functional responses of predatory fish to their prey. In our study, predatory fish showed top-down (e.g., snoek) and bottom-up (e.g., Sciaenids) flow control (Supplementary Table S12). Further, a functional relationship capturing both bottom-up and top–down interactions has been found between geelbek (a Sciaenid) and sardine availability on the south west coast of South Africa (Parker et al., 2020). In addition, a weaker although still significant relationship between anchovy and yellowtail has also been identified by these authors (Parker et al., 2020). Our model fitting results support their finding: when an anchovy availability function was applied to anchovy consumption by predators, model fits to data series of both anchovy and yellowtail improved (Table 3, scenario 12 and Supplementary Table S11), and top-down flow control was estimated for yellowtail on its pelagic prey (scenarios 14 and 15). Ways to incorporate these newly found functional responses should be explored in future ecosystem modeling work.
Despite helpful guidelines in fitting Ecosim models to time series data (Shannon et al., 2004a; Heymans et al., 2016; amongst others), the model fitting process is very much dependent on one’s understanding of the food web in question, and appreciation of the quality and intricacies in the data series available. What may be a sensible sequence of fitting in one system may well not be the most appropriate in another. Different ways of accounting for and incorporating process concepts into an Ecosim model of a given system need to be tested and aligned to current understanding of that ecosystem. The importance of local knowledge and experts in facilitating most sensible or “best” model fit should not be underestimated, as has been demonstrated similarly in the case of applying and interpreting ecosystem indicators (Shannon et al., 2010). Further, ecosystem type and the objective of the model in question dictate model group aggregations, which in turn influence some of the characteristics used as general guidelines in pre-balancing Ecopath models (Link, 2010; see discussion in Supplementary Material S6).
As the model currently stands, it is not yet fully suited as a management tool, yet it could be usefully applied in a scenario testing mode. This study provides documentation of an updated, detailed baseline trophic model for the southern Benguela ecosystem, from which functional predator-prey responses, spatialized modeling, and management strategy evaluation can be explored. For instance, improved parameterization of anchovy and sardine in the new model could facilitate investigation into whether predator-fishery competition may be reduced if fisheries differentially target different size classes of anchovy and sardine to those selected by predatory fish. Furthermore, as may be the case for seabirds elsewhere, it could be investigated whether fisheries targeting adult forage fish negatively impact seabirds by changing availability of juvenile fish relied upon as prey for our resident breeding seabirds (Field et al., 2010; Sydeman et al., 2017). On the contrary, data constraints encountered for some functional groups such as cetaceans will limit the usefulness of the model in answering detailed questions pertaining to dolphins and whales.
In particular, Ecospace and the novel modeling applications within (Steenbeek et al., 2013; Christensen et al., 2014) will be used to extend the current temporal model presented here to better capture spatial aspects of trophic interactions in the southern Benguela. Ecospace model configuration will also facilitate additional environmental drivers to be incorporated. For example, it will be possible to directly incorporate sea surface temperature fields (Dufois et al., 2012; Rouault et al., 2010), to use TCU divergence between September and January as a proxy for oxygen depletion, as proposed by Jarre et al. (2015) and to explore incorporating further seasonality [recall that van der Sleen et al. (2018) demonstrated a stronger relationship between anchovy recruitment and December–March cumulative upwelling when anchovy spawner biomass located west of Cape Agulhas was above a certain threshold level]. These avenues will help define spatial habitat capacity for each functional group modeled. Productivity of sardine and anchovy differ between the west and south coasts, and at least in the case of sardine, depend strongly on spatial distribution of fishing pressure (Watermeyer et al., 2018). A fully spatialized Southern Benguela Ecospace model would support spatially explicit advice on fishing strategies under long-term climate variability and change and has been identified as a key research area in several recently launched international projects.
To reiterate, in this study in which the Benguela ecosystem is modeled as a single unit using a non-spatial trophic model, the observed spatial changes have been approximated simply through internal food web dynamics by (i) estimating vulnerability parameters of most sensitive predator-prey interactions based on existing data time series, (ii) forcing changes in availability of sardine as prey to predators based on the surveyed proportion of sardine on the west coast, and (iii) by annual cumulative upwelling driving phytoplankton productivity. Attempting to fit the model to either west coast or south coast time series rather than mixing spatial series did not improve overall model fits, highlighting the limitations of the current non-spatialized model in describing coast-specific dynamics. Nevertheless, the model presented is an important contribution toward a platform from which climate scenarios could be explored with respect to fisheries management measures under global change, such as the work that is being undertaken by the Fisheries and Marine Ecosystem Model Intercomparison Project (Fish-MIP) using several different types of ecosystem modeling approaches in numerous regions of the world (Tittensor et al., 2018).
Timing of concluding this revised, fitted, temporal Ecosim model as a basis from which to extend into a spatialized Ecospace model of the Southern Benguela is ideal in the light of the recent National Biodiversity Assessment 2018 (NBA 2018; Skowno et al., 2019). The NBA 2018 has collated and assessed multiple spatial layers and pressures in the ocean spaces off South Africa, and incorporates expert knowledge and interpretation of these data and maps. This assessment, and in view of the new expanded array of 41 marine protected areas recently gazetted for South Africa, provides enormous opportunity for expanding Ecopath with Ecosim modeling of the Southern Benguela spatially, and will guide extensive spatial-temporal scenario testing using Ecospace in support of ecosystem-based management of our marine social-ecological systems.
Data Availability Statement
All datasets generated for this study are included in the article/Supplementary Material.
Author Contributions
LS conceived the study, developed and ran the model simulations, and wrote the manuscript. All the authors provided comments on and inputs to the manuscript. KO-C provided substantial inputs to both text and figures. TL provided the upwelling index. HW provided the line fish data series and advised on model structure. RC provided the Forage Availability Index. AJ helped in framing the study and provided the inputs to the manuscript structure and focus. MC contributed to development of the 1978 model.
Funding
L’ Institut de Recherche pour le Développement (IRD), CRH, Research Unit MARBEC (UMR 248), avenue Jean Monnet, CS 30171, 34203 Sète Cedex, France, is thanked for providing core funding for the revision of the Southern Benguela EwE model. Funding for this study through the South African Research Chairs Initiative, funded by DSI and administered by NRF, through the Research Chair in Marine Ecology and Fisheries (Grant No. 65238) is also gratefully acknowledged. In addition, this work is also a contribution to the EU-Horizon 2020 project “TRIATLAS” (Grant No. 817578) and the One Ocean Hub.
Conflict of Interest
The authors declare that the research was conducted in the absence of any commercial or financial relationships that could be construed as a potential conflict of interest.
Acknowledgments
D. Merkle, T. Fairweather, and A. Makhado from the Department of Environment, Forestry and Fisheries (DEFF), South Africa, are thanked for making catch and abundance data available for small pelagic fish, demersal fish and seabirds, respectively. C. de Moor is thanked for sharing earlier stock assessment model series of small pelagics. We are grateful to V. Christensen for comments on an earlier draft of the manuscript.
Supplementary Material
The Supplementary Material for this article can be found online at: https://www.frontiersin.org/articles/10.3389/fmars.2020.00540/full#supplementary-material
References
ANON (2016). Fisheries_2016_APR_SWG_PEL_16. Mesopelagic Experiment Application Submitted to DAFF. Cape Town: Department of Agriculture, Forestry and Fisheries.
Atkinson, L. J., Leslie, R. W., Field, J. G., and Jarre, A. (2011). Changes in demersal fish assemblages on the west coast of South Africa, 1986–2009. African J. Mar. Sci. 33, 157–170. doi: 10.2989/1814232x.2011.572378
Blamey, L. K., Howard, J. A. E., Agenbag, J., and Jarre, A. (2012). Regime-shifts in the southern Benguela shelf and inshore region. Prog. Oceanogr. 106, 80–95. doi: 10.1016/j.pocean.2012.07.001
Blamey, L. K., Plagányi, ÉE., and Branch, G. M. (2014). Was overfishing of predatory fish responsible for a lobster-induced regime shift in the Benguela? Ecol. Modell 273, 140–150. doi: 10.1016/j.ecolmodel.2013.11.004
Blamey, L. K., Shannon, L. J., Bolton, J. J., Crawford, R. J. M., Dufois, F., and Evers-King, H. (2015). Ecosystem change in the southern Benguela and the underlying processes. J. Mar. Syst. 144, 9–29. doi: 10.1016/j.jmarsys.2014.11.006
Bolton, J. J., Anderson, R. J., Smit, A. J., and Rothman, M. D. (2012). South African kelp moving eastwards: the discovery of Ecklonia maxima (Osbeck) Papenfuss at De hoop nature reserve on the south coast of South Africa. African J. Mar. Sci. 34, 147–151. doi: 10.2989/1814232x.2012.675125
Christensen, V., Coll, M., Steenbeek, J., Buszowski, J., Chagaris, D., and Walters, C. J. (2014). Representing variable habitat quality in a spatial food web model. Ecosystems 17, 1397–1412. doi: 10.1007/s10021-014-9803-3
Christensen, V., and Walters, C. J. (2004). Ecopath with Ecosim: methods, capabilities and limitations. Ecol. Modell. 172, 109–139. doi: 10.1016/j.ecolmodel.2003.09.003
Cochrane, K. L., Augustyn, C. J., Fairweather, T., Japp, D., Kilongo, K., and Iitembu, J. (2009). Benguela current large marine ecosystem—governance and management for an ecosystem approach to fisheries in the region. Coast. Manag. 37, 235–254. doi: 10.1080/08920750902851187
Cockcroft, A. C., van Zyl, D., and Hutchings, L. (2008). Large-scale changes in the spatial distribution of South African West Coast rock lobsters: an overview. African J. Mar. Sci. 30, 149–159. doi: 10.2989/AJMS.2008.30.1.15.465
Coetzee, J., Merkle, D., Geja, Y., Mushanganyisi, K., and Shabangu, F. (2016). Results of the 2016 Spawner Biomass Survey. Report No FISHERIES/2016/DEC/SWG-PEL/79. Cape Town: Department of Agriculture, Forestry and Fisheries.
Coetzee, J., Merkle, D., Shabangu, F., Geja, Y., and Petersen, J. (2018). Results of the 2018 Pelagic Biomass Survey. Report No FISHERIES/2018/DEC/SWG-PEL/38. Cape Town: Department of Agriculture, Forestry and Fisheries.
Corrales, X., Coll, M., Ofir, E., Heymans, J. J., Steenbeek, J., and Goren, M. (2018). Future scenarios of marine resources and ecosystem conditions in the Eastern Mediterranean under the impacts of fishing, alien species and sea warming. Sci. Rep. 8:14284. doi: 10.1038/s41598-018-32666-x
Crawford, R. J. M., Ryan, P. G., and Williams, A. J. (1991). Seabird consumption and production in the Benguela and western agulhas ecosystems. South African J. Mar. Sci. 11, 357–375. doi: 10.2989/025776191784287709
Crawford, R. J. M., Sydeman, W. J., Thompson, S. A., Sherley, R. B., and Makhado, A. B. (2019). Food habits of an endangered seabird indicate recent poor forage fish availability off western South Africa. ICES J. Mar. Sci. 76, 1344–1352. doi: 10.1093/icesjms/fsz081
Cury, P., Bakun, A., Crawford, R. J. M., Jarre, A., Quiñones, R. A., and Shannon, L. J. (2000). Small pelagics in upwelling systems: patterns of interaction and structural changes in “wasp-waist” ecosystems. ICES J. Mar. Sci. 57, 603–618. doi: 10.1006/jmsc.2000.0712
Dufois, F., Penven, P., Peter Whittle, C., and Veitch, J. (2012). On the warm nearshore bias in pathfinder monthly SST products over eastern boundary upwelling systems. Ocean Model. 47, 113–118. doi: 10.1016/j.ocemod.2012.01.007
Fairweather, T. P., van der Lingen, C. D., Booth, A. J., Drapeau, L., and van der Westhuizen, J. J. (2006). Indicators of sustainable fishing for South African sardine Sardinops sagax and anchovy Engraulis encrasicolus. African J. Mar. Sci. 28, 661–680. doi: 10.2989/18142320609504215
Field, J. C., MacCall, A. D., Bradley, R. W., and Sydeman, W. J. (2010). Estimating the impacts of fishing on dependent predators: a case study in the California Current. Ecol. Appl. 20, 2223–2236. doi: 10.1890/09-0428.1
Fu, C., Travers-Trolet, M., Velez, L., Grüss, A., Bundy, A., and Shannon, L. J. (2018). Risky business: the combined effects of fishing and changes in primary productivity on fish communities. Ecol. Modell. 368, 265–276. doi: 10.1016/j.ecolmodel.2017.12.003
Grémillet, D., Pichegru, L., Kuntz, G., Woakes, A. G., Wilkinson, S., and Crawford, R. J. M. (2008). A junk-food hypothesis for gannets feeding on fishery waste. Proc. R. Soc. B Biol. Sci. 275, 1149–1156. doi: 10.1098/rspb.2007.1763
Griffiths, M. H. (2000). Long-term trends in catch and effort of commercial linefish off South Africa’s Cape Province: snapshots of the 20th century. South African J. Mar. Sci. 22, 81–110. doi: 10.2989/025776100784125663
Heymans, J. J., Link, J. S., Mackinson, S., Steenbeek, J., Walters, C., Christensen, V., et al. (2016). Best practice in ecopath with ecosim food-web models for ecosystem-based management. Ecol. Modell. 331, 173–184. doi: 10.1016/j.ecolmodel.2015.12.007
Howard, J. A. E., Jarre, A., Clark, A. E., and Moloney, C. L. (2007). Application of the sequential t-test algorithm for analysing regime shifts to the southern Benguela ecosystem. African J. Mar. Sci. 29, 437–451. doi: 10.2989/AJMS.2007.29.3.11.341
Huggett, J., Verheye, H., Escribano, R., and Fairweather, T. (2009). Copepod biomass, size composition and production in the Southern Benguela: spatio–temporal patterns of variation, and comparison with other eastern boundary upwelling systems. Prog. Oceanogr. 83, 197–207. doi: 10.1016/j.pocean.2009.07.048
Huggett, J. A., Batyi-Nkwenkwe, K., Mdazuka, Y., Setati, S., and Wright, E. (2019). “Long-term variability in copepods off the South Coast during Spring, 1988–2018,” in South Africa’s Oceans and Coasts Annual Science Report, 2018, Report No: 18, eds S. P. Kirkman, J. A. Huggett, and R. J. M. Crawford (Pretoria: Department of Environmental Affairs), RP188/2019, ISBN: 987-0-621-47469-5.
Hutchings, L., Jarre, A., Lamont, T., van den Berg, M., and Kirkman, S. P. (2012). St Helena Bay (southern Benguela) then and now: muted climate signals, large human impact. African J. Mar. Sci. 34, 559–583. doi: 10.2989/1814232X.2012.689672
Hutchings, L., van der Lingen, C. D., Shannon, L. J., Crawford, R. J. M., Verheye, H. M. S., Bartholomae, C. H., et al. (2009). The Benguela current: an ecosystem of four components. Prog. Oceanogr. 83, 15–32. doi: 10.1016/j.pocean.2009.07.046
Jarre, A., Hutchings, L., Kirkman, S. P., Kreiner, A., Tchipalanga, P. C. M., and Kainge, P. (2015). Synthesis: climate effects on biodiversity, abundance and distribution of marine organisms in the Benguela. Fish. Oceanogr. 24, 122–149. doi: 10.1111/fog.12086
Koehn, L. E., Essington, T. E., Marshall, K. N., Kaplan, I. C., Sydeman, W. J., and Szoboszlai, A. I. (2016). Developing a high taxonomic resolution food web model to assess the functional role of forage fish in the California Current ecosystem. Ecol. Modell. 335, 87–100. doi: 10.1016/j.ecolmodel.2016.05.010
Lamont, T., García-Reyes, M., Bograd, S. J., van der Lingen, C. D., and Sydeman, W. J. (2018). Upwelling indices for comparative ecosystem studies: variability in the Benguela upwelling system. J. Mar. Syst. 188, 3–16. doi: 10.1016/J.JMARSYS.2017.05.007
Link, J. S. (2010). Adding rigor to ecological network models by evaluating a set of pre-balance diagnostics: a plea for PREBAL. Ecol. Modell. 221, 1580–1591. doi: 10.1016/j.ecolmodel.2010.03.012
Lockerbie, E. M., and Shannon, L. (2019). Toward exploring possible future states of the southern Benguela. Front. Mar. Sci. 6:380. doi: 10.3389/fmars.2019.00380
Ortega-Cisneros, K., Cochrane, K. L., Fulton, E. A., Gorton, R., and Popova, E. (2018a). Evaluating the effects of climate change in the southern Benguela upwelling system using the Atlantis modelling framework. Fish. Oceanogr. 27, 489–503. doi: 10.1111/fog.12268
Ortega-Cisneros, K., Shannon, L., Cochrane, K., Fulton, E. A., and Shin, Y.-J. (2018b). Evaluating the specificity of ecosystem indicators to fishing in a changing environment: a model comparison study for the southern Benguela ecosystem. Ecol. Indic. 95, 85–98. doi: 10.1016/J.ECOLIND.2018.07.021
Parker, D., Coetzee, J. D., Winker, H., and van der Lingen, C. D. (2020). Accounting for linefish dependency in the management of South African small pelagic fisheries. Afr. J. Mar. Sci. doi: 10.2989/1814232X.2020.1788160
Probyn, T. A. (1992). The inorganic nitrogen nutrition of phytoplankton in the southern Benguela: new production, phytoplankton size and implications for pelagic foodwebs. South Afr. J. Mar. Sci. 12, 411–420.
Rademeyer, R. A., Butterworth, D. S., and Plagányi, ÉE. (2008). Assessment of the South African hake resource taking its two-species nature into account. African J. Mar. Sci. 30, 263–290. doi: 10.2989/AJMS.2008.30.2.7.557
Rouault, M., Pohl, B., and Penven, P. (2010). Coastal oceanic climate change and variability from 1982 to 2009 around South Africa. African J. Mar. Sci. 32, 237–246. doi: 10.2989/1814232X.2010.501563
Roy, C., van der Lingen, C. D., Coetzee, J. C., and Lutjeharms, J. R. E. (2007). Abrupt environmental shift associated with changes in the distribution of Cape anchovy Engraulis encrasicolus spawners in the southern Benguela. African J. Mar. Sci. 29, 309–319. doi: 10.2989/AJMS.2007.29.3.1.331
Roy, C., Weeks, S., Rouault, M., Nelson, G., Barlow, R., and van der Lingen, C. (2001). Extreme oceanographic events recorded in the Southern Benguela during the 1999-2000 summer season. S. Afr. J. Sci. 97, 465–471.
Ryan, P. G., and Moloney, C. L. (1988). Effect of trawling on bird and seal distributions in the southern Benguela region. Mar. Ecol. Prog. Ser. 45, 1–11. doi: 10.3354/meps045001
Scott, E., Serpetti, N., Steenbeek, J., and Heymans, J. J. (2016). A Stepwise Fitting Procedure for automated fitting of Ecopath with Ecosim models. SoftwareX 5, 25–30. doi: 10.1016/j.softx.2016.02.002
Serpetti, N., Baudron, A. R., Burrows, M. T., Payne, B. L., Helaouët, P., and Fernandes, P. G. (2017). Impact of ocean warming on sustainable fisheries management informs the ecosystem approach to fisheries. Sci. Rep. 7:13438. doi: 10.1038/s41598-017-13220-7
Shannon, L. J., Christensen, V., and Walters, C. J. (2004a). Modelling stock dynamics in the southern Benguela ecosystem for the period 1978–2002. African J. Mar. Sci. 26, 179–196. doi: 10.2989/18142320409504056
Shannon, L. J., Field, J. G., and Moloney, C. L. (2004b). Simulating anchovy–sardine regime shifts in the southern Benguela ecosystem. Ecol. Modell. 172, 269–281. doi: 10.1016/j.ecolmodel.2003.09.011
Shannon, L. J., Coll, M., and Neira, S. (2009). Exploring the dynamics of ecological indicators using food web models fitted to time series of abundance and catch data. Ecol. Indic. 9, 1078–1095. doi: 10.1016/j.ecolind.2008.12.007
Shannon, L. J., Coll, M., Yemane, D., Jouffre, D., Neira, S., and Bertrand, A. (2010). Comparing data-based indicators across upwelling and comparable systems for communicating ecosystem states and trends. ICES J. Mar. Sci. J. Cons. 67, 807–832. doi: 10.1093/icesjms/fsp270
Shannon, L. J., Moloney, C. L., Jarre, A., and Field, J. G. (2003). Trophic flows in the southern Benguela during the 1980s and 1990s. J. Mar. Syst. 39, 83–116. doi: 10.1016/S0924-7963(02)00250-6
Shannon, L. J., Neira, S., and Taylor, M. (2008). Comparing internal and external drivers in the southern Benguela and the southern and northern Humboldt upwelling ecosystems. African J. Mar. Sci. 30, 63–84. doi: 10.2989/AJMS.2008.30.1.7.457
Shannon, V., Hempel, G., Malanotte-Rizzoli, P., Moloney, C., and Woods, J. (2006). Benguela: Predicting a Large Marine Ecosystem. Large Marine Ecosystem Series 14. Amsterdam: Elsevier.
Sherley, R. B., Crawford, R. J. M., Dyer, B. M., Kemper, J., Makhado, A. B., and Masotla, M. (2019). The status and conservation of the cape gannet morus capensis. Ostrich 90, 335–346. doi: 10.2989/00306525.2019.1684396
Skowno, A., Poole, C., Raimondo, D., Sink, K., Van Deventer, H., Van Niekerk, L., et al. (2019). National Biodiversity Assessment 2018: The Status of South Africa’s Ecosystems and biodiversity. Synthesis Report. Pretoria: South African National Biodiversity Institute.
Smith, A. D. M., Brown, C. J., Bulman, C. M., Fulton, E. A., Johnson, P., and Kaplan, I. C. (2011). Impacts of fishing low–trophic level species on marine ecosystems. Science 333, 1147–1150. doi: 10.1126/science.1209395
Steenbeek, J., Coll, M., Gurney, L., Mélin, F., Hoepffner, N., and Buszowski, J. (2013). Bridging the gap between ecosystem modeling tools and geographic information systems: driving a food web model with external spatial–temporal data. Ecol. Modell. 263, 139–151. doi: 10.1016/J.ECOLMODEL.2013.04.027
Sydeman, W. J., Thompson, S. A., Anker-Nilssen, T., Arimitsu, M., Bennison, A., and Bertrand, S. (2017). Best practices for assessing forage fish fisheries-seabird resource competition. Fish. Res. 194, 209–221. doi: 10.1016/j.fishres.2017.05.018
Symonds, M. R. E., and Moussalli, A. (2011). A brief guide to model selection, multimodel inference and model averaging in behavioural ecology using Akaike’s information criterion. Behav. Ecol. Sociobiol. 65, 13–21. doi: 10.1007/s00265-010-1037-6
Tittensor, D. P., Eddy, T. D., Lotze, H. K., Galbraith, E. D., Cheung, W., Barange, M., et al. (2018). A protocol for the intercomparison of marine fishery and ecosystem models: fish-MIP v1.0. Geosci. Model Dev. 11, 1421–1442. doi: 10.5194/gmd-11-1421-2018
Travers, M., and Shin, Y.-J. (2010). Spatio-temporal variability in fish-induced predation mortality on plankton. A simulation approach using a coupled trophic model of the Benguela ecosystem. Prog. Oceanogr. 84, 118–120. doi: 10.1016/j.pocean.2009.09.014
Travers-Trolet, M., Shin, Y.-J., Shannon, L. J., Moloney, C. L., and Field, J. G. (2014). Combined fishing and climate forcing in the southern Benguela upwelling ecosystem: an end-to-end modelling approach reveals dampened effects. PLoS One 9:e94286. doi: 10.1371/journal.pone.0094286
van der Lingen, C., and Miller, T. (2011). ““Trophic dynamics of pelagic nekton in the Southern Benguela current ecosystem: calibrating trophic models with stable isotope analysis,” in Interdisciplinary Studies on Environmental Chemistry- Marine Environmental Modeling & Analysis, eds J. Omori, X. Guo, N. Yoshie, N. Fujii, I. Handoh, A. Isobe, et al. Tokyo, 85–94.
van der Lingen, C. D., Coetzee, J. C., and Hutchings, L. (2002). Temporal shifts in the spatial distribution of anchovy spawners and their eggs in the Southern Benguela: Implications for recruitment. GLOBEC Rep. 16, 46–48.
van der Lingen, C. D., Hutchings, L., Lamont, T., and Pitcher, G. C. (2016). Climate change, dinoflagellate blooms and sardine in the southern Benguela current large marine ecosystem. Environ. Dev. 17, 230–243. doi: 10.1016/j.envdev.2015.09.004
van der Sleen, P., Rykaczewski, R., Turley, B., Sydeman, W., García-Reyes, M., Bograd, S., et al. (2018). Non-stationary responses in anchovy (Engraulis encrasicolus) recruitment to coastal upwelling in the Southern Benguela. Mar. Ecol. Prog. Ser. 596, 155–164. doi: 10.3354/meps12567
Verheye, H. M., Lamont, T., Huggett, J. A., Kreiner, A., and Hampton, I. (2016). Plankton productivity of the Benguela current large marine ecosystem (BCLME). Environ. Dev. 17, 75–92. doi: 10.1016/j.envdev.2015.07.011
Verheye, H. M., and Richardson, A. J. (1998). Long-term increase in crustacean zooplankton abundance in the southern Benguela upwelling region (1951–1996): bottom-up or top-down control? ICES J. Mar. Sci. 55, 803–807.
Verheye, H. M., Richardson, A. J., Hutchings, L., Marska, G., and Gianakouras, D. (1998). Long-term trends in the abundance and community structure of coastal zooplankton in the southern Benguela system, 1951–1996. South African J. Mar. Sci. 19, 317–332. doi: 10.2989/025776198784126728
Walters, C., Christensen, V., and Pauly, D. (1997). Structuring dynamic models of exploited ecosystems from trophic mass-balance assessments. Rev. Fish Biol. Fish. 7, 139–172. doi: 10.1023/A:1018479526149
Walters, C., Pauly, D., and Christensen, V. (1999). Ecospace: prediction of mesoscale spatial patterns in trophic relationships of exploited ecosystems, with emphasis on the impacts of marine protected areas. Ecosystems 2, 539–554. doi: 10.1007/s100219900101
Walters, C., Pauly, D., Christensen, V., and Kitchell, J. F. (2000). Representing density dependent consequences of life history strategies in aquatic ecosystems: EcoSim II. Ecosystems 3, 70–83. doi: 10.1007/s100210000011
Watermeyer, K. E., Hutchings, L., Jarre, A., and Shannon, L. J. (2016). Patterns of distribution and spatial indicators of ecosystem change based on key species in the Southern Benguela. PLoS One 11:e0158734. doi: 10.1371/journal.pone.0158734
Watermeyer, K. E., Jarre, A., Shannon, L. J., Mulumba, P., and Botha, J. (2018). A frame-based modelling approach to understanding changes in the distribution and abundance of sardine and anchovy in the southern Benguela. Ecol. Modell. 371, 1–17. doi: 10.1016/j.ecolmodel.2017.12.017
Watermeyer, K. E., Shannon, L. J., and Griffiths, C. L. (2008). Changes in the trophic structure of the southern Benguela before and after the onset of industrial fishing. African J. Mar. Sci. 30, 351–382. doi: 10.2989/AJMS.2008.30.2.11.561
Watkins, B. P., Petersen, S. L., and Ryan, P. G. (2008). Interactions between seabirds and deep-water hake trawl gear: an assessment of impacts in South African waters. Anim. Conserv. 11, 247–254. doi: 10.1111/j.1469-1795.2008.00192.x
Wickens, P. A., Japp, D. W., Shelton, P. A., Kriel, F., Goosen, P. C., and Rose, B. (1992). Seals and fisheries in South Africa — competition and conflict. South African J. Mar. Sci. 12, 773–789. doi: 10.2989/02577619209504741
Winker, H., Kerwath, S. E., and Attwood, C. G. (2013). Comparison of two approaches to standardize catch-per-unit-effort for targeting behaviour in a multispecies hand-line fishery. Fish. Res. 139, 118–131. doi: 10.1016/j.fishres.2012.10.014
Keywords: Ecosim, southern Benguela, temporal variability, forcing functions, upwelling index
Citation: Shannon LJ, Ortega-Cisneros K, Lamont T, Winker H, Crawford R, Jarre A and Coll M (2020) Exploring Temporal Variability in the Southern Benguela Ecosystem Over the Past Four Decades Using a Time-Dynamic Ecosystem Model. Front. Mar. Sci. 7:540. doi: 10.3389/fmars.2020.00540
Received: 13 March 2020; Accepted: 15 June 2020;
Published: 31 July 2020.
Edited by:
Manuel J. Zetina-Rejón, National Polytechnic Institute of Mexico (IPN), MexicoReviewed by:
Sean Lucey, Northeast Fisheries Science Center (NOAA), United StatesHoward Townsend, National Marine Fisheries Service (NOAA), United States
Pablo Del Monte-Luna, Centro Interdisciplinario de Ciencias Marinas (IPN), Mexico
Copyright © 2020 Shannon, Ortega-Cisneros, Lamont, Winker, Crawford, Jarre and Coll. This is an open-access article distributed under the terms of the Creative Commons Attribution License (CC BY). The use, distribution or reproduction in other forums is permitted, provided the original author(s) and the copyright owner(s) are credited and that the original publication in this journal is cited, in accordance with accepted academic practice. No use, distribution or reproduction is permitted which does not comply with these terms.
*Correspondence: Lynne J. Shannon, lynne.shannon@uct.ac.za; lshannon4@yahoo.co.uk