Population Genomics Reveals Shallow Genetic Structure in a Connected and Ecologically Important Fish From the Northwestern Pacific Ocean
 Bai-Dong Zhang
 Yu-Long Li1,2,3
  Dong-Xiu Xue
 Jin-Xian Liu
- 1CAS Key Laboratory of Marine Ecology and Environmental Sciences, Institute of Oceanology, Chinese Academy of Sciences, Qingdao, China
- 2Laboratory for Marine Ecology and Environmental Science, Qingdao National Laboratory for Marine Science and Technology, Qingdao, China
- 3Center for Ocean Mega-Science, Chinese Academy of Sciences, Qingdao, China
Genetic variation at the genomic level is invaluable to identify fish stock structure in fisheries management. It has been widely accepted that populations of marine fishes are highly connected owing to fewer barriers to gene flow and increased connectivity resulting from greater dispersal abilities. Since population genomic approaches have increased the accessibility and resolution of population genetic data, it further facilitates to study and detect previously unidentified structures as well as signatures for natural selection in wild populations. In the present study, restriction-site associated DNA (RAD) sequencing was applied to the samples of genome-wide single nucleotide polymorphisms (SNPs) of Engraulis japonicus, a small pelagic fish of ecological and economic importance in the northwestern Pacific. To assess population genetic structure as well as detection for local adaptation of E. japonicus, a total of 389 individuals from six regional populations of the northwestern Pacific were collected and a set of 12,627 SNPs was developed. Marginal significant genetic structure (average FST value was approximately equal to 0.002) was detected between regional populations of “the Bohai Sea population (BHS)” and the “the Japan Sea population (JPS)” as well as between “the North Yellow Sea population (NYS),” and the “the Japan Sea population (JPS)”. Moreover, no sign of local adaptation was detected, which might be the product of high gene flow among regional populations. Overall, our results improve the understanding of fine-scale population genetic structure in E. japonicus and potentially identify management unit in this species.
Introduction
Different fish stocks may respond differently to fluctuations of environmental factors as well as fishing pressures. It is critical to consider population structure in stock assessment of marine fishes as negligence of population structures in fisheries management may cause unexpected risks of overexploitation (Ying et al., 2011). Marine ecosystems are traditionally considered to be highly connected, which might be attributed to large population sizes as well as fewer barriers to gene flow in marine environment (Shanks et al., 2003; Conover et al., 2006; Cano et al., 2008). In many marine fishes, early life history is characterized by the presence of a planktonic larval stage during which larvae can be transported over long distances by ocean currents (Shanks et al., 2003; Trakhtenbrot et al., 2005). Additionally, the adult stage of some marine fish species can be more mobile than the larval stage as they exhibit migratory behavior. Considering all these biological characteristics, it is expected that marine fishes would be highly connected due to high levels of dispersal over large spatial scales, which makes it more challenging to accurately characterize the population structure. In many cases, adaptive divergence is widely believed to be rare in marine fishes as compared to terrestrial species owing to fewer barriers to gene flow and increased connectivity resulting from greater dispersal abilities (Cano et al., 2008). Nevertheless, favorable alleles of candidate genes related to local selective pressures can be more likely to be detected, because large population sizes of marine fishes can reduce the effect of genetic drift (Nielsen et al., 2009). However, ocean currents can form fronts between distinct water masses, which may act as gene flow barriers as well as selection pressures, and leading to genetic heterogeneity among continuously distributed populations of marine organisms (Saunders et al., 1986).
For the last few decades, genetics-based approaches have been widely used to facilitate fisheries management. However, traditional approaches based on insufficient genetic data from narrow genomic regions may be ineffective when populations are recently diverged or having high levels of gene flow (Carvalho, 1994; Russello et al., 2011). Recent advances in the field of population genomics have overcome the limitation of restricted genetic data encountered when using traditional genetic methods. This scenario further facilitates to detect previously unidentified population structure and provide increased accuracy of estimating demographic parameters in wild populations (Waples and Gaggiotti, 2006; Lowe and Allendorf, 2010; Ellegren, 2014). More importantly, population genomic approaches provide a framework for identifying genomic regions under natural selections by detecting outlier loci (Storz, 2005; Miller et al., 2007; Allendorf et al., 2010; Etter et al., 2011). The view on population structure in high gene flow marine organisms has changed significantly during the last decade and an ever-expanding number of population genomic studies of marine fishes show a complex picture of spatial genetic differentiation, both on macro-geographic, and micro-geographic scales (Salmenkova, 2011; Hess et al., 2013; Guo et al., 2016). Researchers increasingly recognized the importance of revealing fine-scale genetic structure as well as local adaptation in marine fishes, particularly for species of highly economic, and ecological importance. This ultimately provides a better understanding of population structure and new insights for the designation of management and conservation units (Conover et al., 2006; Allendorf et al., 2010; Funk et al., 2012).
The Japanese anchovy (Engraulis japonicus Temminck and Schlegel, 1846) is a small pelagic fish of ecological and economic importance in the northwestern Pacific, ranging from southern Sakhalin Island, Russia, to Guangdong, China (Whitehead et al., 1988). It is not only a small pelagic plankton feeder, but also a prey species for around 30–40 commercially important fishes of higher trophic level (Wei and Jiang, 1992). Therefore, E. japonicus is regarded as an ecologically keystone species of marine food web which plays a critical role in the energy flow as well as nutrient recycling of marine ecosystem (Zhao et al., 2003). E. japonicus is a multiple spawner with seasonal asynchronous migrations. Estuaries or coastal waters are major spawning and nursery areas and its overwintering grounds are located in offshore area (Deng and Zhao, 1991). This species migrate from overwintering grounds to spawning grounds in spring and spawn in the coastal waters from May to October with multiple spawning times in China seas (Deng and Zhao, 1991). Moreover, a protracted spawning season was also found in Japan with a gradually spatial change as compared to populations in China (Funamoto et al., 2004). The species is considered as the most abundant fish species in the Yellow Sea, nevertheless, its natural stock has declined sharply by approximately 30 percent in the last 5 years according to Fishery Statistical Yearbook of China (2015–2019). In these circumstances, investigations of population genetic structure of E. japonicus can contribute to establishment of explicit management as well as conservation measures for this species. Over the past decades, fishery stock identification of E. japonicus has attracted considerable attention, because an understanding of stock structure is critical to designing appropriate management regulations in fisheries where multiple stocks are differentially exploited (Ricker, 1981). The fishery stock of E. japonicus in China seas was generally divided into three separate groups according to marine fishery resources survey, including the Bohai Sea (BHS) Group, the Yellow Sea Group, and the North East China Sea Group (Iversen et al., 2005). In addition, Hayashi (1961) divided E. japonicus stocks around Japan into four regional groups including the Kyushu Pacific population, the West Kyushu Coast population, the Honshu Pacific population, and the Japan Sea (JPS) population. Nevertheless, with the relative aggregation of fishing and spawning activities as the main basis for dividing its regional groups, very little information is available concerning the genetic variability of E. japonicus. Previous population genetic studies based on sequence variation of fragments in the mitochondrial cytochrome b (Cyt b), cytochrome c oxidase subunit I (COI) gene as well as mitochondrial DNA control region revealed no significant genetic structure for the wide-ranging populations of E. japonicus in the northwestern Pacific (Yu et al., 2005; Liu et al., 2006). In contrast, by using six microsatellite loci, weak but significant genetic differentiation was detected between populations from coasts of northeastern and southwestern Taiwan (Yu et al., 2002). Similarly, molecular analyses based on fragments of the mitochondrial DNA cytochrome b gene also identified a substantial amount of genetic variations among populations in the southern East China Sea (Chen et al., 2010). Nevertheless, it should be noted that most of these aforementioned studies focused on only local or regional scale of distribution range of E. japonicus, which might not reflected the whole picture of the large-scale population structure of E. japonicus in the northwestern Pacific Ocean. Moreover, insufficient genetic data from narrow genomic regions was used to delineate population structure of E. japonicus based on traditional approaches and discrepancies among these studies may hinder the accuracy and effectiveness of fisheries management and conservation.
Hydrographic characteristics of the northwestern Pacific Ocean are influenced mainly by the currents as well as monsoons, and the environmental conditions such as temperature and salinity show distinct environmental transitions, which may increase the chances for local adaptation of E. japonicus (Johnson and Boyer, 2015). Nevertheless, it should be noted that adaptive divergence of E. japonicus might be largely constrained, because a high amount of gene flow can have a retarding effect on the differentiation among regional populations. In these circumstances, the relationship between adaptive divergence and gene flow of E. japonicus in the northwestern Pacific Ocean still remains equivocal. Additionally, past studies have also found differences in the reproductive characteristics as well as nutrient availability of E. japonicus between individuals caught from different regions, suggesting the existence of multiple locally adapted stocks in the northwest Pacific Ocean (Funamoto et al., 2004; Tanaka et al., 2008). However, previous genetic approaches, based on a limited number of markers, may not be able to reveal the true population structure of E. japonicus due to limited resolution. In these circumstances, our study attempts to address the shortcomings of previous studies by using a population genomic approach. The aim of this study is to examine fine-scale genetic structure and to test for local adaptation of E. japonicus from the northwestern Pacific Ocean. The results could improve our understanding of fine-scale population genetic structure as well as local adaptation of E. japonicus, which provides new insights into designating fishery management strategies as well as ensuring the long-term sustainability for this species (Hilborn et al., 2003; Schindler et al., 2010).
Materials and Methods
Sample Collection
According to population division of E. japonicus based on fishery resources and ecological studies (Hayashi, 1961; Iversen et al., 2005), a total of 389 fish specimens were collected from six main oceanographical regions of the northwestern Pacific including the BHS, the Northern Yellow Sea (NYS), the Northern East China Sea (NES), Taiwan coastal waters (TWC), the JPS, and the Pacific side of Japan (JPP). In total, 20 geographical locations with an average of approximate 19 individuals per site were sampled, five locations of which were collected in the BHS region (N = 100), four locations in the NYS region (N = 80), three locations in the NES region (N = 60), two locations in TWC (N = 32), two locations in the JPS (N = 37), and the other four locations in the Pacific side of Japan region (N = 80; Table 1 and Figure 1). All specimens were captured by trawl net and muscle tissues were preserved in 95% ethanol. Genomic DNA was extracted following a standard phenol–chloroform extraction protocol.
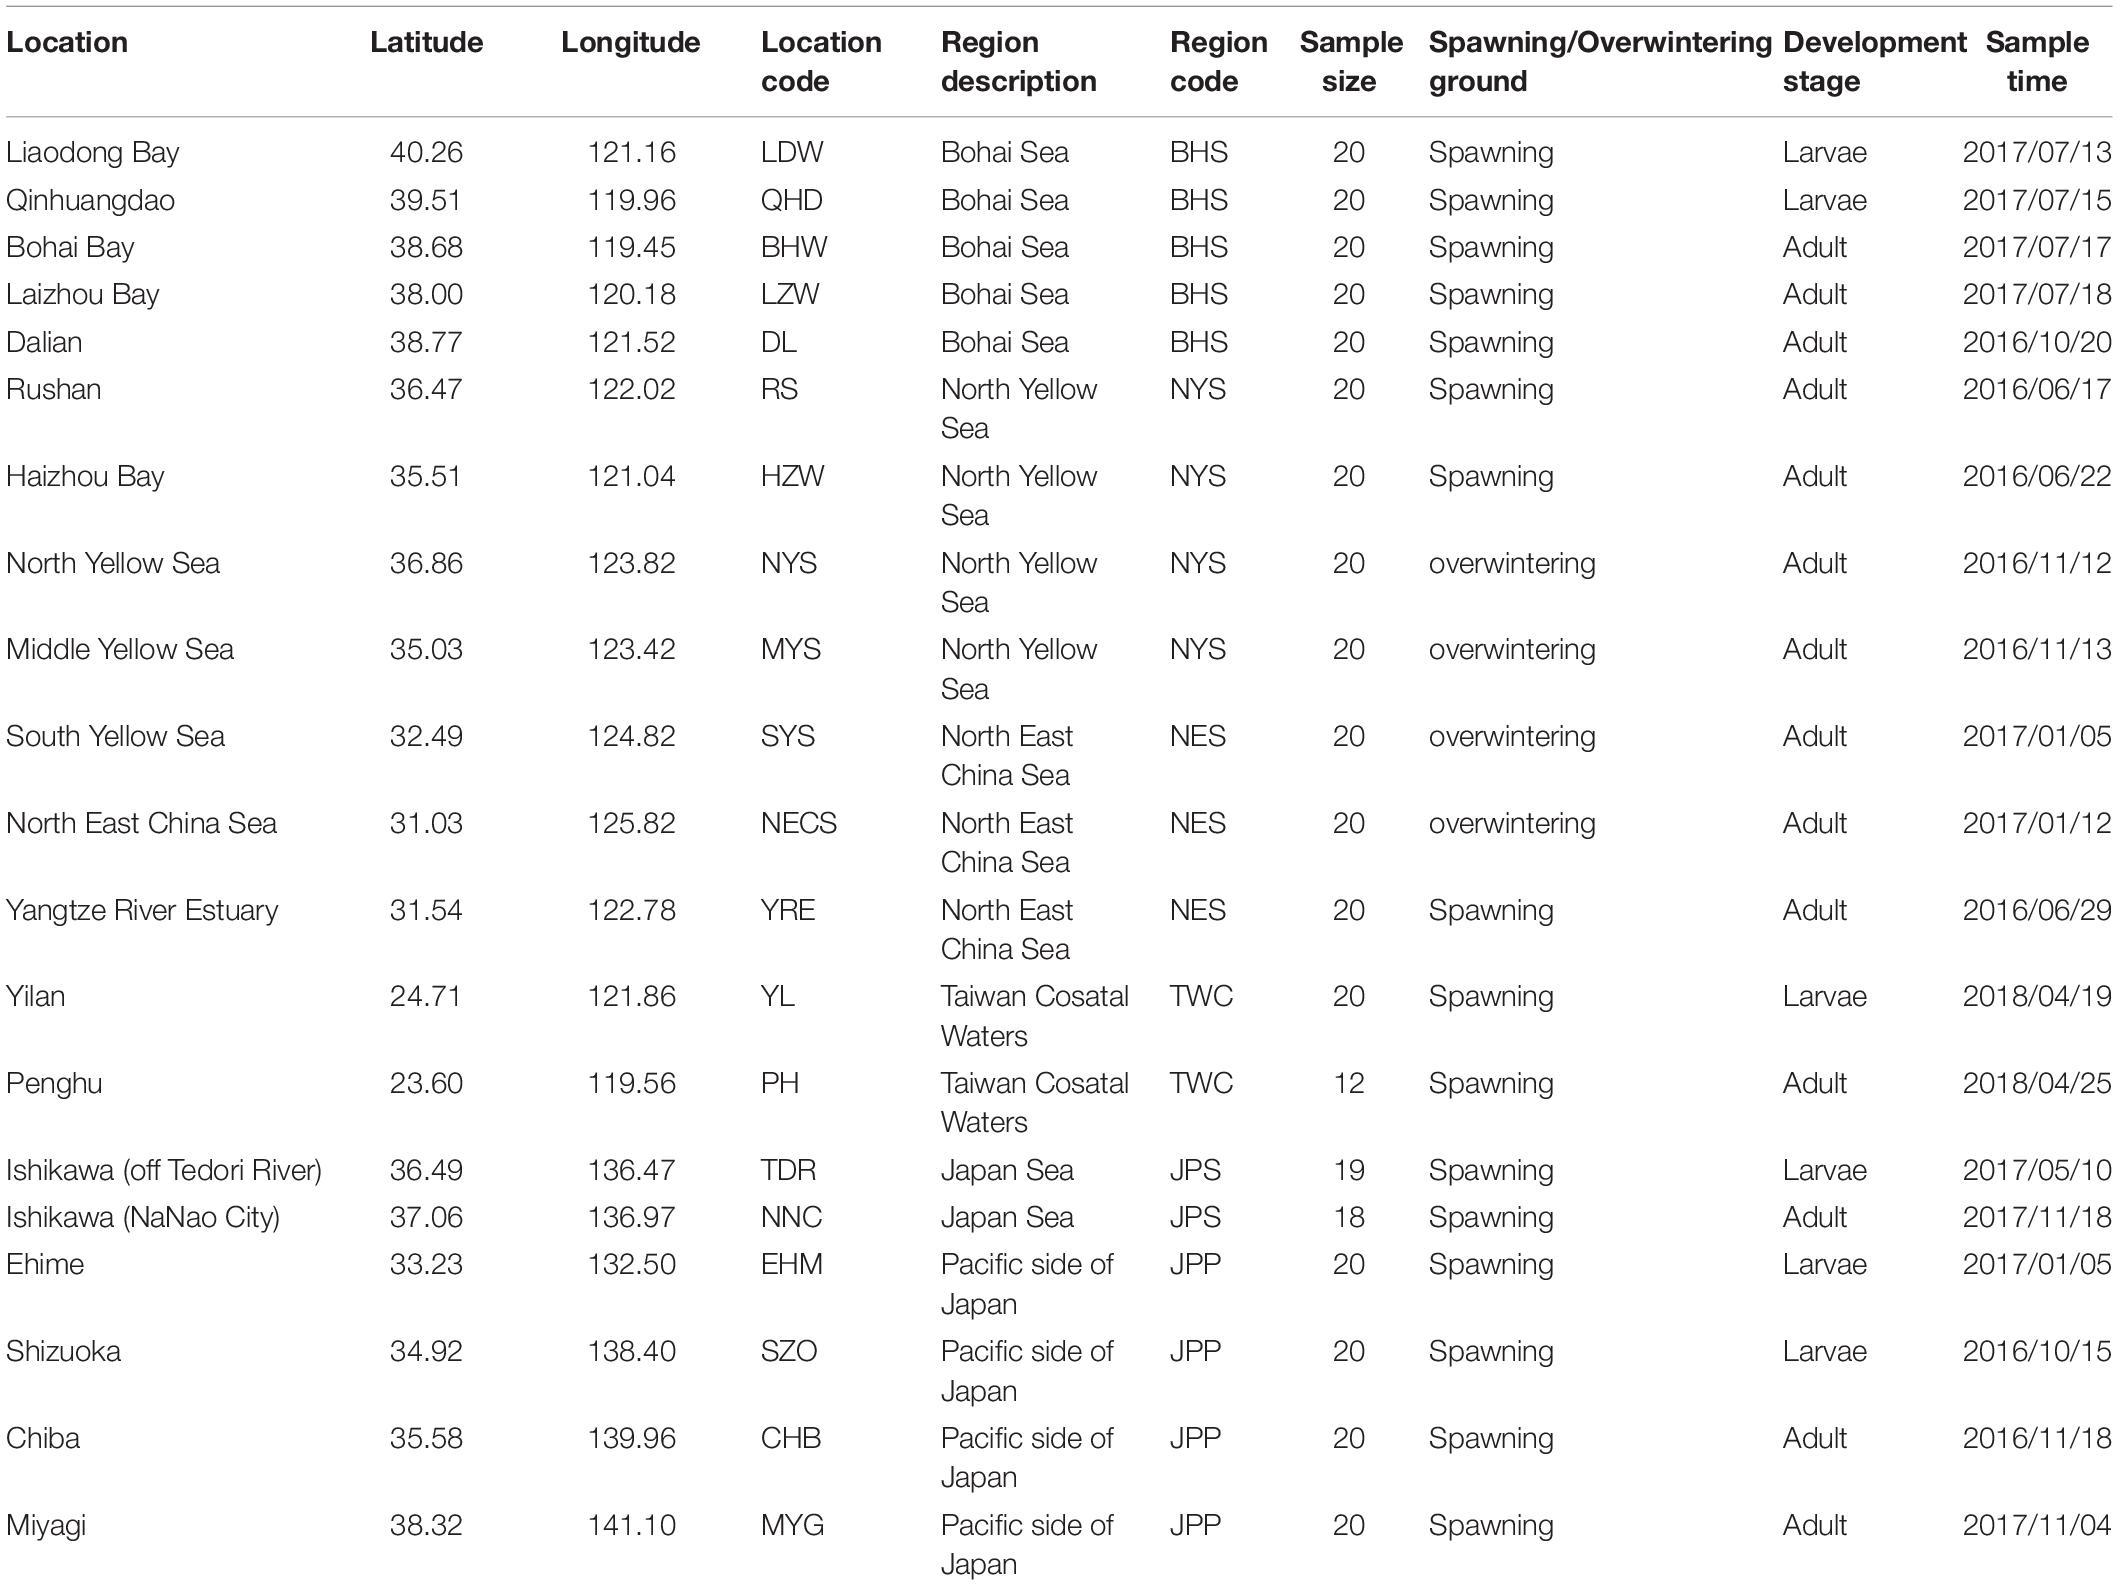
Table 1. Sampling locations, regions, sample size and sampling time for each collection of E. japonicus.
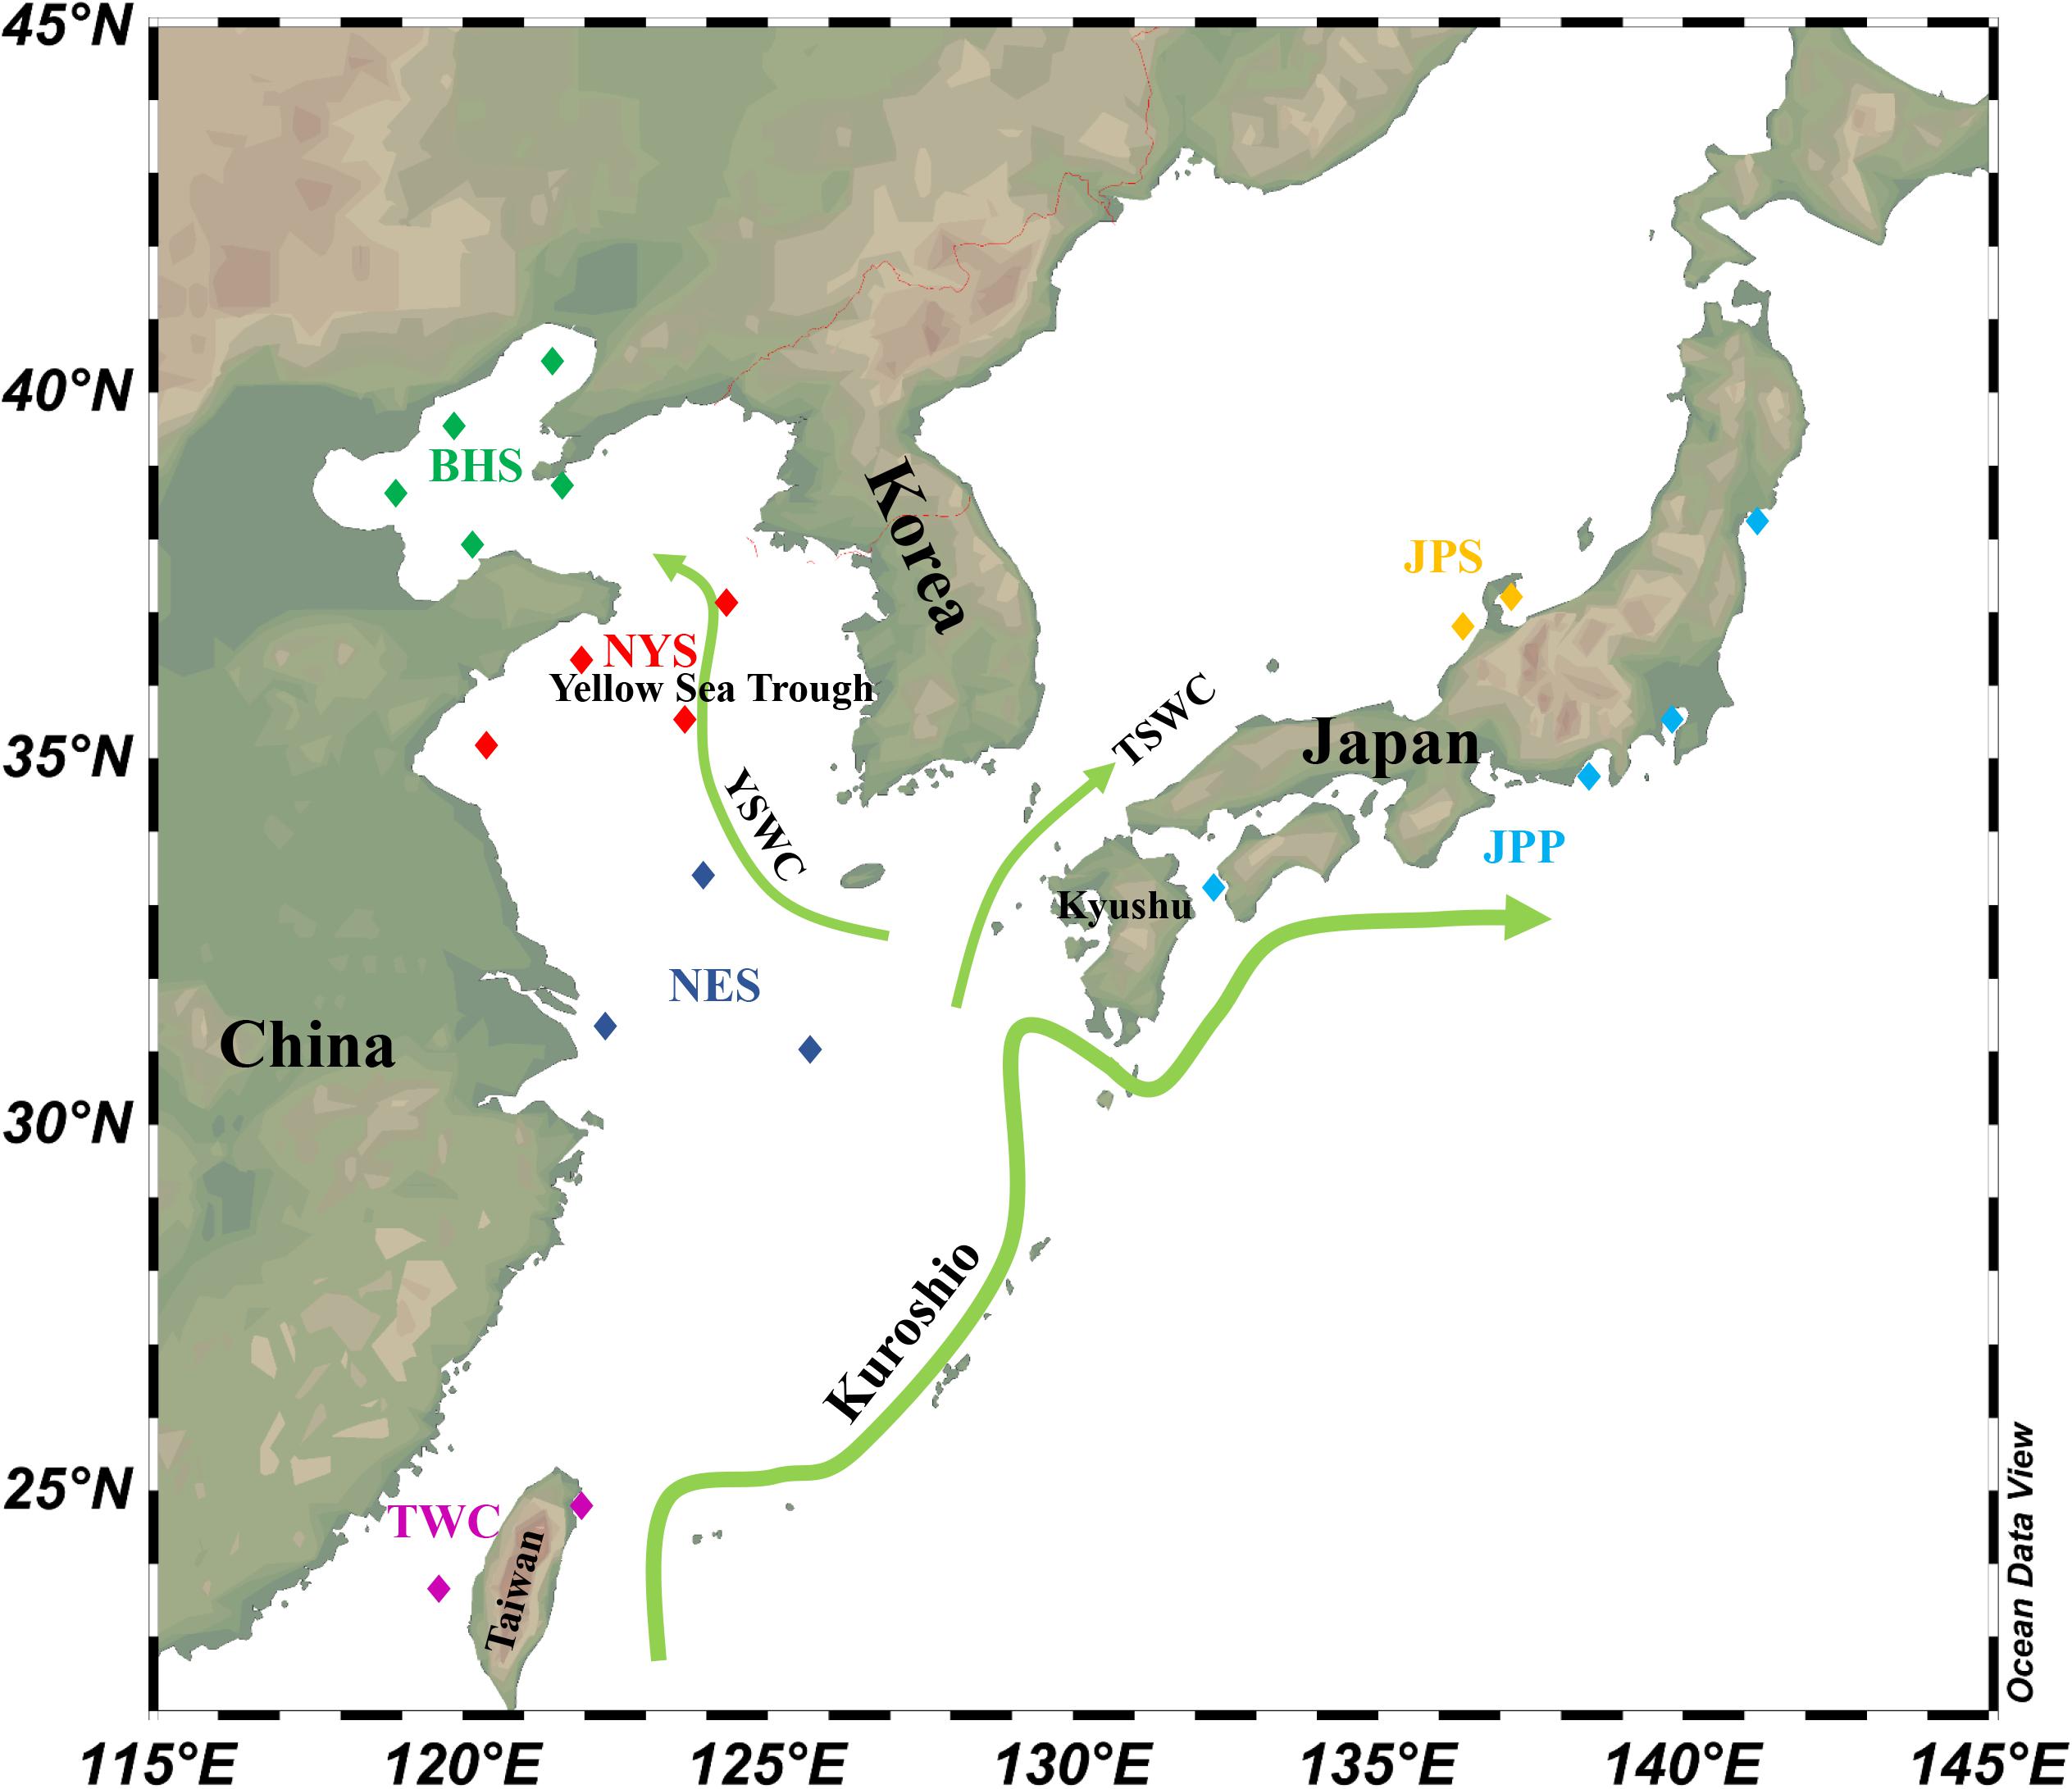
Figure 1. Schematic map of ocean circulation in the northwestern Pacific. The green arrows denote the prevailing ocean currents. The rectangles represent individual sampling locations and rectangles with the same color represent each sampling regions of E. japonicus in the northwestern Pacific Ocean (Schlitzer, 2019).
RAD Library Construction and Sequencing
Genomic DNA was treated with RNase A to remove any RNA contamination. Restriction-site associated DNA (RAD) library preparation was subsequently carried out in accordance with the guidelines in the protocol described in Baird et al. (2008). About 500 ng DNA of each individual was digested using EcoRI. Ten to twelve individually indexed individuals were pooled together to construct a RAD library and DNA fragment of length 200–500 bp was finally extracted and purified. The libraries were enriched by high-fidelity PCR and then sequenced using 150-bp-paired-end Illumina HiSeq X TEN at Allwegene in Beijing. The obtained sequenced reads were sorted according to index sequences, a unique six nucleotides in length (differed from each other by at least two bases) used for sample tracking. To avoid reads with artificial bias, we used the process_radtags program (Catchen et al., 2013) as well as Cutadapt v1.16 (Martin, 2011) to remove low-quality read pairs according to the criteria listed below: (1) read pairs with ≥5% unidentified nucleotides; (2) read pairs with adapter contamination; (3) Read pairs having average phred quality <20 within a window size of 15 bp; (4) read pairs lacking the partial EcoRI motif (AATTC); and (5) putative duplicated read pairs generated by PCR amplification. Final read length of the paired-end reads were trimmed to 130 nucleotides because of the high potential sequencing errors rate at the tails of the sequences (Pujolar et al., 2013).
Assembly and SNP Identification
We processed the filtered RAD-seq data using Stacks pipeline version 2.0 (Catchen et al., 2013). For single individual, we used ustacks to build putative single-end loci by grouping unique stacks that differ by a threshold of six mismatches (M parameter in ustacks) according to the study of Ilut et al. (2014) by using RADassembler (Li et al., 2018). The minimum depth of coverage to create a stack was set at a conservative value of 4 (m parameter in ustacks). Moreover, we preformed gapped alignments (gapped parameter in ustacks) between stacks and all other parameters were set at their default values. Unique loci from forty individuals (two individuals from each of the 20 populations) of E. japonicus were aggregated into a catalog using cstacks with default parameters except that –n (mismatch threshold) was set to 6 (Ilut et al., 2014; Li et al., 2018). Additionally, the program gstacks is executed to assemble contigs and call variant sites using all matched reads for each locus of the catalog as well as genotypes in each individual with default parameter values. After assembly and genotyping, the variant sites were further filtered to remove low quality calls and spurious variants with VCFtools (Danecek et al., 2011). Moreover, only single nucleotide substitutions were studied and other complex events such as multinucleotide polymorphisms as well as indels were excluded in the following analysis. Therefore, in order to reduce potential sequencing errors in the current study, loci with more than two alleles were ignored. Additionally, the specified quality control criteria were also considered for SNP calling: (1) Coverage depth ≥5 and ≤1000; (2) genotype quality score ≥15; and (3) single nucleotide polymorphisms (SNPs) with a minimum genotyping rate of 60% within each regional population. Further, SNPs with a minor allele frequency (Local MAF) >0.2 in at least one location or SNPs with minor allele frequency (Global MAF) >0.05 across sampling locations were retained to limit false SNP identification (Corander et al., 2013). Moreover, markers showing local Hobs > 0.50 was excluded to avoid potential homologs. Only SNP loci that passed the quality control criteria were included in the following analysis. PGDSPIDER v.2.0.5.0 was used to convert the resulting filtered VCF file into the corresponding file formats for subsequent analyses (Lischer and Excoffier, 2012).
Population Genetic Analyses
In the current study, three approaches were applied to investigate population genetic structure of E. japonicus. Only the first SNP for each RAD locus was kept to reduce linkage disequilibrium in the dataset. We explored the possibility of cryptic structure across the six sampled regions using ADMIXTURE v1.23, a Bayesian model-based clustering program (Alexander et al., 2009). We ran the ADMIXTURE model across K = 1 to 7 with ten replicates for each value to estimate the most likely number of clusters by plotting the natural probability of four estimators (MEDMEDK, MEDMEAK, MAXMEDK, and MAXMEAK) and we determined the optimal K value where the estimators plateaued as described in Puechmaille (2016). The most likely K for each estimator was selected by using STRUCTURESELECTOR (Li and Liu, 2018) and graphical representations of the results were obtained by integrating the CLUMPAK program (Kopelman et al., 2015). The input files was converted into PLINK format files (MAP/PED) for ADMIXTURE with VCFtools (Danecek et al., 2011). We also attempted to cluster individual samples from regional groups by discriminant analysis of principal components (DAPC, Jombart et al., 2010) using Adegenet (Jombart, 2008) for R (R Development Core Team, 2015) and the number of principal components was decided by optim-alpha-score indication. To examine the extent of population structuring of E. japonicus, we used sampling locations (K = 6) as prior information for individual sample cluster membership, because DAPC without prior indicated that a single genetic cluster (K = 1) best fitted the dataset. Similar approaches were applied in recently published papers of other high gene flow marine species (Gonçalves da Silva et al., 2015; Benestan et al., 2017). Furthermore, pairwise FST was calculated between each pair of regional populations based on analysis of molecular variance (AMOVA) as implemented in ARLEQUIN 3.5 (Excoffier and Lischer, 2010). Fixation indices were calculated and significance levels were determined with 10,000 permutations.
Detection of Loci Under Putative Selection
Two approaches were applied to detect for the signature of local adaptation of E. japonicus based on the genome-wide dataset of SNPs (28,782 filtered SNPs). First, LOSITAN was used to test for local selection by searching for outlier loci showing increased population differentiation (Antao et al., 2008). We run LOSITAN analyses using parameter settings of 50,000 simulations, a false discovery rate of 0.1 and confidence interval of 0.95. Then a Bayesian regression framework for modeling FST at each loci was applied to test for signatures of natural selection as implemented in the software BAYESCAN v.2.1 (Foll and Gaggiotti, 2008). To determine the significance of the models, the threshold false discovery rate (FDR) was set at 5% and the q-value for each loci was calculated. BAYESCAN was applied with a final run length of 100,000 steps (with 50,000 steps as burn-in and the remainder used to estimate the posterior distribution of the parameters).
Results
RAD Sequencing and SNP Genotyping
Sequencing of 389 individuals resulted in a total of ∼3.37 billion read pairs. The mean number of quality filtered read pairs per individual was around 6.35 million (range from 2,409,272 to 14,987,989; Supplementary Table S1). After keeping the first SNP per RAD locus, 12, 627 SNPs were finally retained from a total of 28,782 filtered SNPs. The average depth of SNP per individual was observed to be greater than 18× with an observed transition: transversion ratio of 1.32 (Supplementary Table S2). The assembly results from all 40 individuals for each RAD locus resulted in a total of 1,079,853 contigs with a mean length of 343.4 bp. Detailed information for counts of candidate SNPs after each filtering step are shown in Table 2.
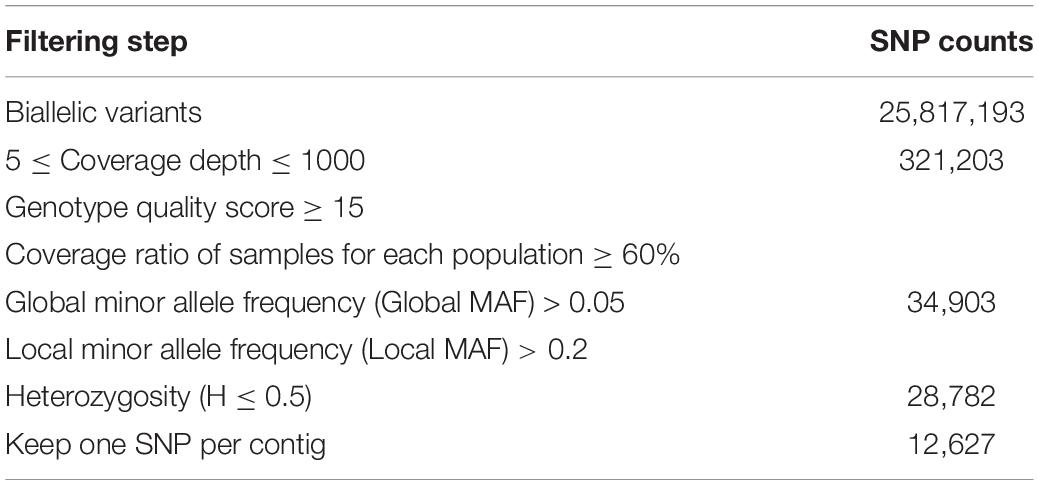
Table 2. Summary statistics for counts of putative SNP loci and final counts of candidate SNPs after different filtering steps.
Population Genetic Analyses
Analysis in ADMIXTURE revealed no population structure and the optimum value of K determined by MEDMEDK, MEDMEAK, MAXMEDK, and MAXMEAK was found to be K = 1 (Supplementary Figure S1). To examine the extent of population structure across the six regional groups, DAPC was applied with prior information of sampling locations (K = 6) because DAPC without prior indicated that one single genetic cluster (K = 1) was best for the dataset. The scatter plot of DAPC analysis using the first two principle axes did not show a complete overlap among regional groups with “the Japan Sea population (JPS)” and “the Taiwan Coastal Waters population (TWC)” exhibiting the minimal overlap, suggesting the existence of genetic heterogeneity across the six regions (Figure 2). Moreover, according to pairwise FST based on AMOVA, marginal significant genetic differentiation (average FST value was approximately equal to 0.002) was revealed between “the Japan Sea population (JPS)” and “the Bohai Sea population (BHS)” as well as between
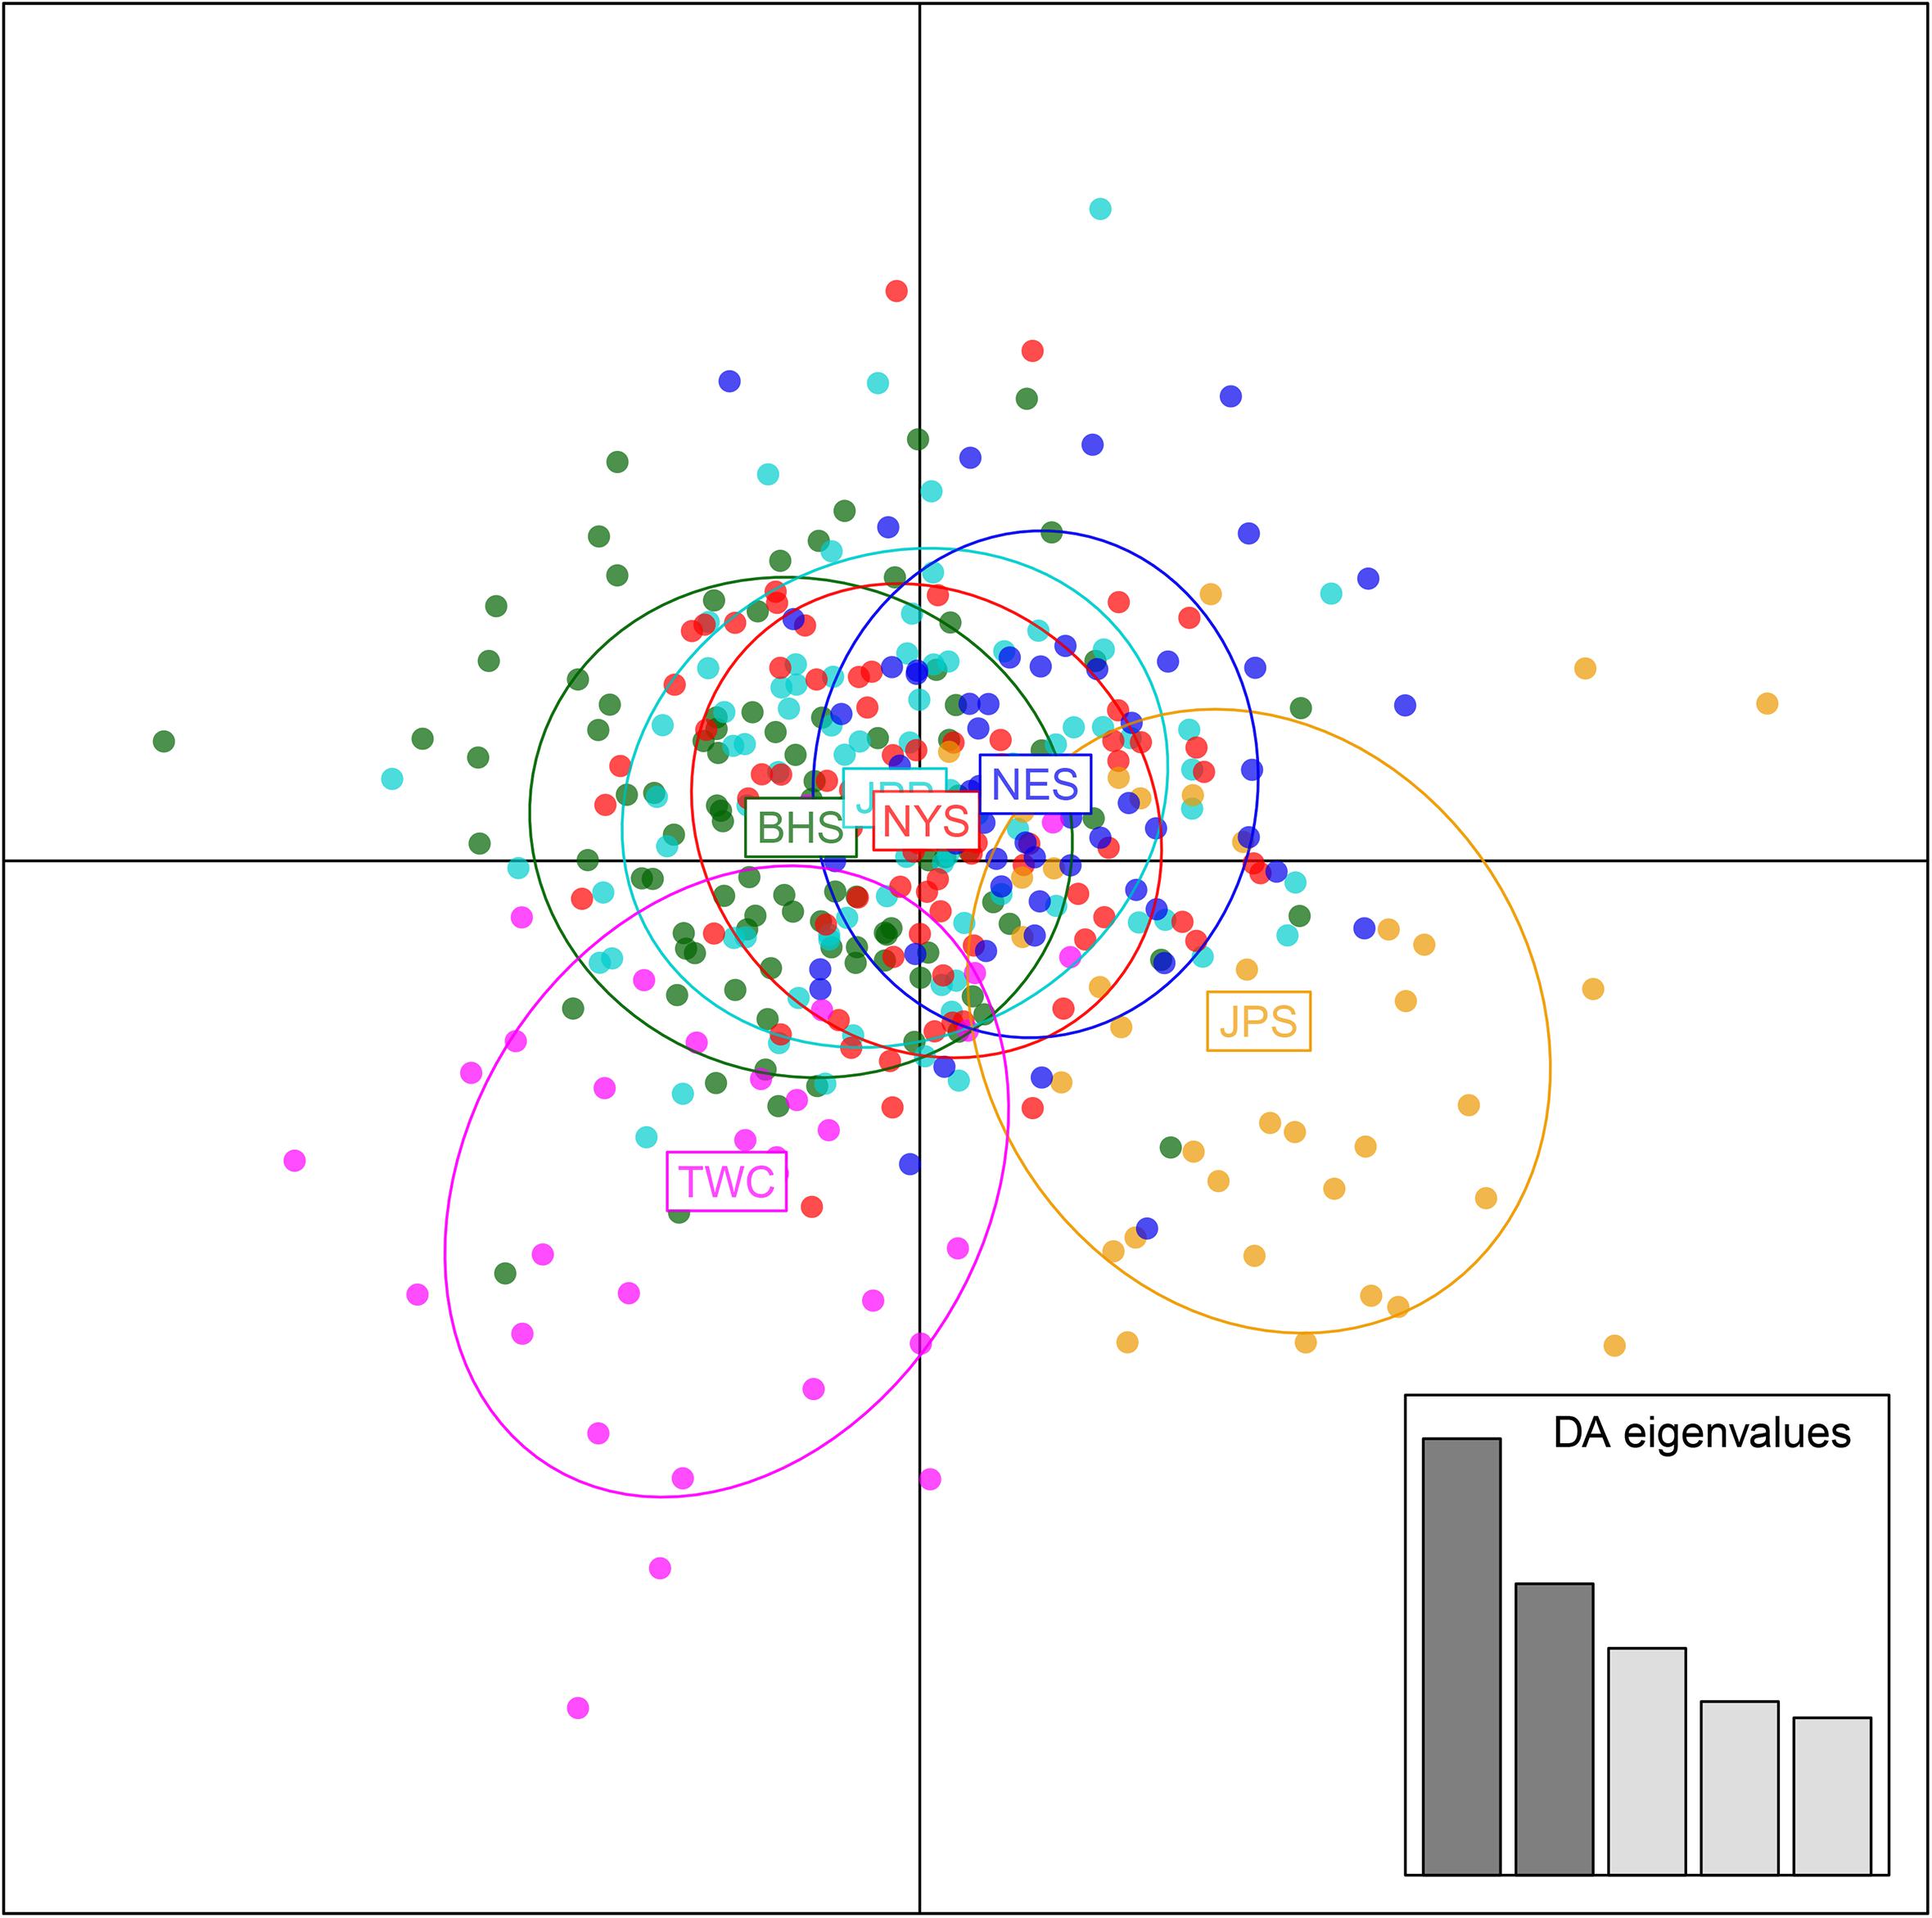
Figure 2. Discriminant analysis of principal components (DAPC) plots for 12, 627 SNPs in six regional populations of E. japonicus. Ellipse centers of each cloud of points represent each sampling regions.
“the Japan Sea population (JPS),” and “the North Yellow Sea population (NYS)” (Table 3). In addition, no significant pairwise FST was detected among the other pairs of regional populations. The overall results obtained were mostly consistent with our expectations that a very low level of genetic differentiation was found among regional populations of E. japonicus with high levels of gene flow. However, it should also be noted that the results reported here were to some extent inconsistent, which might be attributed to different model-driven approaches applied in the current study. For instance, ADMIXTURE is a method searching for partitions corresponding to populations without sampling location information, which therefore might not be advantageous in identifying clusters when FST values are small (Latch et al., 2006; François and Durand, 2010). Moreover, although the sample sizes used in our study are considered to meet the requirements to obtain statistically valid results (Willing et al., 2012), uneven sampling of populations could also to some extent limit the statistical power of population genetic analysis when investigating genetic differentiation in high gene flow marine species. Nevertheless, our findings provide evidence for a discernable, albeit weak population structure of E. japonicus in the northwestern Pacific Ocean.
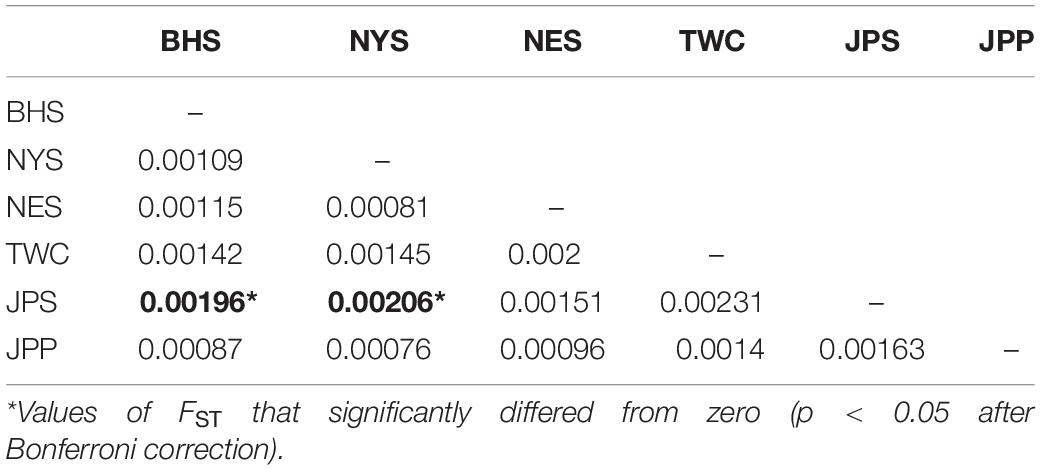
Table 3. Pairwise FST among 6 geographical regions of E. japonicus based on the dataset of 12,627 SNPs.
Detection of Loci Under Putative Selection
LOSITAN failed to detect any significant FST outliers and thus found no evidence for local adaptation (Figure 3). Similarly, BAYESCAN identified only six outlier loci (contained in 4 unique RAD locus) as most loci had FDR values >0.05 (Figure 4). Additionally, no significant hits (E-value ≤ 0.01) were obtained when blasting the assembled contigs harboring the outlier loci to various bony fish genomes. These two approaches are characterized by different error profiles, LOSITAN is more error prone (low false negatives) and BAYESCAN is more conservative (low false positive; Narum and Hess, 2011). Nevertheless, both approaches detected a lack of genomic signature of local adaptation in E. japonicus.
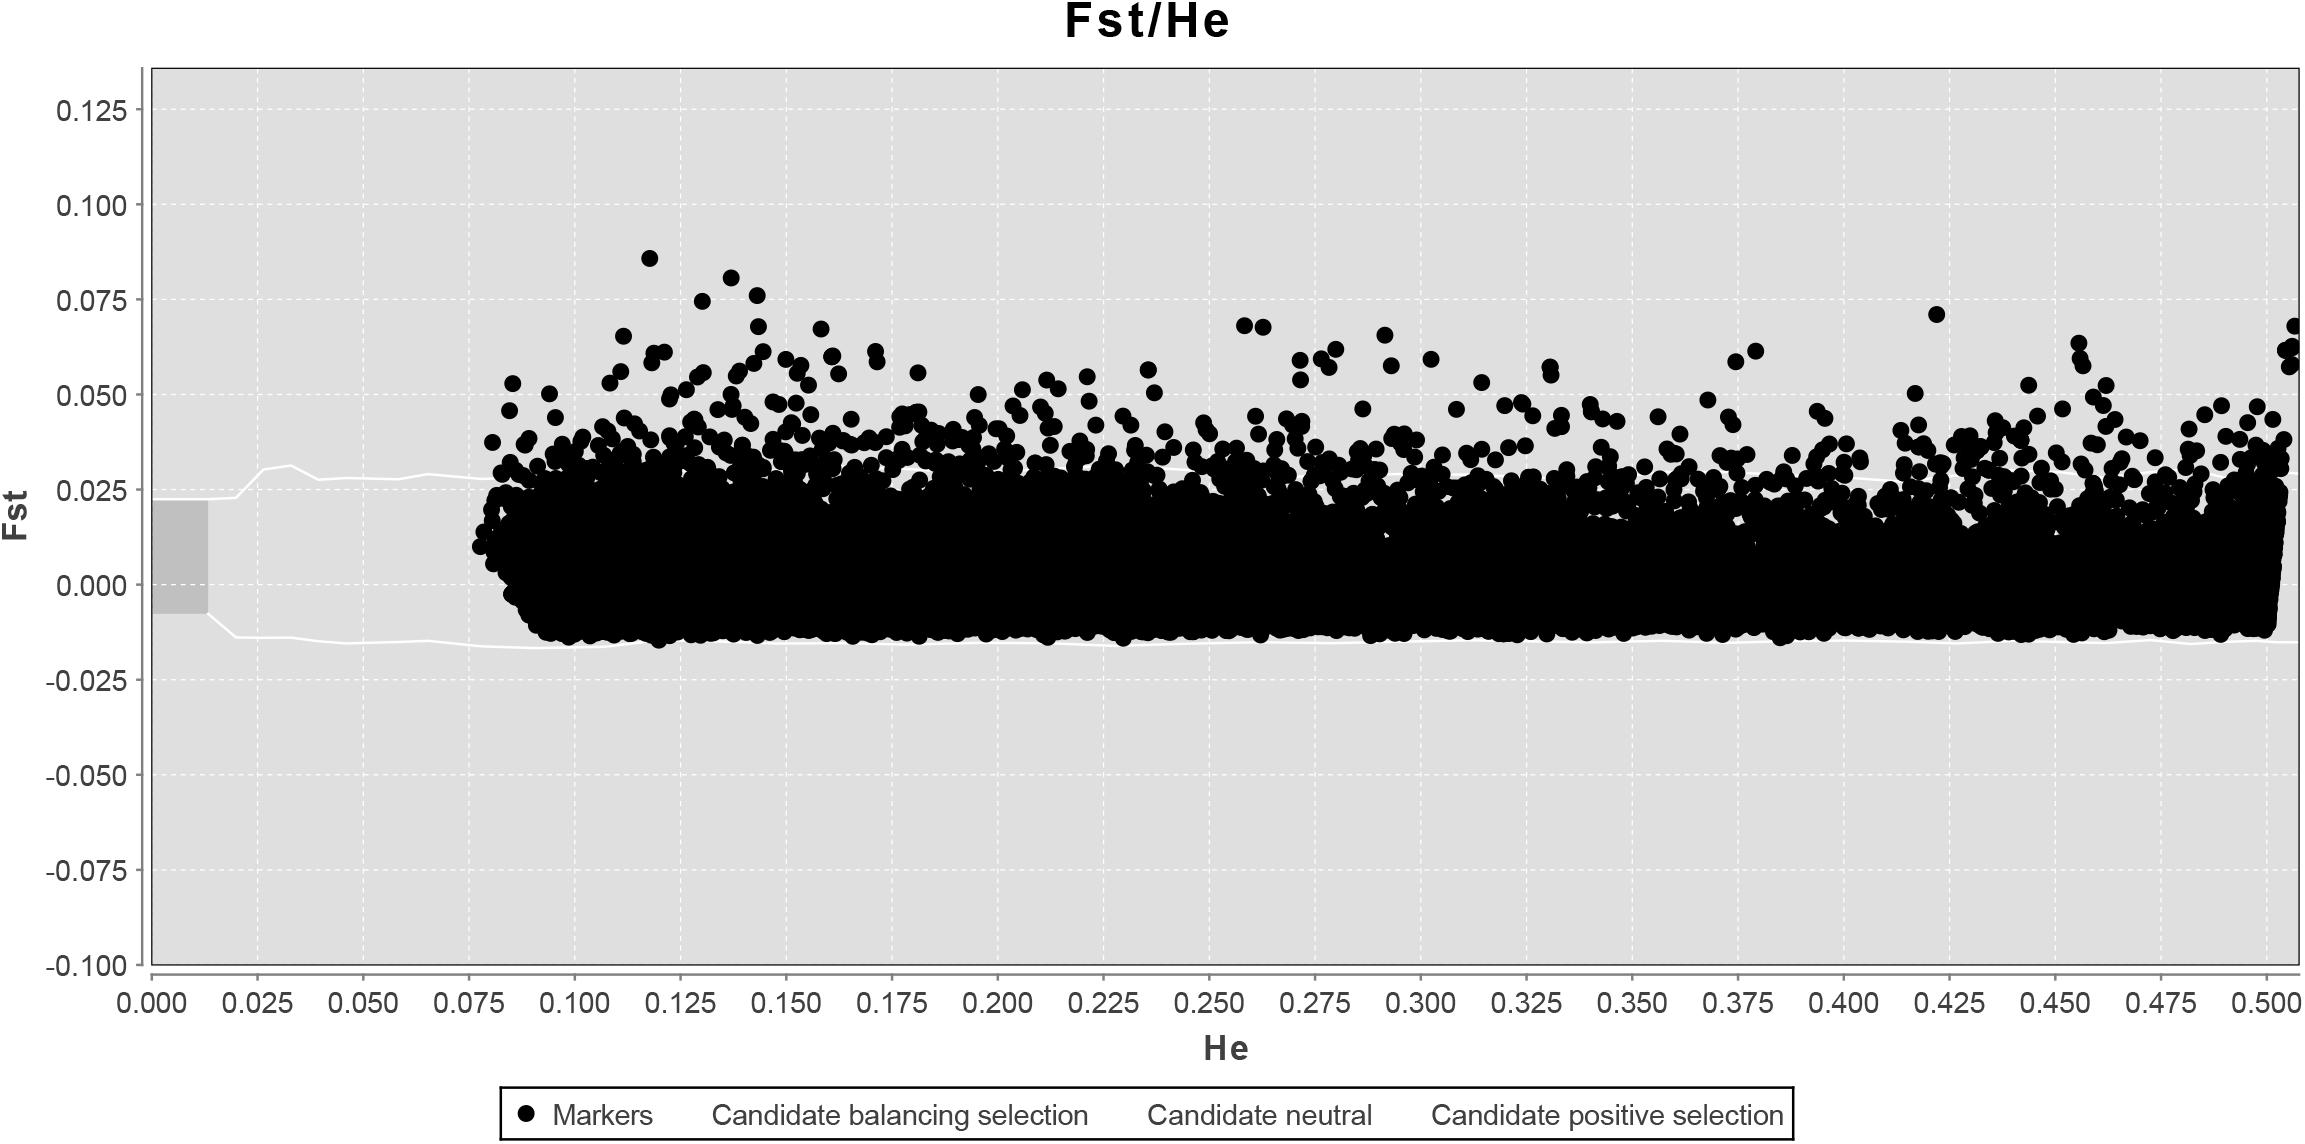
Figure 3. Test for neutrality using LOSITAN based on 28,782 SNPs. Observed value of heterozygosity vs. FST at each locus (black dots) and 95% confidence envelope expected under neutrality.
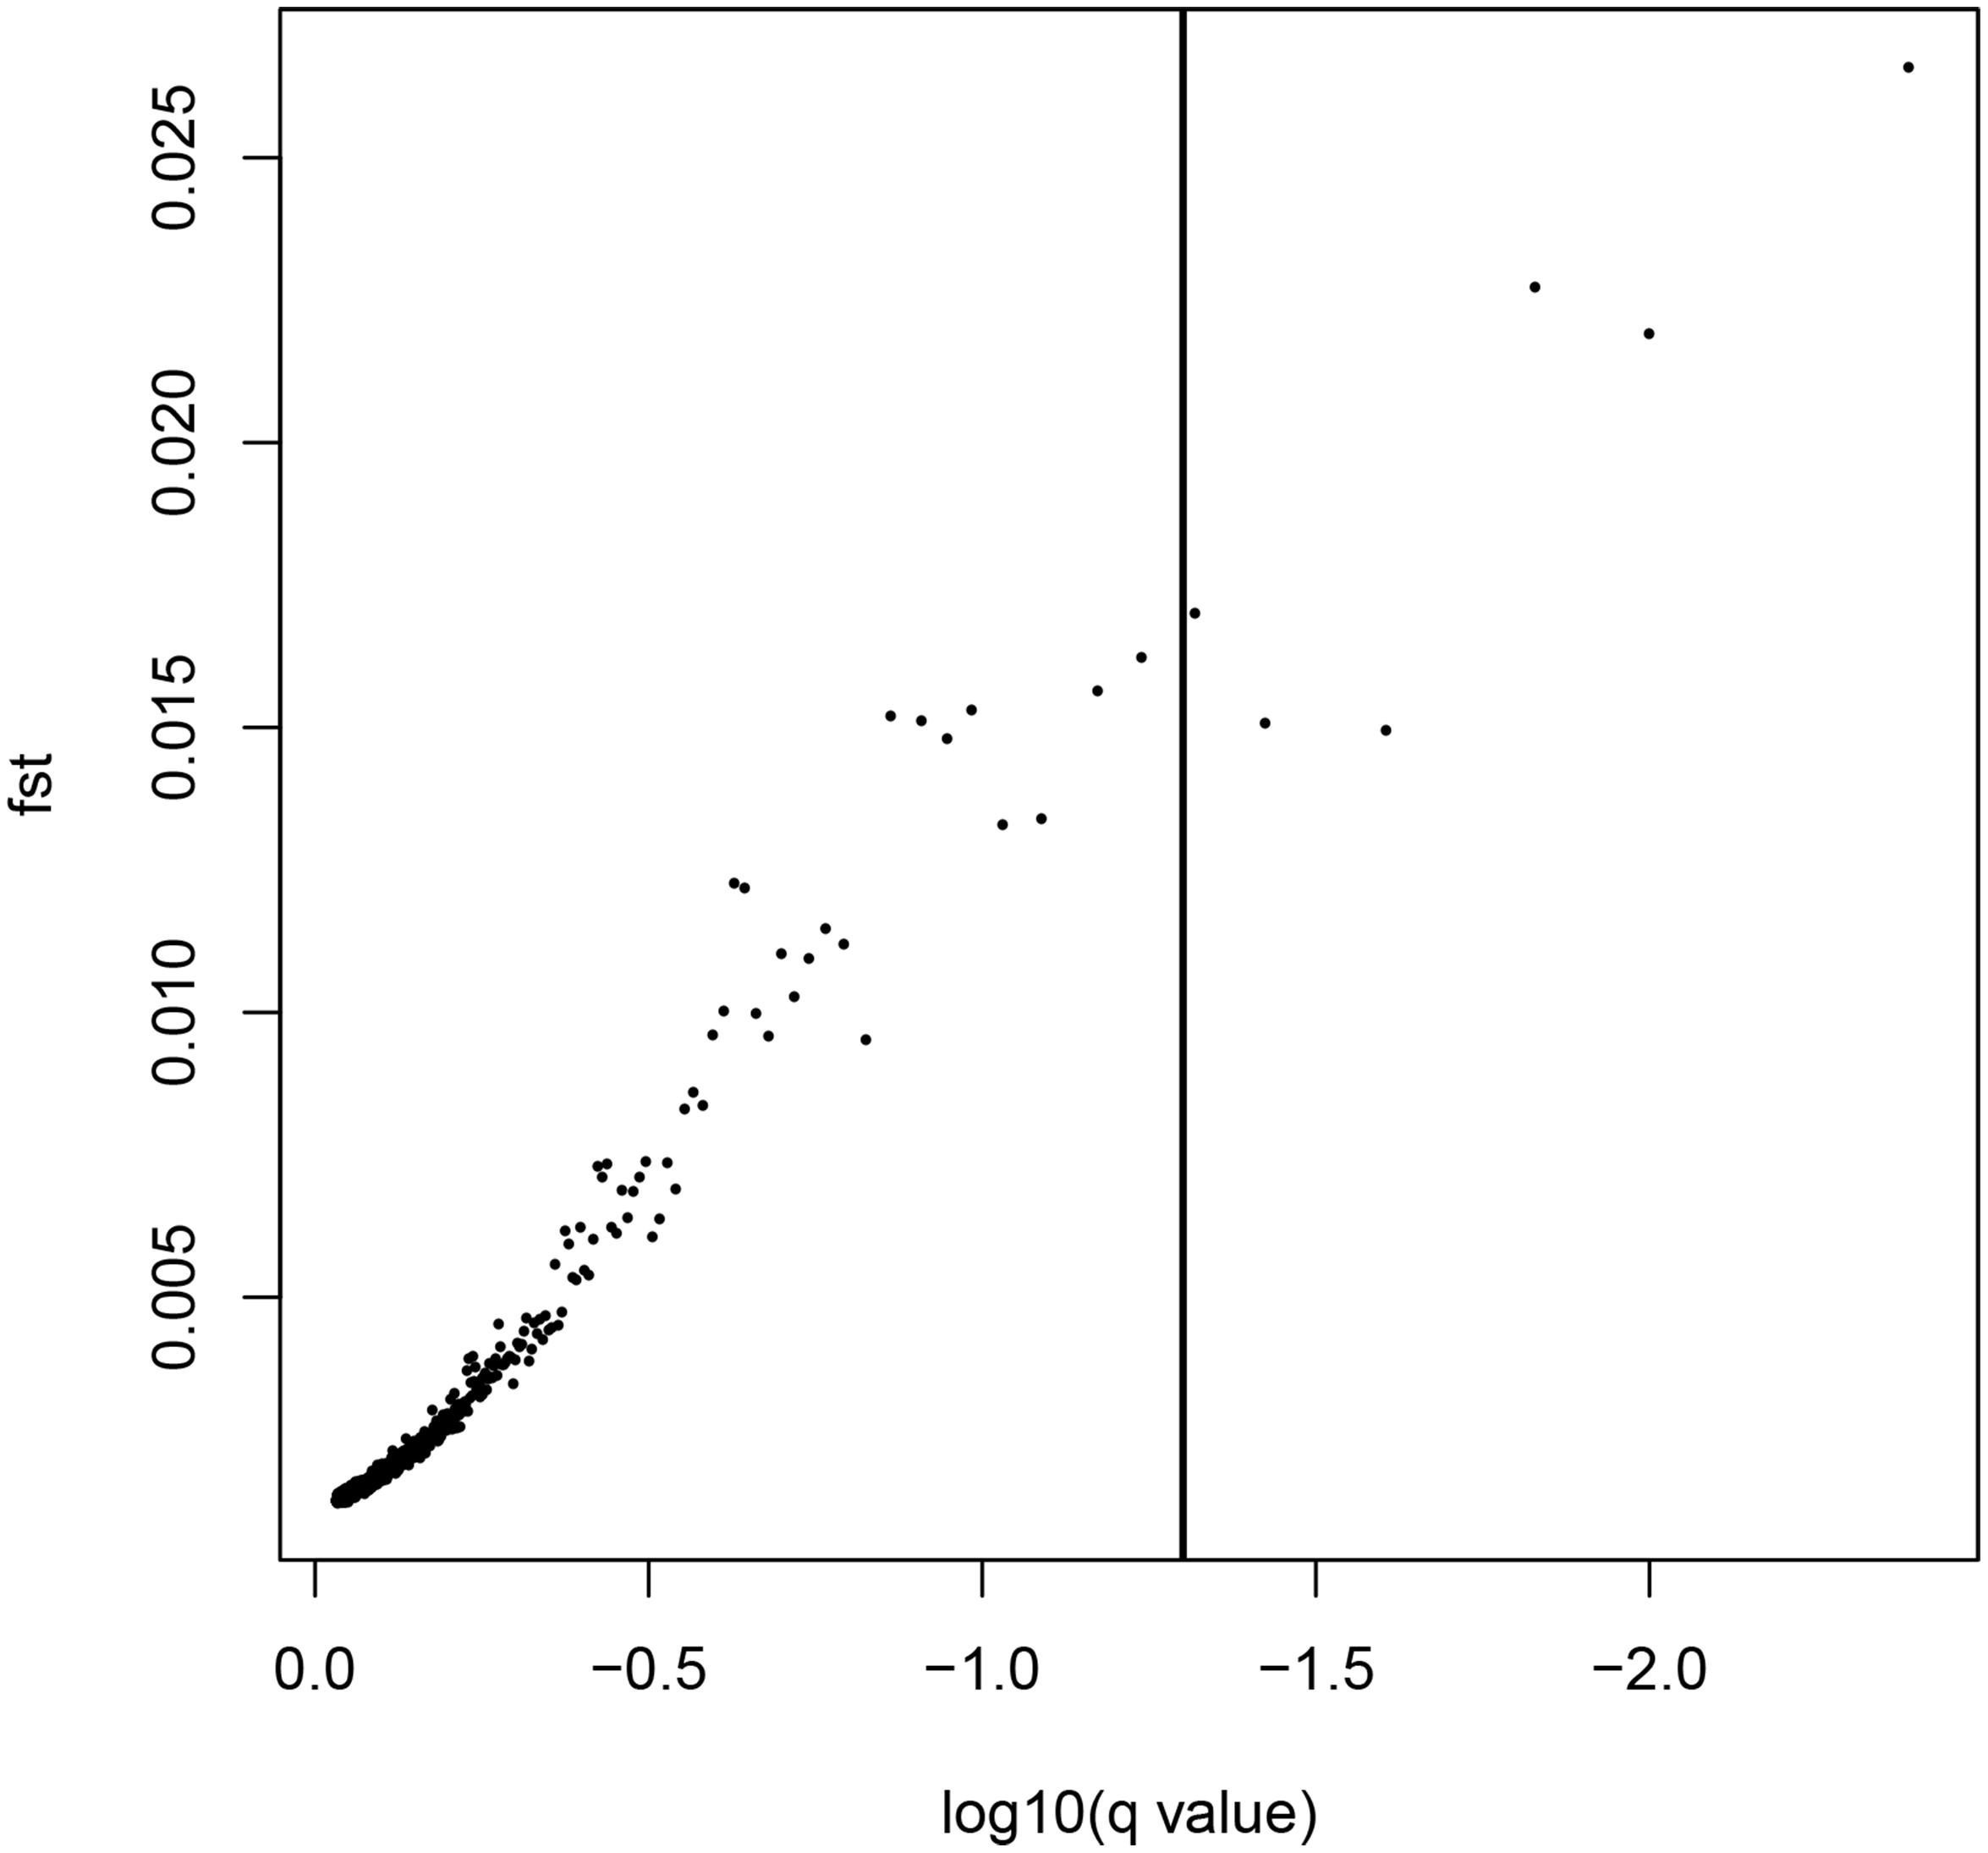
Figure 4. Results from the Bayescan FST outlier analysis for 28,782 SNPs (black dots). Six SNPs on the right side of the vertical line are above a 0.95 probability for being candidates of selection.
Discussion
Recent advances in the field of population genomics promote the identification of genome-wide SNP markers, which facilitates the detection of population structure in wild populations of marine fish characterized by high gene flow or very large population sizes (Waples and Gaggiotti, 2006; Lowe and Allendorf, 2010; Ellegren, 2014). In the current study, the number of markers used to assess the genetic variation in E. japonicus shows a thousand-fold increase compared to the number of markers used in previous microsatellite studies (Yu et al., 2002; Lin et al., 2011). The marked increase in loci is presumably sampling much higher marker density and thus leads to improved accuracy in estimating population genetic parameters (Allendorf et al., 2010). Comparatively, our genetic analyses with genome-wide SNP markers exhibited higher statistical power as compared to previous works. Indeed, marginal significant differentiation was detected among some populations of E. japonicus. According to the results obtained from DAPC analysis, “the Japan Sea Group (JPS)” showed the minimal overlap to “Taiwan Coastal Waters Group (TWC)”. Furthermore, the pairwise FST value between these two regions was also found to be the highest among all pairs, however, the differentiation was not significant after correction (Table 3). Possible causes for this discrepancy might be attributed to the smaller sample size used in JPS and TWC compared to the other regional populations, which may lead to reduced statistical power. The JPS and TWC represent physically and biologically distinct ecosystems and therefore, the geographical disconnection between the two regions suggests that an incomplete biogeographic barrier might exist (Rebstock and Kang, 2003). Additionally, pairwise FST based on AMOVA analysis revealed shallow but significant genetic differentiation between the JPS and the Yellow Sea Trough (BHS and NYS). Possible causes for the shallow genetic differentiation might be attributed to the fact that the JPS is a semi-enclosed marginal sea of the northwest Pacific Ocean, which may reduce gene flow between these areas. In contrast, no significant population genetic structure was found by ADMIXTURE and possible causes for this discrepancy in results might be that genetic differentiation among the regional population of E. japonicus was too shallow to be detected by ADMIXTURE. As this model did not incorporate a priori sampling location information in the analysis, which made it challenging to reveal the genetic structure when FST values are small (Latch et al., 2006; François and Durand, 2010).
It is important to note that the interaction between the biological and physical processes drive the population structures of many organisms inhabiting the marine environment. Although biological characteristics of marine organisms facilitate connectivity among regional populations, physical processes such as ocean currents as well as fronts can also have significant impacts on genetic structure despite their long-distance dispersal potential. The Korean Peninsula is surrounded by three seas including the JPS, the East China Sea, and the Yellow Sea, which represents three contiguous but distinct ecosystems (Rebstock and Kang, 2003). Therefore, genetic differentiation between populations in the JPS and Yellow Sea Trough could be closely related to different water masses as well as ocean currents around the Korean Peninsula. For example, under the influences of tidal mixing between the surface and bottom waters, a tidal front is formed near south-western coast of the Korean Peninsula, which acts as an incomplete physical barrier and thus limits the distribution and migration of marine fishes (Han et al., 2019). Furthermore, water exchange between the East China Sea and the Yellow Sea is much weaker than that between the JPS and the East China Sea (Rebstock and Kang, 2003). Because the southern part of the JPS is influenced by Tsushima Warm Current (TSWC) flowing northeastward in one direction from the East China Sea through the Tsushima Strait, which forms a strong hydrographic connection between these areas. Although the Yellow Sea Warm Current (YSWC) intrudes into the Yellow Sea from the East China Sea, the advection only occurs episodically (Riedlinger and Jacobs, 2000; Lie et al., 2001; Lin and Yang, 2011). Moreover, higher levels of population connectivity between NES and JPP were detected based on both pairwise FST and DAPC analysis. It should be noted that populations from these regions were located in a relatively open environment with fewer geographical barriers. On the other hand, the spawning grounds of E. japonicus are widely distributed in coastal areas of the BHS, the Yellow Sea, the East China Sea as well as in Japan while E. japonicus were observed to have a protracted spawning season extending from May to October with multiple spawning times (Deng and Zhao, 1991). Therefore, the wide dispersal of planktonic larvae owing to prevailing oceanic currents suggests high levels of connectivity among these populations. The genetic homogeneity is consistent with the results from previous studies based on mitochondrial DNA sequences, which suggests a high rate of recruitment among these areas (Yu et al., 2005; Liu et al., 2006).
In addition to detect previously unidentified genetic structure, population genomic approaches can identify a few percentages of putative adaptive loci with elevated divergence from neutral expectations (Hohenlohe et al., 2010; Hess et al., 2013; Guo et al., 2016). Selective pressures under different environments could result in adaptive divergence among populations despite high gene flow (Allendorf et al., 2010; Ellegren, 2014). Influences of oceanographic factors like ocean currents as well as monsoons cause significant environmental changes in the northwestern Pacific, which provides chances for local adaptation of E. japonicus across the distribution range (Johnson and Boyer, 2015). Although favorable alleles due to local selective pressures can be more likely to be detected as large population sizes of marine fishes reduce the effect of genetic drift (Nielsen et al., 2009), no sign of genomic signatures of natural selection was detected in our present study. It should be noted that not all population genomic approaches reveal a few percentages of potentially adaptive loci in marine fish species with high gene flow (Gonçalves da Silva et al., 2015; Martinez et al., 2017). Hence, the results obtained in the current study lead us to conclude that the lack of signatures of natural selection in the current dataset might be attributed to high gene flow among regional populations of E. japonicus. Nevertheless, it should be also noted that even though we have examined a large number of genomewide loci compared to previous studies, our markers might not cover genomic sections influenced by natural selection.
Population genomic approaches applied here provided detailed information on the genetic connectivity of E. japonicus at the genome-wide scale. With the potential biological and physical barriers to dispersion in the northwestern Pacific, population connectivity of E. japonicus might not be assumed to be boundless. Our findings indicated that there might be marginal differentiation between regional populations of the JPS and the Yellow Sea Trough as well as the JPS and TWC, respectively. However, the current analysis is unable to specify whether populations from the East China Sea and the Pacific side of Japan were a mixture of populations as one single panmictic population or instead represent as multiple separate populations. Because effective management of species of highly economic importance often rely on estimates of “population connectivity” including both genetic connectivity and demographic connectivity (Lowe and Allendorf, 2010). “Crinkled connectivity” occurs when connectivity is high enough to make the populations genetically similar, but not high enough to make them demographically linked (Ovenden, 2013). Therefore, genetics alone may not be a good enough guide to demographic connectivity especially in wild populations of marine fish characterized by high migration rate or large population sizes. Because of when connectivity between a population pair is crinkled as having “crinkled connectivity,” it would be regarded as one population genetically, whereas demographically there would be two (Ovenden, 2013). In addition, even though the sample sizes in the present study were considered to meet the requirements to obtain statistically valid results (Willing et al., 2012), uneven sampling among different regional populations as well as sampling at different developmental stages might also limit the accuracy of population genetic analysis, especially when investigating genetic differentiation in high gene flow marine fish. The potential factors of uneven sampling scheme as well as sampling at different development stages affecting on the genetic structure of E. japonicus will be further assessed in future studies. Nevertheless, to our knowledge, this is the first study assessing the genetic differentiation in E. japonicus based on genome wide SNP dataset and our findings supported a previously unidentified structure in this high gene flow marine fish. Moreover, further studies are still needed to obtain improved estimates of population connectivity based on dataset combining both genetic and demographic information, which would provide invaluable information for fisheries management of E. japonicus. Overall, our results should improve our understanding of fine-scale population genetic structure in E. japonicus and thus may assist in designating potential population units as well as fisheries management strategies for this species.
Data Availability Statement
Data is publicly accessible at GenBank under Bioproject accession number PRJNA602387 and Biosample accession numbers SAMN13898914–SAMN13899302.
Ethics Statement
This study involving the sampled fish was reviewed and approved by the Insititutional Review Board of Institute of Oceanology, Chinese Academy of Sciences, and all procedures performed in this study were in accordance with the ethical standards of the institutional and/or national research committee.
Author Contributions
B-DZ conceived and designed the experiments, performed the experiments, analyzed the data, contributed reagents, materials, and analysis tools, prepared the figures and/or tables, authored or reviewed drafts of the manuscript, and approved the final draft. Y-LL analyzed the data, approved the final draft. D-XX performed the experiments and approved the final draft. J-XL conceived and designed the experiments, authored or reviewed drafts of the manuscript, and approved the final draft.
Funding
The work was supported by the National Natural Science Foundation of China (41706162); the China Postdoctoral Science Foundation (2018M632734); and the Youth Talent Support Program of the Laboratory for Marine Ecology and Environmental Science, Pilot National Laboratory for Marine Science and Technology (Qingdao; LMEES-YTSP-2018-01-05).
Conflict of Interest
The authors declare that the research was conducted in the absence of any commercial or financial relationships that could be construed as a potential conflict of interest.
Acknowledgments
We would like to thank Prof. Tai-Sheng Chiu, Kuang-Zong Chang of National Taiwan University, Prof. Shuh-Sen Young of National Tsing Hua University, and Dr. Kōji Yokogawa for their help in collecting samples.
Supplementary Material
The Supplementary Material for this article can be found online at: https://www.frontiersin.org/articles/10.3389/fmars.2020.00374/full#supplementary-material
FIGURE S1 | The line diagram indicates the corresponding MEDMEDK, MEDMEAK, MAXMEDK, and MAXMEAK statistics.
TABLE S1 | Summary statistics of RAD data for each individual of E. japonicus in this study.
TABLE S2 | Number of successfully genotyped SNPs and average coverage depth for each individual of E. japonicas in this study.
References
Alexander, D. H., Novembre, J., and Lange, K. (2009). Fast model-based estimation of ancestry in unrelated individuals. Genome Res. 19, 1655–1664. doi: 10.1101/gr.094052.109
Allendorf, F. W., Hohenlohe, P. A., and Luikart, G. (2010). Genomics and the future of conservation genetics. Nat. Rev. Genet. 11, 697–709. doi: 10.1038/nrg2844
Antao, T., Lopes, A., Lopes, R. J., Beja-Pereira, A., and Luikart, G. (2008). LOSITAN: a workbench to detect molecular adaptation based on a FST-outlier method. BMC Bioinformatics 9:323. doi: 10.1186/1471-2105-9-323
Baird, N. A., Etter, P. D., Atwood, T. S., Currey, M. C., Shiver, A. L., Lewis, Z. A., et al. (2008). Rapid SNP discovery and genetic mapping using sequenced RAD Markers. PLoS One 3:e3376. doi: 10.1371/journal.pone.0003376
Benestan, L., Moore, J. S., Sutherland, B. J. G., Le Luyer, J., Maaroufi, H., Rougeux, C., et al. (2017). Sex matters in massive parallel sequencing: evidence for biases in genetic parameter estimation and investigation of sex determination systems. Mol. Ecol. 26, 6767–6783. doi: 10.1111/mec.14217
Cano, J. M., Shikano, T., Kuparinen, A., and Merilä, J. (2008). Genetic differentiation, effective population size and gene flow in marine fishes: implications for stock management. J. Integr. Field Biol. 5, 1–10.
Carvalho, G. R. (1994). Molecular genetics and the stock concept in fisheries. Rev. Fish Biol. Fish. 4, 326–350.
Catchen, J., Hohenlohe, P. A., Bassham, S., Amores, A., and Cresko, W. A. (2013). Stacks: an analysis tool set for population genomics. Mol. Ecol. 22, 3124–3140. doi: 10.1111/mec.12354
Chen, C. S., Tzeng, C. H., and Chiu, T. S. (2010). Morphological and molecular analyses reveal separations among spatiotemporal populations of anchovy (Engraulis japonicus) in the southern East China Sea. Zool. Stud. 49, 270–282.
Conover, D. O., Clarke, L. M., Munich, S. B., and Wagner, G. N. (2006). Spatial and temporal scales of adaptive divergence in marine fishes and the implications for conservation. J. Fish Biol. 69, 21–47.
Corander, J., Majander, K. K., Cheng, L., and Merilä, J. (2013). High degree of cryptic population differentiation in the Baltic Sea herring Clupea harengus. Mol. Ecol. 22, 2931–2940. doi: 10.1111/mec.12174
Danecek, P., Auton, A., Abecasis, G., Albers, C. A., Banks, E., DePristo, M. A., et al. (2011). The variant call format and VCFtools. Bioinformatics 27, 2156–2158. doi: 10.1093/bioinformatics/btr330
R Development Core Team (2015). R: A Language and Environment for Statistical Computing. Vienna: R Foundation for Statistical Computing.
Ellegren, H. (2014). Genome sequencing and population genomics in non-model organisms. Trends Ecol. Evol. 29, 51–63. doi: 10.1016/j.tree.2013.09.008
Etter, P. D., Bassham, S., Hohenlohe, P. A., Johnson, E. A., and Cresko, W. A. (2011). SNP discovery and genotyping for evolutionary genetics using RAD sequencing. Methods Mol. Biol. 772, 157–178. doi: 10.1007/978-1-61779-228-1_9
Excoffier, L., and Lischer, H. E. L. (2010). Arlequin suite ver 3.5: a new series of programs to perform population genetics analyses under Linux and Windows. Mol. Ecol. Resour. 10, 564–567. doi: 10.1111/j.1755-0998.2010.02847.x
Foll, M., and Gaggiotti, O. (2008). A genome-scan method to identify selected loci appropriate for both dominant and codominant markers: a Bayesian perspective. Genetics 180, 977–993. doi: 10.1534/genetics.108.092221
François, O., and Durand, E. (2010). Spatially explicit Bayesian clustering models in population genetics. Mol. Ecol. Resour. 10, 773–784. doi: 10.1111/j.1755-0998.2010.02868.x
Funamoto, T., Aoki, I., and Wada, Y. (2004). Reproductive characteristics of Japanese anchovy, Engraulis japonicus, in two bays of Japan. Fish. Res. 70, 71–81. doi: 10.1111/j.1095-8649.2010.02683.x
Funk, W. C., Mckay, J. K., Hohenlohe, P. A., and Allendorf, F. W. (2012). Harnessing genomics for delineating conservation units. Trends Ecol. Evol. 27, 489–496. doi: 10.1016/j.tree.2012.05.012
Gonçalves da Silva, A., Appleyard, S. A., and Upston, J. (2015). Establishing the evolutionary compatibility of potential sources of colonizers for overfished stocks: a population genomics approach. Mol. Ecol. 24, 564–579. doi: 10.1111/mec.13046
Guo, B., Li, Z., and Merilä, J. (2016). Population genomic evidence for adaptive differentiation in the Baltic Sea herring. Mol. Ecol. 25, 2833–2852. doi: 10.1111/mec.13657
Han, S. Y., Kim, J. K., Tashiro, F., Kai, Y., and Yoo, J. T. (2019). Relative importance of ocean currents and fronts in population structures of marine fish: a lesson from the cryptic lineages of the Hippocampus mohnikei complex. Mar. Biodivers. 49, 263–275.
Hayashi, S. (1961). Fishery biology of Japanese anchovy Engraulis japonica (HOUTTYN). Bull. Tokai Reg. Fish. Res. Lab. 31, 145–268.
Hess, J. E., Campbell, N. R., Close, D. A., Docker, M. F., and Narum, S. R. (2013). Population genomics of Pacific lamprey: adaptive variation in a highly dispersive species. Mol. Ecol. 22, 2898–2916. doi: 10.1111/mec.12150
Hilborn, R., Quinn, T. P., Schindler, D. E., and Rogers, D. E. (2003). Biocomplexity and fisheries sustainability. Proc. Natl. Acad. Sci. U.S.A. 100, 6564–6568. doi: 10.1073/pnas.1037274100
Hohenlohe, P. A., Bassham, S., Etter, P. D., Stiffler, N., Johnson, E. A., and Cresko, W. A. (2010). Population genomics of parallel adaptation in threespine stickleback using sequenced RAD tags. PLoS Genet. 6:e1000862. doi: 10.1371/journal.pgen.1000862
Ilut, D. C., Nydam, M. L., and Hare, M. P. (2014). Defining loci in restriction-based reduced representation genomic data from nonmodel species: sources of bias and diagnostics for optimal clustering. Biomed Res. Int. 2014:675158. doi: 10.1155/2014/675158
Iversen, S. A., Zhao, X., Hamre, J., Jin, X., Johannessen, A., and Li, F. (2005). The rise and fall of the Yellow Sea anchovy fishey monitored by acoustic surves with R/V “Bei Dou” 1984-2005. Paper Presented at the “Bei Dou” Seminar, YSFRI, Qingdao, China, 13-14, November 2005.8pp, Qingdao.
Johnson, D. R., and Boyer, T. P. (2015). East Asian Seas Regional Climatology (Version 2). Asheville, NC: National Centers for Environmental Information, NOAA. doi: 10.7289/V5MP5171
Jombart, T. (2008). adegenet: a R package for the multivariate analysis of genetic markers. Bioinformatics 24, 1403–1405. doi: 10.1093/bioinformatics/btn129
Jombart, T., Devillard, S., and Balloux, F. (2010). Discriminant analysis of principal components: a new method for the analysis of genetically structured populations. BMC Genet. 11:94. doi: 10.1186/1471-2156-11-94
Kopelman, N. M., Mayzel, J., Jakobsson, M., Rosenberg, N. A., and Mayrose, I. (2015). CLUMPAK: a program for identifying clustering modes and packaging population structure inferences across K. Mol. Ecol. Resour. 15, 1179–1191. doi: 10.1111/1755-0998.12387
Latch, E. K., Dharmarajan, G., Glaubitz, J. C., and Rhodes, O. E. (2006). Relative performance of Bayesian clustering software for inferring population substructure and individual assignment at low levels of population differentiation. Conserv. Genet. 7, 295–302.
Li, Y. L., and Liu, J. X. (2018). StructureSelector: a web-based software to select and visualize the optimal number of clusters using multiple methods. Mol. Ecol. Resour. 18, 176–177. doi: 10.1111/1755-0998.12719
Li, Y. L., Xue, D. X., Zhang, B. D., and Liu, J. X. (2018). An optimized approach for local de novo assembly of overlapping paired-end RAD reads from multiple individuals. R. Soc. Open Sci. 5:171589. doi: 10.1098/rsos.171589
Lie, H. J., Cho, C. H., Lee, J. H., Lee, S., Tang, Y., and Zou, E. (2001). Does the Yellow Sea warm current really exist as a persistent mean flow? J. Geophys. Res. 106, 22199–22210.
Lin, L., Zhu, L., Liu, S. F., Su, Y. Q., and Zhuang, Z. M. (2011). Polymorphic microsatellite loci for the Japanese anchovy Engraulis japonicus (Engraulidae). Genet. Mol. Res. 10, 764–768. doi: 10.4238/vol10-2gmr1085
Lin, X. P., and Yang, J. Y. (2011). An asymmetric upwind flow, Yellow Sea Warm Current: 2. Arrested topographic waves in response to the northwesterly wind. J. Geophys. Res. Oceans 116:C04027.
Lischer, H. E. L., and Excoffier, L. (2012). PGDSpider: an automated data conversion tool for connecting population genetics and genomics programs. Bioinformatics 28, 298–299. doi: 10.1093/bioinformatics/btr642
Liu, J. X., Gao, T. X., Zhuang, Z. M., Jin, X. S., Yokogawa, K., and Zhang, Y. P. (2006). Late Pleistocene divergence and subsequent population expansion of two closely related fish species, Japanese anchovy (Engraulis japonicus) and Australian anchovy (Engraulis australis). Mol. Phylogenet. Evol. 40, 712–723. doi: 10.1016/j.ympev.2006.04.019
Lowe, W. H., and Allendorf, F. W. (2010). What can genetics tell us about population connectivity? Mol. Ecol. 19, 3038–3051. doi: 10.1111/j.1365-294X.2010.04688.x
Martin, M. (2011). Cutadapt removes adapter sequences from high-throughput sequencing reads. EMBnet J. 17, 10–12.
Martinez, E., Buonaccorsi, V., Hyde, J. R., and Aguilar, A. (2017). Population genomics reveals high gene flow in grass rockfish (Sebastes rastrelliger). Mar. Genomics 33, 57–63. doi: 10.1016/j.margen.2017.01.004
Miller, M. R., Dunham, J. P., Amores, A., Cresko, W. A., and Johnson, E. A. (2007). Rapid and cost-effective polymorphism identification and genotyping using restriction site associated DNA (RAD) markers. Genome Res. 17, 240–248. doi: 10.1101/gr.5681207
Narum, S. R., and Hess, J. E. (2011). Comparison of FST outlier tests for SNP loci under selection. Mol. Ecol. Resour. 11, 184–194. doi: 10.1111/j.1755-0998.2011.02987.x
Nielsen, E. E., Hemmer-Hansen, J., Larsen, P. F., and Bekkevold, D. (2009). Population genomics of marine fishes: identifying adaptive variation in space and time. Mol. Ecol. 18, 3128–3150. doi: 10.1111/j.1365-294X.2009.04272.x
Ovenden, J. R. (2013). Crinkles in connectivity: combining genetics and other types of biological data to estimate movement and interbreeding between populations. Mar. Freshw. Res. 64, 201–207.
Puechmaille, S. J. (2016). The program structure does not reliably recover the correct population structure when sampling is uneven: subsampling and new estimators alleviate the problem. Mol. Ecol. Resour. 16, 608–627. doi: 10.1111/1755-0998.12512
Pujolar, J. M., Jacobsen, M. W., Frydenberg, J., Als, T. D., Larsen, P. F., Maes, G. E., et al. (2013). A resource of genome-wide single-nucleotide polymorphisms generated by RAD tag sequencing in the critically endangered European eel. Mol. Ecol. Resour. 13, 706–714. doi: 10.1111/1755-0998.12117
Rebstock, G. A., and Kang, Y. S. (2003). A comparison of three marine ecosystems surrounding the Korean peninsula: responses to climate change. Prog. Oceanogr. 59, 357–379.
Ricker, W. E. (1981). Changes in the average size and average age of Pacific salmon. Can. J. Fish. Aquat. Sci. 38, 1636–1656.
Riedlinger, S. K., and Jacobs, G. A. (2000). Study of the dynamics of wind-driven transports into the Yellow Sea during winter. J. Geophys. Res. 105, 28695–28708.
Russello, M. A., Kirk, S. L., Frazer, K. K., and Askey, P. J. (2011). Detection of outlier loci and their utility for fisheries management. Evol. Appl. 5, 39–52. doi: 10.1111/j.1752-4571.2011.00206.x
Salmenkova, E. A. (2011). New view on the population genetic structure of Marine Fish. Russ. J. Genet. 47, 1279–1287.
Saunders, N. C., Kessler, L. G., and Avise, J. C. (1986). Genetic variation and geographic differentiation in mitochondrial DNA of the horseshoe crab, Limulus polyphemus. Genetics 112, 613–627.
Schindler, D. E., Hilborn, R., Chasco, B., Boatright, C. P., Quinn, T. P., Rogers, L. A., et al. (2010). Population diversity and the portfolio effect in an exploited species. Nature 465, 609–612. doi: 10.1038/nature09060
Schlitzer, R. (2019). Ocean Data View. Available online at: https://odv.awi.de/ (accessed January 30, 2020).
Shanks, A. L., Grantham, B. A., and Carr, M. H. (2003). Propagule dispersal distance and the size and spacing of marine reserves. Ecol. Appl. 13, 159–169.
Storz, J. F. (2005). Using genome scans of DNA polymorphism to infer adaptive population divergence. Mol. Ecol. 14, 671–688. doi: 10.1111/j.1365-294X.2005.02437.x
Tanaka, H., Takasuka, A., Aoki, I., and Ohshimo, S. (2008). Geographic variation in the trophic ecology of Japanese anchovy, Engraulis japonicus, inferred from carbon and nitrogen stable isotope ratios. Mar. Biol. 154, 557–568.
Temminck, G. J., and Schlegel, H. (1846). Pisces in Siebold’s Fauna Japonica. Leiden: Lugduni Batavorum.
Trakhtenbrot, A., Nathan, R., Perry, G., and Richardson, D. M. (2005). The importance of long-distance dispersal in biodiversity conservation. Divers. Distrib. 11, 173–181.
Waples, R. S., and Gaggiotti, O. (2006). What is a population? An empirical evaluation of some genetic methods for identifying the number of gene pools and their degree of connectivity. Mol. Ecol. 15, 1419–1439. doi: 10.1111/j.1365-294X.2006.02890.x
Wei, S., and Jiang, W. (1992). Study on food web of fishes in the Yellow Sea. Ocean. Limnol. Sin. 23, 182–192.
Whitehead, P. J. P., Nelson, G. J., and Wongratana, T. (1988). FAO Species Catalogue. Clupeoid Wshes of the world (Suborder Clupeoidei). An Annotated and Illustrated Catalogue of the Herrings, Sardines, Pilchards, Sprats, Shads, Anchovies and Wolf-herrings. Part 2-Engraulididae, Vol. 7. Rome: FAO Fisheries Synopsis.
Willing, E. M., Dreyer, C., and Oosterhout, C. (2012). Estimates of genetic differentiation measured by FST do not necessarily require large sample sizes when using many SNP markers. PLoS One 7:e42649. doi: 10.1371/journal.pone.0042649
Ying, Y. P., Chen, Y., Lin, L. S., and Gao, T. X. (2011). Risks of ignoring fish population spatial structure in fisheries management. Can. J. Fish. Aquat. Sci. 68, 2101–2120.
Yu, H. T., Lee, Y. J., Huang, S. W., and Chiu, T. S. (2002). Genetic analysis of the populations of Japanese anchovy (Engraulidae: Engraulis japonicus) using microsatellite DNA. Mar. Biotechnol. 4, 471–479. doi: 10.1007/s10126-002-0035-8
Yu, Z. N., Kong, X. Y., Guo, T. H., Jiang, Y. Y., Zhuang, Z. M., and Jin, X. S. (2005). Mitochondrial DNA sequence variation of Japanese anchovy Engraulis japonicus from the Yellow Sea and East China Sea. Fish. Sci. 71, 299–307.
Keywords: population genomics, Engraulis japonicus, single nucleotide polymorphism, RAD-seq, genetic structures
Citation: Zhang B-D, Li Y-L, Xue D-X and Liu J-X (2020) Population Genomics Reveals Shallow Genetic Structure in a Connected and Ecologically Important Fish From the Northwestern Pacific Ocean. Front. Mar. Sci. 7:374. doi: 10.3389/fmars.2020.00374
Received: 10 January 2020; Accepted: 01 May 2020;
Published: 28 May 2020.
Edited by:
XueWei Xu, State Oceanic Administration, ChinaReviewed by:
Eleni Petrou, University of Washington, United StatesShang Yin Vanson Liu, National Sun Yat-sen University, Taiwan
Copyright © 2020 Zhang, Li, Xue and Liu. This is an open-access article distributed under the terms of the Creative Commons Attribution License (CC BY). The use, distribution or reproduction in other forums is permitted, provided the original author(s) and the copyright owner(s) are credited and that the original publication in this journal is cited, in accordance with accepted academic practice. No use, distribution or reproduction is permitted which does not comply with these terms.
*Correspondence: Jin-Xian Liu, jinxianliu@gmail.com