Coastal Impacts Driven by Sea-Level Rise in Cartagena de Indias
 Andrés F. Orejarena-Rondón1
  Juan M. Sayol2
  Marta Marcos3,4
  Luis Otero1
  Juan C. Restrepo1
  Ismael Hernández-Carrasco3
  Alejandro Orfila3*
- 1Departamento de Física y Geociencias, Universidad del Norte, Barranquilla, Colombia
- 2Department of Hydraulic Engineering, Delft University of Technology, Delft, Netherlands
- 3Instituto Mediterráneo de Estudios Avanzados, IMEDEA (CSIC-UIB), Esporles, Spain
- 4Department of Physics, University of the Balearic Islands, Palma, Spain
This work analyzes the coastal impacts of the combined effect of extreme waves and sea level extremes, including surges and projected mean sea level rise in Bocagrande, Cartagena (Colombia). Extreme waves are assessed from a wave reanalysis that are propagated from deep waters to the beach considering the hydrodynamic processes and taking into account the interaction between waves and the coastal elevation within the study area. First, we consider present sea level, storm surges and waves affecting the area. Next, we analyze the effect of sea level rise according to a moderate (RCP4.5) climate change scenario for the 21st century (years 2025, 2050, 2075, and 2100). The most pessimistic scenario (year 2100) yields a percentage of flooded area of 97.2%, thus revealing the major threat that represents sea level rise for coastal areas in the Caribbean Sea.
Introduction
Low crested coasts and beaches are among the most vulnerable ecosystems on the Earth since the mean sea-level rise (SLR), land subsidence, and variations in the frequency and/or strength of marine extreme events have the potential to substantially affect their present morphology, uses, landscapes, and functions (Nicholls and Cazenave, 2010). The availability of these physical drivers at regional and even local spatial scales is crucial to quantify the most probable retreat of coastlines, which is essential to implement appropriate mitigation measures as well as for the development of adaptation plans (Hunt and Watkiss, 2011; Willis and Church, 2012; Lyu et al., 2014; Melet et al., 2018). This kind of information is being increasingly demanded by stakeholders and social actors in order to take the best possible decisions for present and future urban development (Hunt and Watkiss, 2011). Previous works have estimated the impact of SLR on coastal inundation at global scale (e.g., Nicholls et al., 2011; Hinkel et al., 2013; Passeri et al., 2015; Vitousek et al., 2017), and also at regional and local scales. Some examples are found in the United States (Limber et al., 2018), Portugal (Bon de Sousa et al., 2018), Spain (Enríquez et al., 2017, 2019) or in the Netherlands (Verschuur, 2018) Previous results suggest that the retreat rates of coastlines could increase with respect to the present values, notably when the most pessimistic scenarios of greenhouse gases emissions are considered (e.g., Vermeer and Rahmstorf, 2009; Nicholls and Cazenave, 2010; Alexander et al., 2012).
The total water level on the coast is the result of the combined effect of mean sea-level (SL) (with the addition of seasonal and inter-annual effects), low-level atmospheric pressures (surges), surface wind fields, tidal dynamics, wave breaking (set-up and run-up) and the topo-bathymetric heights (Nicholls et al., 2014; Guimarães et al., 2015). Mean sea-level variations result from changes in different contributors such as glaciers, ice sheets mass loss, land water storage or the ocean thermal expansion (Gregory et al., 2013). Tide-gauge based observations corrected by vertical land motions and changes in the geoid show a trend in the global mean SLR of 1.1 ± 0.3 mm y−1 before 1990 for the 20th century, and of 3.1 ± 1.4 mm y−1 from 1993 to 2012 (Dangendorf et al., 2017). According to the last report from the Intergovernmental Panel on Climate Change (IPCC), the global mean sea-level will continue to rise during the 21st century and beyond (Church et al., 2013), but the total amount will depend on the greenhouse-gas concentrations, with a projected global mean SLR for the high-end scenario close to 2 m in the 2100 (Church et al., 2013; Le Bars et al., 2017). Moreover, projections at regional scales can differ substantially from those for the global mean SLR (Slangen et al., 2014), stressing the importance of performing studies that incorporate, where possible, the local SL contributions. The mean SLR increases the exposure of coastal zones to extreme marine events, causing the submersion of low-lying coasts, with obvious socioeconomic implications affecting human activities, coastal defense, development, growth and ecosystems (Nicholls and Cazenave, 2010; Jackson and Jevrejeva, 2016).
As it has been shown in the North Atlantic, the effects of extreme marine events on the coast also may increase due to changes in the storm wave climate (e.g., Masselink et al., 2016). Based on altimetric data from recent decades Young et al. (2011) found an increment of wind speed and, to a lesser degree, of wave height on a global scale, although, these changes are difficult to predict on a regional scale since storm tracks may shift in the near future (Bengtsson et al., 2006). On a local scale, these changes have been documented by other authors in the north and northeast Atlantic Ocean and in the northeast and northwest Pacific Ocean, where the increase of wave height is associated with the upsurge in the intensity of the storms (e.g., Ruggiero et al., 2010; Masselink et al., 2016; Castelle et al., 2018). Potential changes in wind-waves have also been evaluated taking into account the last IPCC projections (Hemer et al., 2013; Casas-Prat et al., 2018). Apart from wave heights, projections also indicate some variations in the mean wave peak period and in the mean wave direction, which could have an enormous effect on sandy coasts since the beach planform depends on the energy flux direction (Vousdoukas et al., 2018).
Some studies determined the wave run-up on beaches during normal and extreme conditions without considering the role of the SLR (e.g., Callaghan et al., 2009; Dietrich et al., 2011; Peláez-Zapata et al., 2012; Andrade et al., 2013; Fleming et al., 2013) and, only since recently, the combined effect of SLR and extreme events under greenhouse scenarios has been assessed (e.g., Masselink et al., 2016; Mentaschi et al., 2017; Melet et al., 2018; Sayol and Marcos, 2018).
Here, we evaluate to local scale the flood hazard in Bocagrande sand spit (Cartagena de Indias, Colombia) including all variables affecting the set-up and the run-up (i.e., the mean SL, tides, storm surges and waves) over the topography of the area. Taking into account all these variables is crucial to determine where and which mitigation actions have to be considered in front the impact of SLR. In order to account for future changes in the wave set-up, we will consider a moderate IPCC scenario corresponding to the Representative Concentration Pathway of 4.5 W/m2, hereinafter RCP 4.5 (Moss et al., 2010).
Area of Study
Cartagena de Indias is located in the northwestern South America within the Colombian Caribbean basin (Figure 1). It is a densely populated area and one of the most visited touristic destinations in the Caribbean region (Asociación Colombiana de Agencias de Viajes y Turismo [ANATO], 2018). Its beaches are mainly located in Bocagrande area (Figure 1, bottom-right panel). They conform a set of dissipative beaches controlled by groins spaced every 250 m approximately. These beaches, totally anthropized and without dunes are around 2.5 km length and between 30 and 70 m wide. The area is mainly exposed to offshore waves from the NE (Figure 2). The astronomical tide in the region is of mixed type primarily diurnal with a range of 0.40–0.60 m (Nicolae-Lerma et al., 2008; Restrepo et al., 2017) and the atmospheric-induced surges can exceed 0.2 m during strong storms (Andrade et al., 2013). The mean SL for the period 1908–2009 in the Caribbean Sea shows a rise of 5.3 mm y−1, about 4 times larger than the global mean SLR during the same period, whit around 5.6 mm y−1 in Cartagena for the period between 1950 and 2009 (Torres and Tsimplis, 2012). Moreover, local subsidence measured in the Cartagena region between 2000 and 2008 yielded a rate of 1.4 mm/year (Seemüller et al., 2009; Molares, 2011) thus contributing to exacerbate the mean SLR.
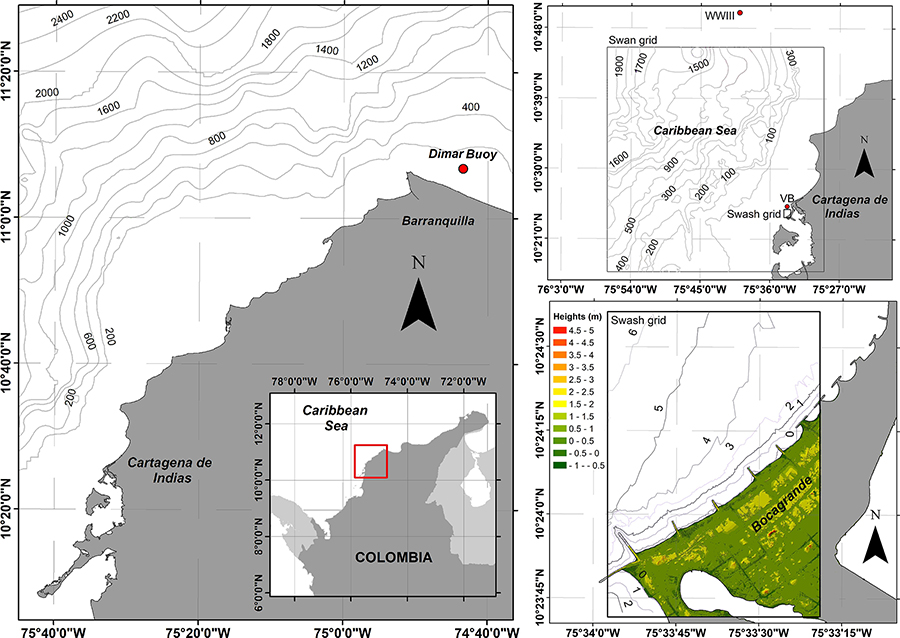
Figure 1. Study area representation. Indicates the location of the computational domain of SWAN and SWASH models in the right panel. The red dot in the left panel indicates the NOAA buoy used for the SWAN model validation. The bottom right panel shows the elevation of the dry area.
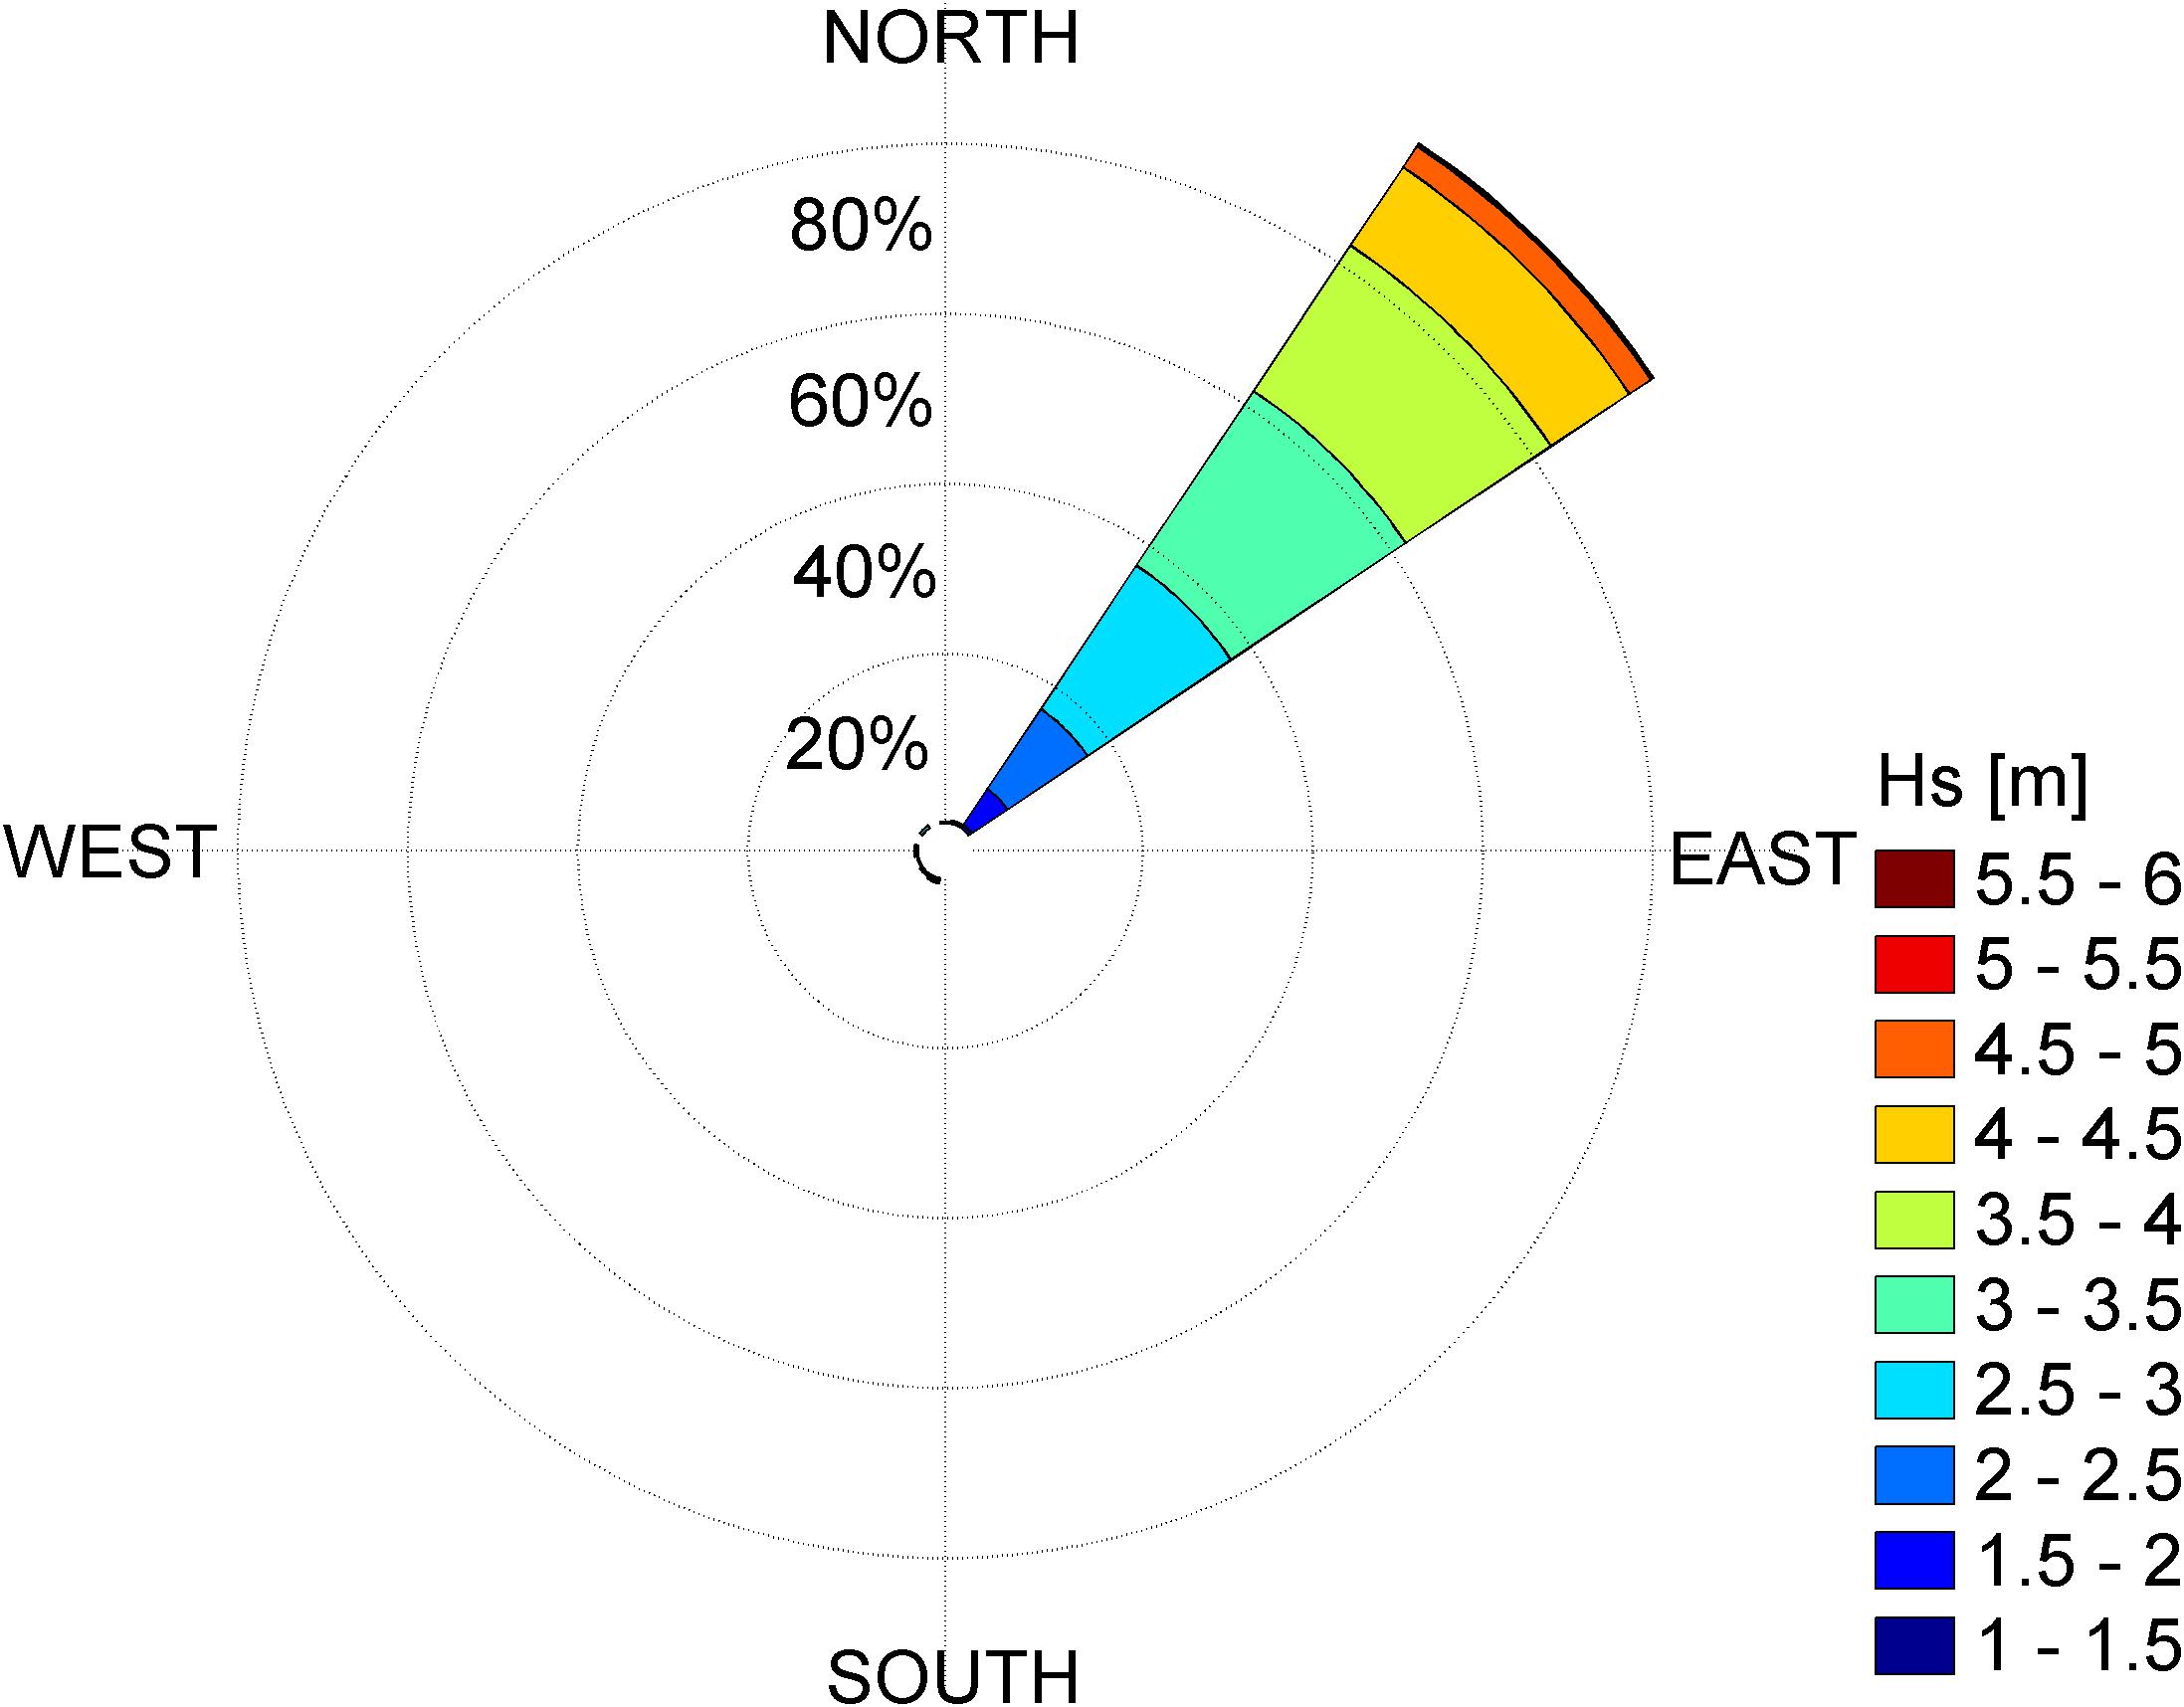
Figure 2. Wave rose from the NOAA wave hindcast (WaveWatch III). 38 years (1979-2016) of 3-hourly significant wave height (HS) and wave direction (Dp) from the closest grid point to Cartagena de Indias are used.
The regional climate is modulated by the location of the Intertropical Convergence Zone (ITCZ) as well as by the American Monsoon System, presenting two marked climatic seasons; the dry (or windy) season from December to April and the wet season from August to November (Poveda et al., 2002). During the dry season, the NE trade winds dominate the area due to the location of the ITCZ at the latitude 0–5°N. During the wet season the trade winds from the south reach the Colombian basin due to the migration of ITCZ toward latitude 10–12°N producing intense rain (Andrade, 1993). The rest of the year, from May to June (the transition season) is characterized by the weakening of the trade winds. Wave climate is modulated by these seasons presenting a bimodal distribution; during the dry season the significant wave height (Hs) present larger values and smaller in October (Osorio et al., 2009; Thomas et al., 2011; Andrade et al., 2013). Cold fronts during the dry season are considered the major cause of extreme waves in the central sector of the Caribbean littoral of Colombia (Otero et al., 2016), affecting periodically the Bocagrande area with energetic northwestern waves. From June to November, the passage of hurricanes near the Colombian Caribbean Sea can be accompanied also by the occurrence of extreme events (e.g., as those caused by hurricanes Joan in 1988 and Lenny in 1999), which have the potential to severely affect the continental Caribbean (Ortiz et al., 2015).
Data and Methods
The mean wave set-up in present day conditions is obtained from a tide-gauge located in Cartagena de Indias (current mean SL), while future conditions under the RCP 4.5 scenario are derived from a global model mean ensemble (Church et al., 2013). Other contributions to the wave set-up such as astronomical tides and sporadic extreme surges induced by storms are also computed from the above tide-gauge. We consider that waves propagate over the mean wave set-up, which is the result of adding to the mean sea level the astronomical tides and extreme surges obtained from a nearby tide-gauge located in Cartagena de Indias. Extreme deep water-wave conditions from WaveWatch III (WWIII) are propagated to the coast combing SWAN and SWASH (a non-linear shallow water solver) models to finally obtain the run-up.
Sea Level Observations and Projection
Hourly time series of sea level from tide-gauges located at Cartagena were obtained from http://gesla.org/ (Woodworth et al., 2017). Since tide-gauges records cover different periods (11/1951-4/1993 and 5/1993-12/2013), time series were homogenized, detrended and unified to have a unique long record. Astronomical tides were estimated with the UTide MATLAB software (Codiga, 2011). The analysis of the sea level data confirmed that the amplitude of astronomical tides in the region is around 0.2 m (microtidal). In order to reduce timing errors and non-linear effects we analyzed skew-surges over the sea level time series, which are defined as the difference between the maximum SL and the maximum predicted tidal level over one tidal cycle (Mawdsley et al., 2015). Projections of SLR according to the RCP 4.5 scenario for the Cartagena de Indias area were downloaded from the Integrated Climate Data Center (IDC) of the University of Hamburg1. This global database include different geophysical sources that drive long term changes in the relative sea surface height (SSH), such as, ice components, ocean-related components (derived from CMIP5 models), land water storage and glacial isostatic adjustment. From the above data a set of mean wave set-up is constructed by adding to the projected RCP 4.5 sea level scenarios for years 2025, 2050, 2075 and 2100, the spring astronomical tides and extreme storm surge for a return period of 10 years derived from the skew-surges time series (further details on this are provided in section “Selection of Extreme Events of Skew-Surges and Waves”).
Wave Data
Extreme wave climate was obtained by performing a statistical analysis of the NOAA hindcast over a period of 38 years2. This hindcast is based on the WWIII model forced by the Global Forecast System (GFS) analysis winds for the period of 1979–2016 with a 3-hourly temporal resolution. Here we use the closest model grid point to Bocagrande beaches, located around 15 km off the coast of Cartagena (see Figure 1, top-right panel).
Modeling Set-Up
Based on the statistical analysis of the NOAA hindcast referred above, two energetic sea states were selected in deep waters that were characterized by their Hs, Dp (peak direction) and Tp (peak period). These sea states were propagated using the SWAN model in stationary mode to obtain the corresponding wave conditions at shallow waters. These dispersive waves are transformed up to the beach using SWASH model in non-stationary mode. Present SL as well as those given by the moderate RCP4.5 scenario are analyzed in order to obtain the respective target inundations.
The SWAN model solves the equation of action balance for the propagation of the wave spectrum, allowing realistic estimations of wave parameters in oceanic and coastal zones (Booij et al., 1999). To assess the performance of SWAN in the area, the model is first validated in a non-stationary simulation using the Japanese 55-year wind Reanalysis, JRA-55 (Kobayashi et al., 2015). Sea states from a model grid point at the same position of the NOAA buoy # 41194 belonging to the Dirección General Maritima (DIMAR) were used for the validation of the simulated waves. This buoy is 126 km NW off Bocagrande at 11.161°N, 74.681°W (see location in Figure 1, left panel). Wave growth by wind was set as exponential following the formulation of Komen et al. (1984), and the deep water non-linear interaction by using the Webb-Resio-Tracy method. The relevant processes of interest: wave braking, energy dissipation by whitecapping and bottom friction were took into account for the simulation. The time step was set as 30 min and results stored every 3 h. The bias and root mean square error (RMSE) between the buoy and the SWAN model grid point time series are close to zero whereas the correlation coefficient is 0.84 showing a good fit between modeled and observed data. This relationship is statistically significant at a confidence level of 95% according to a two-tailed t-Student distribution (p-value <10–5) (Figure 3).
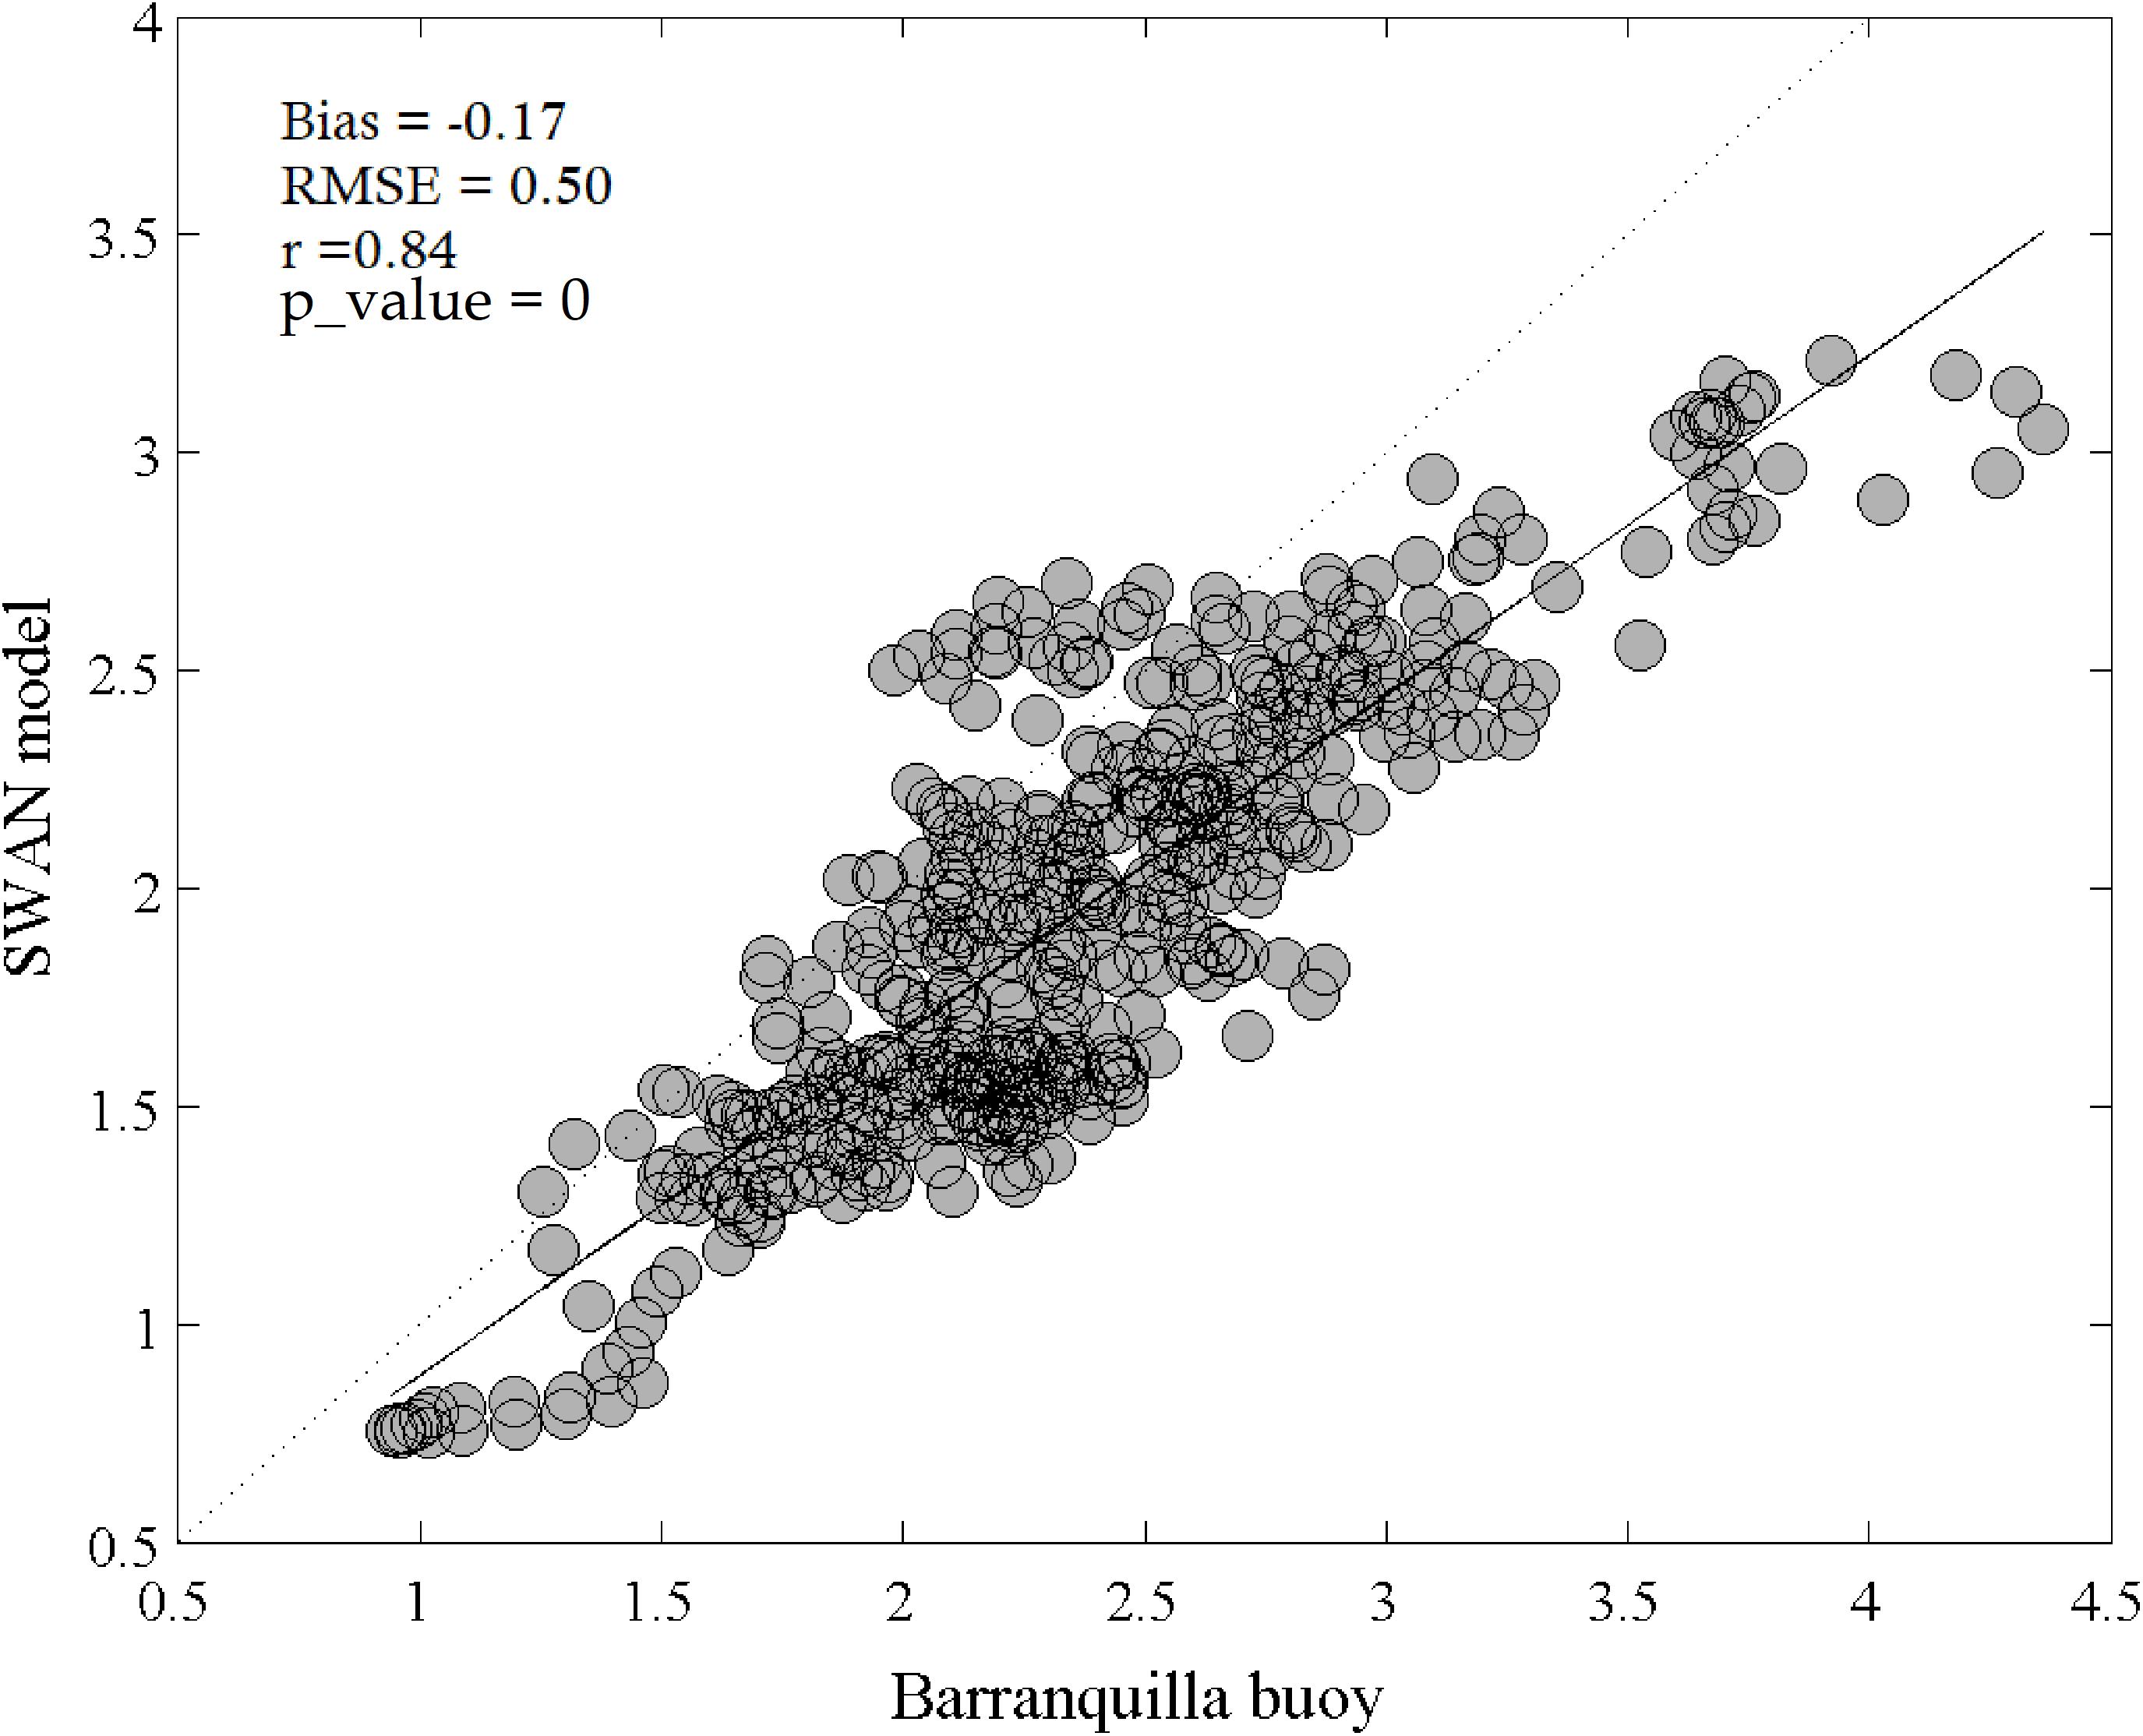
Figure 3. Dispersion diagram where the WWIII data propagated with SWAN model are correlated with the wave data of the buoy 41194 available in the National Data Buoy Center of the NOAA.
The SWAN domain had a resolution of 100 × 100 m2 (471 × 481 grid points) with bottom left UTM coordinates at 1136524.46N, 395970.14E (Figure 1 Swan grid in the right panel). Bathymetry was obtained from the nautical charts COL 042, COL 261, COL 263, COL 615 from the Colombian Hydrographic Institute, with scale ranges of between 1:15000 and 1:250000.
Regarding SWASH, the model solves the non-linear shallow water equations including the non-hydrostatic pressure being suitable for wave propagations up to beaches (Zijlema et al., 2011). SWASH was executed on a fine mesh with a spatial resolution of 3 × 3 m2 (341 × 551 grid points) and with bottom left UTM coordinates at 836992N, 1641707E. For this domain the bathymetry was obtained from using a single-beam ODOM Hydrotrac 2 echo-sounder merged with a high-resolution LIDAR topography for the emerged part of the domain (Figure 1 Swash grid in the bottom-right panel). All vertical heights in the Digital Terrain Model (DTM) were referenced to the mean low water spring (MLWS) and the horizontal coordinates were referenced to UTM 18N. According to Smit et al. (2014), to accurately resolve waves in a phase-resolving model the mesh resolution has to be at least 10 times smaller than the shortest wavelength to be resolved i.e., L/Δx = O(10) [similarly this applies to the time step i.e., T/Δt = O(10)], thus satisfying this criteria with the implemented resolution. The simulation length for each case was 30 min and the simulation time step Δt was set to 0.1 s. Results were stored every 5 s and the minimum and maximum Courant number were kept between 0.1 and 0.7. The Manning friction coefficient was set as 0.04 m−1/3s and the horizontal viscosity Prandtl mixing length hypothesis Lmix = 2 m (Conde-Frias et al., 2017).
Video Imagery
Video monitoring systems developed after the apparition of digital cameras, have shown to be a powerful and low-cost tool to monitor the coast in a wide range of studies, such as, coastal variability (Nieto et al., 2010; Simarro et al., 2015), intertidal bathymetry (Aarninkhof et al., 2003) or evolution of beach systems (Ojeda and Guillén, 2008). Since video systems have the advantage of providing continuous monitoring of coastal areas they are also a valuable tool to validate numerical models (Salmon et al., 2007; Andrade et al., 2013; Morales-Márquez et al., 2018; Osorio et al., 2019). In this work, we have used video images from the HORUS monitoring system3 at Bocagrande, to validate the run-up provided by SWASH model. The images passed through a scale rectification process and merged with digital orthophotography for visualization purposes.
Selection of Extreme Events of Skew-Surges and Waves
In this section we evaluate if the extremes of skew-surges and waves are significantly correlated. Our purpose is to estimate return level probabilities of both types of extremes. Based on this result we use the most suitable theoretical framework to estimate the magnitude of the skew-surge and waves that will be employed in section “Results” to model the coastal run-up.
Selection of Independent Events of Surges and Significant Wave Height (Hs)
To study the correlation between time series of skew-surges (section “Sea Level Observations and Projection”) and Hs (section “Wave Data”), we selected the maximum of skew-surges and Hs as follows; For each maximum value of skew-surge the associated maximum value of Hs within an interval of ± 6 h is selected, thus having a set of pairs of both variables. To be sure that the selected skew-surges corresponded to different events, they had to span at least 3 days between them (see Torres and Tsimplis, 2014 for further details). Since the location of the ITCZ has a large influence on the waves in the Caribbean Sea there are only two seasons to be analyzed; the dry season from December to April and from July to August and the wet season from April to May and from August to November. The common time range between skew-surges and waves extends from July 1979 to June 2001, accounting for a total of 21 years (see Figures 4A,B).
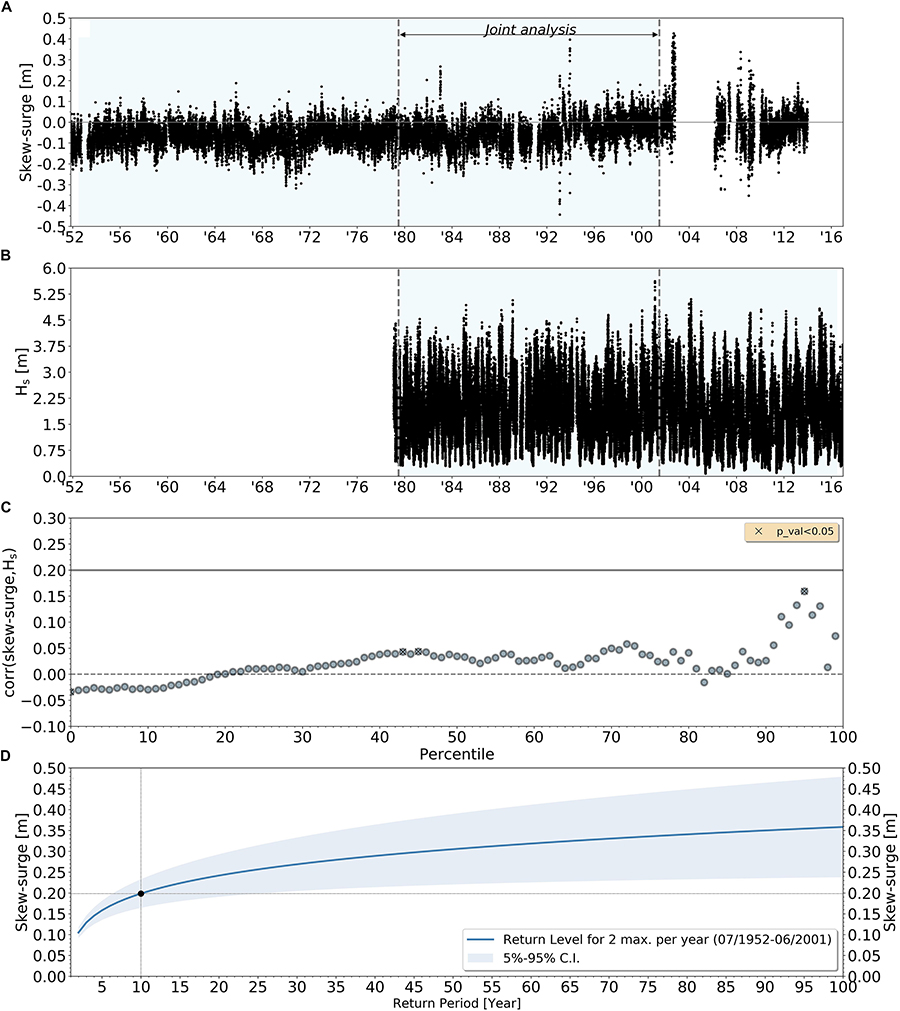
Figure 4. Timeseries of skew-surge derived from the Cartagena tide-gauges (A); timeseries of significant wave height (Hs) from the WWIII reanalysis at the closest grid point with respect to Cartagena (B); Kendal correlation between skew-surge and Hs (C) for the period indicated as joint analysis in the top panel (the black cross remarks significant correlation at 95%, see legend). The blue shading depicts the timeseries used to estimate the extreme events in the independent assessment; return level for skew-surge using 2 max. per year (D). The blue shading reflects the 5–95% range of uncertainty.
Correlation Between Skew-Surges and Hs
If a peak of skew-surge is correlated with a high wave, the probability of having a hazardous total water level will increase (the return period will decrease) respect to the case where both events are independent. In the former case, if the probability is computed independently, the actual risk would be underestimated. To avoid this, first we will assess the correlation between extremes of skew-surges and waves. Then, correlation is assessed with the Kendall rank correlation. Previous studies in the US coast and globally have suggested that an indicative value of 0.2 may be already significant enough (Wahl and Chambers, 2014) to require the computation of the joint probability using a multivariate approach such as the Copula functions (e.g., Sayol and Marcos, 2018; Enríquez et al., 2019; Marcos et al., 2019). Correlations for those independent events are shown in Figure 4C for all percentiles being in all cases very low with the maximum correlation of 0.175 corresponding to the 95-percentile. The cross over the circles indicate the correlations that are significant at the 95% level according to a series of permutation distributions (Gibbons and Chakraborti, 2011). In the light of these results, it is reasonable to assume that the extremes of skew-surges and Hs are uncorrelated and hence we compute their extremes independently.
Selection of Extreme Skew-Surges
The largest available time series for skew-surges (from July 1952 to June 2001) is used to compute the return levels using the block maxima approach. For each defined year (from July to June) we seek for the highest N independent events of skew-surges (they must be separated at least 3 days) collecting a set of N × M maxima, where M is the number of years. In order to estimate the return levels associated to a given probability, the extremes are fitted separately using the Generalized Extreme Value-GEV distribution (Tsimplis, 1995; Marcos et al., 2009). After checking the return levels for the range N = 1 to N = 5 we did not find a significant difference among them and thus we computed the return level with blocks of N = 2. As a reference we choose a return period of 10 years, which is at the same time extreme and statistically probable. The resulting return level for skew-surges found under this assumption is 0.2 m (Figure 4D).
Selection of Extreme Waves
Time series of deep-water Hs, Tp, and Dp (section “Wave Data”) are here used to characterize wave conditions (Figure 2). Based on this almost 93% of waves come from the NE, 2% from the NNE, 1.5% from ENE and the remaining from other directions (see Table 1). After considering the direction with the highest probability of occurrence and the joint probability analysis of Hs and Tp, two cases representing extreme events were chosen for the NE direction: the significant wave height that exceeded 12 h per year (Hs12, cases A1–A2 in Table 2) which corresponds to Hs = 4.5 m and Tp = 11 s; and (ii) the significant wave height with a 10% probability of exceedance (Hs90, cases A3-A4 in Table 2) corresponding to Hs = 3.0 m and a Tp = 12 s. As the passage of cold fronts is the cause of some of the highest waves in the central of the Colombian Caribbean Sea (Otero et al., 2016), we also study (although they have a lower probability of occurrence) the extreme waves from the NW direction. For this case, considering the joint probability analysis of Hs and Tp, corresponds to Hs = 3.0 m and Tp = 14 s (Hs12, cases B1–B2 in Table 2) and to Hs = 2.2 m and Tp = 10 s (Hs90, cases B3–B4 in Table 2).
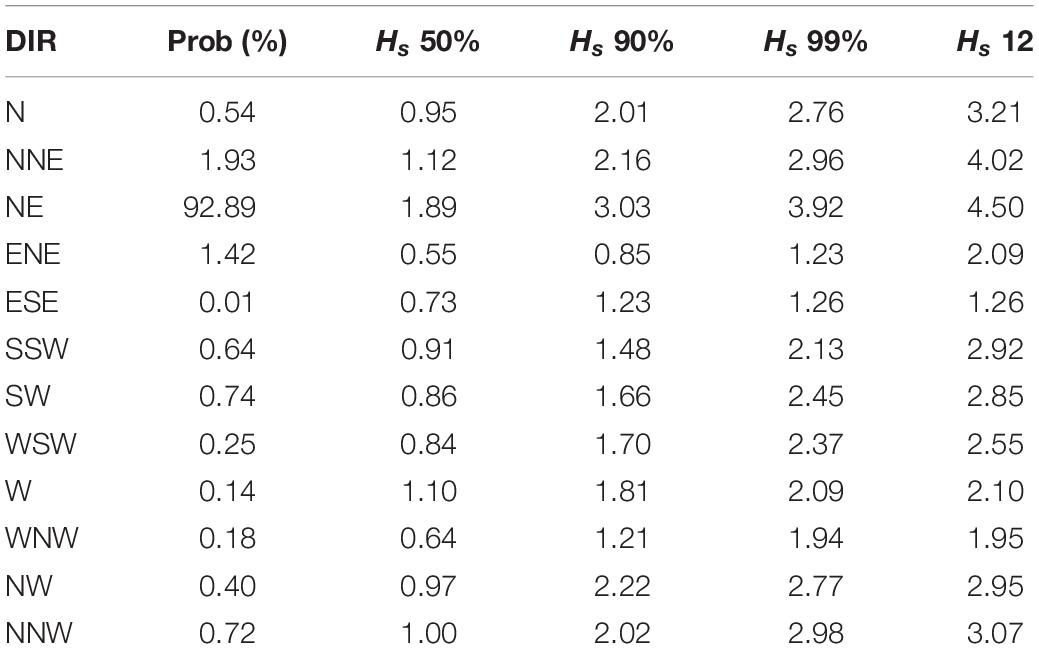
Table 1. Wave regime analysis in deep waters – basic statistical parameters.
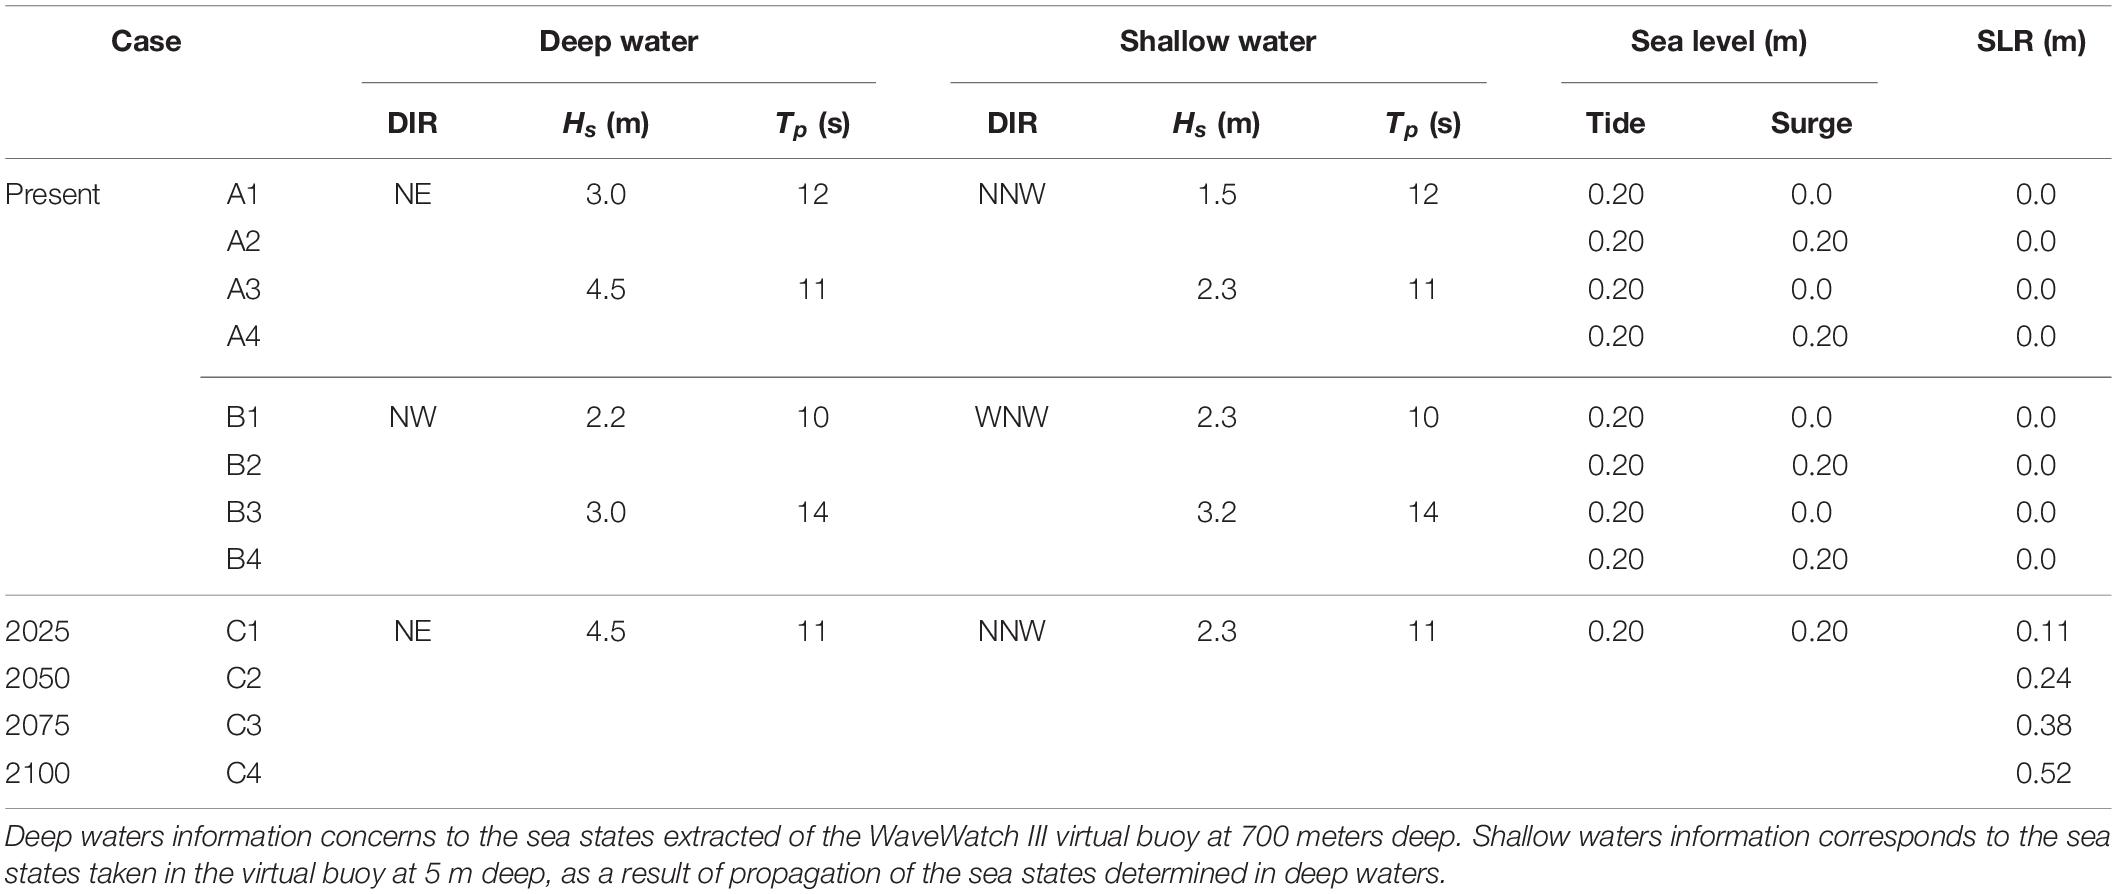
Table 2. Propagation cases for determining run up in Bocagrande beaches.
Results
Extreme waves at deep waters have been propagated toward the coast following the workflow outlined in Figure 5. Two type of extreme wave conditions have been identified to be the most probable in terms of Hs12 and Hs90 corresponding to incoming waves from the NE and those resulting from the passage of cold fronts (NW). The remainder of this section describes the validation process followed for the models used to simulate waves in deep and coastal ocean areas. Moreover, coastal flood maps for Bocagrande and surrounding beaches under present-day conditions and for the RCP4.5 sea level projection for the set of time horizons are presented and discussed.
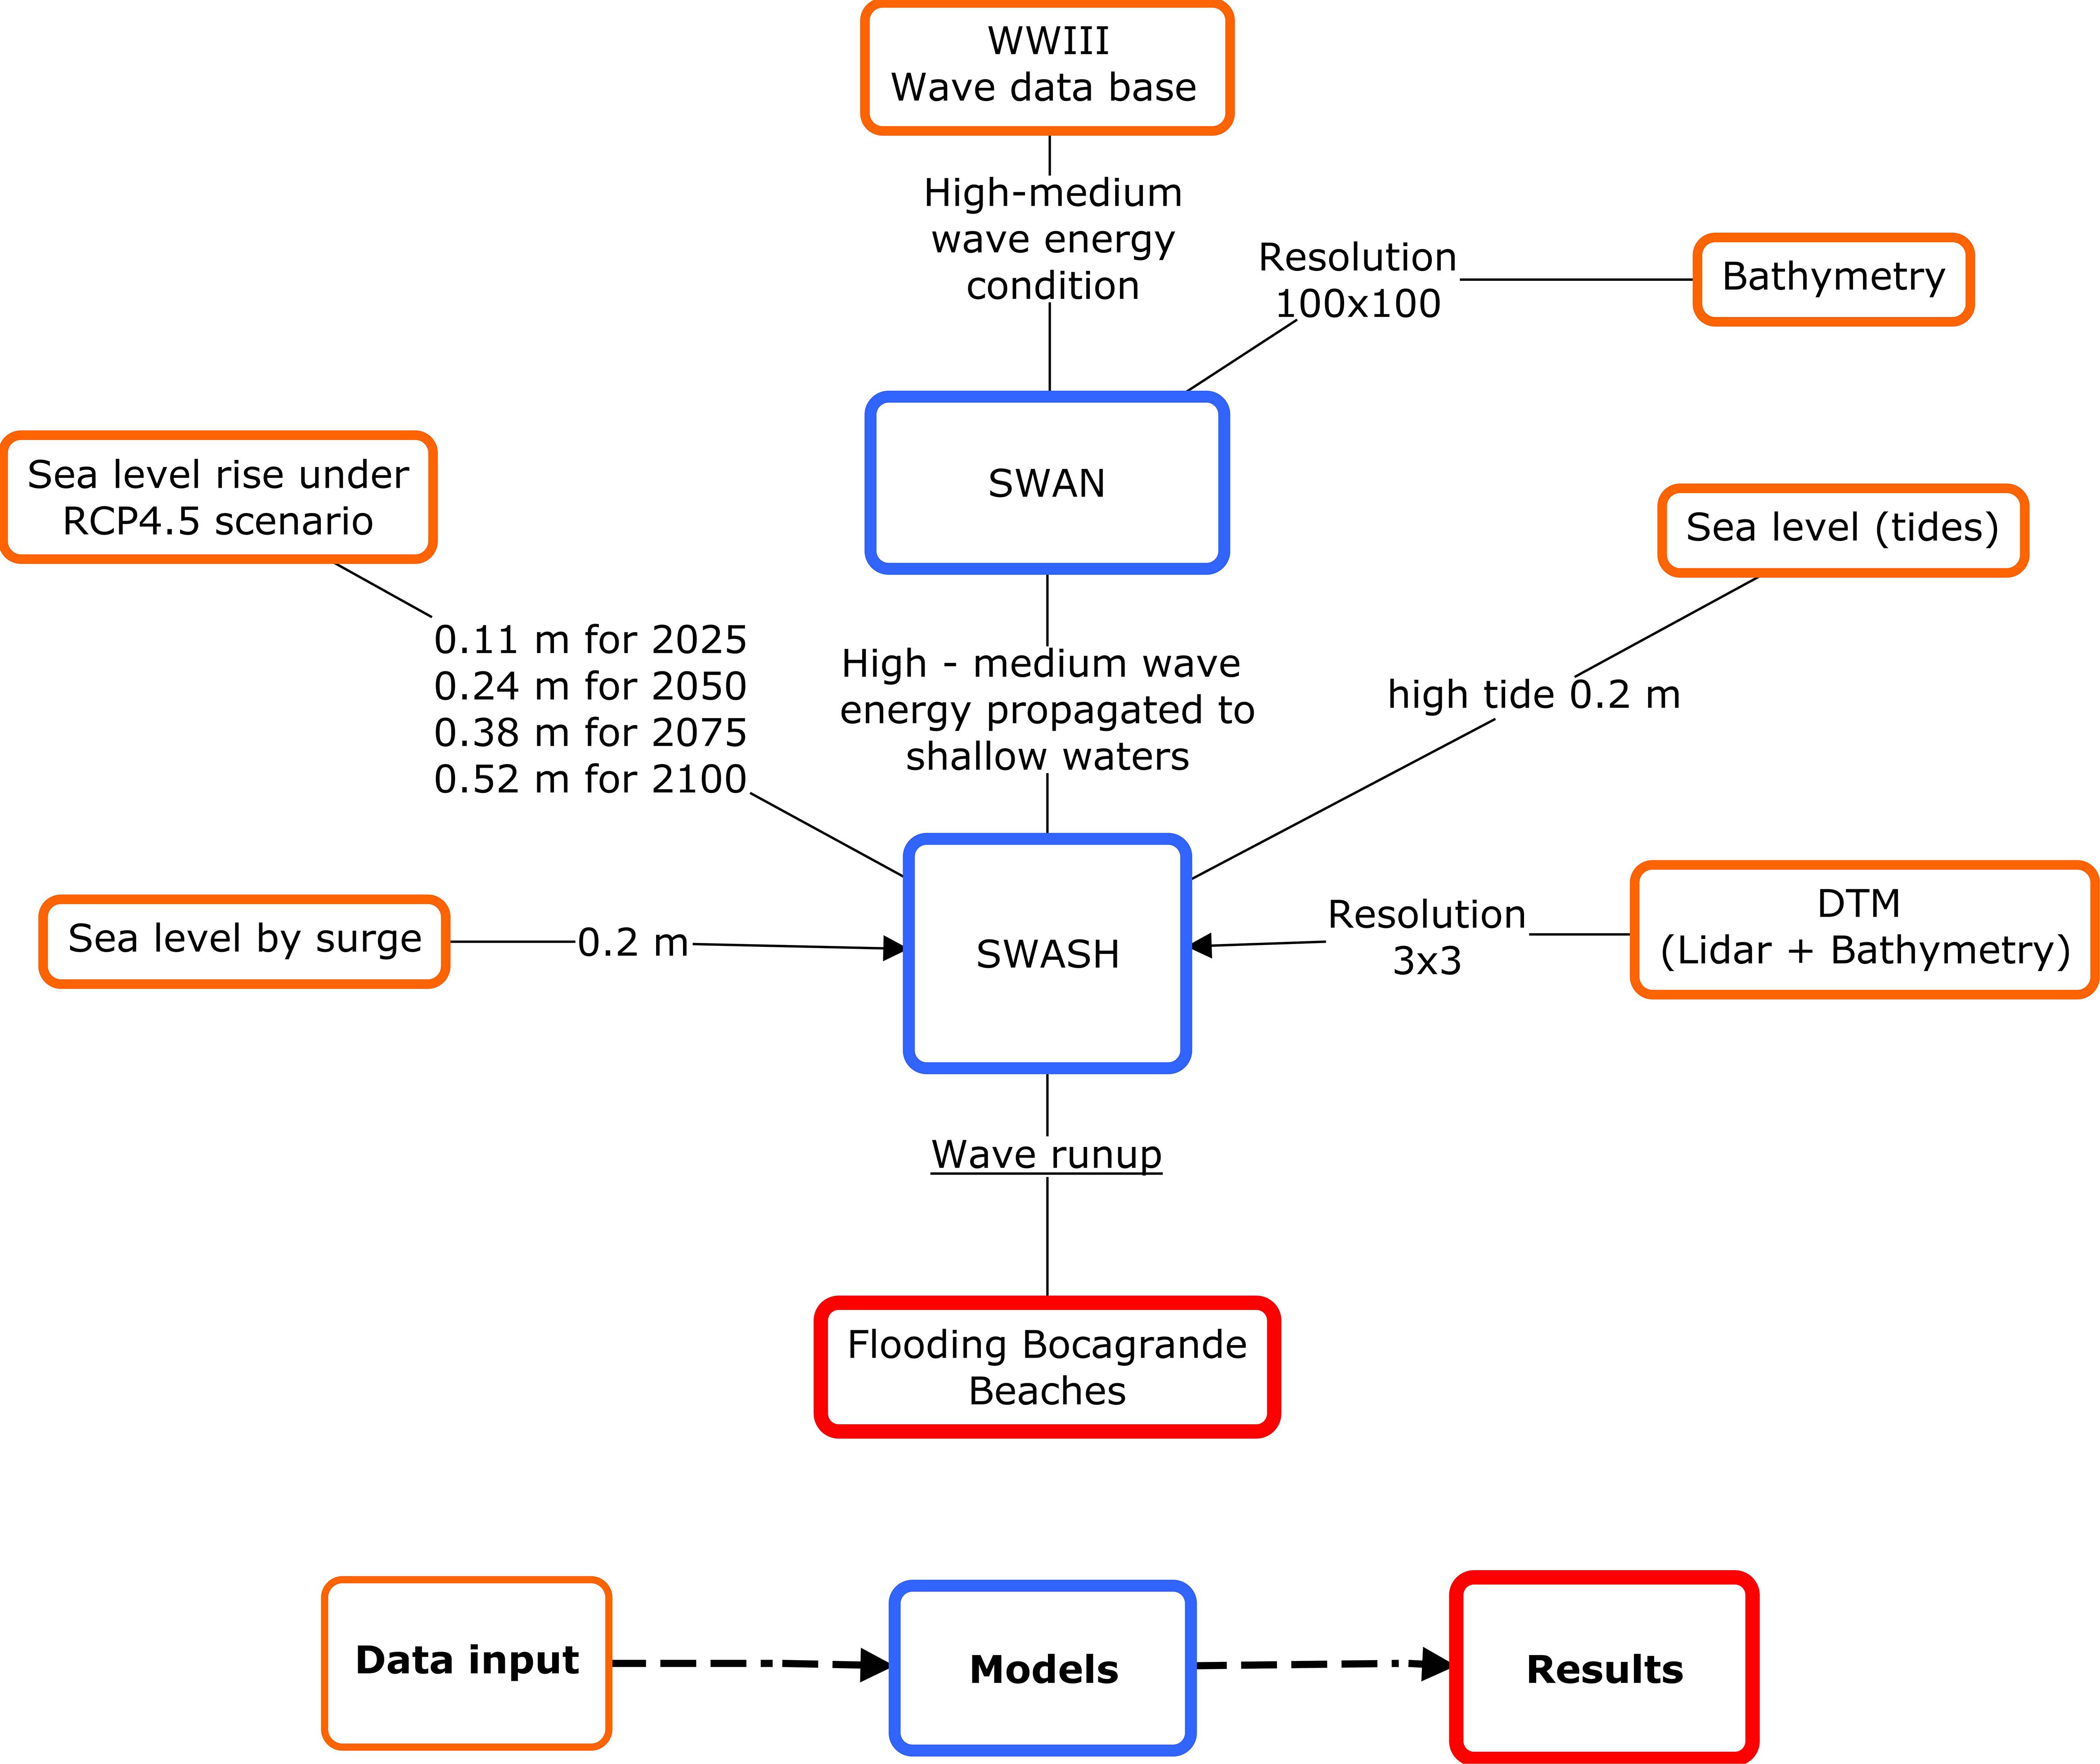
Figure 5. Schematic representation of the approach followed in the study.
Model Validation
Run-up validation was performed using the images obtained with HORUS video monitoring. As an example, Figure 6 shows the HORUS image corresponding to November 8th of 2010, coinciding with the passage of a cold front in the Colombian Caribbean. Wave conditions for this event were Hs = 2.3 m and Tp = 9 s from the NE direction. All comparisons were done using ArcGis 10.1, in which the maximum run-up from both data sets were plotted on the coast. Figure 6A shows the maximum run-up manually detected over the georeferenced image (red line) while Figure 6B shows the maximum run-up given by the numerical model (blue line). Along the m-n transect, the longitudinal distance from the coastline to the maximum run-up obtained by the numerical model and the HORUS image was 61 and 72 m, respectively (Figure 6C). The difference in the elevation between the simulation and the image run-up was 0.3 m, with a higher run-up measured at the image. In other areas of the transect, the differences were lower, in both the horizontal (<3 m) as in the vertical (<0.2 m) (Figure 6C). As seen in Figure 6C, the run-up from the modeling and from the observations are in very good agreement and thus we used the model approach as a proxy for the projections.
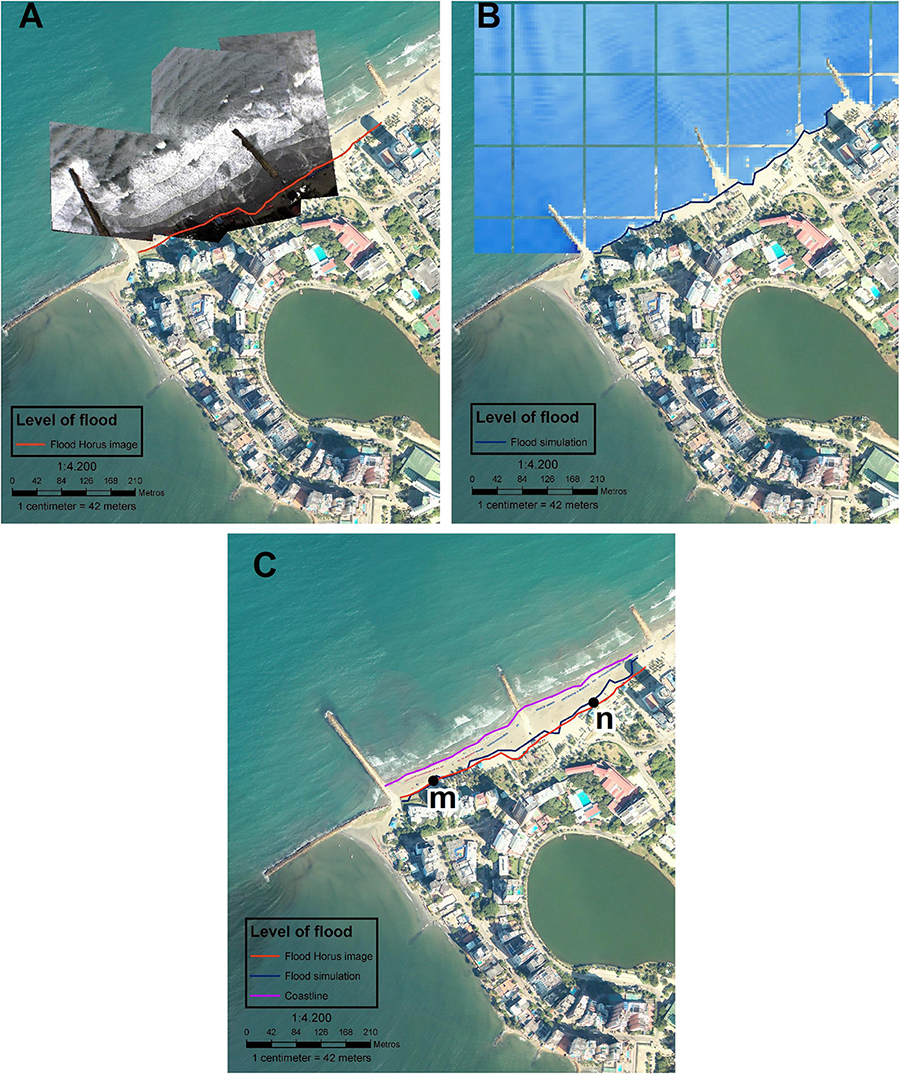
Figure 6. Run-up in Bocagrande beach during the passage of a cold front in November 8th, 2010: (A) As recorded by HORUS camera system (red line), (B) simulated with SWASH (blue line), and (C) comparison between simulated and recorded run up. The magenta line represents the coastline.
Modeled Coastal Inundation
Based on the analysis of the deep water wave conditions and taking into account the statistical independence of the wave climate and storm surges, we have analyzed 12 cases for the deep water mean direction (NE) as well as for the front cold passages (NW) (Table 2). Eight cases correspond to present-day conditions (SLR = 0, A1 to B4) and four additional cases under the projected SLR for years 2025, 2050, 2075, 2100 under the RCP 4.5 (C1–C4, Table 2). The flooded areas obtained for all case studies are presented and discussed below.
Flooding Under Present-Day Conditions
Present day conditions correspond to the combination of the deep water wave analysis outlined in section “Selection of Extreme Waves” with the inclusion (or not) the extreme skew-surge (section “Selection of Extreme Skew-Surges”) (Table 2). Note that for all cases-studies astronomical spring tides of 0.2 m are assumed. The corresponding flooded areas for deep water waves from the NE (A1–A4) and from the NW (B1–B4) are shown in Figures 7, 8 and are summarized in Table 3 (A1–A4 and B1–B4, respectively). The most severe flooding for the present state is given for those cases that account for the combined effect of waves and skew-surges, regardless of the wave direction. This is shown in Figures 7A2,A4, 8B2,B4). Hs90 for case A2, which corresponds to NE waves (case A2 in Table 2) correspond to wave conditions of Hs = 1.5 m and Tp = 12 s over a skew-surge of 0.2 m yields a flooded area of approximately 0.062 km2 (A2, Table 3), whilst the Hs12 conditions for NE waves (case A3 in Table 2) correspond to wave conditions of Hs = 2.3 m and Tp = 11 s without skew-surge and results in a flooded area of 0.048 km2. The worst scenario for the NE waves in terms of flooded area is given under the case A4 (the most extreme waves and skew-surge) resulting in a flooded area of 0.087 km2. In summary, the flooded area for the A1, A2, A3, and A4 cases comprise 9.8, 20.4, 15.7, and 28.4% of the surveyed area, respectively (Figure 7 and Table 3).
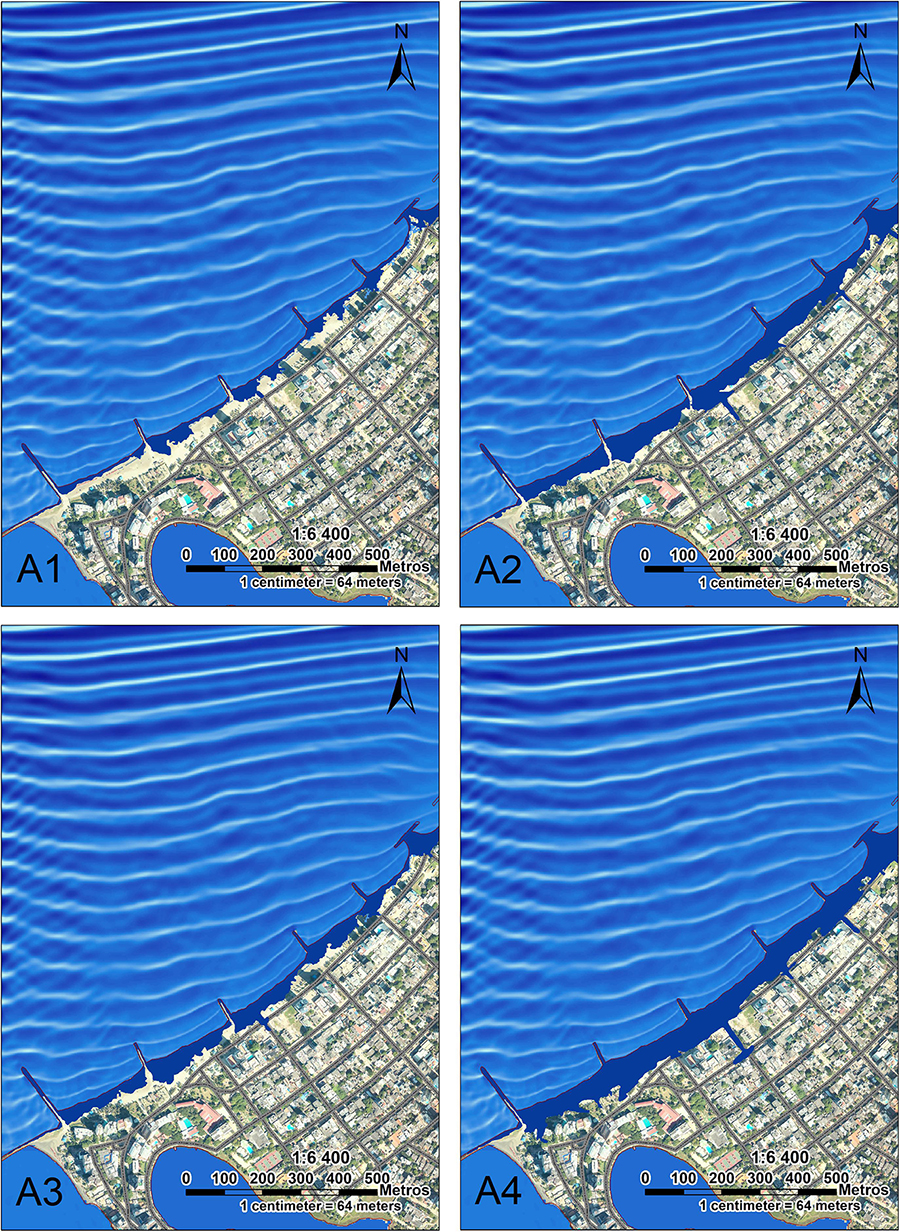
Figure 7. Flooded area generated by cases under present-day conditions and NE coming waves (A1–A4, Table 3).
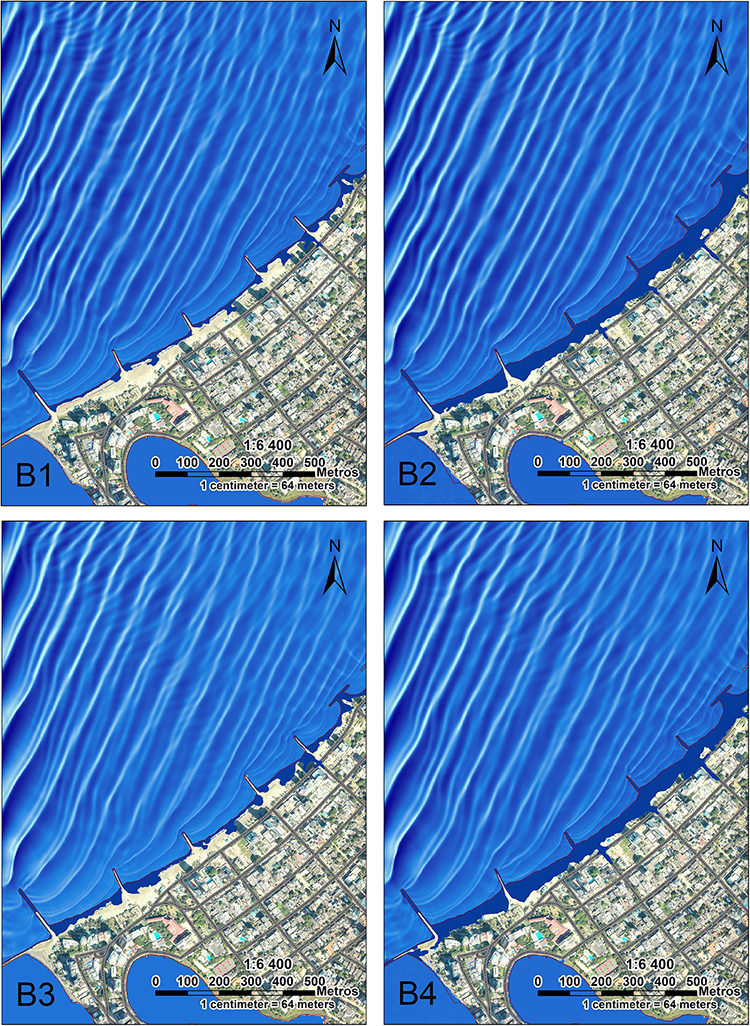
Figure 8. Flooded area generated by cases under present-day conditions and NW coming waves (B1–B4, Table 3).
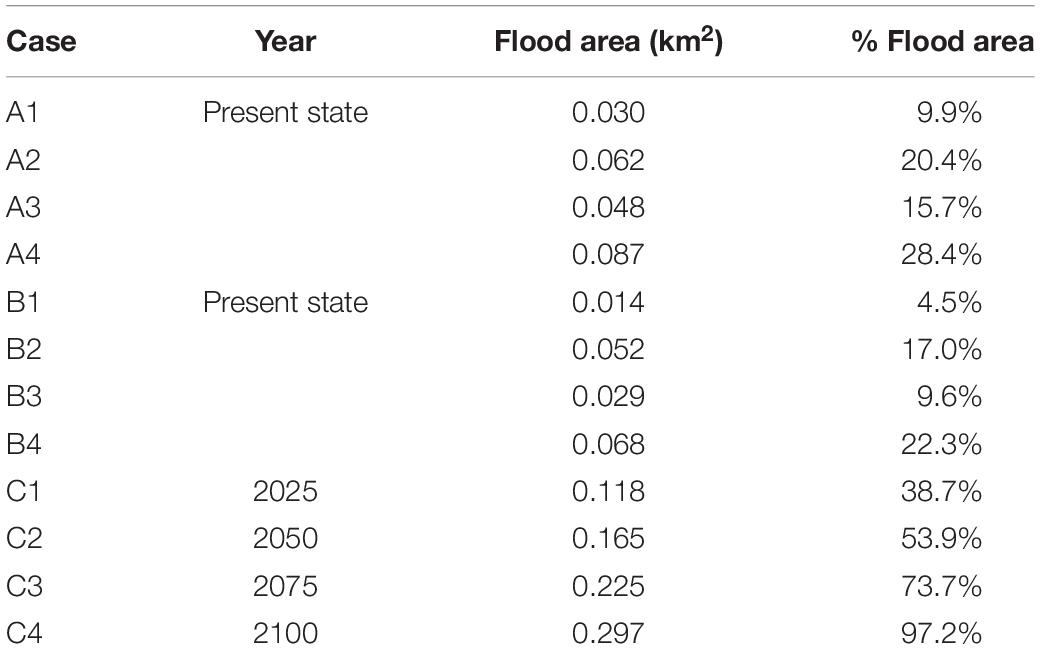
Table 3. Flooded area generated by run up cases – from NE (A1–A4) in present state, for cold fronts from NW (B1–B4) and for worst case for NE with RCP4.5 scenarios.
For the NW direction (cold front passage), which corresponds to cases B1–B4 in Table 2, the flooded area is smaller compared with NE cases despite that the significant wave height in shallow waters is larger (Figure 8). The H90 wave conditions (case B1) correspond to Hs = 2.3 m and Tp = 10 s with no skew-surge, results in a flooded area of approximately 0.014 km2. Same wave conditions over a sea level with an extreme skew-surge (case B2) yields a flooded area of approximately 0.052 km2. The H12 conditions correspond to Hs = 3.2 m and Tp = 10 s (cases B3 and B4 without and with skew-surge, respectively) yield flooded areas of approximately 0.030 and 0.068 km2, respectively. For all cases (B1–B4 in Table 3) the flooded area comprises the 4.5, 17.0, 9.6, and 22.3% of the total surveyed area, respectively (Figure 8).
Flooding Under Projected SLR
For the future global warming scenario, we assume the worst present flooding situation given by the case A4 that corresponds to the H12 from the NE direction (Table 3). Here we consider for all cases a skew-surge of 0.2 m, a high astronomical tide (0.2 m) and the regional SLR from RCP 4.5 for years 2025 (0.11 m), 2050 (0.24 m), 2075 (0.38 m) and 2100 (0.52 m) (Table 2). We note that the SLR scenario here considered is one of the most conservative. The corresponding flooded area is displayed in Table 3 comprising the 38.7, 53.9, 73.7, and 97.2% of the surveyed area, respectively (Figure 9). It indicates that for the short term simulation (C1, year 2025) the flooded area will increase around 10% with respect to the present-day situation. For the remainder years (2050, 2075, and 2100), flooded areas increase 25, 45, and 70% with respect to the present-day A4 case.
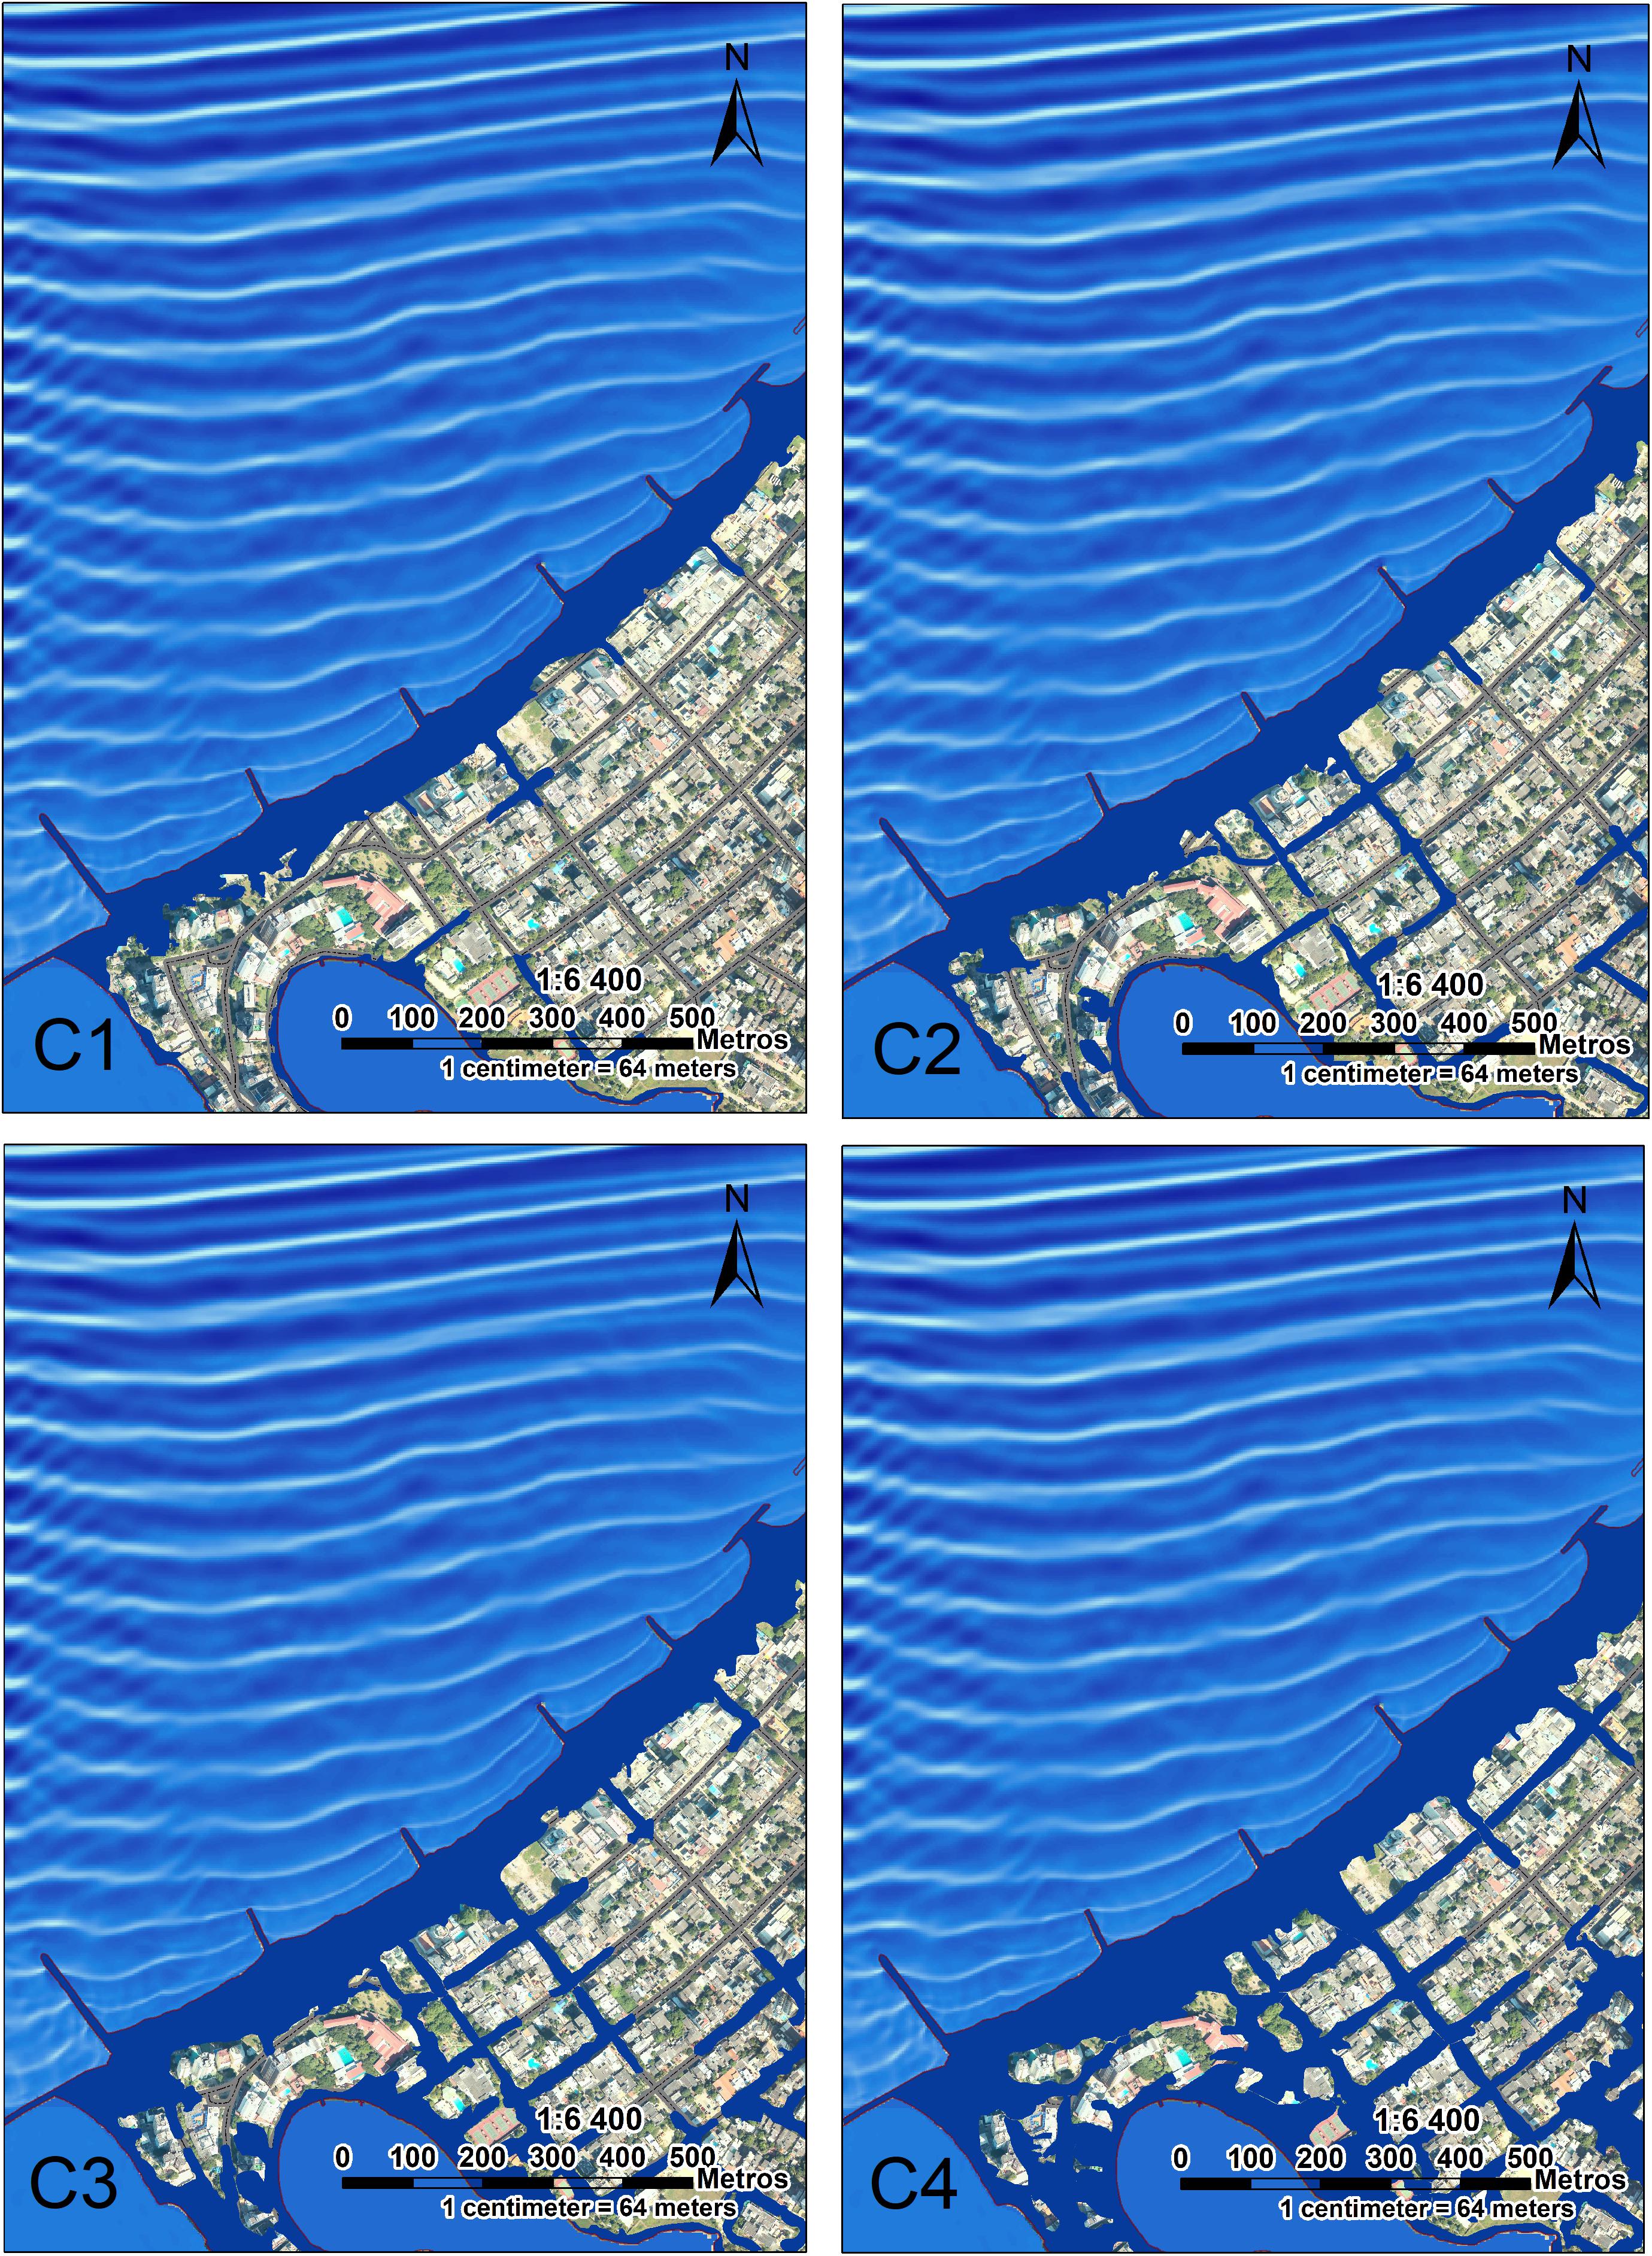
Figure 9. Flooded area after the most energetic wave event coming from the NE, considering the projected SLR under the RCP 4.5 W/m2 pathway for years (C1) 2025, (C2) 2050, (C3) 2075, and (C4) 2100. Also see C1–C4 cases in Table 3.
Discussion and Conclusion
In this work we study the coastal impacts of the combined effect of extreme waves and sea level extremes in Cartagena (Colombia). A summary of the flooded area for the present day conditions and for the projected RCP4.5 scenario is presented in Figure 10. Sea level has been rising since 1870, mainly due to the global warming that melts of land ice and causing ocean expansion (Church and White, 2006). One of the immediate consequences of SLR is land submergence and a higher risk of coastal flooding (Nicholls and Cazenave, 2010). However, the degree of affectation of the coastal areas depends on the regional and local features (profile slope, topographic heights, sediment type, wave conditions, tide conditions, meteorological conditions, etc.). Therefore, to take the most appropriate mitigation and adaptation measures, it is necessary to perform local studies accounting for all physical variables to determine the impact of SLR over the coastal zones. Sayol and Marcos (2018), estimated the impact of local sea level rise, extreme surge and waves in the Ebro Delta (Spain) under the climate change scenarios RCP4.5 and RCP8.5. The results show that for the year 2050 under the RCP 4.5 and RCP 8.5 sea level rise will flood a 65% of the Delta in both cases. While for the year 2099 under the RCP 4.5 and RCP 8.5 SLR projections the values of the flooded area will be 85 and 90%, respectively. Wang et al. (2018) assessed the effects of sea level rise, land subsidence, bathymetric changes and typhoon tracks on storm flooding in the coastal areas of Shanghai. Their results show that for the year 2025, the combined effect of these variables will flood 1053 Km2 in the study area. While to year 2050 the combined effect of these variables would increase the flood area to 4026 km2. Enríquez et al. (2017) assessed the changes in the shoreline due to sea level rise and waves in two micro-tidal beaches in Majorca island (Calla Millor and Playa de Palma). Their results show that beaches would suffer a coastal retreat between 7 and 49 m under RCP4.5 and RCP 8.5 sea level rise projections, respectively, which is equivalent to half of the present-day aerial beach surface. This last study, present lesser affectation over above mentioned studies because de beach profile has a steeper slope.
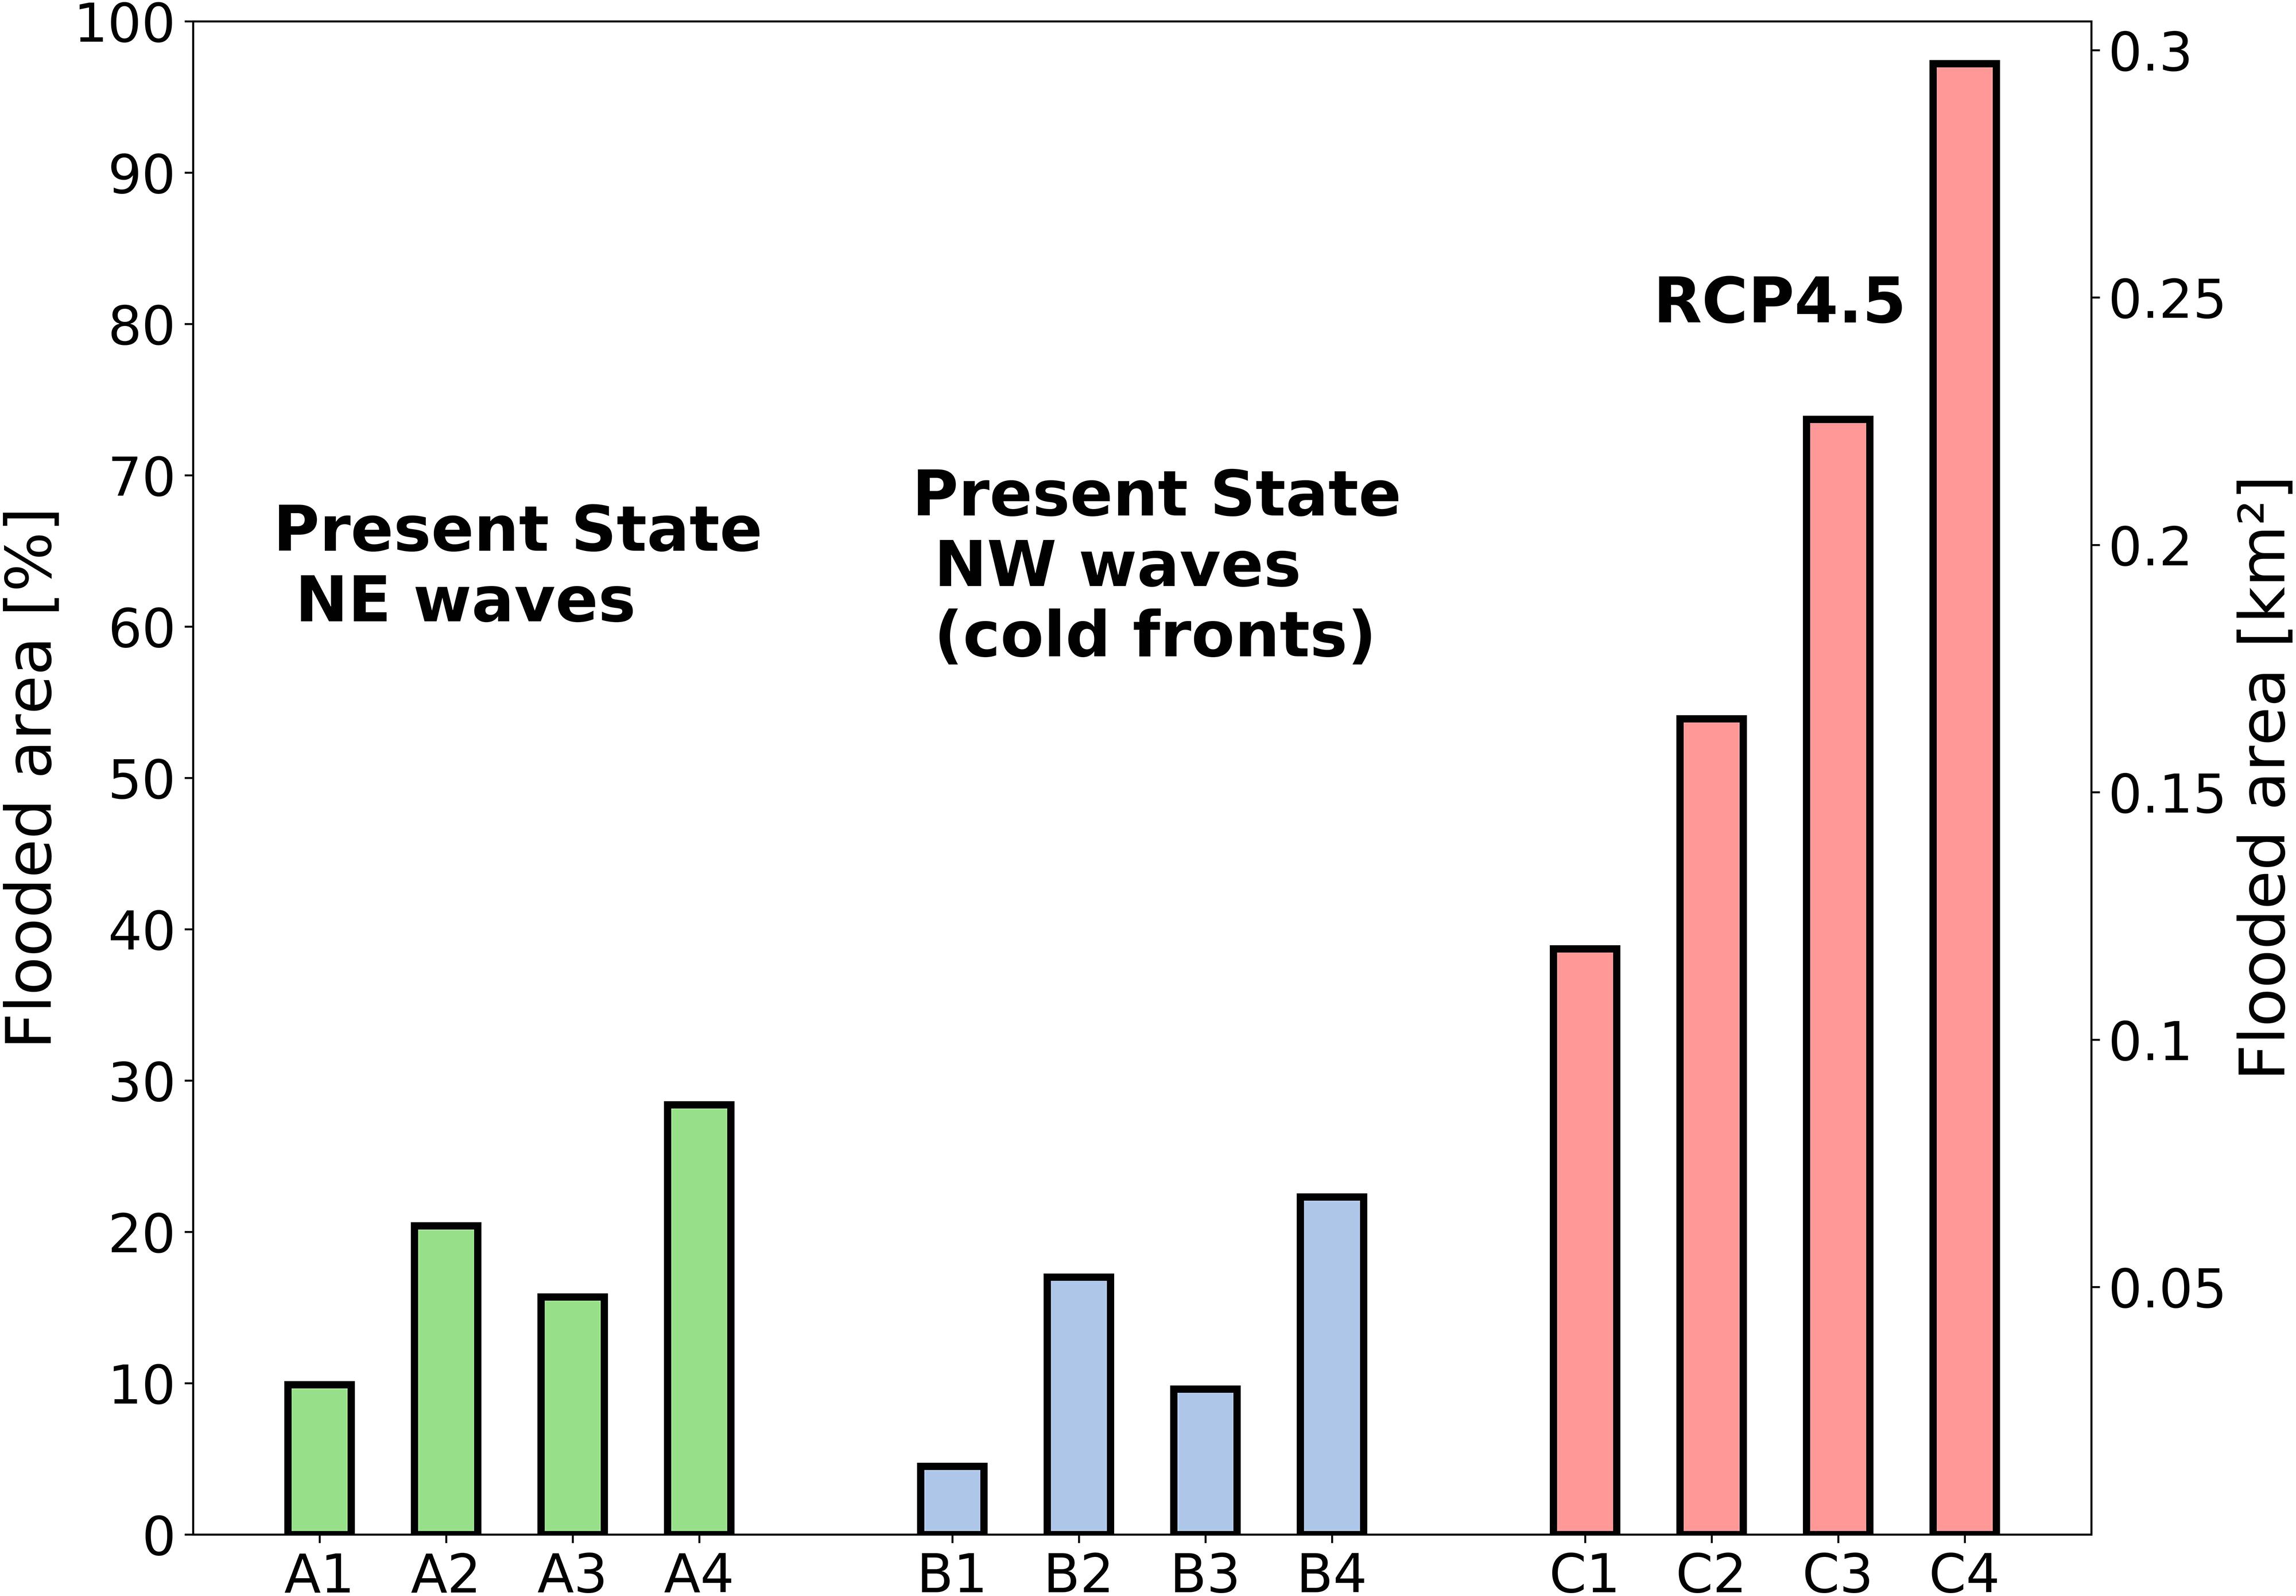
Figure 10. Summary of flooded area results (left y-axis in percentage; right y-axis in total surface in km2) for NE and NW coming waves under present-day conditions (A1–A4,B1–B4, respectively), and under SLR considering the projected sea level under the RCP 4.5 W/m2 pathway (C1–C4). See wave set-up and properties used in the simulations in Table 2.
Flooding in Bocagrande beaches is also related with their low topographic elevation as well as with the discontinuous elevations of the berm with values below the actual sea level in some areas. This fact, together with the coupled to the specific response of the Caribbean Sea under the future scenarios (fast thermos-steric response) makes it a highly risky spot for the SLR. Moreover, the poor correlation between extremes of skew-surges and waves supports the major relevance of swell waves in the generation of flooding in this part of the Caribbean region. Therefore, in order to assess the effect of the projected mean SLR under the RCP 4.5 scenario combined with the tides, high energy waves, surges and topo-bathymetric heights at the Bocagrande beaches we use the coupled models SWAN-SWASH.
Since non-stationary numerical simulations are computationally extremely demanding, we have evaluated the risk of flooding for a set of specific events. In this regard, after a statistical assessment of historical extreme skew-surge and wave conditions, the most representative case-studies have been selected. Besides we have considered the potential effects of SLR in Bocagrande beaches for the most hazardous present-day considered scenario (A4), in an attempt to optimize the computational time. Despite this limitation and in contrast to other methodologies previously used to assessed coastal inundation in Cartagena beaches and its surrounding areas (Nicolae-Lerma et al., 2008; Andrade et al., 2013; Nicolae-Lerma et al., 2013) the coupling of SWAN-SWASH models has allowed us to determine the extreme wave run-up over the Bocagrande beaches in two dimensions, with a good agreement when tested against measured wave data and video images. With this methodology we have taken into account the mean SL, high astronomical tides, and extreme skew-surges and waves, as well as the projected mean SLR under the RCP 4.5 scenario and the actual structural elements (groins, breakwaters, dams, etc.) that interact with the wave field. Therefore, this approach can be used to search for specific solutions (either soft and/or hard engineering approaches) to mitigate the effects of the SLR in the studied area. Indeed, a good representation of waves (Hs and direction) is mandatory to adequately study coastal flooding. These processes can only be taken into account with the use of numerical models. From the above results, although the shallow water significant wave height is larger for the cold-front configuration (NW direction at deep waters, B1–B4 in Table 2), the inundation resulting from the NE extreme waves is higher due to waves refraction and location of the coast line. Because the coastline of the study area is parallel to waves from NNW direction (see Figure 1, bottom-right panel), NE waves have a direct impact on the beaches. On the other hand, incoming waves from the NW direction (WNW direction in shallow waters), had impact directly over the groins, thus not affecting beaches.
The combined effect of astronomical tides and extreme skew-surge contribute to coastal inundation only between 25 and 45% of the projected SLR under RCP 4.5 (for year 2025 and 2100, respectively). Therefore, SLR appears to be the most dominant factor in this study area. We note that in this work it has been analyzed a conservative climate change scenario, hence even a higher importance of SLR can be expected for more pessimistic projections. This result is inferred from Figure 9 (cases C1–C4), where the inundated area increases dramatically as we move closer to the end of the 21st century. The main reason is the low topographic elevation, which in some cases are directly below the mean sea level.
Finally, we want to remark that among the factors that may influence the flooding in Bocagrande beaches, we have not considered the geodynamic processes, the changes in the beach profile as the sea level rises, the change in beach planform in response to a potential variation in the mean wave energy flux and eventual changes in the wave dynamics related to variations in the atmospheric patterns as a consequence of climate change. These limitations imply that; (i) for the year 2100 the total flooded area could be higher than the one provided in this study. According to the analysis of Andrade-Amaya et al. (2017) from a geodetic station located in Cartagena de Indias, this zone present subsidence processes with values between −1.78 ± 0.4 and −1.88 ± 0.44 mm/year. (ii) The response of the beach profile to sea level rise and wave dynamics also could have an influence on the value of the flooded area provided for each of the scenarios if there were a constant sediment flux and if the beach front would not be totally urbanized. Considering the latter, to limit the number of variables used in this work, we have assumed that the beach profile remains inalterable under the proposed scenarios which, as a first approach, is a reasonably assumption since changes in beach profile are below 20 cm under the worst SLR scenarios (Enríquez et al., 2017). (iii) Flood processes generated by the run – up under wave energetic conditions over Bocagrande beaches could result in an underestimation of the percentage of flooded area obtained in this study, especially for the year 2100 SLR scenario. According to Mentaschi et al. (2017) and Casas-Prat et al. (2018) wave energy conditions will probably change globally in response to a shift in the wind regimes because of the undergoing global warming.
Data Availability Statement
The datasets generated for this study are available on request to the corresponding author.
Author Contributions
This work was part of AO-R’s Ph.D. thesis. AO-R wrote the manuscript and performed the simulations. AO and JR were the supervisors and contributed to conceiving the topic and the development of the argument, interpretation of the results, and writing. JS, MM, LO, and IH-C contributed to the interpretation of the results and writing.
Funding
This work was supported by COLCIENCIAS (Departamento Administrativo de Ciencia, Tecnología e Innovación) through of convocatoria 727 and from the Spanish Government MICINN/FEDER through projects MUSA (CTM2015-66225-C2-2-P) and MOCCA (RTI2018-093941-B-C31). The authors acknowledge the financial support from the Spanish Government MICINN/FEDER through projects MUSA (CTM2015-66225-C2-2-P) and MOCCA (RTI2018-093941-B-C31). AO-R is supported by a grant from Colombian COLCIENCIAS (Convocatoria 727). JS thanks the financial support by the Netherlands Scientific Research Foundation (NWO) through the VIDI grant number 864.13.011 awarded to C. A. Katsman. IH-C acknowledges the Vicenç Mut contract funded by the Government of the Balearic Island. This work was partially performed while AO was a visiting scientist at the Earth, Environmental and Planetary Sciences Department at Brown University through a Ministerio de Ciencia, Innovación y Universidades fellowship (PRX18/00218).
Conflict of Interest
The authors declare that the research was conducted in the absence of any commercial or financial relationships that could be construed as a potential conflict of interest.
Footnotes
- ^ http://icdc.cen.uni-hamburg.de/1/daten/ocean/ar5-slr.html
- ^ ftp://polar.ncep.noaa.gov/pub/history/waves/multi_1/
- ^ http://www.horusvideo.com
References
Aarninkhof, S. G. J., Turner, I. L., Dronkers, T. D. T., Caljouw, M., and Nipiusc, L. (2003). A video-based technique for mapping intertidal beach bathymetry. Coast. Eng. 49, 275–289. doi: 10.1016/S0378-3839(03)00064-4
Alexander, K. S., Ryan, A., and Measham, T. G. (2012). Managed retreat of coastal communities: understanding responses to projected sea level rise. J. Environ. Plan. Man. 55, 409–433. doi: 10.1080/09640568.2011.604193
Andrade, C. A. (1993). Análisis de la velocidad del viento en el mar Caribe. Bol. Cient. Cioh. 13, 33–43. doi: 10.26640/01200542.13.33_43
Andrade, C. A., Thomas, Y. F., Lerma, A. N., Durand, P., and Anselme, B. (2013). Coastal flooding hazard related to swell events in cartagena de indias. Colombia. J. Coastal Res. 29, 1126–1136. doi: 10.2112/JCOASTRES-D-12-00028.1
Andrade-Amaya, C. A., Ferrero-Ronquillo, A. J., León-Rincón, H., Mora-Páez, H., and Carvajal-Perico, H. (2017). Sobre cambios en la línea de costa entre 1735 y 2011y la subsidencia en la Bahía de Cartagena de Indias, Colombia. Rev. Acad. Colomb. Cienc. Ex. Fis. Nat. 41, 94–106. doi: 10.18257/raccefyn.360
Asociación Colombiana de Agencias de Viajes y Turismo [ANATO] (2018). Compendio de estadísticas turísticas de ANATO. https://www.anato.org/es/investigaciones?qt-investigaciones=1#qt-investigaciones (accessed September 24, 2019).
Bengtsson, L., Hodges, K. I., and Roeckner, E. (2006). Storm tracks and climate change. J. Clim. 19, 3518–3543. doi: 10.1175/JCLI3815.1
Bon de Sousa, L., Loureiro, C., and Ferreira, O. (2018). Morphological and economic impacts of rising sea levels on cliff-backed platform beaches in southern Portugal. Appl. Geogr. 99, 31–43. doi: 10.1016/j.apgeog.2018.07.023
Booij, N., Ris, R. C., and Holthuijsen, L. H. (1999). A third-generation wave model for coastal regions 1. Model description and validation. J. Geophys. Res. Oceans. 104, 7649–7666. doi: 10.1029/98JC02622
Callaghan, D. P., Roshanka, R., and Andrew, S. (2009). Quantifying the storm erosion hazard for coastal planning. Coast. Eng. 56, 90–93. doi: 10.1016/j.coastaleng.2008.10.003
Casas-Prat, M., Wanga, X. L., and Swartb, N. (2018). CMIP5-based global wave climate projections including the entire Arctic Ocean. Ocean Mod. 123, 66–85. doi: 10.1016/j.ocemod.2017.12.003
Castelle, B., Dodet, G., Masselink, G., and Scott, T. (2018). Increased winter-mean wave height, variability, and periodicity in the northeast Atlantic over 1949–2017. Geophys. Res. Lett. 45, 3586–3596. doi: 10.1002/2017GL076884
Church, J. A., Clark, P. U., Cazenave, A., Gregory, J. M., Jevrejeva, S., Levermann, A., et al. (2013). “Sea level change in: Climate change 2013: the physical science basis,” in Contribution of Working Group I to the fifth Assessment report of the Intergovernmental Panel on Climate Change, eds T. F. Stocker, D. Qin, G. K. Plattner, M. Tignor, S. K. Allen, and J. Boschung (Cambridge: Cambridge University Press).
Church, J. A., and White, N. J. (2006). A 20th century acceleration in global sea-level rise. Geophy. Res. Lett. 33:L01602. doi: 10.1029/2005GL024826
Codiga, D. L. (2011). Unified Tidal Analysis and Prediction Using the UTide Matlab Functions. Technical Report 2011-01. Narragansett, RI: University of Rhode Island, 5.
Conde-Frias, M., Otero, L., Restrepo, J. C., Ortiz, J. C., Ruiz, J., and Osorio, A. F. (2017). Swash oscillations in a microtidal dissipative beach. J. of Coast. Res. 33, 1408–1422. doi: 10.2112/JCOASTRES-D-16-00147.1
Dangendorf, S., Marcos, M., Wöppelmann, G., Conrad, C. P., Frederikse, T., and Riva, R. (2017). Reassessment of 20th century global mean sea level rise. Proc. Natl. Acad. Sci. U.S.A. 114, 5946–5951. doi: 10.1073/pnas.1616007114
Dietrich, J., Tanaka, S., Westerink, J., Dawson, C., Luettich, R. A. Jr., Zijlema, M., et al. (2011). Performance of the unstructured mesh, SWAN+ADCIRC model in computing hurricane waves and surge. J. Sci. Comput. 52, 468–497. doi: 10.1007/s10915-011-9555-6
Enríquez, A. R., Marcos, M., Álvarez-Ellacuría, A., Orfila, A., and Gomis, D. (2017). Changes in beach shoreline due to sea level rise and waves under climate change scenarios: application to the Balearic Islands (western Mediterranean). Nat. Hazards Earth Syst. Sci. 17, 1075–1089. doi: 10.5194/nhess-17-1075-2017
Enríquez, A. R., Marcos, M., Falqués, A., and Roelvink, D. (2019). Assessing beach and dune erosion and vulnerability under sea level rise: a case study in the mediterranean sea. Front. Mar. Sci. 6:4. doi: 10.3389/fmars.2019.00004
Fleming, R. J. V., Luettich, R., and Fleming, J. G. (2013). Comparative hydrodynamics during events along a barrier island: explanation for overwash. Estuar. Coasts. 36, 334–346. doi: 10.1007/s12237-012-9578-8
Gibbons, J. D., and Chakraborti, S. (2011). “Nonparametric Statistical Inference,” in International Encyclopedia of Statistical Science, ed. M. Lovric (Berlin: Springer).
Gregory, J. M., White, N. J., Church, J. A., Bierkens, M. F. P., Box, J. E., van der Broeke, M. R., et al. (2013). Twentieth-century global-mean sea level rise: is the whole greater than the sum of the parts? J. Clim. 26, 4476–4499. doi: 10.1175/JCLI-D-12-00319.1
Guimarães, P. V., Farina, L., Toldo, E. Jr., Diaz-Hernandez, G., and Akhmatskaya, E. (2015). Numerical simulation of extreme wave runup during storm events in tramandaí beach. Rio Grande do Sul Brazil. Coast. Eng. 95, 171–180. doi: 10.1016/j.coastaleng.2014.10.008
Hemer, M. A., Fan, Y., Mori, N., Semedo, A., and Wang, X. L. (2013). Projected changes in wave climate from a multi-model ensemble. Nat. Clim. Change. 3:471. doi: 10.1038/nclimate1791
Hinkel, J., Lincke, D., Vafeidis, A. T., Perrette, M., Nicholls, R. J., Tol, R. S. J., et al. (2013). Coastal flood damage and adaptation costs under 21st century sea-level rise. PNAS 111, 3292–3297. doi: 10.1073/pnas.1222469111
Hunt, A., and Watkiss, P. (2011). Climate change impacts and adaptation in cities: a review of the literature. Clim. Change. 104, 13–49. doi: 10.1007/s10584-010-9975-6
Jackson, L. P., and Jevrejeva, S. (2016). A probabilistic approach to 21st century regional sea-level projections using RCP and high-end scenarios. Glob. Planet. Change. 146, 179–189. doi: 10.1016/j.gloplacha.2016.10.006
Kobayashi, S., Ota, Y., Harada, Y., Ebita, A., Moriya, M., Onoda, H., et al. (2015). The JRA-55 reanalysis: general specifications and basic characteristics. J. Meteo. Society of Japan. 93, 5–48. doi: 10.2151/jmsj.2015-001
Komen, G. J., Hasselmann, K., and Hasselmann, K. (1984). On the existence of a fully developed wind-sea spectrum. J. Phys. Oceanogr. 14, 1271–1285. doi: 10.1175/1520-0485(1984)014<1271:oteoaf>2.0.co;2
Le Bars, D., Drijfout, S., and de Vries, H. A. (2017). High-end sea level rise probabilistic projection including rapid Antarctic ice sheet mass loss. Environ. Res. Lett. 12, 1–10. doi: 10.1088/1748-9326/aa6512
Limber, P. W., Barnard, P. L., Vitousek, S., and Erikson, L. H. (2018). A model ensemble for projecting multidecadal coastal cliff retreat during the 21st century. J. Geophys. Res. Earth Surf. 123, 1566–1589. doi: 10.1029/2017JF004401
Lyu, K., Church, J. A., Slangen, A. B. A., and Hu, J. (2014). Time of emergence for regional sea-level change. Nat. Clim. Change. 4, 1006–1010. doi: 10.1038/NCLIMATE2397
Marcos, M., Rohmer, J., Vousdoukas, M. I., Mentaschi, L., Le Cozannet, G., and Amores, A. (2019). Increased extreme coastal water levels due to the combined action of storm surges and wind waves. Geophys. Res. Lett 46, 4356–4364. doi: 10.1029/2019GL082599
Marcos, M., Tsimplis, M. N., and Shaw, A. G. P. (2009). Sea level extremes in southern Europe. J. Geophys. Res. 114:C01007. doi: 10.1029/2008JC004912
Masselink, G., Castelle, B., Scott, T., Dodet, G., Suanez, S., Jackson, D., et al. (2016). Extreme wave activity during 2013/2014 winter and morphological impacts along the Atlantic coast of Europe. Geophys. Res. Lett. 43, 2135–2143. doi: 10.1002/2015GL067492
Mawdsley, R. J., Haigh, I. D., and Wells, N. C. (2015). Global secular changes in different tidal high water, low water and range levels. Earth Fut. 3, 66–81. doi: 10.1002/2014EF000282
Melet, A., Meyssignac, B., Rafael Almar, R., and Le Cozannet, G. (2018). Under-estimated wave contribution to coastal sea-level rise. Nat. Clim. Change. 8, 234–239. doi: 10.1038/s41558-018-0088-y
Mentaschi, L., Vousdoukas, M. I., Voukouvalas, E., Dosio, A., and Feyen, L. (2017). Global changes of extreme coastal wave energy fluxes triggered by intensified teleconnection patterns. Geophys. Res. Lett. 44, 2416–2426. doi: 10.1002/2016GL072488
Molares, R. (2011). The INFLUENCE of the Dique Channel Discharge on the Seawater of Cartagena Bay—Colombia. dissertation/master’s thesis, Universitat Politecnica de Catalunya, Barcelona.
Morales-Márquez, V., Orfila, A., Simarro, G., Gómez-Pujol, L., Álvarez-Ellacuría, A., Conti, D., et al. (2018). Numerical and remote techniques for operational beach management under storm group forcing. Nat. Hazards Earth. Syst. Sci. 18, 3211–3223. doi: 10.5194/nhess-2018-173
Moss, R. H., Edmonds, J. A., Hibbard, K. A., Manning, M. R., Rose, S. K., van Vuuren, D. P., et al. (2010). The next generation of scenarios for climate change research and assessment. Nat 463, 747–756. doi: 10.1038/nature08823
Nicholls, R. J., and Cazenave, A. (2010). Sea-level rise and its impact on coastal zones. Science 328, 1517–1520. doi: 10.1126/science.1185782
Nicholls, R. J., Hanson, S. E., Lowe, J. A., Warrick, R. A., Lu, X., and Long, A. J. (2014). Sea-level scenarios for evaluating coastal impacts. WIREs Clim. Change 5, 129–150. doi: 10.1002/wcc.253
Nicholls, R. J., Marinova, N., Lowe, J. A., Brown, S., Vellinga, P., Gusmão, D., et al. (2011). Sea-level rise and its possible impacts given a ‘beyond 4°C world’ in the twenty-first century. Philos. Trans. R. Soc. A Math. Phys. Eng. Sci. 369, 161–181. doi: 10.1098/rsta.2010.0291
Nicolae-Lerma, A., Thomas, Y.-F., Durand, P., Anselme, B., and Andrade, C. A. (2013). Modélisation de submersions marines et leur validation par observation vidéo à Carthagène des Indes, Colombie Coastal floods modeling and video observation validation in Cartagena de Indias, colombia. Géomorphol. Relief Processus Environ. 4, 481–498. doi: 10.4000/geomorphologie.10417
Nicolae-Lerma, A., Thomas, Y.-F., Durand, P., Torres, R. R., and Andrade, C. A. (2008). Variabilidad del nivel del mar desde 1950 hasta el 2000 y riesgos asociados a episodios de Mar de leva en las Penıìnsulas de bocagrande y castillogrande. Cartagena de Indias, colombia. Bol. Cient. Cioh 26, 71–84.
Nieto, M. A., Garau, B., Balle, S., Simarro, G., Zarruk, G. A., Ortiz, A., et al. (2010). An open source, low cost video-based coastal monitoring system. Earth Surf. Process. Landforms. 35, 1712–1719. doi: 10.1002/esp.2025
Ojeda, E., and Guillén, J. (2008). Shoreline dynamics and beach rotation of artificial embayed beaches. Mar. Geol. 253, 51–62. doi: 10.1016/j.margeo.2008.03.010
Ortiz, J. C., Plazas, J. M., and Lizano, O. (2015). Evaluation of extreme waves associated with cyclonic activity on san andrés island in the caribbean sea since 1900. J. Coast. Res. 31, 557–568. doi: 10.2112/JCOASTRES-D-14-00072.1
Osorio, A. F., Mesa, J., Bernal, G., and Montoya, R. (2009). Reconstrucción de cuarenta años de datos de oleaje en el mar Caribe colombiano empleando el modelo WWIIITM y diferentes fuentes de datos. Bol. Cient. Cioh 27, 37–56. doi: 10.26640/01200542.27.37_56
Osorio, A. F., Montoya-Vargas, S., Cartagena, C. A., Espinosa, J., Orfila, A., and Winter, C. (2019). Virtual BUOY: a video-based approach for measuring near-shore wave peak period. Comput. Geosci. 133:104302. doi: 10.1016/j.cageo.2019.07.006
Otero, L. J., Ortiz-Royero, J. C., Ruiz-Merchan, J. K., Higgins, A. E., and Henriquez, S. A. (2016). Storms or cold fronts what is really responsible for the extreme waves regime in the colombian caribbean coastal region? Nat. Hazards Earth Syst. Sci. 16, 1–11. doi: 10.5194/nhess-16-391-2016
Passeri, D. L., Hagen, S. C., Medeiros, S. C., Bilskie, M. V., Alizad, K., and Wang, D. (2015). The dynamic effects of sea level rise on low gradient coastal landscapes: a review. Earth’s Future. 3, 159–181. doi: 10.1002/2015EF000298
Peláez-Zapata, D. S., Osorio, A. F., Alvarez-Silva, O. A., Osorio-Cano, J. D., and Payán, L. (2012). “Estimación de la Cota de Inundación Como Herramienta Para la Conservación de las Tortugas Marinas en el Pacífico Colombiano,” in XXV Congreso Latinoamericano de Hidráulica San José, (Costa Rica), 9–12. doi: 10.13140/2.1.5035.8402
Poveda, G., Velez, J. I., Mesa, O. J., Hoyos, C. D., Mejía, J. F., Barco, O. J., et al. (2002). Influencia de fenómenos macro climáticos sobre el ciclo anual de la hidrología colombiana: cuantificación lineal, no lineal y percentiles probabilísticos. Meteorol. Colomb 6, 121–130
Restrepo, J. C., Escobar, J., Otero, L., Franco, D., Pierini, J., and Correa, I. (2017). Factors influencing the distribution and characteristics of surface sediment in the bay of cartagena. Colombia. J. Coast. Res. 33, 135–148. doi: 10.2112/JCOASTRES-D-15-00185.1
Ruggiero, P., Komar, P. D., and Allan, J. C. (2010). Increasing wave heights and extreme value projections: the wave climate of the U.S. Pacific Northwest. Estuar. Coast. Shelf Sci 183, 221–234.
Salmon, S. A., Bryan, K. R., and Coco, G. (2007). “The use of video systems to measure run-up on beaches,” in Proceedings of the 9th International Coastal Symposium, ed. J. Coast (Gold Coast), 211–215.
Sayol, J. M., and Marcos, M. (2018). Assessing flood risk under sea level rise and extreme sea levels scenarios. application to the Ebro Delta (Spain). J. Geophys. Res. Oceans 123, 794–811. doi: 10.1002/2017JC013355
Seemüller, W., Seitz, M., Sánchez, L., and Drewes, H. (2009). The Position and Velocity solution SIR09P01 of the IGS Regional Network Associate Analysis Centre for SIRGAS (IGS RNAAC SIR). DGFIReport 85. Berlin; Springer.
Simarro, G., Bryan, K. R., Guedes, R. M. C., Sancho, A., Guillen, J., and Coco, G. (2015). On the use of variance images for runup and shoreline detection. Coast. Eng. 99, 136–147. doi: 10.1016/j.coastaleng.2015.03.002
Slangen, A. B. A., Carson, M., Katsman, C. A., van de Wal, R. S. W., Köhl, A., Vermeersen, L. L., et al. (2014). Projecting twenty-first century regional sea-level changes. Clim. Change 124, 317–332. doi: 10.1007/s10584-014-1080-9
Smit, P., Janssen, T., Holthuijsen, L., and Smith, J. (2014). Nonhydrostatic modelling of surf zone wave dynamics. Coast. Eng. 83, 36–48. doi: 10.1016/j.coastaleng.2013.09.005
Thomas, Y.-F., Nicolae Lerma, A., Durand, P., Posada, B., Garcia Valencia, C., and Andrade Amaya, C. A. (2011). Altura significativa del oleaje en la cuenca colombiana del caribe, datos de altimetría radar Bol. Cient. Cioh. 29, 27–45. doi: 10.26640/01200542.29.27_45
Torres, R. R., and Tsimplis, M. N. (2012). Seasonal sea level cycle in the caribbean sea. J. Geophys. Res. 117, C07011. doi: 10.1029/2012JC008159
Torres, R. R., and Tsimplis, M. N. (2014). Sea level extremes in the Caribbean Sea. J. Geophys. Res. Oceans. 119, 4714–4731. doi: 10.1002/2014JC009929
Tsimplis, M. N. (1995). The response of sea level to atmospheric forcing in the mediterranean. J Coast. Res. 11, 1309–1321.
Vermeer, M., and Rahmstorf, S. (2009). Global sea level linked to global temperature. PNAS 106, 21527–21532. doi: 10.1073/pnas.0907765106
Verschuur, J. (2018). Implications of uncertain Antarctic ice sheet dynamics for managing future coastal erosion: A probabilistic approach for a data-scarce environment in the Caribbean. dissertation/master’s thesis, Delft University of Technology, Koninkrijk der Nederlanden.
Vitousek, S., Barnard, P. L., Fletcher, C. H., Frazer, N., Erikson, L., and Storlazzi, C. D. (2017). Doubling of coastal flooding frequency within decades due to sea-level rise. Sci. Rep. 7:1399. doi: 10.1038/s41598-017-01362-7
Vousdoukas, M. I., Mentaschi, L., Voukouvalas, E., Verlaan, M., Jevrejeva, S., Jackson, L. P., et al. (2018). Global probabilistic projections of extreme sea levels show intensification of coastal flood hazard. Nat. Commun. 9:2360. doi: 10.1038/s41467-018-04692-w
Wahl, T., and Chambers, D. P. (2014). Evidence for multidecadal variability in US extreme sea level records. J. Geophys. Res. Oceans. 120, 1527–1544. doi: 10.1002/2014JC010443
Wang, J., Yi, S., Li, M. Y., Wang, L., and Song, C. C. (2018). Effects of sea level rise, land subsidence, bathymetric change and typhoon tracks on storm flooding in the coastal areas of Shanghai. Sci Total Environ 621, 228–234. doi: 10.1016/j.scitotenv.2017.11.224
Willis, J. K., and Church, J. A. (2012). Regional Sea-Level Projection. Science 336, 550–551. doi: 10.1126/science.1220366
Woodworth, P. L., Hunter, J. R., Marcos, M., Caldwell, P., Menendez, M., and Haigh, I. (2017). Towards a global higher-frequency sea level dataset. Geosci. Data J. 3, 50–59. doi: 10.1002/gdj3.42
Young, I. R., Zieger, S., and Babanin, A. V. (2011). Global trends in wind speed and wave height. Science 332, 451–455. doi: 10.1126/science.1197219
Keywords: sea level rise, coastal flooding, RCP4.5, Cartagena de Indias, run-up
Citation: Orejarena-Rondón AF, Sayol JM, Marcos M, Otero L, Restrepo JC, Hernández-Carrasco I and Orfila A (2019) Coastal Impacts Driven by Sea-Level Rise in Cartagena de Indias. Front. Mar. Sci. 6:614. doi: 10.3389/fmars.2019.00614
Received: 23 June 2019; Accepted: 18 September 2019;
Published: 01 October 2019.
Edited by:
Isabel Iglesias, University of Porto, PortugalReviewed by:
Alexandre Nicolae Lerma, Bureau de Recherches Géologiques et Minières, FranceSimone Simeone, Italian National Research Council (CNR), Italy
Copyright © 2019 Orejarena-Rondón, Sayol, Marcos, Otero, Restrepo, Hernández-Carrasco and Orfila. This is an open-access article distributed under the terms of the Creative Commons Attribution License (CC BY). The use, distribution or reproduction in other forums is permitted, provided the original author(s) and the copyright owner(s) are credited and that the original publication in this journal is cited, in accordance with accepted academic practice. No use, distribution or reproduction is permitted which does not comply with these terms.
*Correspondence: Alejandro Orfila, aorfila@imedea.uib-csic.es