Characterization and Mapping of a Deep-Sea Sponge Ground on the Tropic Seamount (Northeast Tropical Atlantic): Implications for Spatial Management in the High Seas
 Berta Ramiro-Sánchez1*
  José Manuel González-Irusta2,3
  Lea-Anne Henry1
  Jason Cleland1
  Isobel Yeo4
  Joana R. Xavier5,6
  Marina Carreiro-Silva2,3
  Íris Sampaio3,7
  Jeremy Spearman8
  Lissette Victorero4,9,10,11
  Charles G. Messing12
  Georgios Kazanidis1
  J. Murray Roberts1
  Bramley Murton4
- 1School of GeoSciences, The University of Edinburgh, Edinburgh, United Kingdom
- 2OKEANOS Center, Faculty of Science and Technology, University of the Azores, Horta, Portugal
- 3Marine and Environmental Sciences Centre, Instituto do Mar, Universidade dos Açores, Horta, Portugal
- 4National Oceanography Centre, Southampton, United Kingdom
- 5CIIMAR – Interdisciplinary Centre of Marine and Environmental Research, University of Porto, Matosinhos, Portugal
- 6Department of Biological Sciences and KG Jebsen Centre for Deep Sea Research, University of Bergen, Bergen, Norway
- 7Senckenberg am Meer, Abteilung Meeresforschung, Wilhelmshaven, Germany
- 8HR Wallingford Ltd., Wallingford, United Kingdom
- 9Institut de Systématique, Évolution, Biodiversité (ISYEB), CNRS, Muséum National d’Histoire Naturelle, École Pratique des Hautes Études, Sorbonne Université, Paris, France
- 10Biologie des Organismes et Ecosystèmes Aquatiques (BOREA), CNRS, Muséum National d’Histoire Naturelle, IRD, Sorbonne Université, Université de Caen Normandie, Université des Antilles, Paris, France
- 11Centre d’Écologie et des Sciences de la Conservation (CESCO), CNRS, Muséum National d’Histoire Naturelle, Sorbonne Université, Paris, France
- 12Department of Marine and Environmental Sciences, Nova Southeastern University, Dania Beach, FL, United States
Ferromanganese crusts occurring on seamounts are a potential resource for rare earth elements that are critical for low-carbon technologies. Seamounts, however, host vulnerable marine ecosystems (VMEs), which means that spatial management is needed to address potential conflicts between mineral extraction and the conservation of deep-sea biodiversity. Exploration of the Tropic Seamount, located in an Area Beyond National Jurisdiction (ABNJ) in the subtropical North Atlantic, revealed large amounts of rare earth elements, as well as numerous VMEs, including high-density octocoral gardens, Solenosmilia variabilis patch reefs, xenophyophores, crinoid fields and deep-sea sponge grounds. This study focuses on the extensive monospecific grounds of the hexactinellid sponge Poliopogon amadou (Thomson, 1878). Deep-sea sponge grounds provide structurally complex habitat, augmenting local biodiversity. To understand the potential extent of these sponge grounds and inform spatial management, we produced the first ensemble species distribution model and local habitat suitability maps for P. amadou in the Atlantic employing Maximum Entropy (Maxent), General Additive Models (GAMs), and Random Forest (RF). The main factors driving the distribution of the sponge were depth and maximum current speed. The sponge grounds occurred in a marked bathymetric belt (2,500 – 3,000 m) within the upper North Atlantic Deep Water mass (2.5∘C, 34.7 psu, O2 6.7–7 mg ml-1), with a preference for areas bathed by moderately strong currents (0.2 – 0.4 ms-1). GAMs, Maxent and RF showed similar performance in terms of evaluation statistics but a different prediction, with RF showing the highest differences. This algorithm only retained depth and maximum currents whereas GAM and Maxent included bathymetric position index, slope, aspect and backscatter. In these latter two models, P. amadou showed a preference for high backscatter values and areas slightly elevated, flat or with gentle slopes and with a NE orientation. The lack of significant differences in model performance permitted to merge all predictions using an ensemble model approach. Our results contribute toward understanding the environmental drivers and biogeography of the species in the Atlantic. Furthermore, we present a case toward designating the Tropic Seamount as an Ecologically or Biologically Significant marine Area (EBSA) as a contribution to address biodiversity conservation in ABNJs.
Introduction
Most of the deep seabed lies in areas beyond national jurisdictions (ABNJ), areas where the biogeography of vulnerable marine ecosystems (VMEs) has received relatively little attention and where governance is limited. Such ecosystems are often characterized by slow-growing, long-lived and late-maturing species, traits that limit their potential for resilience and recovery from human disturbances such as bottom-contact fishing and, in the future, deep-sea mining (Ramirez-Llodra et al., 2011). Consequently, the United Nations General Assembly (UNGA) (Resolution 61/105) called all Member States to take management measures in the high seas to protect VMEs (UNGA, 2006; FAO, 2009). The resolution made regional fisheries management organisations (RFMOs) responsible for identifying VMEs in their regulatory areas and implementing management measures to regulate impacts from bottom trawling. In the case of deep-sea mining applications, the International Seabed Authority (ISA)—the body that regulates activities on the seabed in ABNJs—is to develop policy tools on the exploitation of minerals that consider VMEs and ecologically or biologically significant marine areas (EBSAs) that may include VMEs (Miller et al., 2018). However, little is known about the distribution of most VMEs, and every effort to improve the understanding of marine VME biogeography may lead to better ocean governance.
Seamounts can host numerous VME indicator species (Schlacher et al., 2014; Watling and Auster, 2017). These underwater mountains provide hard substrata for VME indicator taxa such as corals, sponges and other species to settle and grow (Rogers et al., 2007; Samadi et al., 2007; Clark et al., 2012). Seamounts are often characterized by particular hydrography, enhancing the flow of currents and ultimately, the availability of food to suspension feeders (Watling and Auster, 2017). Flow enhancement is often more pronounced on elevated features on the seamount, such as a ridges or pillars that raise from the surrounding seafloor (Ramirez-Llodra et al., 2010; Watling and Auster, 2017). High densities of corals and sponges can be found on those features (Genin et al., 1986; Rogers et al., 2007; Roberts et al., 2009; Henry et al., 2013; Victorero et al., 2018), although benthic assemblages and biomass may vary among seamounts in less productive regions, where substratum is not suitable, or where seamounts are not adjacent to continental slopes (Rowden et al., 2010). VMEs on seamounts are threatened by human activities, especially from bottom-trawling fishing and, in the future, from the expected impacts of deep-sea mining (Clark et al., 2010) as they are a potential resource for scarce elements used in the generation of low-carbon technologies. Since VMEs are abundant on seamounts and there is a lack of distributional data that prevents their mapping before any activity occurs, Watling and Auster (2017) suggested managing seamounts as VMEs as a precautionary measure.
In the North Atlantic, VMEs formed by deep-sea sponges are sometimes encountered on seamounts, ridges, continental slopes and in fjords (Rice et al., 1990; Klitgaard, 1995; Barthel et al., 1996; Murillo et al., 2012; Knudby et al., 2013; Cárdenas and Rapp, 2015; McIntyre et al., 2016). Classed as VME indicator taxa because of their often slow rates of growth and long lifespans (Murillo et al., 2016), deep-sea sponge grounds are especially vulnerable to mechanical disturbances on the deep seafloor. A type of animal forests (Rossi et al., 2017), sponge grounds are known to occur in areas where local currents enhance food supply (Klitgaard and Tendal, 2004; Hogg et al., 2010), often forming along distinct bands that follow bathymetric contours (Hogg et al., 2010). As habitat-formers, sponges are drivers of biodiversity in deep-sea ecosystems (Beazley et al., 2013, 2015) and play a significant role in ecosystem function by recycling dissolved organic matter into particulate matter that becomes available to detritivores and ultimately, to organisms at higher trophic levels (de Goeij et al., 2013; Rix et al., 2016). Sponges also contribute significantly to the silicon cycle by acting as a silicon reservoir (Maldonado et al., 2011). Despite remaining poorly mapped in the North Atlantic (Klitgaard and Tendal, 2004; Murillo et al., 2012), Distribution Models (DMs) may provide the understanding that is currently lacking by predicting sponge habitats beyond surveyed areas and offering information for the development of conservation measures (e.g., Knudby et al., 2013; Howell et al., 2016).
In the high seas of the northeastern Atlantic, the Tropic Seamount lies within the Western Sahara Seamount Province, along the northwestern African continental margin. Although its composition and volcanic origin is well studied (Schmincke and Graf, 2000; van den Bogaard, 2013), little is known about its fauna apart from a few reports of deep-sea corals (Schmincke and Graf, 2000; Vázquez et al., 2011). A recent dedicated geological survey, led by the National Oceanographic Centre (NOC, Southampton, United Kingdom), part of the MarineE-tech project, focused on assessing controls on the formation, distribution and composition of seafloor ferromanganese crust deposits and impacts of their future potential exploitation by the deep-seabed mining industry. Part of the exploration mission was to survey the seamount using a remotely operated vehicle (ROV) to characterize the biological communities on Tropic Seamount, both by providing video and stills imagery and by sampling organisms for taxonomy using a combination of molecular and classical morphological-based classifications. Preliminary video analysis revealed the existence of a diverse set of VME indicator taxa, as found and described from other seamount ecosystems. However, one of the most distinctive observation was the occurrence of dense aggregations of the hexactinellid sponge Poliopogon amadou Thomson (1877), which formed extensive areas of sponge grounds in the deeper flanks of the seamount.
Poliopogon amadou, the only member of its genus in the Atlantic, is a large, fan-shaped pheronematid sponge that reaches up to 35 cm in height (Xavier et al., 2015). Its distribution and the factors that drive its occurrence remain poorly understood, but appears rather biogeographically limited. It has been recorded southwest of the Canary Islands (HMS Challenger expedition, 1878); on the Mid-Atlantic Ridge (MAR) at the equatorial region (between 15° and 23°N) and south of the Azores over a depth range of 2480–4022 m (Tabachnick and Menshenina, 2002); at asphalt seeps in the southwest Atlantic off Brazil (Fujikura et al., 2017); on the Caribbean Sea (Reiswig and Dohrmann, 2014); and the Vema Fracture Zone (Victorero and Xavier, personal observations). Xavier et al. (2015) also reported dense populations on the MAR at the Great Meteor Seamount in 2,675–2,765 m. The aim of the present study was to identify the environmental factors associated with its occurrence and predict the distribution of this VME indicator sponge on the Tropic Seamount. The distribution of P. amadou was modeled using three different DMs algorithms and for the purpose of management applications, a forecast ensemble map was produced to account for the predictions and uncertainties of the three modeling techniques (Araújo and New, 2007). This information can then be used to inform on-going high seas management efforts such as maritime spatial planning, environmental impact assessments, conservation of biogeographically unique provinces, and UN negotiations of a new treaty to protect biodiversity beyond national jurisdiction (BBNJ).
Materials and Methods
Study Area
The Tropic Seamount (Figure 1), located in the northeastern Atlantic (23°55′ N, 20° 45′W), is a four-armed, star-shaped guyot dated to 91.1 ± 0.2 Ma (van den Bogaard, 2013). With a flat-topped summit (slope of 0.5°–4°) sitting at approximately 1,000 m water depth with its base rooted at approximately 4,200 m depth, the seamount presents a truncated cone slightly elongated along a north-south axis, measuring about 42 km in length and 37 km in width (Palomino et al., 2016). The flanks of the seamount are divided by four ridges 10–13 km in length with slopes ranging from 5° to 45°. Radiating from the summit, the flanks also exhibit gullies measuring 3–10 km in length (Palomino et al., 2016). The seamount is thought to have once been an oceanic island that eroded and subsided to its present depth at 1,000 m (Schmincke and Graf, 2000).
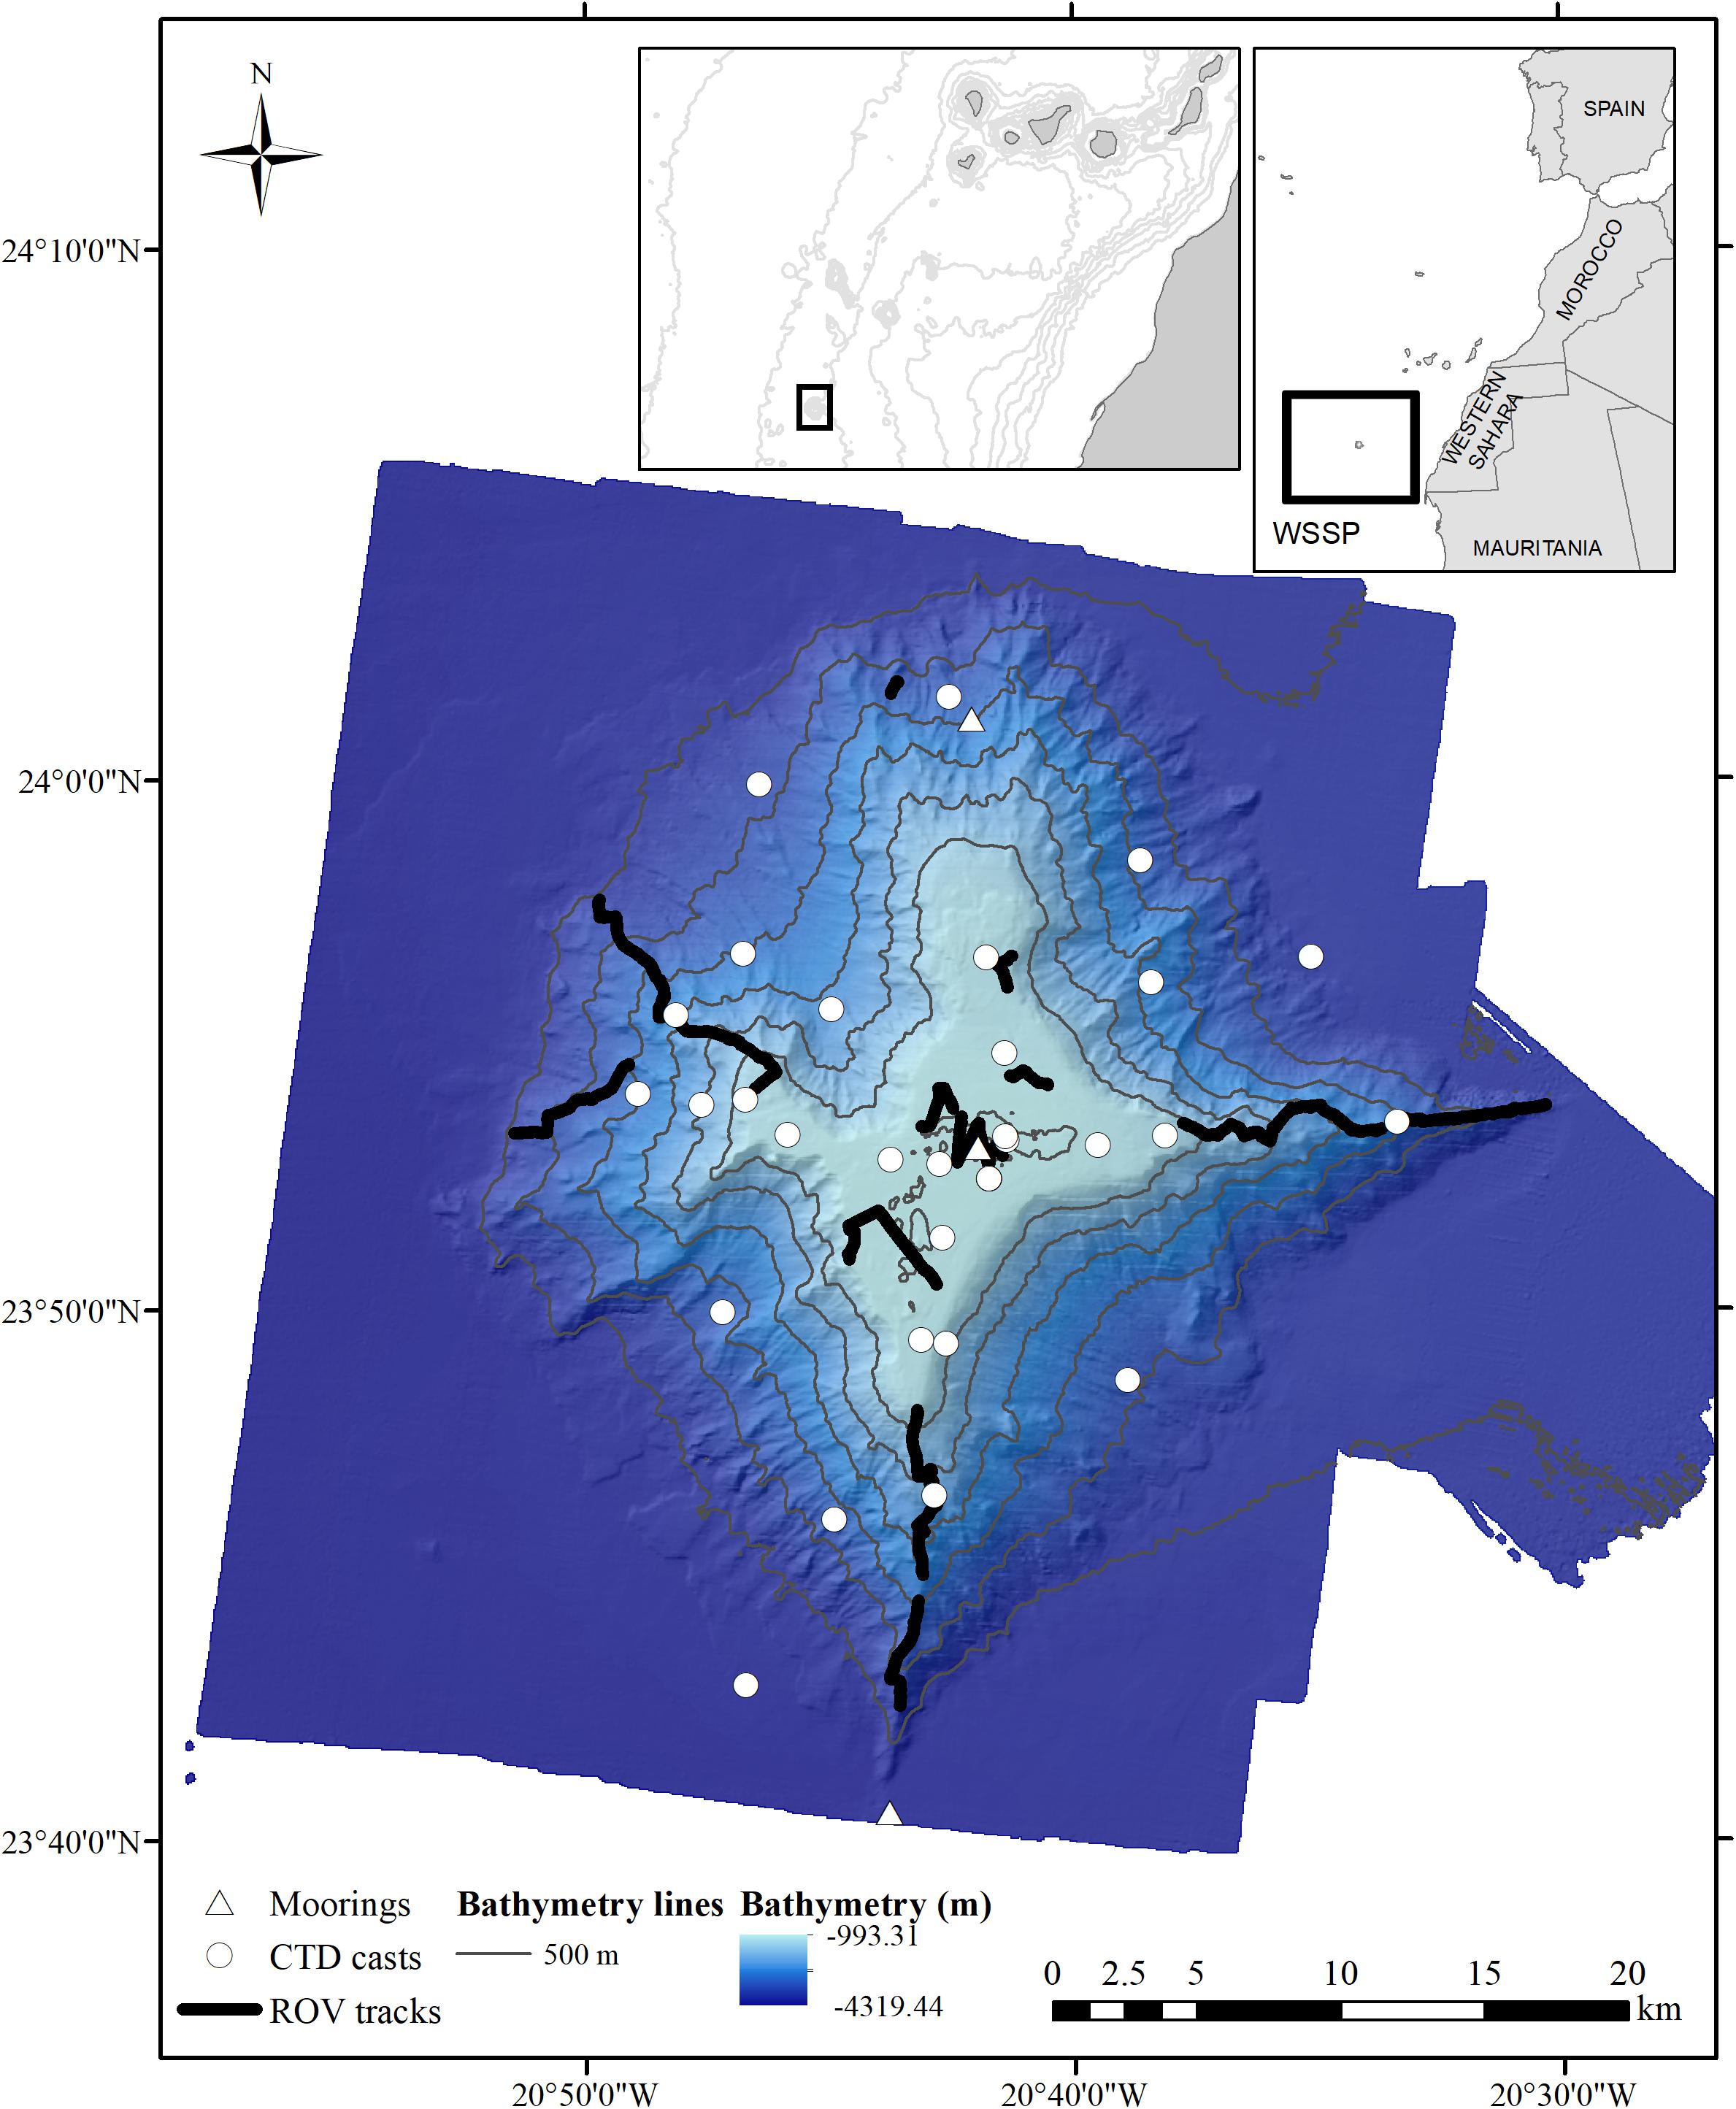
Figure 1. Location of the Tropic Seamount in the northeast tropical Atlantic with the different sampling operations: ROV tracks (thick black lines), CTD casts (white circles) and moorings (white triangles). Inset images show the location of the study area in relation to northwest Africa and the Western Sahara Seamount Province (WSSP).
This seamount sits between the seasonally productive waters off the NW African coast and the more oligotrophic waters of the North Atlantic subtropical gyre (Henderiks, 2001). The surface waters are supplied by the Canary Current (CC), which flows south-westward along the African coast, turning west to join the North Equatorial Current at 20°–25° N. Below the seasonal thermocline and waters influenced by coastal upwelling (<100 m), the North Atlantic Central Water (NACW) and South Atlantic Central Water (SACW) lie above ∼700 m. The NACW is characterized by a higher level of dissolved oxygen than the SACW. Intermediate depths, 700–1,600 m, are ventilated by the lower salinity Antarctic Intermediate Water (AAIW). Deeper layers from ∼1,600 m to the seafloor, are defined by the Upper North Atlantic Deep Water (NADW), which is the shallowest deep water mass influenced by the Mediterranean Water (MW) (Hernández-Guerra et al., 2001; Knoll et al., 2002; Hernández-Guerra et al., 2005; Pastor et al., 2012; Bashmachnikov et al., 2015; Pastor et al., 2015). The influence of the MW decreases southward and seasonally, stretching south in winter (Pastor et al., 2012). Phytoplankton-enriched waters from upwelling events extend offshore to the study area (Hernández-Guerra et al., 2005). Dissolved oxygen levels at the seamount drop to 2.5–3.5 μg ml-1 in the core of the oxygen minimum zone in ∼750 m and rise to 5 μg ml-1 at 3,000 m (Koschinsky et al., 1996).
Data Collection
Exploration of the Tropic Seamount was conducted from October 29th to December 8th 2016 during the research cruise JC142 on the RSS James Cook in support of the MarineE-tech project, one of four large projects part of UK’s NERC (Natural Environment Research Council) research program ‘SoS Minerals.’ During the cruise, the entire seamount was mapped with an EM120 multibeam echo-sounder, three moorings were deployed and 37 conductivity-temperature-depth (CTD) stations were occupied. There were also 28 ROV dives using the ROV Isis (Murton et al., 2017).
Biological Data
Remotely operated vehicle operations were mainly directed at rock sampling and drilling of ferromanganese crusts. Video and photographic surveys were conducted to characterize the biological communities on the seamount. The ROV was equipped with a mini Zeus HD video and SCORPIO digital stills camera, with scaling lasers 10 cm apart (Murton, 2016). The ROV maintained a mean altitude of 2.24 m from the seabed to ensure a consistent field of view. Voucher specimens of most abundant organisms were collected to confirm identifications from imagery. Figure 1 shows the sampling effort.
Organisms were identified and counted in video still images generated from the SCORPIO (12 M pixel) camera. Frames were extracted using Quicktime 7 Pro at a rate of one still per minute (every 15 m) to yield a total of 19,654 images. Species were identified down to the lowest possible taxonomic level based on visual observation (Table 1). The sponge P. amadou was one the most commonly observed habitat-forming VME indicator species in the study area, forming extensive monospecific sponge grounds. The final image databank for the analysis of the distribution of P. amadou contained 7,547 images after removing duplicates, images with ‘video-error’ messages or with poor visibility, and images with no associated environmental data to match. Abundance was not enumerated because the ROV lasers were not visible in the majority of the images, and the camera tilt angles varied constantly, both of which prevented accurate calculation of the field of vision, thus only presence–absence of sponges were used in the present study.
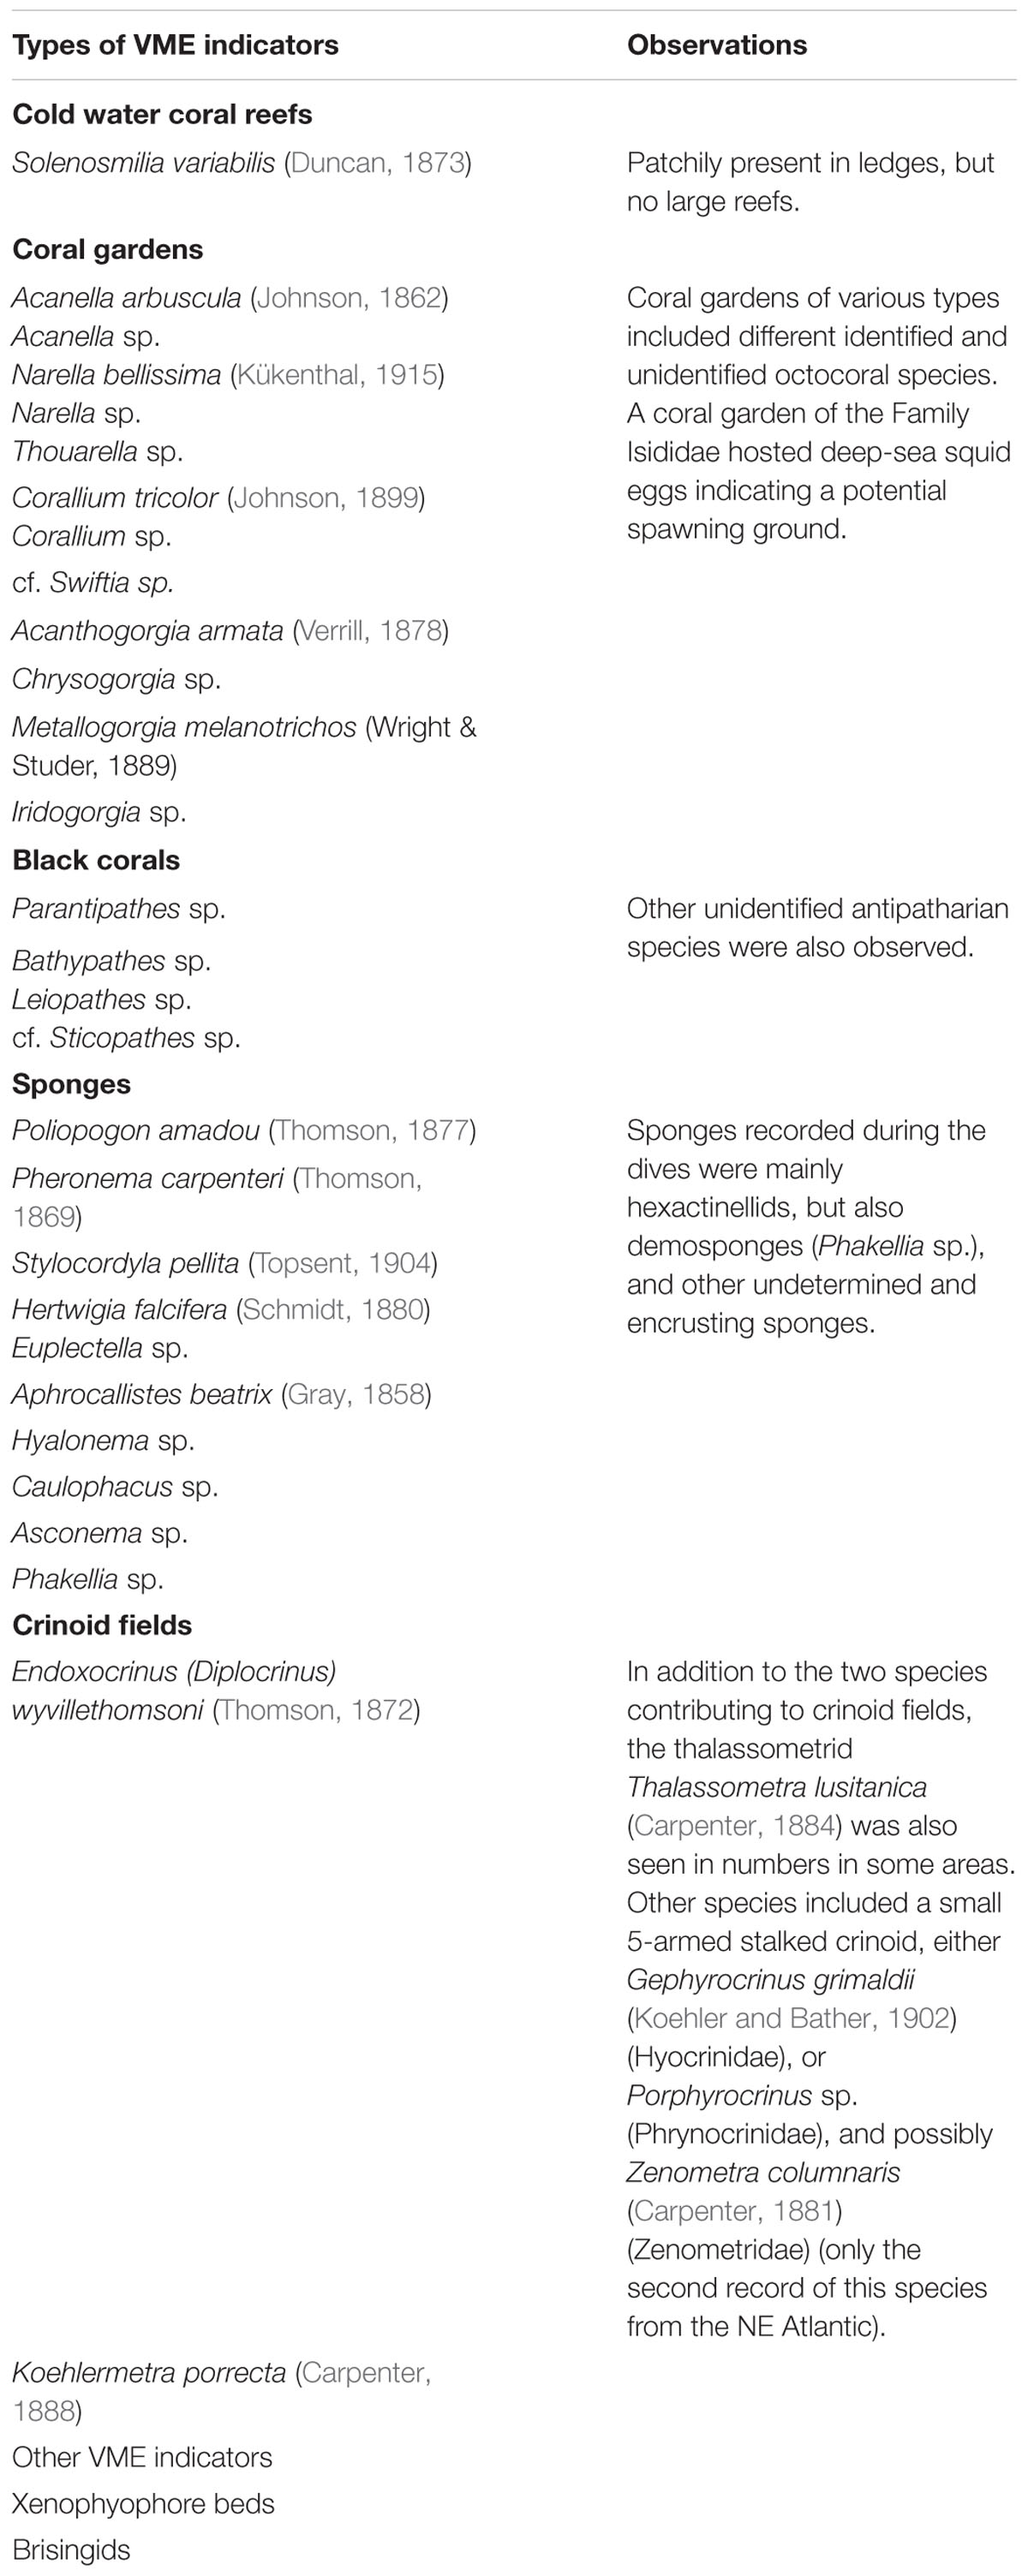
Table 1. VME indicator taxa observed on the images analyzed from the Tropic Seamount.
Environmental Variables
Multibeam echosounder and backscatter data were acquired using the ship mounted Kongsberg EM122. Processing was done using Caris HIPS and SIPS for the bathymetry and the QPS FM Geocoder Toolbox v7.6.3 for the backscatter. Final grids and mosaics were produced with a grid spacing of 50 m. This resolution was applied in the distribution models after resampling (if needed) all the environmental variables used for the analysis. Acoustic backscatter strength measured the acoustic energy reflected back from the seafloor and is itself a function of slope, acoustic hardness and seafloor roughness. For flat seafloor, it can be considered a proxy for substrate type. High backscatter seafloor represents hard substratum while low reflectivity typically indicates soft-sediment. Substrate type influences the distribution of benthic organisms, and previous studies have related backscatter intensity to the distribution of sponges and other deep-sea species (e.g., González-Irusta et al., 2015; Rowden et al., 2017). A set of additional seafloor variables was derived from the bathymetric data, as quantitative seabed descriptors, using the terrain function in the R package ‘raster’ (Hijmans et al., 2013) and the Benthic Terrain Model tool in ArcGIS 10.1 (Environmental Systems Research Institute [ESRI], 2015). These variables were Aspect (measured in terms of northness and eastness), Slope, Roughness, and fine (3/25 radius) and broad-scale (25/250 radius) Bathymetric Position Index (BPI).
Water column properties were recorded from 37 CTD casts and the temporal dynamics of the water masses investigated through the deployment of three moorings along the longitudinal axis of the seamount for 30 days (Figure 1) and shipboard acoustic Doppler conductivity profiler (ADCP). The mooring data together with the CTD casts were used to produce a hydrodynamic model of the seamount (Cooper and Spearman, 2017). The model domain extended over an area of 500 km × 500 km; all runs were done including tide and real-time wind values. Model outputs included a time series of salinity, temperature and current velocity at 49 layers through the water column (with higher resolution near the seabed and surface) at a horizontal resolution over the seamount of 100–800 m. Model simulations were used to obtain the maximum near-bed velocity of currents (at 1 m above the bed) to include in the distribution models. The current information was derived at a variable resolution from 500 to 600 m, changing across the study area. The layer was then interpolated (using ordinary kriging) to the same resolution as the bathymetric data and rest of the variables using the function “krige” from the ‘gstat’ package (Pebesma, 2004).
Before starting data analysis, collinearity between variables was checked using Spearman’s rank correlation coefficient and the Variance Inflation Factors (VIFs) (Zuur et al., 2009). Roughness and broad-scale BPI were highly correlated with slope and depth, respectively (Spearman’s rank correlation values > 0.7 and VIFs > 3) and were removed from the analysis. Consequently, seven variables were retained for the construction of the models to explore the factors controlling the distribution of P. amadou: water depth, slope, fine-scale BPI, eastness, northness, backscatter and maximum current speed (Figure 2).
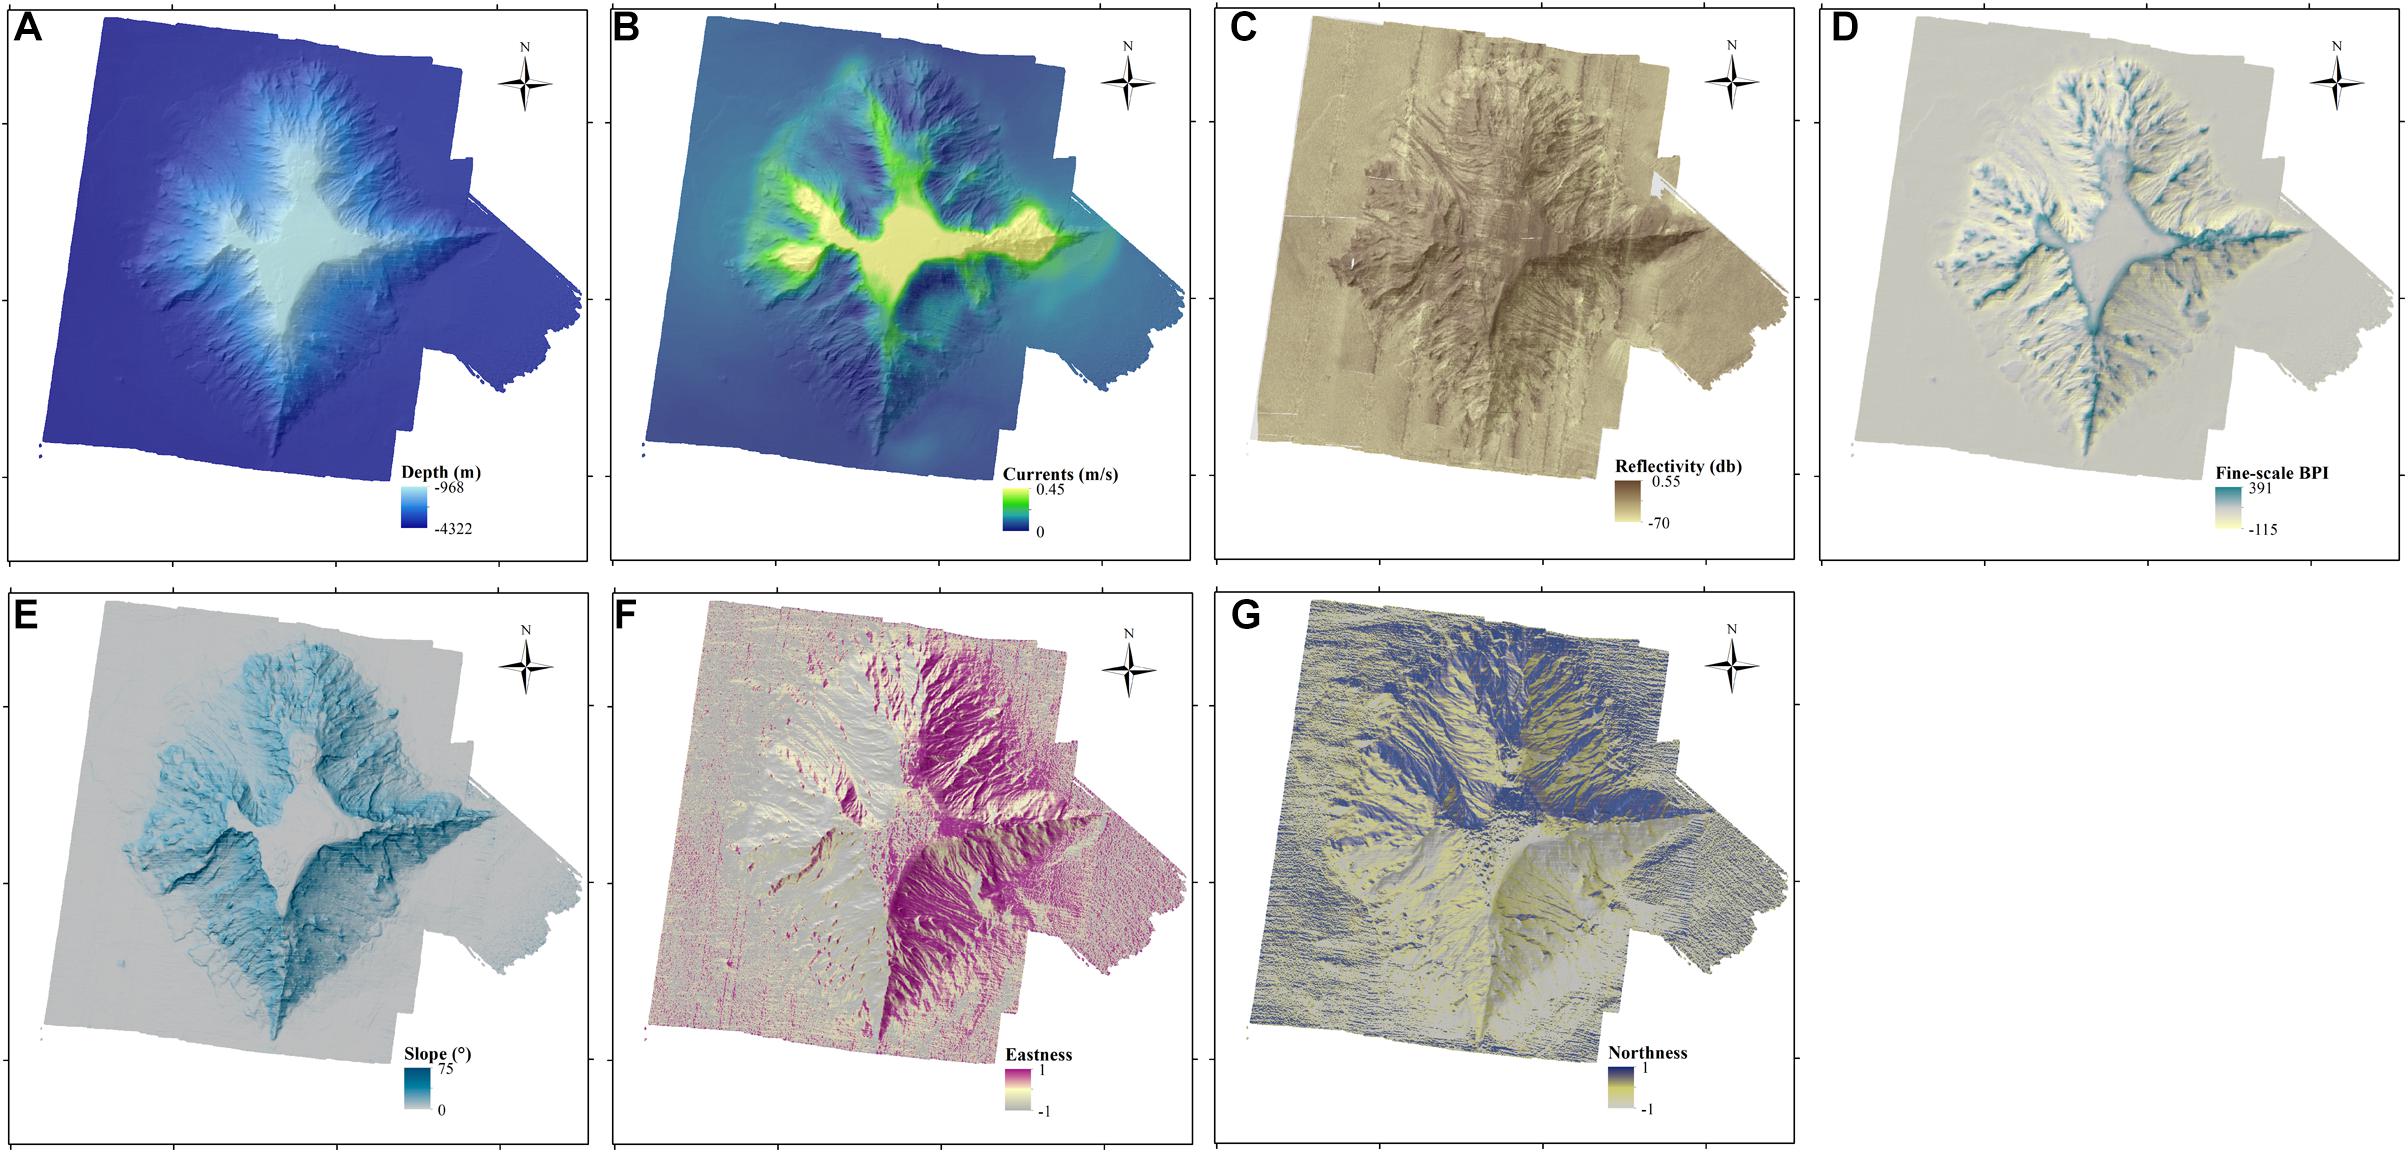
Figure 2. Maps illustrating the spatial patterns of the seven bathymetry-derived variables, which were used as explanatory variables in the models. (A) Depth, (B) Maximum speed of currents at the seabed, (C) Fine-scale Bathymetric Position Index (BPI), (D) Slope, (E) Reflectivity, (F) Northness, and (G) Eastness aspects of the seabed.
Data Analysis
The distribution of P. amadou at Tropic Seamount was modeled using three algorithms widely used in species distribution modeling (González-Irusta et al., 2015): Maxent (Phillips et al., 2006), GAMs (Hastie and Tibshirani, 1986) and Random Forest (Breiman, 2001) using R (R Core Team, 2018). The Maxent algorithm estimates species distribution by minimizing the distance between the probability density of species occurrence and the probability density of the covariates as they occur in the geographic space (Elith et al., 2011). Although it was developed as a new machine-learning algorithm, Renner and Warton (2013) demonstrated that it is actually equivalent to an inhomogeneous Poisson process. Recently, Phillips et al. (2017) have developed a new R package named ‘maxnet’ (Phillips, 2017), which uses this feature to fit Maxent models using the ‘glmnet’ package for regularized generalized linear models (Friedman et al., 2010). The main advantage of the ‘maxnet’ package is that it allows one to fit a point process model while keeping all the derived feature classes (especially hinge features) and default tuned regularization values of the Maxent Java application (Phillips et al., 2017). This means that the raw output of Maxent can be used directly as a model of relative abundance. In this work we used all the default parameters of ‘maxnet’ but using real absences derived from the ROV data instead of pseudo-absences.
General Additive Models (GAMs) are an extension of General Linear Models (GLMs) which allow one to model non-linear relationships between the response variable and the explanatory variables, using a smoothing function to link both. The distribution of many marine species and habitats have been successfully modeled using this non-parametric approach (e.g., González-Irusta and Wright, 2016; Parra et al., 2017; Serrano et al., 2017). The GAM models were fitted using the function “gam” in the ‘mgcv’ package (Wood, 2011). We used a binomial GAM with logit function and constrained the smoother curves to 4 knots to avoid overfitting.
The third model applied was Random Forest (RF) using the package ‘randomForest’ (Liaw and Wiener, 2002). This modeling framework builds multiple classification trees, each generated with subsets of random data and using a randomly smaller set of the predictor variables (Breiman, 2001). Unlike GAMs, RF offers the advantage of lacking any underlying assumption of the distribution of the response variable.
The variable selection differed for each algorithm. Maxent was fitted using all the variables previously selected after checking for collinearity, whereas for GAMs the variable selection was performed using the Akaike Information Criteria (AIC) and the function “dredge” from the package ‘MuMIn’ (Barton, 2018). For Random Forest the function “VSURF” from the package ‘VSURF’ (Genuer et al., 2010) was used to select the variables. The relationship between the environmental layers and the predicted probability of presence was analyzed using response curves and produced using the methodology described by Elith et al. (2005). We kept all the variables constant except the target variable, which was varied at 500 points across its range. Then, the prediction of each algorithm was computed for each of the 500 values of the target variable and used to produce the response curves. The importance of each variable in the final output was computed using the methodology described by Thuiller et al. (2009), which enables direct comparison across models. The spatial autocorrelation of residuals was analyzed for each model using the “variogram” implementation in the ‘gstat’ package (Pebesma and Graeler, 2018). The semi-variance of the residuals did not show any trend with distance between each point and therefore spatial autocorrelation in the models’ residuals was rejected.
Model Evaluation
The performance of the models was assessed by cross-validation using the function “get.block” from the ‘EnMEVAL’ package (Muscarella et al., 2014). This function finds the latitude and longitude that divides the number of occurrence localities into four similar groups. The objective of this method is to provide a larger level of spatial independence between the training and the evaluation data, reducing overestimation of model performance caused by a lack of spatial independence in the data (Fourcade et al., 2017). From the four original spatial blocks, we randomly selected one to evaluate the model (test subsample) and used the other three to build the models (training subsample). The ability of the training subsample to predict the probability of presence was tested using the test subsample in 10 runs. To avoid identical sample selection when the same block was selected, a random selection of only 80% of the data was used on each iteration.
The performance of the models was estimated using four different statistics: Sensitivity, Specificity, the True Skill Statistic (TSS) (Fielding and Bell, 1997), and the Area Under the Curve (AUC) of the receiver operating characteristic (ROC). Sensitivity is the proportion of observed presences that are predicted as such, whereas specificity is the proportion of observed absences that are correctly predicted. The TSS is the result of summing sensitivity and specificity and then subtracting one from the value. Allouche et al. (2006) suggested that TSS is a better option than the kappa statistic to evaluate distribution models, because it corrects kappa’s dependence of prevalence while still keeping all the advantages of this statistic. These three metrics need to convert the continuous prediction of the models (with values ranging from 0 to 1) into binomial values (0 and 1) using a threshold. In the present study we have used the value which maximizes the sum of sensitivity and specificity as threshold, following the recommendations by Liu et al. (2013). The last metric (AUC) was developed to overcome the potential subjectivity in the threshold selection. The ROC curve plots the sensitivity as a function of commission error (1-specificity). The area under the curve (AUC) provides a single number in the range of 0 to 1 as a metric of model performance independent of threshold selection, where AUC values ≥ 0.9 indicate excellent performance, values between 0.7 and 0.9 indicate good performance, and values ≤ 0.5 indicate better than random performance. Although Lobo et al. (2008) questioned the effectivity of AUC to measure model performance, it is still one of the preferred metrics to evaluate models performance and, together with the other three metrics, it ensures an adequate evaluation of the applied models. Differences between the models for the four statistics were tested using Tukey’s HSD post hoc test (p-value < 0.05).
Ensemble Models
Ensemble models are an effective solution to provide unique management advice by homogenizing the outputs of different SDMs techniques (Araújo and New, 2007; Robert et al., 2016; Rowden et al., 2017), usually achieved by computing the weighted averages of the different model outputs. Ensemble models also permit uncertainty caused by the different predictions to be calculated. In this study, we estimated an ensemble of all models as the weighted average of the GAM, Maxent and RF models (after Oppel et al., 2012; Anderson et al., 2016; Rowden et al., 2017) and integrated the spatial uncertainty of each of the three models in the estimation. Confidence levels for the prediction of each modeling approach were addressed using a bootstrap technique following Anderson et al. (2016) and Rowden et al. (2017). Accordingly, a random subset of the presence-absence data, in equal proportions, was drawn with replacement, and the three models built with their original settings. Predictions were then made for the study area. This process was repeated 200 times for the GAM, Maxent and RF models, which resulted in 200 estimates for each cell. Model uncertainty was then calculated as the coefficient of variation (CV) of the bootstrap output, i.e., the standard deviation divided by the mean. The weighted averages were calculated as the mean of the weighted averages of the TSS and AUC statistics.
Results
VME Indicator Taxa
Remotely operated vehicle images showed high diversity of VME indicator taxa on Tropic Seamount (Figure 3). Coral debris was observed in still images mainly on the summit dives but also on some of the ridges to a depth of 1,800 m. Fifteen cold-water coral species were observed, including one scleractinian, twelve octocorals and two black corals (Table 1). The main scleractinian coral identified from the images was Solenosmilia variabilis (Duncan, 1873), which was normally present on ledges, forming patches at depths from ∼1,000 to 1,800 m. Octocoral composition varied with depth, with Acanella arbuscula (Johnson, 1862), Metallogorgia melanotrichos (Wright and Studer, 1889), Corallium tricolor (Johnson, 1899), and species from the genus Chrysogorgia (Duchassaing and Michelotti, 1864), Iridogorgia (Verrill, 1883), and Thouarella (Gray, 1870) generally present at depths of ∼1,010–3,000 m on rocky substrates. The octocorals Narella bellissima (Kükenthal, 1915), Acanthogorgia armata (Verrill, 1878) and cf. Swiftia (Duchassaing and Michelotti, 1864) were commonly observed at depths up to 3,600 m associated to volcanic substrates. Unidentified black coral species belonging to the genus Parantipathes (Brooke, 1889) and Bathypathes (Brooke, 1889) were also observed. Extensive coral gardens, another type of animal forests (Rossi et al., 2017), dominated by bamboo corals (Familiy Isididae) tentatively assigned based on branching patterns to the genus Keratoisis (Wright, 1869) and Lepidisis (Verrill, 1883) based on ROV images were recorded at 2,500–3,500 m depth.
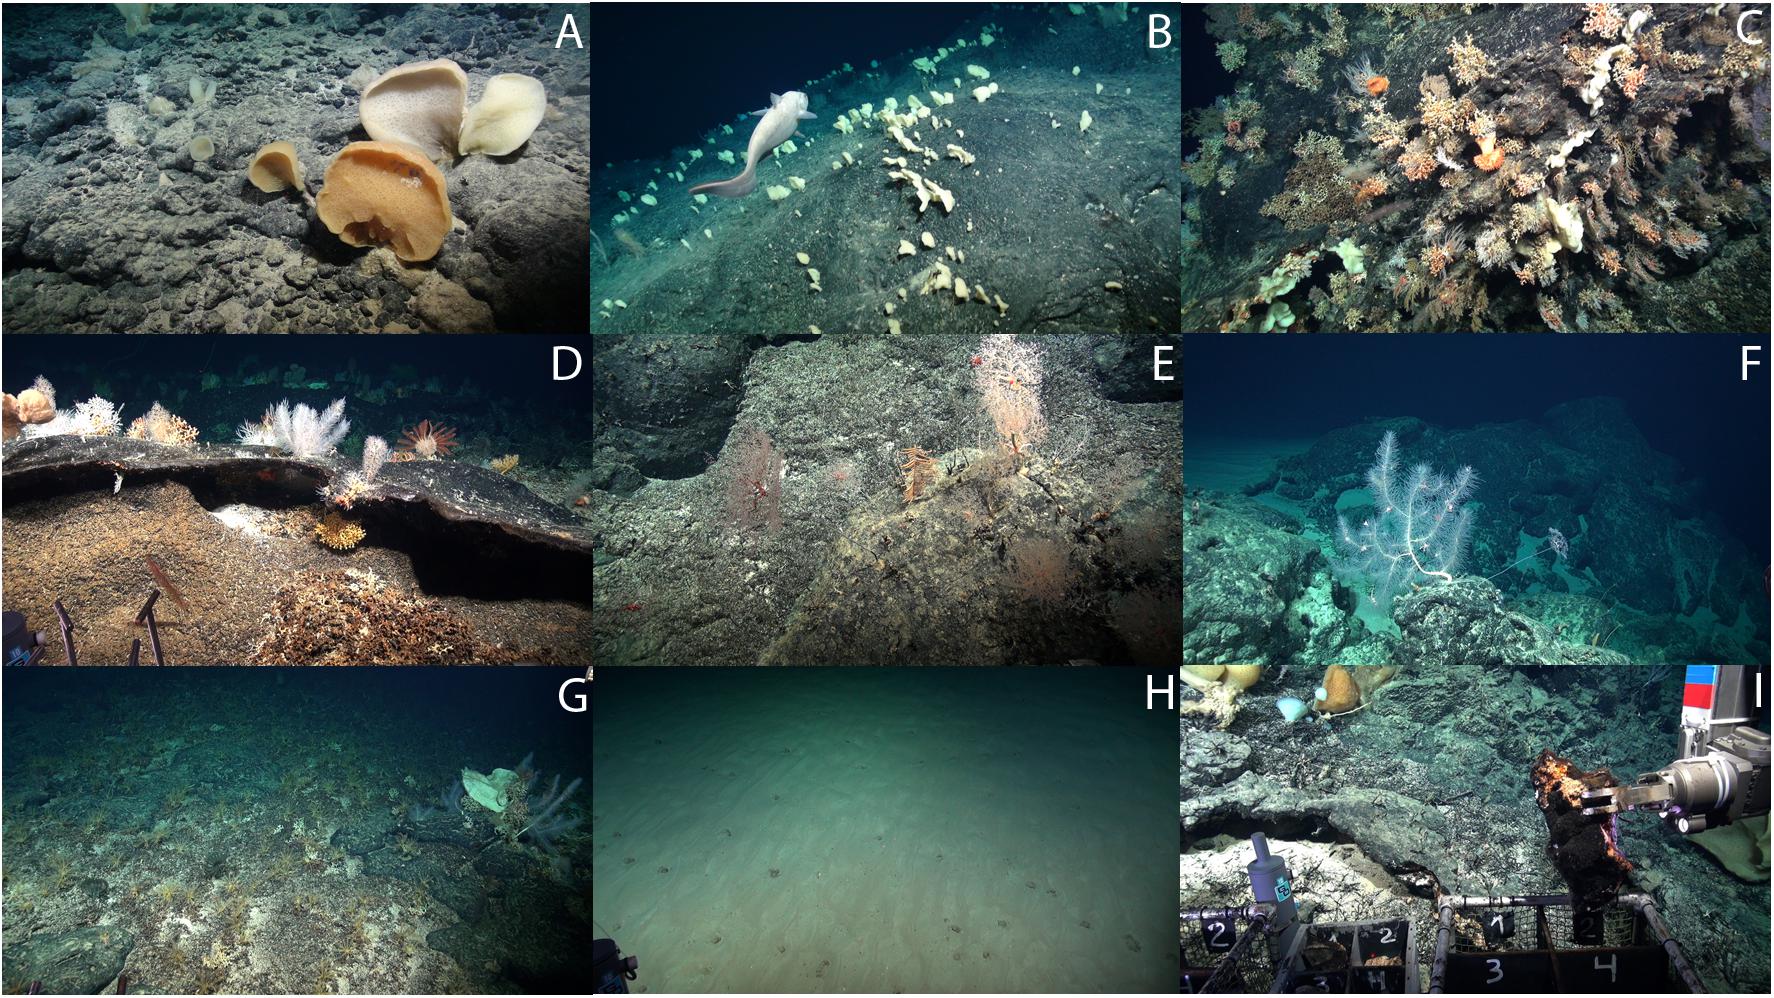
Figure 3. Seabed photographs showing some of the VME indicator taxa observed on the Tropic Seamount. (A) Specimens of Poliopogon amadou. (B) Sponge ground of Poliopogon amadou. (C) Coral garden on a ledge with diverse octocorals and patches of Solenosmilia variabilis. (D) Octocoral garden and coral rubble. (E) Antipatharian species, Metallogorgia melanotrichos and Chrysogorgia sp. (F) Unidentified black coral. (G) A crinoid field of possibly Thalassometra lusitanica. (H) Field of xenophyophores. (I) ROV Isis sampling ferromanganese crust.
Deep-sea squid eggs from an unidentified species were observed laying on bamboo corals on several occasions, indicating a potential spawning and/or nursery ground. Cold-water coral composition for Tropic Seamount is comparable to the reported for the la Concepción Bank and El Hierro ridge (Northern Seamounts group WSSP) and to the Canary Island slopes, with dominance of octocorals (Brito and Ocanña, 2004; Almón et al., 2014; Álvarez et al., 2016). Dense assemblages of bamboo corals of the genus Keratoisis have also been reported for Cape Verde seamounts between 1,900 and 3,699 m (Hansteen et al., 2014).
Besides Poliopogon amadou, other sponges seen included the hexactinellid Pheronema carpenteri (Thomson, 1869), Stylocordyla pellita (Topsent, 1904), Hertwigia falcifera (Schmidt, 1880), Aphrocallistes beatrix (Gray, 1858), and species from the genus Euplectella (Owen, 1841); Hyalonema (Gray, 1832); Caulophacus (Schulze, 1886); Asconema (Kent, 1870); and Phakellia (Bowerbank, 1862). Demosponges and other undetermined massive and encrusting sponges were also observed.
Xenophyophore and crinoid fields were also observed (Table 1). Among crinoids, the most common species were fields of stalked Endoxocrinus (Diplocrinus) wyvillethomsoni (Thomson, 1872) (Isselicrinidae), and two thalassometrid feather stars: Koehlermetra porrecta (Carpenter, 1888), an orange species with 20 or more arms, and a yellow species, perhaps Thalassometra lusitanica (Carpenter, 1884). The stalked species, E. wyvillethomsoni, is the only member of order Isocrinida found in the NE Atlantic occurring along the eastern Atlantic margin from west of Ile d’Ouessant, France (49°N) to south of the Canary Islands off the coast of Morocco (25°N) at depths from 1,246 to 2,070 m (Roux, 1985). Koehlermetra porrecta occurs in the eastern Atlantic from George Bligh Bank (NE end of the Rockall Plateau) to Ascension Island, over a depth range of at least 768–1,448 m (possibly 755–1,769 m) (Carpenter, 1888; Bullimore et al., 2013; Narayanaswamy et al., 2013). Stevenson et al. (2017) reported large populations of K. porrecta in 778–941 m in the Bay of Biscay. Records of Thalassometra lusitanica range from the Canary Islands and Morocco to off Cape Carvoeiro, Portugal, at depths of 1,229–1,716 m (possibly 914–1,912 m), with one record in 2,165 m (Clark, 1950, 1980).
Species Data
From the initial dataset of 7,547 pictures distributed across the study area, 923 showed at least one specimen of P. amadou. The mean number of P. amadou sponges in the images in which they occurred was 11 individuals with a maximum of 121 individuals. The sponge seemed to be distributed throughout the four ridges sampled on the seamount. Analysis of the still frames showed wide presence of P. amadou in the eastern, southern and western ridges of the seamount. A brief ROV dive on the northern crest of the seamount recorded one specimen of P. amadou. The sponges occupied a distinct bathymetric belt ranging from 1,960 to 3,660 m. Different body sizes ranging from ∼5 to 55 cm in length were observed across all the stills. The sponges were found only on hard substrates corresponding to rocks, of which the majority had a ferromanganese crust.
Hydrography
For the depths where P. amadou was recorded (1,960 – 3,660 m), the CTD casts registered temperatures ranging from 2.5 to 4°C, salinity values between 34.91 and 35.05 psu, and oxygen levels between 6.5 and 6.9 μg/ml-1. The casts showed an inflection point in these parameters at ∼2,500 m, where oxygen reached values of 6.8 μg/ml-1, the temperature was ∼3.25°C and salinity 34.99 psu. Hydrodynamic modeling revealed a strong influence of tides on surface and bottom currents, with a NE-SW current rotating anticlockwise over the diurnal tidal cycle. The elongated ridges extending outward from the star-shaped seamount cause high current variability. The eastern and western flanks dissipate higher energy, whereas the northern and southern spurs dissipate less energy. The distribution of sediment-covered and sediment-poor areas coincided with this energy distribution, which is observable on the ROV videos and the backscatter intensity. The summit had a variable layer of biogenic silty fine sand forming ripples aligned with the (varying) peak current velocity. Numerical modeling indicates the presence of a weak Taylor Cap on the summit of the seamount (Cooper and Spearman, 2017).
Variable Influence
The importance of the environmental variables varied across the modeling algorithms, although depth was the most influential, followed by the maximum velocity of currents, for all three (Table 2). While the RF model considered only depth and the maximum velocity of currents as important for the prediction of suitable habitats, Maxent and GAM models included all environmental variables as predictors of P. amadou. The variables slope, backscatter, eastness and northness had some effect on the probability of presence in the GAMs and Maxent, although their influence was low (Table 2).
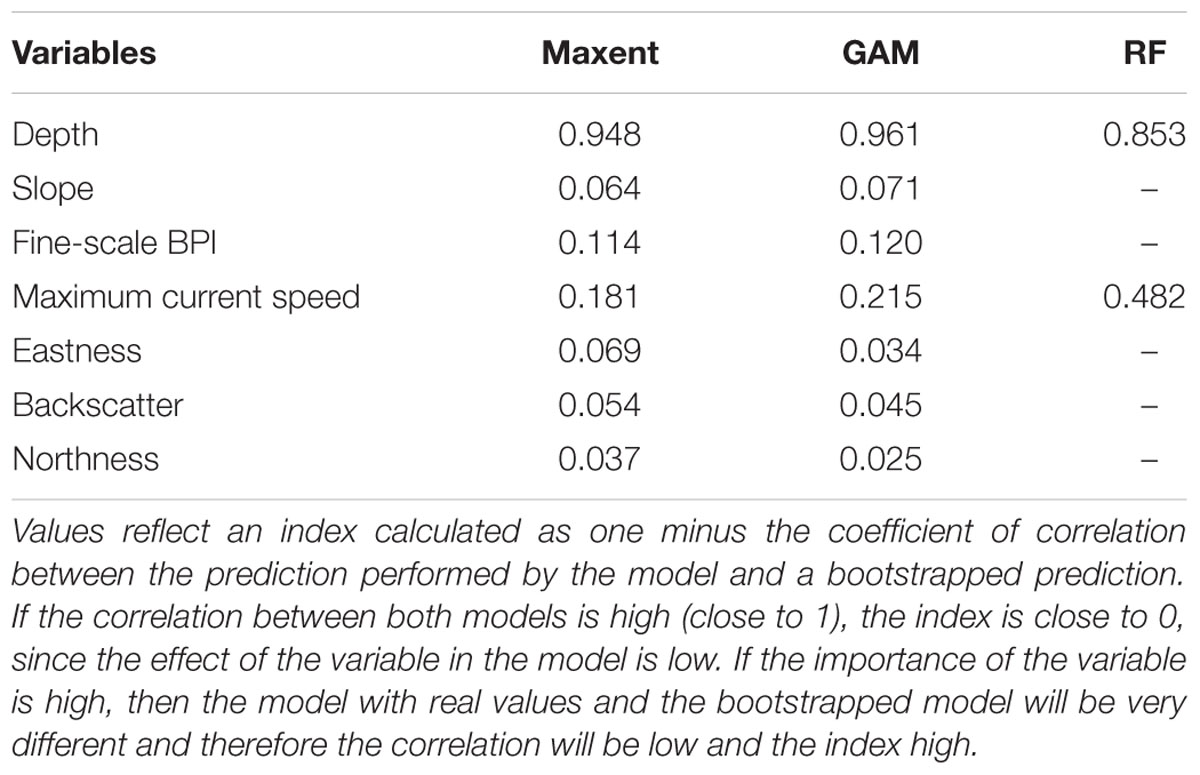
Table 2. Index of importance of each predictor variable for the GAM, Maxent and Random Forest models.
For all environmental variables, Maxent predicted higher probabilities of presence for P. amadou relative to the GAM and RF models (Figure 4). In general, Maxent, GAM and RF models showed similar response patterns in the environmental variables (depth and maximum velocity of currents) included in the three models. Modeling returned a marked bathymetric belt for the sponge in 2,000–3,500 m, with a peak of higher probably around 2,800 m, which was observed in the response curves of the three models. This trend corresponded well with the observed depth range of the occurrence records. For the variable maximum current speed, the three models showed a similar trend and predicted an increased probability of presence of P. amadou at speeds up to 0.2 m sec-1 for Maxent, 0.25 m sec-1 for GAM, and 0.28 m sec-1 for the RF model. Following similar response patterns, Maxent and GAM models predicted that P. amadou would occur on areas elevated from surrounding environments (with a peak in the probability of presence around a fine-scale BPI of 75) and with low values of slope, which followed a slightly different trend. The trend in the GAM was constantly negative with two different intensities (slightly negative from 0 to 30° and very negative for values ≥ 30°), whereas the trend for Maxent it was only negative for slope values > 20°. For the aspect variables, Maxent and GAM models predicted the highest probability of presence for values equal to 1 (northeast) and the lowest for values equal to -1 (southwest) for both variables (eastness and northness), but differed for intermediate values. Finally, P. amadou seemed to have a predisposition for hard substrata (high reflectivity values ≤-30 db), with a linear increase of backscatter values for the range from -50 to -35/30 db.
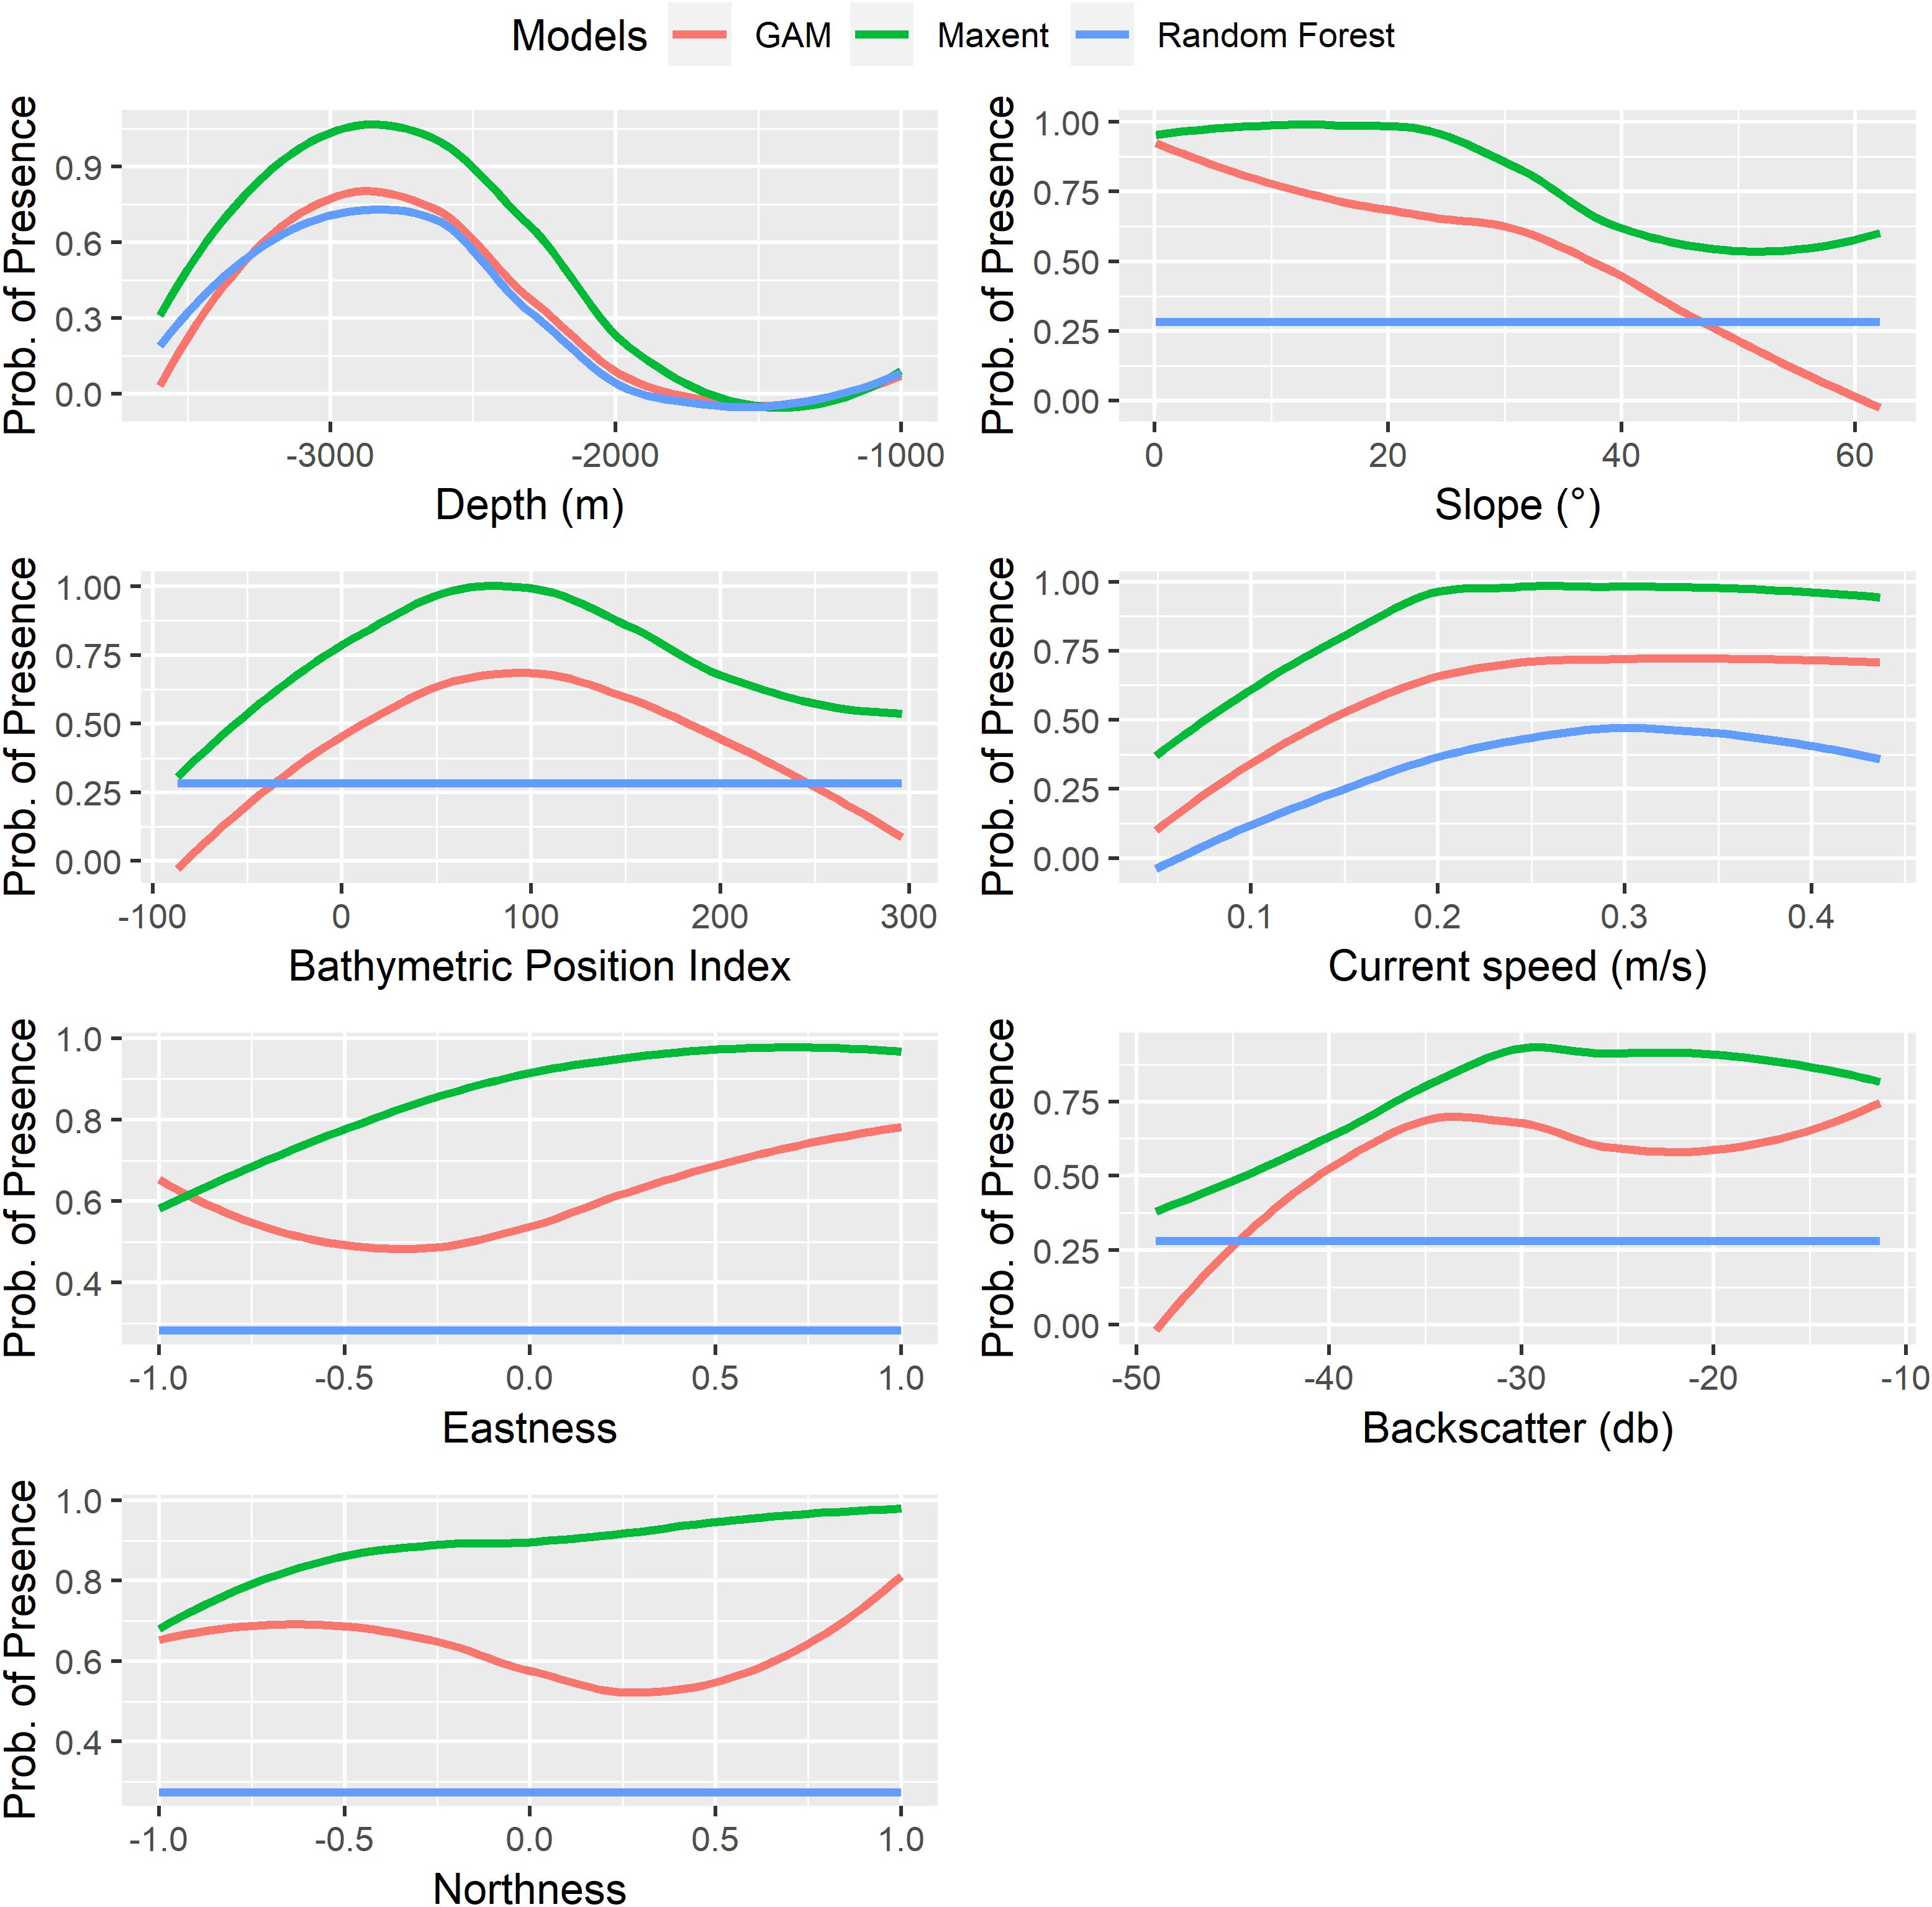
Figure 4. Response curves of the probability of presence of Poliopogon amadou for each predictor variable for the GAM, Maxent and Random Forest prediction of the probability of presence. The response curve is the dependence of the probability of the presence on one predictor variable after averaging out the effects of the other predictor variables in the model.
Comparison of Model Performance
The distribution of P. amadou was mapped using binomial GAMs, Maxent and RF models. The performance of the models was good for each measure of accuracy calculated, with high values of explained deviance, AUC, sensitivity, specificity and TSS values (Figure 5). All four models had a good ability to discriminate between areas where P. amadou was present and absent (all AUC mean values ≥ 0.8), with GAM, Maxent and Ensemble the best performers. All models showed sensitivity and specificity values in the range of 0.75 – 1.0. For sensitivity, all models had values between 0.9 and 0.95, indicating high accuracy in the prediction of correctly assigned observed presences, although GAM performed slightly worse. In contrast, specificity values—the proportion of observed absences correctly predicted—were lower between 0.7 and 0.8, with GAM being the best performer and Maxent the worst. For the TSS metric, the GAM had the highest performance with a TSS value of 0.69. The Maxent model, however, had the lowest TSS value (0.64). Post hoc Tukey’s HSD comparisons between the models for the four statistics (Tukey test; P < 0.05) did not show any significant difference between models for any of four statistics.
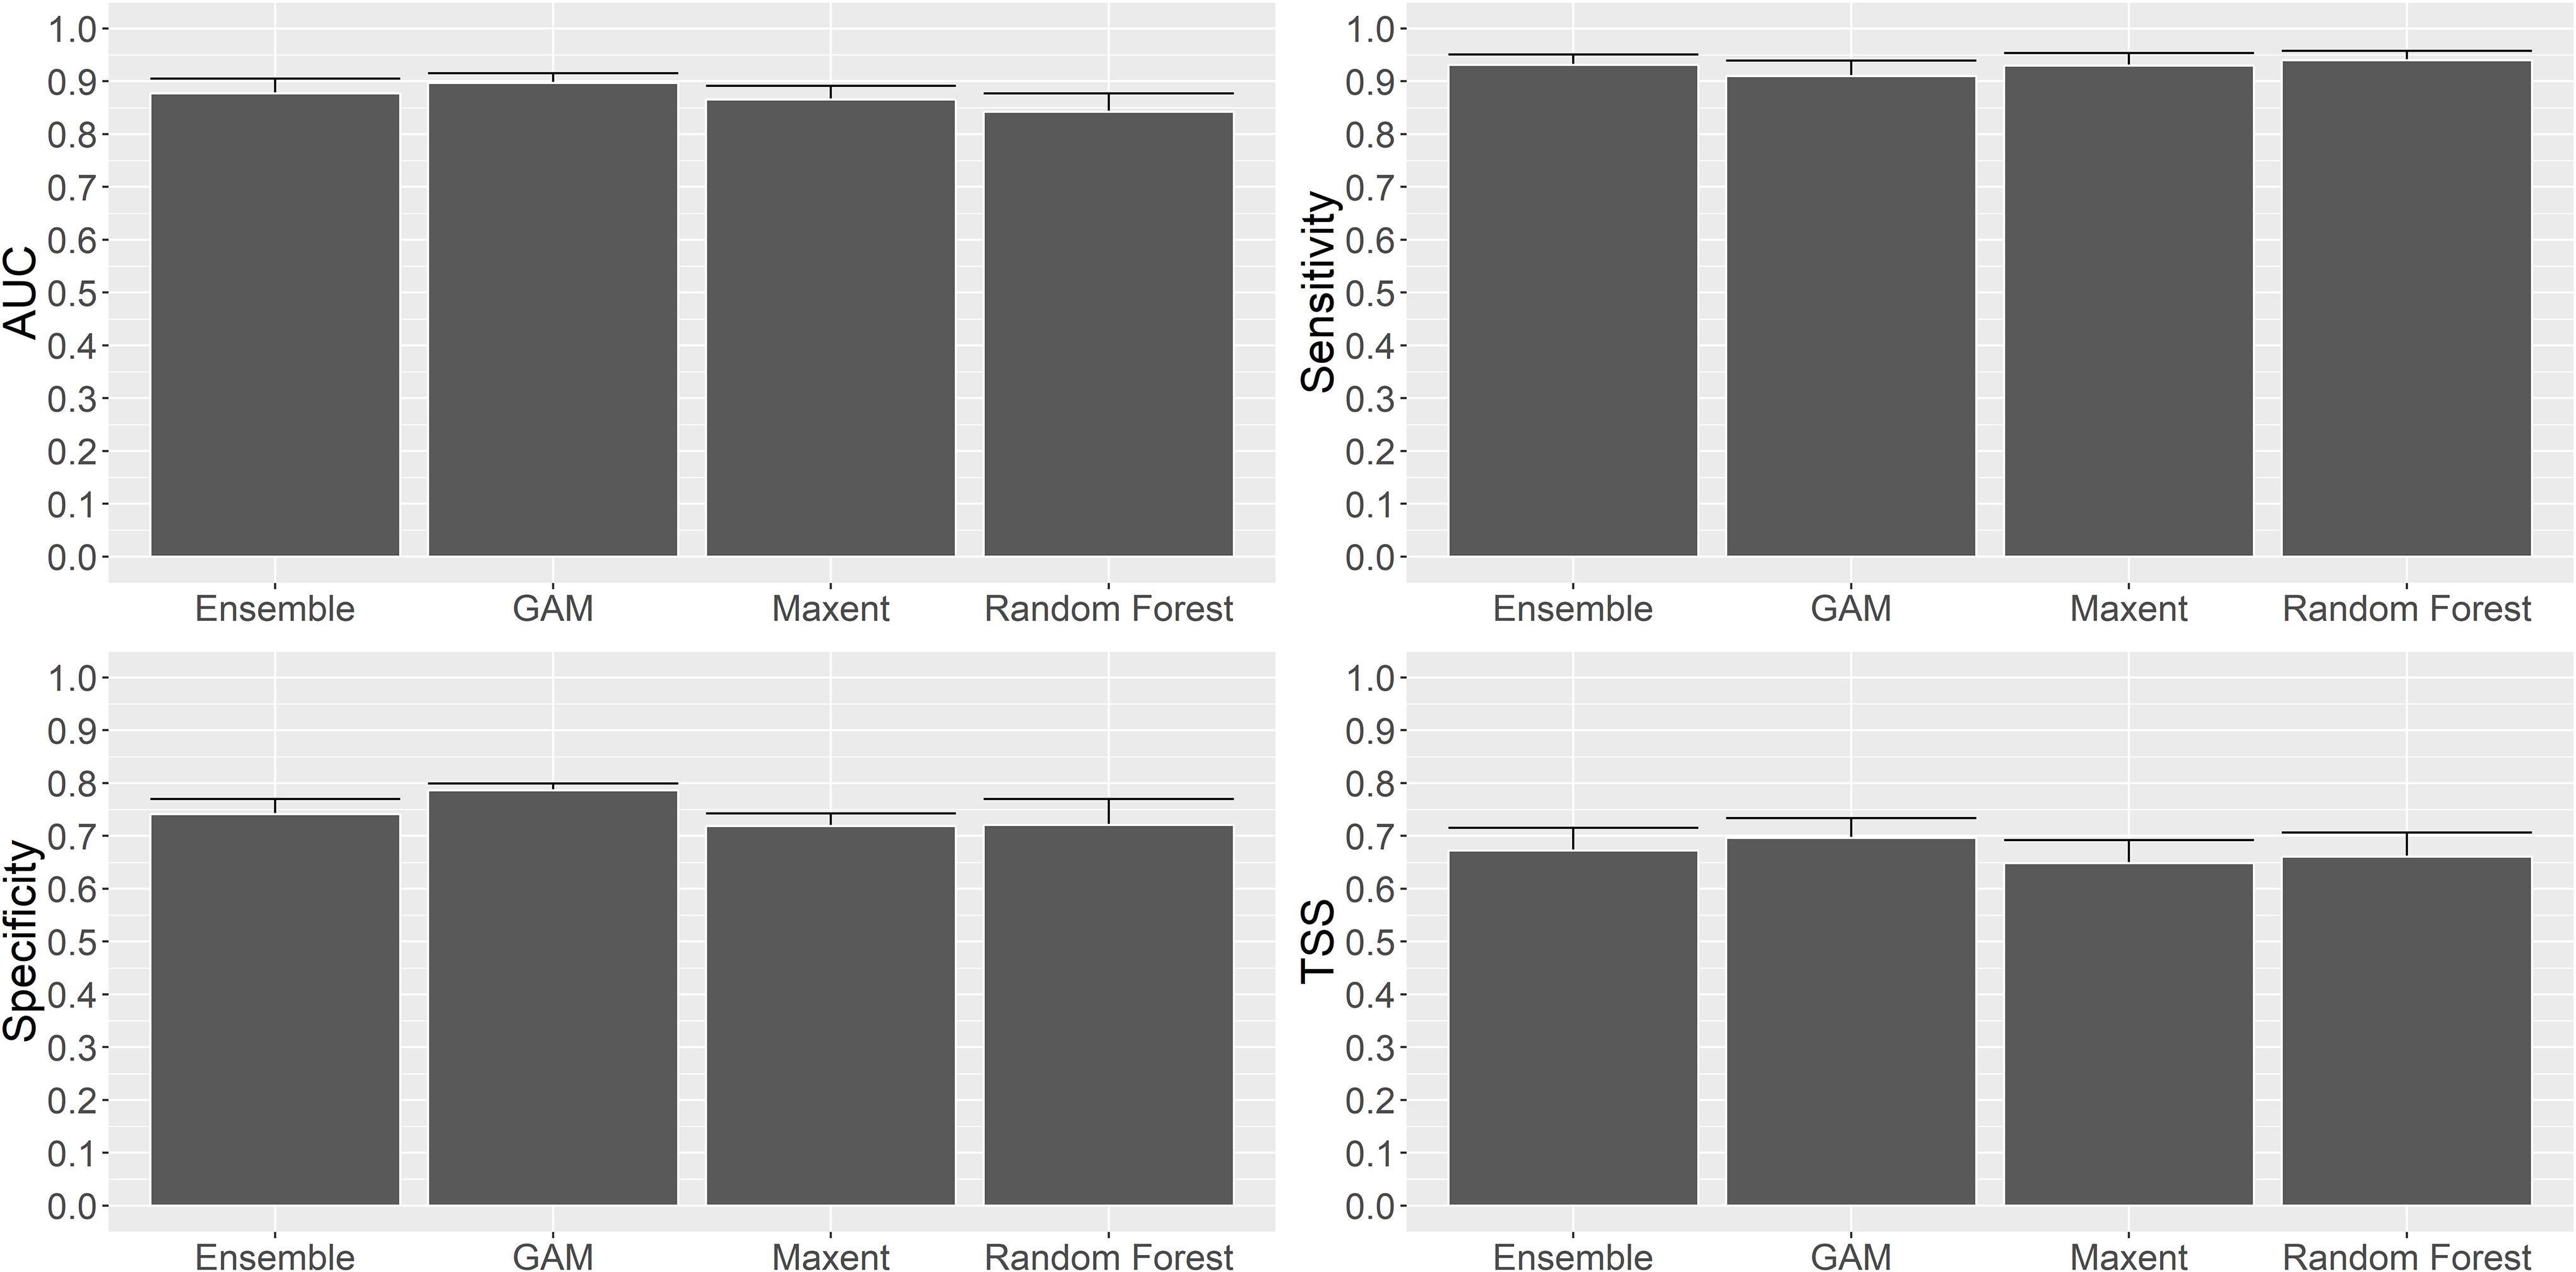
Figure 5. Comparison of performance statistics (AUC, Sensitivity, Specificity and TSS) for the Ensemble, GAM, Maxent and Random Forest models.
Predicted Species Distribution
Figure 6 shows the probability of presence for P. amadou based on GAM, Maxent and RF. Besides the bathymetric range of the distribution, the topographic variables also influenced the predicted habitat. Generally, the Maxent model predicted the distribution of suitable habitat for P. amadou to be more extensive, although two areas of high probability of occurrence were consistent across all three models. The Maxent model predicted suitable habitat along the northern, eastern, southern and western spurs of the seamount and along the NE and SE flanks, where it reflected the topography of the gullies. The GAM model predicted suitable habitats in the same areas as the Maxent model, but with lower probability of occurrence on the NE and SE flanks. Both the Maxent and GAM models displayed similar predicted distributions, as both included the same environmental variables in the model construction and exhibited similar response curves. Besides the bathymetric range of the distribution, the topographic variables also influenced the predicted habitat. In contrast, the RF model predicted suitable habitat for P. amadou along a bathymetric belt around the seamount, but only with high probability of occurrence on marked contours on the eastern and western spurs, similarly to the GAM prediction. This predicted distribution reflected the distribution of the environmental variables included in the model, namely depth and maximum current speed. At ∼3,000 m, a continuous band of less suitable habitat around the seamount marks the lower depth limit of the predicted suitable habitat.
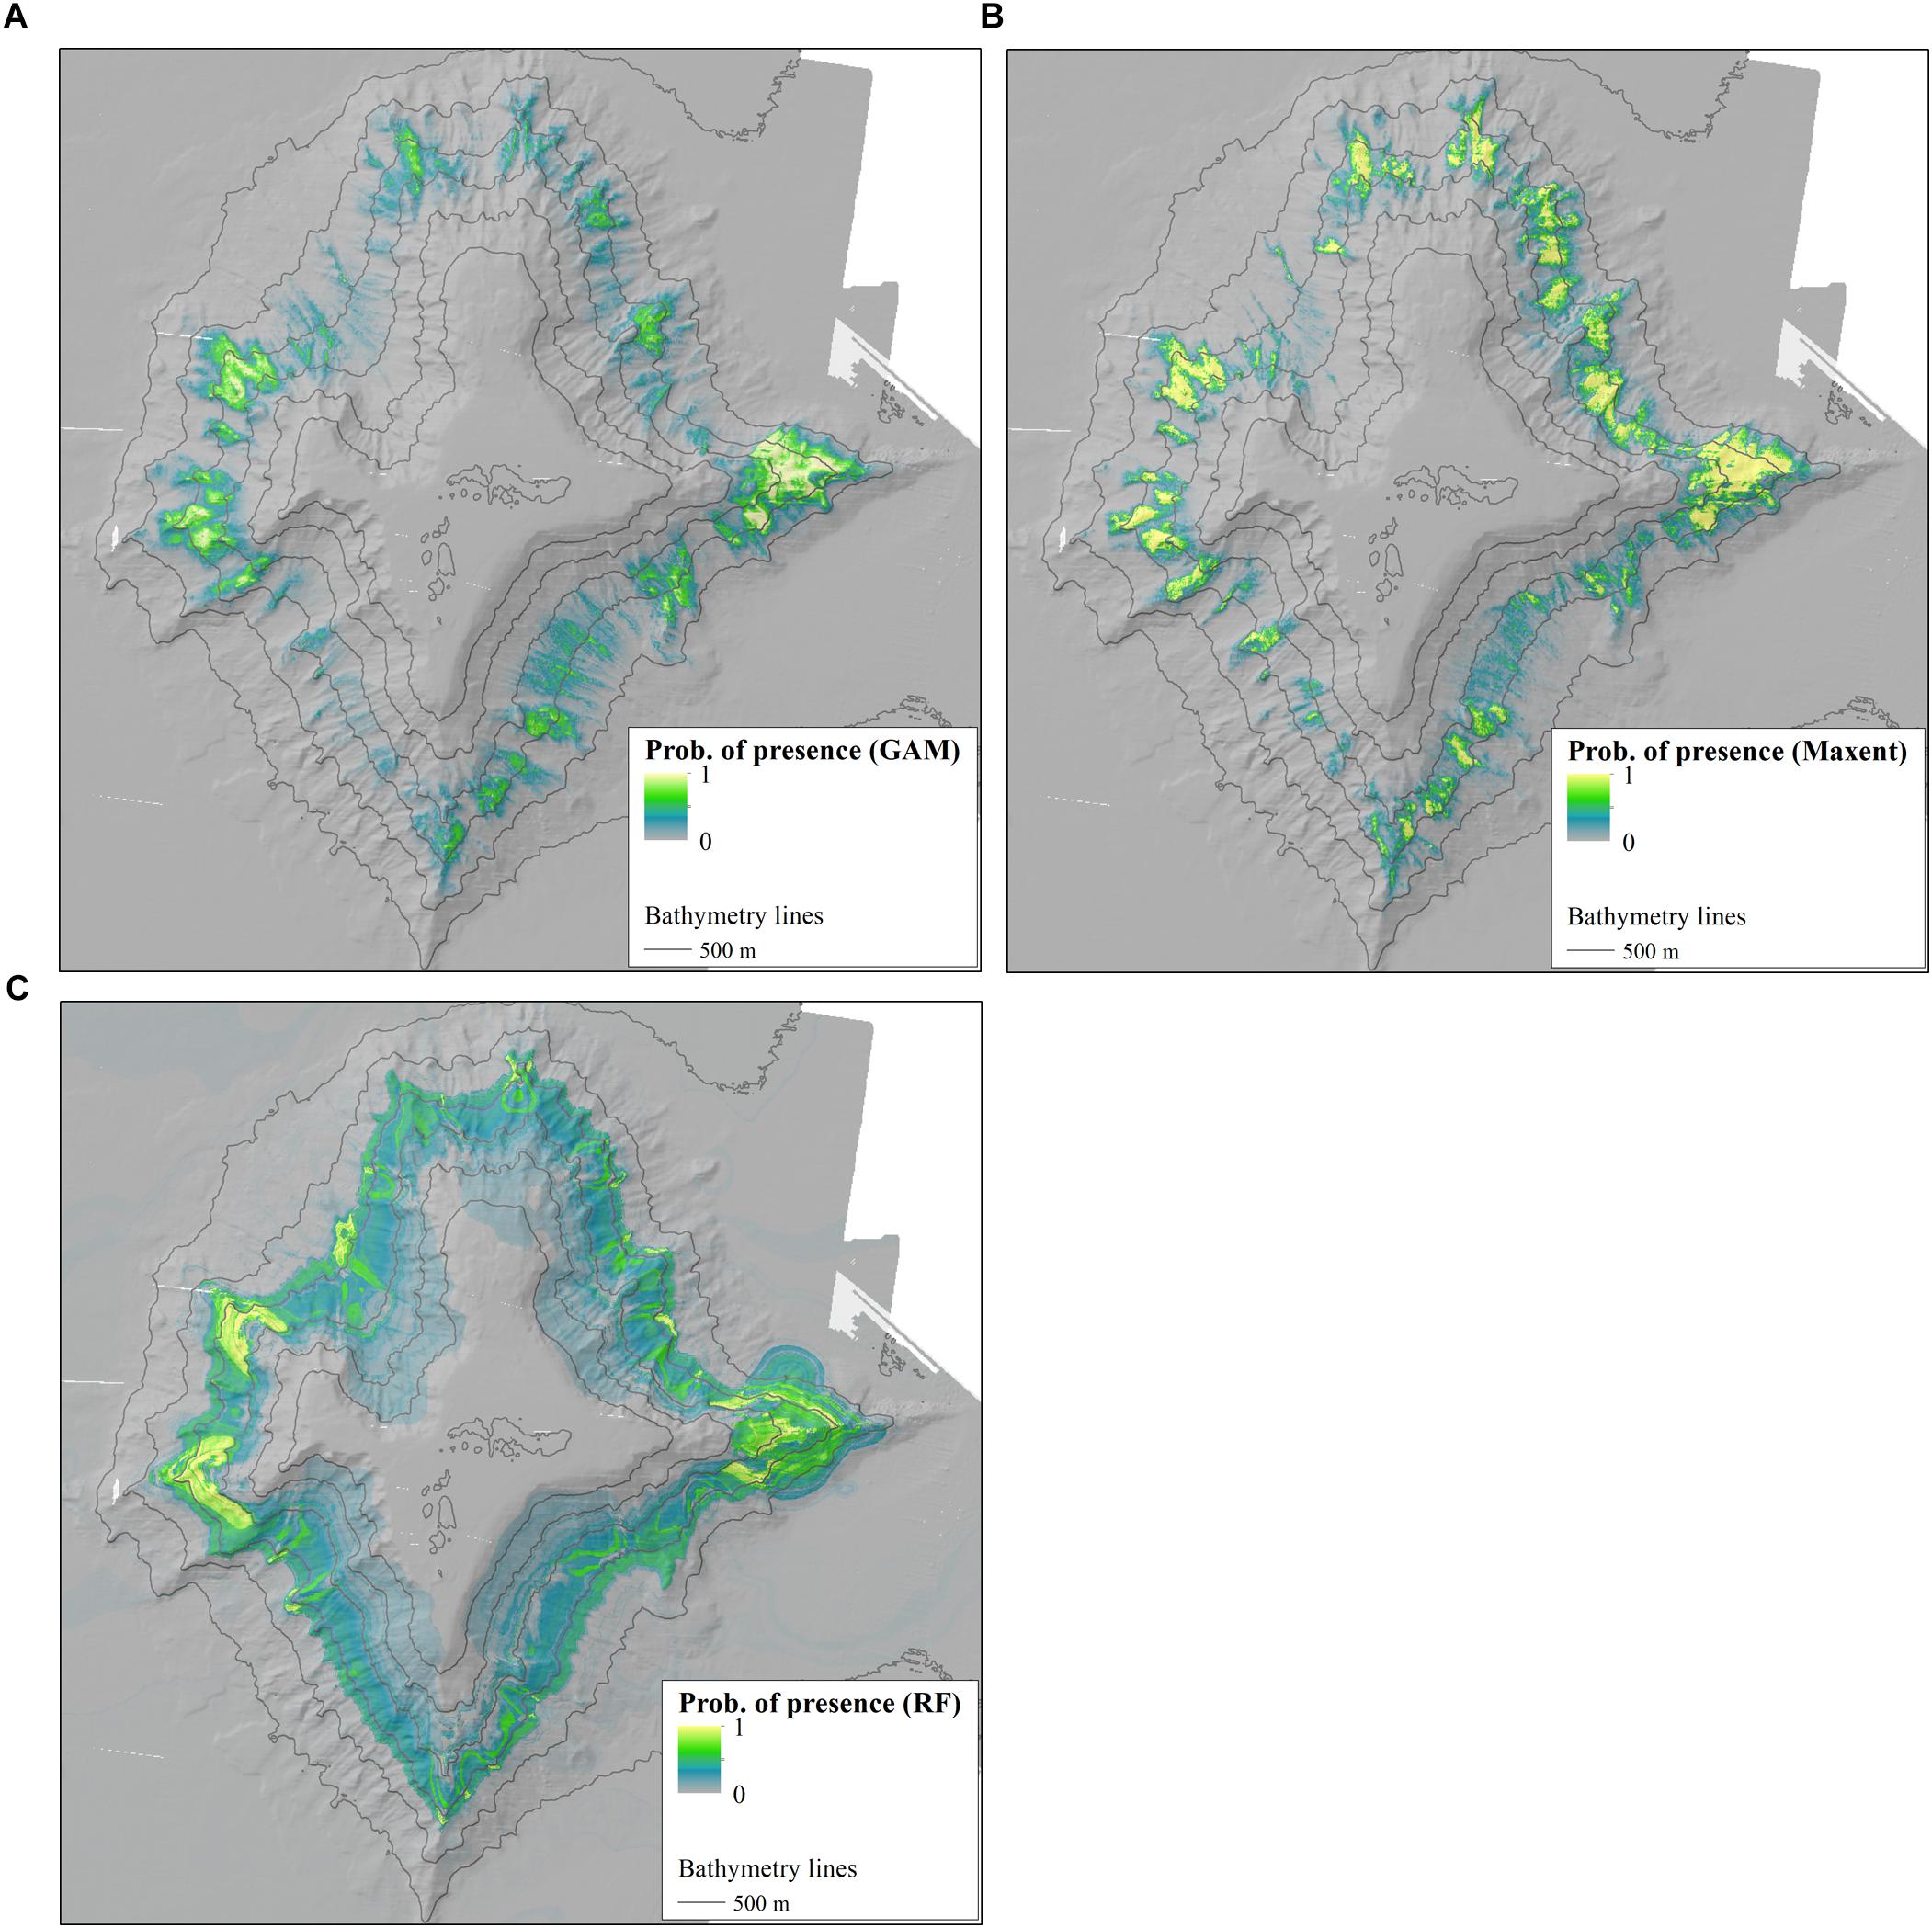
Figure 6. Distribution maps of Poliopogon amadou using (A) GAM, (B) Maxent, and (C) Random Forest models. The figures show the probability of presence of the sponge on the Tropic Seamount and the seamount bathymetry.
The predicted suitable habitat by the ensemble model reflected the average of all three models weighted accordingly by the results of the evaluation process (Figure 7A). Poliopogon amadou was widely distributed mainly on the eastern and western ridges and less concentrated on the northern spur, NE and SE flanks and the southern spur. Although the bathymetric imprint of the RF model was observed on the NW and SW flanks of the seamount, the probability of presence on these areas was low. The spatial patterns of high-modeled uncertainty corresponded to the main areas predicted as highly suitable habitat on the eastern and western spurs, together with a bathymetric belt of high uncertainty across the seamount (except for a patch on the SE flank) that reflected again the RF model imprint (Figure 7B).
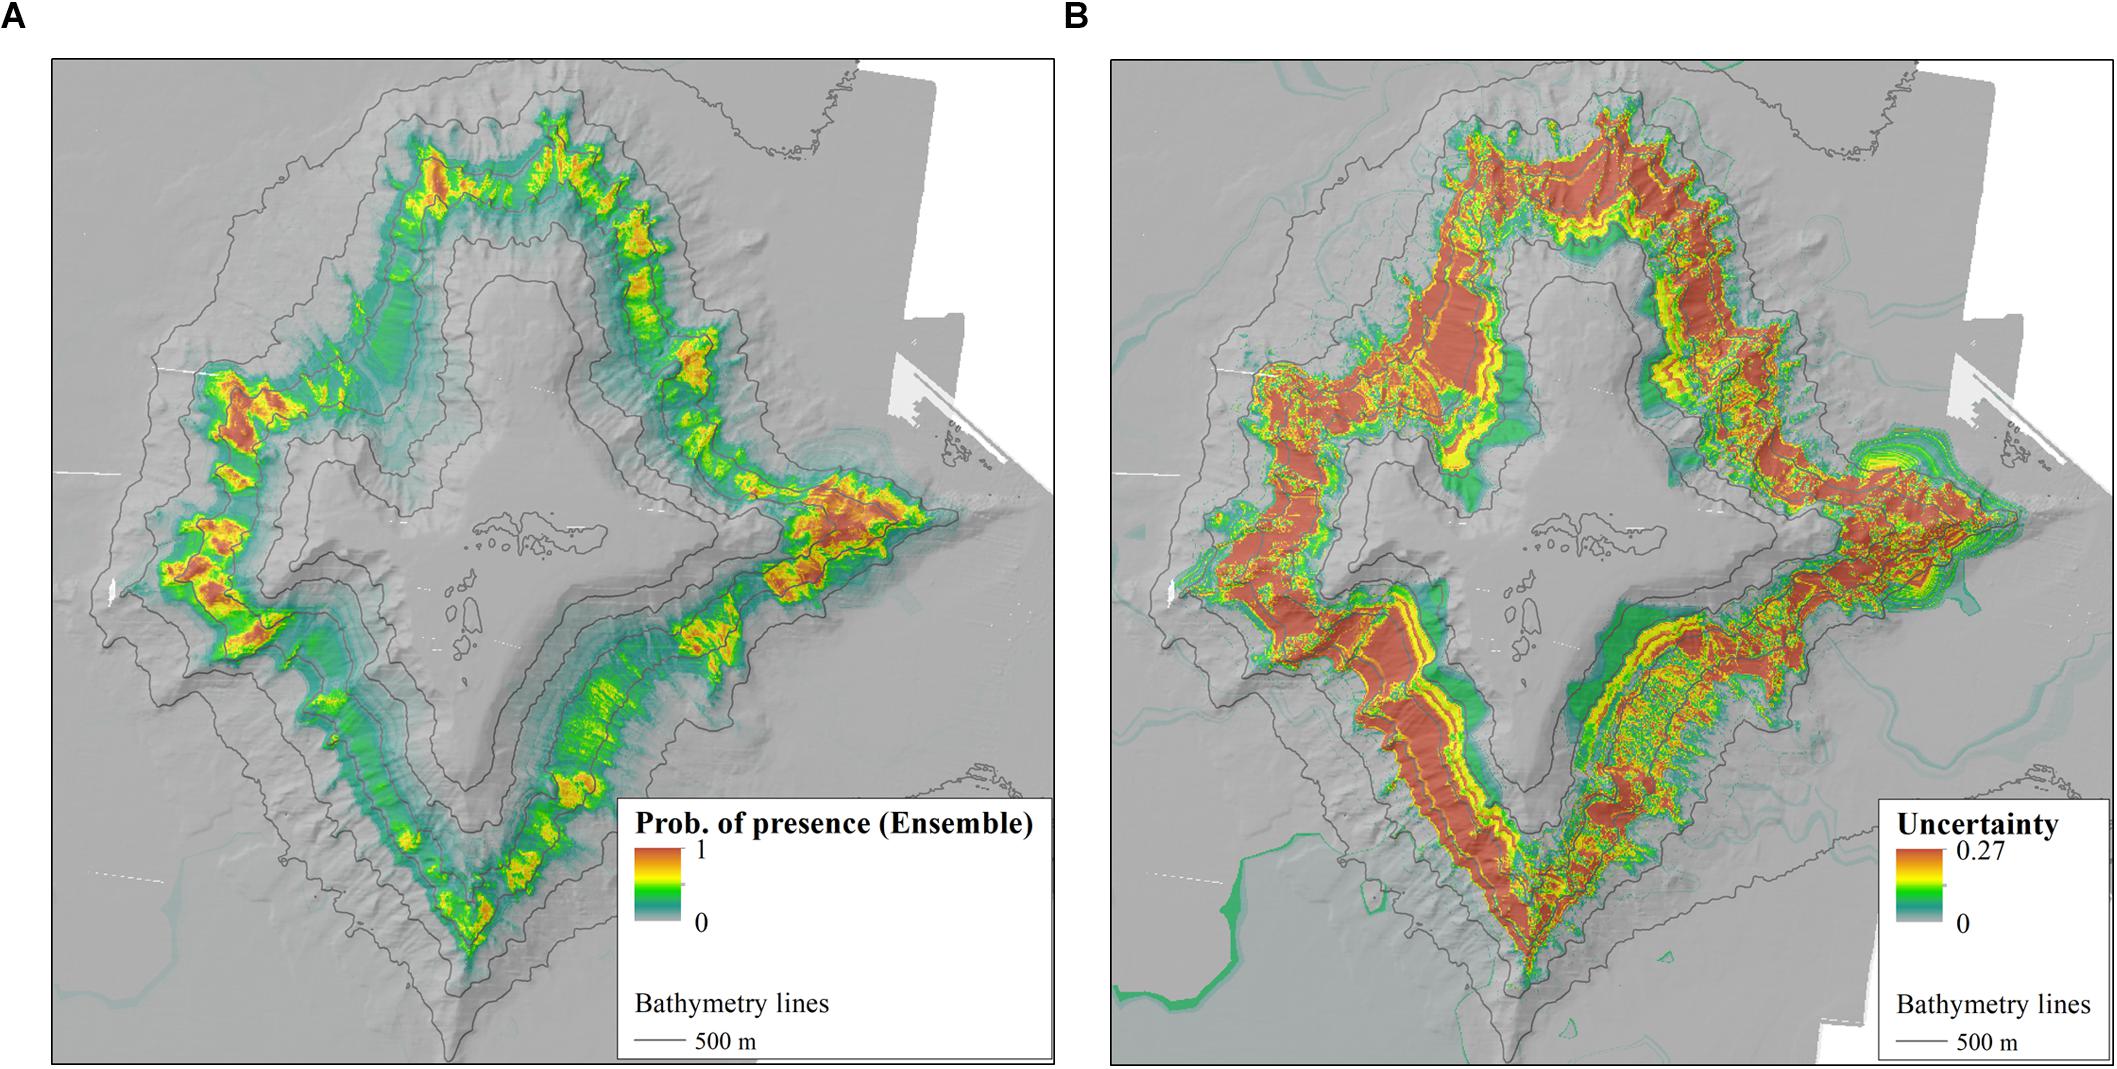
Figure 7. Prediction of Poliopogon amadou presence for the ensemble distribution model (A) and (B) uncertainty (CV) for the ensemble distribution model.
Discussion
The Tropic Seamount harbors diverse and near pristine benthic communities that include several VMEs such as reef-building coral species Solenosmilia variabilis, several species of octocorals and black corals that formed diverse animal forests, crinoid fields, and sponge grounds. This diversity is most likely related to the specific oceanographic characteristics and hydrography of the Tropic Seamount. The phytoplankton-enriched waters from the Sahara upwelling events extend offshore reaching the Tropic Seamount (Hernández-Guerra et al., 2005), that is fed by the iron-rich dust coming from the Sahara desert making the NW waters off Morocco a very productive oceanographic area (Henderiks, 2001). The existence of a Taylor Cap on the seamount may be affecting the distribution of particulate organic carbon keeping organic matter suspended and circulated within certain depth ranges (Clark et al., 2010).
In this study we focused on an important VME, the sponge grounds formed by P. amadou, to produce predicted DMs that could have implications for High Seas conservation, and support the designation of the Tropic Seamount as an EBSA with extensive coverage of a diverse set of pristine and, in the case of P. amadou, biogeographically unique VMEs. Deep-sea sponge grounds have international conservation and management significance because of their low resilience. These habitats and their associated communities are particularly vulnerable to anthropogenic impacts such as fishing and deep-sea mining due to their slow growth (Hogg et al., 2010), proving their recovery very slow or inexistent (Klitgaard, 1995). However, the conditions responsible for the formation of sponge grounds remain poorly understood, with the exception of a few studies in the northwest Atlantic (e.g., Beazley et al., 2018) and the Antarctic (e.g., Gutt and Koltun, 1995; Dayton et al., 2019), where different environmental and physical factors play a role in their distribution and persistence. Our work adds to the growing literature on the potential use of high-resolution DMs for deep-sea conservation and management of VMEs, and is the first to investigate the environmental drivers of the distribution of a biogeographically unique VME formed by P. amadou.
Environmental Drivers
All three DMs included depth as the most important explanatory variable. Poliopogon amadou occurred in a wide bathymetric range across the seamount, from 1,960 to 3,660 m depth, but with a marked preference for 2,500 and 3,000 m depth, as confirmed by the presence of more sponges in ROV images from these depths. This finding agrees with previous work. Xavier et al. (2015) found P. amadou aggregations at the Great Meteor Seamount and collected specimens between depths of 2,675 – 2,765 m. They collected another specimen at the Closs seamount at 2,761 m. Similarly, and at the closest location to our study site, the P. amadou holotype was collected at 2,790 m depth southwest of the Canary Islands (station 3, 25°24′ N 20°14′ W) during the HMS Challenger expedition (Thomson, 1878). As suggested by Xavier et al. (2015), the similarity in depth ranges between these records supports the idea that P. amadou occurs in bathymetrically constrained bands. However, depth is a proxy for other environmental variables including temperature, salinity, oxygen, food availability, pressure, near-bottom current speed and sediment type (Harris and Whiteway, 2009). In this study, available data from the CTD casts included temperature, salinity and oxygen. Although these variables were not suitable to be included in the model because of their high level of correlation with depth and higher level of uncertainty (only 36 points for the whole seamount), they can be used to help explain the observed depth range of P. amadou on the Tropic Seamount. For instance, the predicted distribution of the sponge grounds of the hexactinellid Vazella pourtalesi on the Scotian Shelf, off Nova Scotia, Canada, was driven by minimum bottom temperature. The sponge grounds occurred in a warm and saline water mass with low oxygen, but high in nutrient concentration, Warm Slope Water (Beazley et al., 2018). In a similar way, Howell et al. (2016) also found bottom temperature as the second most important variable (after depth) explaining the distribution of Pheronema carpenteri in the North Atlantic. Although the depth range was well defined by the DMs on the Tropic Seamount and agreed with the depth distribution observed in the species in surrounding areas, it is not possible to establish a depth limit for P. amadou across the Atlantic given the proxy nature of this variable and the few records in the literature. The variable nature of the depth range for benthic species is well known and it has been previously described for other species (e.g., Dullo et al., 2008; Radice et al., 2016).
The bathymetric range where P. amadou was more frequent (2,500 – 3,000 m) corresponded with an inflection point in temperature, salinity and oxygen across the seamount. The temperature and salinity in that band ranged between 2.75 and 3.25°C and 34.94 and 35.04 psu, respectively. Dissolved oxygen ranged between 6.8 and 6.9 μg ml-1. This band matches the intermediate level of the Upper NADW (2.5°C, 34.5 psu, O2 6.7–7 μg ml-1) that seems to be well developed at approximately 2,000 m depth (Hernández-Guerra et al., 2005). This water mass, together with the hydrography of the area, seem to be controlling the distribution of P. amadou in the Tropic Seamount. To date there are no studies characterizing the water masses where P. amadou occurs, however, observations from the Vema Fracture Zone at 2,940–2,230 m occurred inside the NADW too, with temperatures ranging between 2.7 and 3.3°C and salinity of 34.9 psu (L. Victorero, personal communication). If the general oceanographic conditions of seamounts are comparable, these results may be extrapolated to similar seamounts occurring along the path of the NADW mass, as suggested by Roberts et al. (2018) for the deep-sea sponge grounds found on the Schultz Massif Seamount of the Arctic Mid-Ocean Ridge.
Maximum speed of currents at the seafloor was the next most important environmental predictor in the three DMs. Sponges are normally found where local currents enhance food supply but are not able to withstand direct exposure to very strong currents (Rice et al., 1990). As non-selective filter feeders, large quantities of sediment in the water column can clog a sponge’s filtering apparatus (Hogg et al., 2010; Tjensvoll et al., 2013). This agrees with the observed response curves, which show increased probability of sponge presence at current speeds ≤ 0.2–0.28 m sec-1, but no effect at greater speeds. The reason for the lack of a negative response at the highest current speeds could be explained because this value is not exceptionally high (especially since they are maximum and not mean current speeds).
Fine-scale Bathymetric Position Index, slope, aspect and backscatter were the other variables included in the GAM and Maxent models. Substrate type is thought to influence the distribution of sponges by facilitating larval settlement (Knudby et al., 2013). However, the biological relevance of backscatter intensity in this study was minimum. This could be due to the fact that most of the area of the seamount was hard substrate, with lower reflectivity values on the southern ridge, and consequently not a discriminant factor in the model. The homogeneity in the backscatter intensity is probably because these data cannot distinguish between clean hard substrate and hard substrate covered by a thin layer of sediment (<50 cm, Lo Iacono et al., 2008), which reduces its usefulness in DMs approaches in such environments. BPI (i.e., the relative elevation of the seabed in comparison to neighboring areas) could partially resolve this limitation, as areas with high BPI generally correspond to regions of hard substrate; however, the importance of this variable in the final model is uncertain. The aspect of the seabed, in terms of northness and eastness, predicted the highest probability of presence of P. amadou on the northern, eastern and western slopes, which coincided with the direction of the modeled currents on the seamount. In the ROV images, the specimens could be seen oriented in one direction, probably reflecting both the need to respond to flow and grow in an area that allowed maximization of the suspended resource.
Model Comparison
The three models used to predict the distribution of P. amadou showed good performance, with no significant differences between them for any of the statistics analyzed. The three models predicted the highest probability of presence of the sponge on the eastern and western ridges and certain patches on the northern spur. The selection of the variables in the model construction was the main driver of the differences found among the models, namely on the areas where data were not available. Random Forest was built using only two variables (depth and maximum current speed), whereas GAM and Maxent also included the rest of the environmental variables (backscatter, fine-scale BPI, slope, eastness and northness). The inclusion of these other variables in the model construction of GAM and Maxent allowed us to take into account microscale effects related to the geomorphology of the seabed. This resulted in less-broad predictions across the depth band suitable for P. amadou than the Random Forest probabilities. The differences are especially clear in the southwest slope of the seamount, mainly unsuitable for the GAM and Maxent prediction, but suitable for Random Forest. Despite the inclusion of these variables in the construction of the models, GAM and Maxent did not show statistically significant differences in any of the evaluation statistics and therefore the RF model was retained for the ensemble forecast, although its impact in the final ensemble model was weighted by the results of the evaluation process.
The library used in the variable selection for the RF model could have driven the main differences between the models. The library ‘VSURF’ for RF models selected only depth and currents as predictors, and this was reflected in the output of the RF model which displayed a continuous bathymetric belt of probability of presence for P. amadou on the seamount. Other methodologies for RF variable selection are available and it would be interesting to see how the selection process results would differ. This highlights the usefulness of ensemble models, which average all model outputs and so take into account uncertainties and performance of different algorithms. The resulting ensemble model is thought to provide a more robust predicted distribution of P. amadou than any of the individual models and thus have clearer value for spatial management measures. The ensemble model maintains areas of high probability of presence in the same areas predicted by the individual models. However, it also maintains high the probability of presence of P. amadou across its suitable bathymetric range regardless of slope orientation, which is an effect of the inclusion of Random Forest in the model.
The uncertainty of the ensemble model was higher along a bathymetric belt from approximately 2,000 to 2,800 m depth across the seamount, with a patch of lower uncertainty on the SE flank. This depth is within the range where the highest probability of P. amadou occurring is predicted (2,500 – 3,000 m) and where the maximum velocity of currents at the seabed is lowest. Model uncertainty is difficult to estimate, but the bootstrap procedures applied to the GAM, Maxent and RF models provided a measure of internal consistency across the models (Anderson et al., 2016). Uncertainty maps are a key resource when applying predictions of distribution models to management measures (Vierod et al., 2014), as they can incorporate some level of confidence to the predictions and management actions (Anderson et al., 2016). Sources of uncertainty not accounted for in our models might be other key driving factors of habitat suitability for the sponge including oceanographic variables such as silicate, phosphate and nitrate availability, and POC flux (Howell et al., 2016).
Habitat Importance and Implications for Conservation
The sponge grounds of P. amadou were one of the most frequent and extensive VMEs observed on the Tropic Seamount, with different body sizes (from approximately 5 cm up to 55 cm) indicating a stable population with on-going recruitment. Although we did not model abundance of the sponge directly, it has been demonstrated that, in general, the outputs of DMs can be used as proxies for abundance (Weber et al., 2017). In this study we modeled the probability of presence to find a sponge in a ROV picture for each grid cell, a probability which is directly correlated with the abundance of the sponge inside a grid cell. The higher the abundance in the grid cell, the higher the probability to find a presence. This is especially accurate for Maxent models since, as explained by Phillips et al. (2017), “the interpretation of Maxent as an inhomogeneous Poisson process allows Maxent’s ‘raw’ output format to be used directly as a model of relative abundance.” Therefore, it is possible to predict that the highest concentrations of P. amadou, and therefore of sponge grounds, will be in modeled areas of highest probability of presence.
The distribution models presented here are relevant to the Fishery Committee for the Eastern Atlantic (CECAF), which is the Regional Fishery Body responsible for the identification, description and mapping of VMEs or indicator species in their regulatory areas in ABNJs. By mapping and understanding the ecological variables that are related with the VME indicator species in the CECAF area, we are able to provide expert advice on the occurrence of deep-sea sponge grounds and other VME indicator taxa in efforts to limit anthropogenic threats from future marine resource exploitation. The depths of most VME indicator taxa on Tropic Seamount make these seamount habitats de facto refuges from bottom fisheries impacts, as supported by a lack of evidence for any contact with bottom-fishing gear from the ROV images and from fishing records across the wider CECAF area (Fao Fiaf/R1184, 2016).
Tropic Seamount could in future become vulnerable to other types of deep-water exploitation. The latest survey on the area by the MarineE-Tech project found deposits of ferromanganese crusts at all depths. In particular, the thickest crusts (<20 cm) are located at the greatest depths of the seamount (3,000 – 4,000 m) on the eastern and western ridges, while the summit generally hosts the thinnest crusts (Murton et al., 2017). These crusts hold significant resources of tellurium and cobalt, making this underwater feature of interest to future deep-sea mining. Specimens of P. amadou were found only on hard substrates corresponding to rocks, of which the majority had a ferromanganese crust. Deep-sea mining will very likely cause some extent of biodiversity loss (Van Dover et al., 2017), and much recent research has addressed this conflict between industry and conservation (e.g., Shirayama et al., 2017; Dunn et al., 2018; Van Dover et al., 2018).
The ISA, together with new legally binding policy instruments for BBNJ (Long and Chaves, 2015), can help address these threats and sustainably manage VMEs on Tropic Seamount if a robust evidence base on VME occurrence can be constructed based on ground-truthed and predictive models. The present study offers the first biological study to ground-truth the occurrence of potential VMEs on Tropic Seamount, alongside predictive models to increase the spatial coverage beyond ROV and AUV surveys. Predicted habitat for P. amadou was found to be favorable on the deep flanks of the seamount within a very narrow oceanographic regime. Thus, any deep-sea mining operation on these flanks should consider sediment deposition throughout the water column and potential for sediment plumes to spread from adjacent non-flank areas including those on the shallower summit. Other VME taxa observed on Tropic Seamount, such as coral gardens and patches of S. variabilis are also likely to provide important ecosystem functions on the seamount, indeed one type of coral garden hosted a nursery ground for deep-sea squid: here too, predictive species and habitat models could greatly aid in building the evidence base for VME occurrences.
Combined with the multiple ground-truthed records of VME taxa, new classes of predictive habitat models may provide powerful new lines of evidence to help sustainably manage seamounts in the High Seas from impacts of resource exploitation as these new data can help verify VME occurrences and/or identify marine protected areas (MPAs), for which there are some management and avoidance measures for industries to take. Additionally, the high deep-sea biodiversity cataloged in the present study and predicted spatial extent of Poliopogon sponge grounds, the importance of coral gardens for early life history stages of deep-sea squid, and the unique biogeographic affinities of some VME taxa are now being used to build a case to nominate Tropic Seamount as a candidate EBSA (CBD, 2008) and as a large VME itself (Watling and Auster, 2017). Operationalizing EBSAs as an additional management consideration for industry in the same way that VMEs and MPAs do is still its infancy, but first a robust evidence base for why an area meets EBSA criteria is critical to lay these foundations.
Author Contributions
BR-S, JG-I, and L-AH conceived the biological study. BM was the chief scientist of the MarineE-Tech project and designed the program, led the cruise and collected the data. IY provided images and survey data. LV directed the collection of biological observations and voucher specimens. JS provided data from the hydrodynamic model. BR-S and JC analyzed image data. GK helped with sponge classification. JX, MC-S, ÍS, and CM provided taxonomic expertise on the identification of species from images. BR-S and JG-I undertook the modeling and interpreted the data. BR-S led the writing, and drafted text for the manuscript. JG-I, JX, LV, ÍS, CM, MC-S, and JS contributed draft text to the manuscript. All authors revised and approved the final version of the manuscript.
Funding
Thanks are due to the NERC funded MarineE-Tech project (ref: NE/MO1151/1) and the crew of the RRS James Cook cruise JC142 for the data and samples. BR-S would like to thank T. Morato at IMAR-UAzores for facilitating a course on SDMs that allowed this study to be developed. This study is a contribution to the ATLAS project with funding to BR-S, JG-I, L-AH, MC-S, and JR provided from the European Union’s Horizon 2020 Research and Innovation Program under grant agreement no. 678760. JX research is funded by the H2020 EU Framework Program for Research and Innovation Project SponGES under grant agreement no. 679849. This output reflects only the authors’ views and the European Union cannot be held responsible for any use that may be made of the information contained therein.
Conflict of Interest Statement
The authors declare that the research was conducted in the absence of any commercial or financial relationships that could be construed as a potential conflict of interest.
References
Allouche, O., Tsoar, A., and Kadmon, R. (2006). Assessing the accuracy of species distribution models: prevalence, kappa and the true. Source J. Appl. Ecol. 43, 1223–1232. doi: 10.1111/j.1365-2664.2006.01214.x
Almón, B., Arcos, J. M., Martín, V., Pantoja, J., Consuegra, E., Martín Sosa, P., et al. (2014). Banco de la Concepción. Áreas de estudio del proyecto Life+ Indemares. Available at: www.indemares.es (accessed December 10, 2018)
Álvarez, H., Perry, A. L., Blanco, J., and Aguilar, R. (2016). Expedición 2014 ‘Atlantic Seamounts’. El Hierro y Montañas Submarinas. Available at: https://eu.oceana.org/sites/default/files/oceana_el_hierro_y_ montanas_submarinas_expedicion_2014.pdf (accessed December 10, 2018).
Anderson, O. F., Guinotte, J. M., Rowden, A. A., Tracey, D. M., Mackay, K. A., and Clark, M. R. (2016). Habitat suitability models for predicting the occurrence of vulnerable marine ecosystems in the seas around New Zealand. Deep Sea Res. Part I Oceanogr. Res. Pap. 115, 265–292. doi: 10.1016/J.DSR.2016.07.006
Araújo, M. B., and New, M. (2007). Ensemble forecasting of species distributions. Trends Ecol. Evol. 22, 42–47. doi: 10.1016/J.TREE.2006.09.010
Barthel, D., Tendal, O. S., and Thiel, H. (1996). A wandering population of the hexactineliid sponge pheronema carpenteri on the continental slope off morocco. Northwest Africa. Mar. Ecol. 17, 603–616. doi: 10.1111/j.1439-0485.1996.tb00420.x
Barton, K. (2018). MuMIn: Multi-Model Inference. R Package Version 1.40.4. Available at: https://cran.r-project.org/web/packages/MuMIn/MuMIn.pdf (accessed October 11, 2018).
Bashmachnikov, I., Nascimento,Â, Neves, F., Menezes, T., and Koldunov, N. V. (2015). Distribution of intermediate water masses in the subtropical northeast Atlantic. Ocean Sci. 11, 803–827. doi: 10.5194/os-11-803-2015
Beazley, L., Kenchington, E., Yashayaev, I., and Murillo, F. J. (2015). Drivers of epibenthic megafaunal composition in the sponge grounds of the sackville spur, northwest Atlantic. Deep Sea Res. Part I Oceanogr. Res. Pap. 98, 102–114. doi: 10.1016/J.DSR.2014.11.016
Beazley, L., Wang, Z., Kenchington, E., Yashayaev, I., Rapp, H. T., Xavier, J. R., et al. (2018). Predicted distribution of the glass sponge vazella pourtalesi on the scotian shelf and its persistence in the face of climatic variability. PLoS One 13:e0205505. doi: 10.1371/journal.pone.0205505
Beazley, L. I., Kenchington, E. L., Murillo, F. J., Sacau, M., and del, M. (2013). Deep-sea sponge grounds enhance diversity and abundance of epibenthic megafauna in the Northwest Atlantic. ICES J. Mar. Sci. 70, 1471–1490. doi: 10.1093/icesjms/fst124
Bowerbank, J. S. (1862). On the anatomy and physiology of the spongiadae. part iii on the generic characters, the specific characters, and on the method of examination. Philos. Trans. R. Soc. 152, 1087–1135 doi: 10.1098/rstl.1862.0044
Brito, A., and Ocanña, O. (2004). Corales de las Islas Canarias. Available at: https://www.casadellibro.com/libro-corales-de-las-islas-canarias/9788487931673/1011260 (accessed December 10, 2018)
Brooke, G. (1889). Report on the Antipatharia. Available at: http://direct.biostor.org/reference/81172 (accessed December 10, 2018)
Bullimore, R. D., Foster, N. L., and Howell, K. L. (2013). Coral-characterized benthic assemblages of the deep Northeast Atlantic: defining coral gardens; to support future habitat mapping efforts. ICES J. Mar. Sci. 70, 511–522. doi: 10.1093/icesjms/fss195
Cárdenas, P., and Rapp, H. T. (2015). Demosponges from the northern mid-atlantic ridge shed more light on the diversity and biogeography of North Atlantic deep-sea sponges. J. Mar. Biol. Assoc. U. K. 95, 1475–1516. doi: 10.1017/S0025315415000983
Carpenter, P. H. (1881). Preliminary report on the comatulae. Bull. Mus. Comp. Zool. 9, 1–20, 1 plate.
Carpenter, P. (1884). On the crinoidea of the north atlantic between gibraltar and the faeroe islands. Proc. R. Soc. Edinburgh 12, 353–380. doi: 10.1017/s037016460000078x
Carpenter, P. H. (1888). Report on the Crinoidea Collected During the Voyage of H.M.S. Challenger, During the Years 1873-1876. Part II. The Comatulae. Available at: http://www.marinespecies.org/aphia.php?p=sourcedetails&id=129900 (accessed December 10, 2018)
CBD (2008). COP 9. Scientific Criteria for Ecologically or Biologically Significant Marine Areas (Annex I, Decision IX/20). Montreal, QC: CBD.
Clark, A. H. (1950). A Monograph of the Existing Crinoids. Available at: https://repository.si.edu/handle/10088/21346 (accessed December 10, 2018).
Clark, A. M. (1980). Crinoidea Collected by the Meteor and Discovery in the NE Atlantic. Available at: http://biostor.org/reference/110 (accessed December 10, 2018)
Clark, M. R., Rowden, A. A., Schlacher, T., Williams, A., Consalvey, M., Stocks, K. I., et al. (2010). The ecology of seamounts: structure, function, and human impacts. Ann. Rev. Mar. Sci. 2, 253–278. doi: 10.1146/annurev-marine-120308-081109
Clark, M. R., Schlacher, T. A., Rowden, A. A., Stocks, K. I., and Consalvey, M. (2012). Science priorities for seamounts: research links to conservation and management. PLoS One 7:e29232. doi: 10.1371/journal.pone.0029232
Cooper, A. J., and Spearman, J. (2017). “Validation of a TELEMAC - 3D model of a seamount,” in Proceedings of the Telemac-Mascaret User Conference, 17-20 October 2017, (Austria: Graz University of Technology).
Dayton, P. K., Jarrell, S. C., Kim, S., Parnell, P., Thrush, S. F., Hammerstrom, K., et al. (2019). Benthic responses to an Antarctic regime shift: food particle size and recruitment biology. Ecol. Appl. 29:e01823. doi: 10.1002/eap.1823
de Goeij, J. M., van Oevelen, D., Vermeij, M. J. A., Osinga, R., Middelburg, J. J., de Goeij, A. F. P. M., et al. (2013). Surviving in a marine desert: the sponge loop retains resources within coral reefs. Science 342, 108–110. doi: 10.1126/science.1241981
Duchassaing, P., and Michelotti, G. (1864). Supplément au mémoire sur les Coralliaires des Antilles. Extrait des mémoires de l’Académie des Sciences de Turin, Ser. 2, 97–206 (reprint numbered 1–112), 11 pis.
Dullo, W.-C., Flögel, S., and Rüggeberg, A. (2008). Cold-water coral growth in relation to the hydrography of the celtic and nordic european continental margin. Mar. Ecol. Prog. Ser. 371, 165–176. doi: 10.3354/meps07623
Duncan, P. M. (1873). A description of the Madreporaria dredged up during the expeditions of H.M.S. Porcupine in 1869 &1870. Trans. Zool. Soc. 8, 303–344. doi: 10.1111/j.1096-3642.1873.tb00560.x
Dunn, D. C., Van Dover, C. L., Etter, R. J., Smith, C. R., Levin, L. A., Morato, T., et al. (2018). A strategy for the conservation of biodiversity on mid-ocean ridges from deep-sea mining. Sci. Adv. 4:eaar4313. doi: 10.1126/sciadv.aar4313
Elith, J., Ferrier, S., Huettmann, F., and Leathwick, J. (2005). The evaluation strip: a new and robust method for plotting predicted responses from species distribution models. Ecol. Modell. 186, 280–289. doi: 10.1016/J.ECOLMODEL.2004.12.007
Elith, J., Phillips, S. J., Hastie, T., Dudík, M., Chee, Y. E., and Yates, C. J. (2011). A statistical explanation of maxent for ecologists. Divers. Distrib. 17, 43–57. doi: 10.1111/j.1472-4642.2010.00725.x
FAO (2009). International Guidelines for the Management of Deep-Sea Fisheries in the High Seas. Available at: http://www.fao.org/docrep/011/i0816t/i0816t00.HTM (accessed November 18, 2017)
Fao Fiaf/R1184 (2016). FAO / CECAF Technical Workshop on Deep-Sea Fisheries and Vulnerable Marine Ecosystems in the Eastern Central Atlantic. Dakar: Food and Agriculture Organization of the United Nations.
Fielding, A. H., and Bell, J. F. (1997). A review of methods for the assessment of prediction errors in conservation presence/absence models. Environ. Conserv. 24, 38–49. doi: 10.1017/s0376892997000088
Fourcade, Y., Besnard, A. G., and Secondi, J. (2017). Paintings predict the distribution of species, or the challenge of selecting environmental predictors and evaluation statistics. Glob. Ecol. Biogeogr. 27, 245–256. doi: 10.1111/geb.12684
Friedman, J., Hastie, T., and Tibshirani, R. (2010). Regularization paths for generalized linear models via coordinate descent. J. Stat. Softw. 33, 1–22. doi: 10.18637/jss.v033.i01
Fujikura, K., Yamanaka, T., Sumida, P. Y. G., Bernardino, A. F., Pereira, O. S., Kanehara, T., et al. (2017). Discovery of asphalt seeps in the deep Southwest Atlantic off Brazil. Deep Sea Res. Part II Top. Stud. Oceanogr. 146, 35–44. doi: 10.1016/J.DSR2.2017.04.002
Genin, A., Dayton, P. K., Lonsdale, P. F., and Spiess, F. N. (1986). Corals on seamount peaks provide evidence of current acceleration over deep-sea topography. Nature 322, 59–61. doi: 10.1038/322059a0
Genuer, R., Poggi, J.-M., and Tuleau-Malot, C. (2010). Variable selection using random forests. Pattern Recognit. Lett. 31, 2225–2236. doi: 10.1016/J.PATREC.2010.03.014
González-Irusta, J. M., González-Porto, M., Sarralde, R., Arrese, B., Almón, B., and Martín-Sosa, P. (2015). Comparing species distribution models: a case study of four deep sea urchin species. Hydrobiologia 745, 43–57. doi: 10.1007/s10750-014-2090-3
González-Irusta, J. M., and Wright, P. J. (2016). Spawning grounds of haddock (Melanogrammus aeglefinus) in the North Sea and West of Scotland. Fish. Res. 183, 180–191. doi: 10.1016/J.FISHRES.2016.05.028
Gray, J. E. (1832). Synopsis of the Contents of the British Museum, 27th Edn. London: Woodfall and Son.
Gray, J. E. (1858). On aphrocallistes, a new genus of spongiadae from malacca. Proc. Zool. Soc. 26, 114–115. doi: 10.1111/j.1469-7998.1858.tb06352.x
Gray, J. E. (1870). Catalogue of Lithophytes or Stony Corals in the Collection of the British Museum. London: PNatural History British Museum.
Gutt, J., and Koltun, V. M. (1995). Sponges of the lazarev and weddell sea, antarctica: explanations for their patchy occurrence. Antarct. Sci. 7, 227–234. doi: 10.1017/S0954102095000320
Hansteen, T., Kwasnitschka, T., and Klügel, A. (2014). Cape Verde Seamounts - Cruise No. M80/3 - December 29, 2009 - February 1, 2010 - Dakar (Senegal) - Las Palmas de Gran Canaria (Spain). Bremen: DFG-Senatskommission für Ozeanographie.
Harris, P. T., and Whiteway, T. (2009). High seas marine protected areas: benthic environmental conservation priorities from a GIS analysis of global ocean biophysical data. Ocean Coast. Manag. 52, 22–38. doi: 10.1016/J.OCECOAMAN.2008.09.009
Henderiks, J. (2001). Coccolith Studies in the Canary Basin: Glacial-Interglacial Paleoceanography of the Eastern Boundary Current System. Available at: http://www.academia.edu/28505222/Coccolith_studies_in_the_Canary_Basin (accessed September 28, 2018)
Henry, L. A., Moreno Navas, J., and Roberts, J. M. (2013). Multi-scale interactions between local hydrography, seabed topography, and community assembly on cold-water coral reefs. Biogeosciences 10, 2737–2746. doi: 10.5194/bg-10-2737-2013
Hernández-Guerra, A., Fraile-Nuez, E., López-Laatzen, F., Martínez, A., Parrilla, G., and Vélez-Belchí, P. (2005). Canary current and north equatorial current from an inverse box model. J. Geophys. Res. Oceans 110, 1–16. doi: 10.1029/2005JC003032
Hernández-Guerra, A., López-Laatzen, F., Machín, F., De Armas, D., and Pelegrí, J. L. (2001). Water masses, circulation and transport in the eastern boundary current of the North Atlantic subtropical gyre. Sci. Mar. 65, 177–186. doi: 10.3989/scimar.2001.65s1177
Hijmans, R. J., Van Etten, J., Cheng, J., Mattiuzzi, M., Sumner, M., Greenberg, J. A., et al. (2013). Raster”: Geographic Data Analysis and Modeling. Available at: https://cran.r-project.org/web/packages/raster/raster.pdf (accessed October 12, 2018).
Hogg, M., Tendal, O., Conway, K., Pomponi, S., Van-Soest, R., Krautter, M., et al. (2010). Deep-sea Sponge Grounds: Reservoirs of Biodiversity. Cambridge: UNEP-WCMC.
Howell, K. L., Piechaud, N., Downie, A. L., and Kenny, A. (2016). The distribution of deep-sea sponge aggregations in the North Atlantic and implications for their effective spatial management. Deep. Res. Part I Oceanogr. Res. Pap. 115, 203–220. doi: 10.1016/j.dsr.2016.07.005
Johnson, J. Y. (1862). Descriptions of two corals from madeira, belonging to the genera primnoa and mopsea. Proc. Zool. Soc. 30, 245–246. doi: 10.1111/j.1469-7998.1862.tb06521.x
Johnson, J. Y. (1899). Notes on the coralliida of madeira, with descriptions of two new species. Proc. Zool. Soc. 67, 57–63. doi: 10.1111/j.1469-7998.1899.tb06845.x
Kent, W. S. (1870). On the ‘hexactinellidae’ or hexradiate spiculed silicious sponges taken in the “norna” expedition off the coast of spain and portugal. with description of new species, and revision of the order. Mon. Microsc. J. 4, 241–252. doi: 10.1111/j.1365-2818.1870.tb01123.x
Klitgaard, A. B. (1995). The fauna associated with outer shelf and upper slope sponges (porifera, demospongiae) at the faroe islands, northeastern atlantic. Sarsia 80, 1–22. doi: 10.1080/00364827.1995.10413574
Klitgaard, A. B., and Tendal, O. S. (2004). Distribution and species composition of mass occurrences of large-sized sponges in the northeast Atlantic. Prog. Oceanogr. 61, 57–98. doi: 10.1016/J.POCEAN.2004.06.002
Knoll, M., Hernández-Guerra, A., Lenz, B., López Laatzen, F., Machìn, F., Müller, T., et al. (2002). The eastern boundary current system between the canary islands and the african coast. Deep Sea Res. Part II Top. Stud. Oceanogr. 49, 3427–3440. doi: 10.1016/S0967-0645(02)00105-4
Knudby, A., Kenchington, E., and Murillo, F. J. (2013). Modeling the distribution of geodia sponges and sponge grounds in the northwest Atlantic. PLoS One 8:e82306. doi: 10.1371/journal.pone.0082306
Koehler, R., and Bather, F. A. (1902). Gephyrocrinus grimaldii, crinoïde nouveau provenant des campagnes de la “Princesse Alice”. Mémoires de la Société Zoologique de France 15, 68–79. Available at: https://www.biodiversitylibrary.org/page/19339225
Koschinsky, A., Halbach, P., Hein, J. R., and Mangini, A. (1996). Ferromanganese crusts as indicators for paleoceanographic events in the NE Atlantic. Geol. Rundschau. 85, 567–576. doi: 10.1007/BF02369011
Liu, C., White, M., and Newell, G. (2013). Selecting thresholds for the prediction of species occurrence with presence-only data. J. Biogeogr. 40, 778–789. doi: 10.1111/jbi.12058
Lo Iacono, C., Gràcia, E., Diez, S., Bozzano, G., Moreno, X., Dañobeitia, J., et al. (2008). Seafloor characterization and backscatter variability of the almería margin (alboran sea, sw mediterranean) based on high-resolution acoustic data. Mar. Geol. 250, 1–18. doi: 10.1016/J.MARGEO.2007.11.004
Lobo, J. M., Jiménez-Valverde, A., and Real, R. (2008). AUC: a misleading measure of the performance of predictive distribution models. Glob. Ecol. Biogeogr. 17, 145–151. doi: 10.1111/j.1466-8238.2007.00358.x
Long, R., and Chaves, M. R. (2015). Anatomy of a new international instrument for marine biodiversity beyond national jurisdiction. Environ. Liabil. 6, 213–229.
Maldonado, M., Navarro, L., Grasa, A., Gonzalez, A., and Vaquerizo, I. (2011). Silicon uptake by sponges: a twist to understanding nutrient cycling on continental margins. Sci. Rep. 1:30. doi: 10.1038/srep00030
McIntyre, F. D., Drewery, J., Eerkes-Medrano, D., and Neat, F. C. (2016). Distribution and diversity of deep-sea sponge grounds on the rosemary bank seamount, NE Atlantic. Mar. Biol. 163:143. doi: 10.1007/s00227-016-2913-z
Miller, K. A., Thompson, K. F., Johnston, P., and Santillo, D. (2018). An overview of seabed mining including the current state of development, environmental impacts, and knowledge gaps. Front. Mar. Sci. 4:418. doi: 10.3389/fmars.2017.00418
Murillo, F. J., Kenchington, E., Lawson, J. M., Li, G., and Piper, D. J. W. (2016). Ancient deep-sea sponge grounds on the flemish cap and grand bank, northwest Atlantic. Mar. Biol. 163:63. doi: 10.1007/s00227-016-2839-5
Murillo, F. J., Muñoz, P. D., Cristobo, J., Ríos, P., González, C., Kenchington, E., et al. (2012). Deep-sea sponge grounds of the flemish cap, flemish pass and the grand banks of newfoundland (Northwest Atlantic Ocean): distribution and species composition. Mar. Biol. Res. 8, 842–854. doi: 10.1080/17451000.2012.682583
Murton, B. (2016). “MarineE-Tech Project”: To Map the Cobalt-Rich Ferromanganese Crusts of Tropic Seamount, NE Atlantic Ocean. Cruise Report JC142. National Oceanography Centre, Southampton.
Murton, B. J., Lusty, P., Yeo, I. A., and Howarth, S. (2017). “Detailed description of FeMn crusts at tropic seamount,” in Proceedings of the American Geophysical Union, Fall Meeting 2017, abstract #OS34A-05. (Washington, DC: American Geophysical Union)
Muscarella, R., Galante, P. J., Soley-Guardia, M., Boria, R. A., Kass, J. M., Uriarte, M., et al. (2014). ENMeval: an r package for conducting spatially independent evaluations and estimating optimal model complexity for maxent ecological niche models. Methods Ecol. Evol. 5, 1198–1205. doi: 10.1111/2041-210X.12261
Narayanaswamy, B. E., Hughes, D. J., Howell, K. L., Davies, J., and Jacobs, C. (2013). First observations of megafaunal communities inhabiting george bligh bank, Northeast Atlantic. Deep Sea Res. Part II Top. Stud. Oceanogr. 92, 79–86. doi: 10.1016/J.DSR2.2013.03.004
Oppel, S., Meirinho, A., Ramírez, I., Gardner, B., O’Connell, A. F., Miller, P. I., et al. (2012). Comparison of five modelling techniques to predict the spatial distribution and abundance of seabirds. Biol. Conserv. 156, 94–104. doi: 10.1016/J.BIOCON.2011.11.013
Owen, R. (1841). Description of a new genus and species of sponge (Euplectella aspergillum). Proc. Zool. Soc. 9, 3–5.
Palomino, D., Vázquez, J.-T., Somoza, L., León, R., López-González, N., Medialdea, T., et al. (2016). Geomorphological features in the southern canary island volcanic province: the importance of volcanic processes and massive slope instabilities associated with seamounts. Geomorphology 255, 125–139. doi: 10.1016/J.GEOMORPH.2015.12.016
Parra, H. E., Pham, C. K., Menezes, G. M., Rosa, A., Tempera, F., and Morato, T. (2017). Predictive modeling of deep-sea fish distribution in the Azores. Deep Sea Res. Part II Top. Stud. Oceanogr. 145, 49–60. doi: 10.1016/J.DSR2.2016.01.004
Pastor, M., Peña-Izquierdo, J., Pelegrí, J., and Marrero-Díaz, Á (2012). Meridional changes in water mass distributions off NW Africa during November 2007/2008. Ciencias Mar. 38, 223–244. doi: 10.7773/cm.v38i1b.1831
Pastor, M., Vélez-Belchí, P., and Hernández-Guerra, A. (2015). Water masses in the canary current large marine ecosystem. IOC Tech. Ser. 115, 733–779.
Pebesma, E., and Graeler, B. (2018). Package “gstat”: Spatial and Spatio-Temporal Geostatistical Modelling, Prediction and Simulation. Available at: https://cran.r-project.org/web/packages/gstat/gstat.pdf (accessed October 11, 2018).
Pebesma, E. J. (2004). Multivariate geostatistics in S: the gstat package. Comput. Geosci. 30, 683–691. doi: 10.1016/j.cageo.2004.03.012
Phillips, S. (2017). Maxnet: Fitting “Maxent” Species Distribution Models with “Glmnet.”. Available at: http://biodiversityinformatics.amnh.org/open_source/maxent (accessed October 11, 2018)
Phillips, S. J., Anderson, R. P., Dudík, M., Schapire, R. E., and Blair, M. E. (2017). Opening the black box: an open-source release of maxent. Ecography 40, 887–893. doi: 10.1111/ecog.03049
Phillips, S. J., Anderson, R. P., and Schapire, R. E. (2006). Maximum entropy modeling of species geographic distributions. Ecol. Modell. 190, 231–259. doi: 10.1016/J.ECOLMODEL.2005.03.026
Radice, V., Quattrini, A., Wareham, V., and Edinger, E. (2016). Vertical water mass structure in the North Atlantic influences the bathymetric distribution of species in the deep-sea coral genus Paramuricea. Deep Sea Res. Part I Oceanogr. Res. Pap. 116, 253–263. doi: 10.1016/J.DSR.2016.08.014
Ramirez-Llodra, E., Brandt, A., Danovaro, R., De Mol, B., Escobar, E., German, C. R., et al. (2010). Deep, diverse and definitely different: unique attributes of the world’s largest ecosystem. Biogeosciences 7, 2851–2899. doi: 10.5194/bg-7-2851-2010
Ramirez-Llodra, E., Tyler, P. A., Baker, M. C., Bergstad, O. A., Clark, M. R., Escobar, E., et al. (2011). Man and the last great wilderness: human impact on the deep sea. PLoS One 6:e22588. doi: 10.1371/journal.pone.0022588
R Core Team (2018). R: A Language and Environment for Statistical Computing. Vienna: R Foundation for Statistical Computing. Available at: https://www.R-project.org
Reiswig, H. M., and Dohrmann, M. (2014). Three new species of glass sponges (Porifera: Hexactinellida) from the West Indies, and molecular phylogenetics of euretidae and auloplacidae (Sceptrulophora). Zool. J. Linn. Soc. 171, 233–253. doi: 10.1111/zoj.12138
Renner, I. W., and Warton, D. I. (2013). Equivalence of MAXENT and poisson point process models for species distribution modeling in ecology. Biometrics 69, 274–281. doi: 10.1111/j.1541-0420.2012.01824.x
Rice, A., Thurston, M., and New, A. (1990). Dense aggregations of a hexactinellid sponge, pheronema carpenteri, in the porcupine seabight (northeast Atlantic Ocean), and possible causes. Prog. Oceanogr. 24, 179–196. doi: 10.1016/0079-6611(90)90029-2
Rix, L., de Goeij, J. M., Mueller, C. E., Struck, U., Middelburg, J. J., van Duyl, F. C., et al. (2016). Coral mucus fuels the sponge loop in warm- and cold-water coral reef ecosystems. Sci. Rep. 6:18715. doi: 10.1038/srep18715
Robert, K., Jones, D. O. B., Roberts, J. M., and Huvenne, V. A. I. (2016). Improving predictive mapping of deep-water habitats: considering multiple model outputs and ensemble techniques. Deep. Res. Part I 113, 80–89. doi: 10.1016/j.dsr.2016.04.008
Roberts, E. M., Mienis, F., Rapp, H. T., Hanz, U., Meyer, H. K., and Davies, A. J. (2018). Oceanographic setting and short-timescale environmental variability at an Arctic seamount sponge ground. Deep Sea Res. Part I Oceanogr. Res. Pap. 138, 98–113. doi: 10.1016/J.DSR.2018.06.007
Roberts, J. M., Wheeler, A. J., Freiwald, A., and Cairns, S. D. (2009). Cold-water Corals: The Biology and Geology of Deep-Sea Coral Habitats. Cambridge: Cambridge University Press.
Rogers, A. D., Baco, A., Griffiths, H., Hart, T., and Hall-Spencer, J. M. (2007). “Corals on Seamounts,” in Seamounts: Ecology, Fisheries and Conservation, eds T. J. Pitcher, T. Morato, J. B. H. Paul, R. C. Malcolm, N. Haggan, and R. S. Santos (Hoboken NJ: Wiley Online library), 141–169. doi: 10.1002/9780470691953.ch8
Rossi, S., Bramanti, L., Gori, A., and Orejas, C. (2017). “Animal forests of the world: an overview,” in Marine Animal Forests: The Ecology of Benthic Hotspots, eds S. Rossi, L. Bramanti, A. Gori, and C. Orejas (New York, NY: springer international publishing).
Roux, M. (1985). “Les Crinoïdes pédonculés (Echinodermes) de l’Atlantique N.E.: inventaire, écologie et biogéographie,” in Peuplements profonds du golfe de Gascogne, eds L. Laubier and C.l. Monniot (Tahiti: IFREMER), 479–489.
Rowden, A. A., Anderson, O. F., Georgian, S. E., Bowden, D. A., Clark, M. R., Pallentin, A., et al. (2017). High-resolution habitat suitability models for the conservation and management of vulnerable marine ecosystems on the louisville seamount chain. South Pacific Ocean. Front. Mar. Sci. 4:335. doi: 10.3389/fmars.2017.00335
Rowden, A. A., Schlacher, T. A., Williams, A., Clark, M. R., Stewart, R., Althaus, F., et al. (2010). A test of the seamount oasis hypothesis: seamounts support higher epibenthic megafaunal biomass than adjacent slopes. Mar. Ecol. 31, 95–106. doi: 10.1111/j.1439-0485.2010.00369.x
Samadi, S., Schlacher, T., and de Forges, B. R. (2007). “Seamount benthos,” in Seamounts: Ecology, Fisheries & Conservation, eds T. J. Pitcher, T. Morato, J. B. H. Paul, R. C. Malcolm, N. Haggan, and R. S. Santos (Oxford: Blackwell Publishing Ltd), 117–140. doi: 10.1002/9780470691953.ch7
Schlacher, T. A., Baco, A. R., Rowden, A. A., O’Hara, T. D., Clark, M. R., Kelley, C., et al. (2014). Seamount benthos in a cobalt-rich crust region of the central Pacific: conservation challenges for future seabed mining. Divers. Distrib. 20, 491–502. doi: 10.1111/ddi.12142
Schmidt, O. (1880). “Die Spongien des meerbusen von mexico (und des caraibischen meeres). heft ii. abtheilung ii. hexactinelliden. abtheilung iii. tetractinelliden. monactinelliden und anhang. nachträge zu abtheilung i (lithistiden),” in Proceedings of the Reports on the Dredging Under the Supervision of Alexander Agassiz, in the Gulf of Mexico, by the USCSS ‘Blake,’, (Cambridge: Biodiversity Heritage Library), 33–90.
Schmincke, H.-U., and Graf, G. (2000). DECOS / OMEX II, Cruise No. 43, 25 November 1998-1914 January 1999. Hamburg: Leitstelle METEOR.
Schulze, F. E. (1886). Über Den BAU Und Das System Der Hexactinelliden. Berlin: Abhandlungen der Königlichen Akad.
Serrano, A., González-Irusta, J. M., Punzón, A., García-Alegre, A., Lourido, A., Ríos, P., et al. (2017). Deep-sea benthic habitats modeling and mapping in a NE Atlantic seamount (Galicia Bank). Deep Sea Res. Part I Oceanogr. Res. Pap. 126, 115–127. doi: 10.1016/J.DSR.2017.06.003
Shirayama, Y., Itoh, H., and Fukushima, T. (2017). “Recent developments in environmental impact assessment with regard to mining of deep-sea mineral resources,” in Deep-sea Mining: Resource Potential, Technical and Environmental Considerations, ed. R. Sharma (Cham: Springer International Publishing), 445–463. doi: 10.1007/978-3-319-52557-0_15
Stevenson, A., Gahn, F. J., Baumiller, T. K., and Sevastopulo, G. D. (2017). Predation on feather stars by regular echinoids as evidenced by laboratory and field observations and its paleobiological implications. Paleobiology 43, 274–285. doi: 10.1017/pab.2016.39
Tabachnick, K. R., and Menshenina, L. L. (2002). “Family pheronematidae Gray, 1870,” in Systema Porifera, ed. R. W. M. van Soest (Boston, MA: Springer), 1267–1280. doi: 10.1007/978-1-4615-0747-5_129
Thomson, C. W. (1869). On holtenia, a genus and of vitreus sponges. Proc. R. Soc. 18, 32–35. doi: 10.1098/rspl.1869.0010
Thomson, C. W. (1872). On the crinoids of the “porcupine” deep-sea dredging expedition. Proc. R. Soc. Edinb. 7, 764–773. doi: 10.1017/S037016460004308X
Thomson, C. W. (1877). The Voyage of the “Challenger”. The Atlantic; a Preliminary Account of the General Results of the Exploring Voyage of H.M.S. “Challenger” During the Year 1873 and the Early Part of the Year 1876. Available at: http://www.marinespecies.org/porifera/porifera.php?p=sourcedetails&id=288600 (accessed December 10, 2018)
Thomson, C. W. (1878). The Voyage of the Challenger The Atlantic; a Preliminary Account of the General Results of the Exploring Voyage of H.M.S. Challenger During the Year 1873 and the Early Part of the Year 1876. New York, NY: Harper & Borthers.
Thuiller, W., Lafourcade, B., Engler, R., and Araújo, M. B. (2009). BIOMOD –a platform for ensemble forecasting of species distributions. Ecography 32, 369–373. doi: 10.1111/j.1600-0587.2008.05742.x
Tjensvoll, I., Kutti, T., Fosså, J. H., and Bannister, R. J. (2013). Rapid respiratory responses of the deep-water sponge Geodia barretti exposed to suspended sediments. Aquat. Biol. 19, 65–73. doi: 10.3354/ab00522
Topsent, E. (1904). Spongiaires des Açores. Résultats des Campagnes Sci. Accompl. Par le Prince Albert I. Available at: http://www.marinespecies.org/porifera/porifera.php?p=sourcedetails&id=8354 (accessed December 10, 2018)
UNGA (2006). Resolution adopted by the General 61/105. Sustainable fisheries, including through the 1995 Agreement for the Implementation of the Provisions of the United Nations Convention on the Law of the Sea of 10 December 1982 relating to the Conservation and Management of Straddling Fish Stocks and Highly Migratory Fish Stocks, and related instruments. Available at: https://www.un.org/Depts/los/general_assembly/general_assembly_resolutions.htm#2006 (accessed October 10, 2018)
van den Bogaard, P. (2013). The origin of the canary island seamount province - new ages of old seamounts. Sci. Rep. 3:2107. doi: 10.1038/srep02107
Van Dover, C. L., Ardron, J. A., Escobar, E., Gianni, M., Gjerde, K. M., Jaeckel, A., et al. (2017). Biodiversity loss from deep-sea mining. Nat. Geosci. 10, 464–465. doi: 10.1038/ngeo2983
Van Dover, C. L., Arnaud-Haond, S., Gianni, M., Helmreich, S., Huber, J. A., Jaeckel, A. L., et al. (2018). Scientific rationale and international obligations for protection of active hydrothermal vent ecosystems from deep-sea mining. Mar. Policy 90, 20–28. doi: 10.1016/J.MARPOL.2018.01.020
Vázquez, J. T., Somoza, L., Rengel, J. A., Medialdea, T., Millán, A., Alcalá, C., et al. (2011). Informe Científico-técnico de la Campaña Oceanográfica DRAGO 0511. Ampliación de la Plataforma Continental de España al Oeste de las Islas Canarias (accessed October 10, 2018).
Verrill, A. E. (1878). Notice of recent additions to the marine fauna of the eastern coast of North America. Am. J. Sci. 16, 207–215. doi: 10.2475/ajs.s3-16.93.207
Verrill, A. E. (1883). Reports on the results of dredging, under the supervision of alexander agassiz, on the east coast of the united states, during the summer of 1880, by the U.S. coast survey steamer Blake Commander J.R. Bartlett, U.S.N., Commanding. XXI. report. Bull. Mus. Comp. Zool. 11, 1–21.
Victorero, L., Robert, K., Robinson, L. F., Taylor, M. L., and Huvenne, V. A. I. (2018). Species replacement dominates megabenthos beta diversity in a remote seamount setting. Sci. Rep. 8:4152. doi: 10.1038/s41598-018-22296-8
Vierod, A., Guinotte, J., and Davies, A. (2014). Predicting the distribution of vulnerable marine ecosystems in the deep sea using presence-background models. Deep Sea Res. Part II Top. Stud. Oceanogr. 99, 6–18. doi: 10.1016/J.DSR2.2013.06.010
Watling, L., and Auster, P. J. (2017). Seamounts on the high seas should be managed as vulnerable marine ecosystems. Front. Mar. Sci. 4:14. doi: 10.3389/fmars.2017.00014
Weber, M. M., Stevens, R. D., Diniz-Filho, J. A. F., and Grelle, C. E. V. (2017). Is there a correlation between abundance and environmental suitability derived from ecological niche modelling? A meta-analysis. Ecography 40, 817–828. doi: 10.1111/ecog.02125
Wood, S. N. (2011). Fast stable restricted maximum likelihood and marginal likelihood estimation of semiparametric generalized linear models. J. R. Stat. Soc. Ser. B Stat. Methodol. 73, 3–36. doi: 10.1111/j.1467-9868.2010.00749.x
Wright, E., and Studer, T. (1889). Report on the Scientific Results of the Voyage of H.M.S. Challenger During the Years 1873-76. Available at: https://archive.org/details/reportonscientif04grea/page/n7 (accessed December 10, 2018).
Wright, E. P. (1869). VIII.— On a new genus of gorgonidæ from portugal. Ann. Mag. Nat. Hist. 3, 23–26. doi: 10.1080/00222936908695873
Xavier, J. R., Tojeira, I., and Van Soest, R. W. M. (2015). On a hexactinellid sponge aggregation at the great meteor seamount (North-east Atlantic). J. Mar. Biol. Assoc. U. K. 95, 1389–1394. doi: 10.1017/S0025315415000685
Keywords: deep-sea, sponge grounds, seamount, species distribution models, biogeography, ABNJ, EBSA
Citation: Ramiro-Sánchez B, González-Irusta JM, Henry L-A, Cleland J, Yeo I, Xavier JR, Carreiro-Silva M, Sampaio Í, Spearman J, Victorero L, Messing CG, Kazanidis G, Roberts JM and Murton B (2019) Characterization and Mapping of a Deep-Sea Sponge Ground on the Tropic Seamount (Northeast Tropical Atlantic): Implications for Spatial Management in the High Seas. Front. Mar. Sci. 6:278. doi: 10.3389/fmars.2019.00278
Received: 11 December 2018; Accepted: 13 May 2019;
Published: 31 May 2019.
Edited by:
Cristina Gambi, Marche Polytechnic University, ItalyReviewed by:
Americo Montiel, University of Magallanes, ChileMustafa Yucel, Middle East Technical University, Turkey
Copyright © 2019 Ramiro-Sánchez, González-Irusta, Henry, Cleland, Yeo, Xavier, Carreiro-Silva, Sampaio, Spearman, Victorero, Messing, Kazanidis, Roberts and Murton. This is an open-access article distributed under the terms of the Creative Commons Attribution License (CC BY). The use, distribution or reproduction in other forums is permitted, provided the original author(s) and the copyright owner(s) are credited and that the original publication in this journal is cited, in accordance with accepted academic practice. No use, distribution or reproduction is permitted which does not comply with these terms.
*Correspondence: Berta Ramiro-Sánchez, berta.ramiro@ed.ac.uk