Satellite Remote Sensing in Shark and Ray Ecology, Conservation and Management
 Michael J. Williamson
 Emma J. Tebbs
 Terence P. Dawson
 David M. P. Jacoby
- 1Department of Geography, King’s College London, London, United Kingdom
- 2The Institute of Zoology, Zoological Society of London, London, United Kingdom
Global elasmobranch populations have declined dramatically over the past 50 years, and continued research into the drivers of their habitats and distributions is vital for improved conservation and management. How environmental factors influence elasmobranch behavior, habitat use, and movement patterns is still relatively poorly understood, in part because of the scale over which many of these animals roam and the remote nature of the marine ecosystems they inhabit. In the last decade there has been an explosion of satellite remote sensing (SRS) technologies that can cover these vast spatial scales for the marine environment. Consequentially, SRS presents an opportunity to analyze important environmental drivers in elasmobranch ecology and to aid management decisions for the conservation of declining populations. A systematic literature review was undertaken to synthesize the current use of SRS environmental data in elasmobranch research. In addition, to facilitate the use of SRS in this field moving forward, we have compiled a list of popular SRS data sources and sensors for common environmental variables in marine science. Our review of 71 papers (55 published in the last 10 years) identified ten SRS-derived environmental variables that have been used in elasmobranch studies, from a range of satellite sensors and data sources. Sea surface temperature and ocean productivity were the most frequently used variables. Articles primarily analyzed variables individually or in pairs, with few studies looking at a suite of interacting variables. Here, we present a summary of the current state of knowledge on the application of SRS, current gaps and limitations, and discuss some of the potential future directions in which we envisage this field developing. Threatened elasmobranch populations inhabit some of the world’s most remote marine ecosystems. With often global coverage, SRS presents an opportunity to analyze the important environmental drivers of elasmobranch ecology to aid management decisions for the conservation of declining and threatened populations.
Introduction
Global populations of elasmobranchs (cartilaginous fish, including sharks, rays, and chimeras) have declined dramatically over the past 50 years (Baum et al., 2003; Burgess et al., 2005; Myers et al., 2007; Dulvy et al., 2014). Particularly susceptible to extinction (Musick et al., 2000), their K-selected life histories, slow growth rate, large body size, long gestation periods, late sexual maturity, and low fecundity make them acutely vulnerable to overexploitation (Reynolds et al., 2001; Dulvy et al., 2004), as well as less adaptable to environmental change through demographic responses (Perry et al., 2005; Rosa et al., 2014). Recent estimates have calculated that only 37% of elasmobranchs are considered safe (of least concern) by the IUCN Red List, the lowest proportion of non-threatened species among vertebrate groups studied to date (Molina and Cooke, 2012; Dulvy et al., 2014). The true extent, to which elasmobranch species are threatened, however, is still largely unknown. Many species are data deficient (Molina and Cooke, 2012; Dulvy et al., 2014), fished above recommended levels (Baum et al., 2003; Burgess et al., 2005; Simpfendorfer et al., 2011) and fisheries data on elasmobranchs is often poorly documented (Dulvy et al., 2008; Heupel and Simpfendorfer, 2010; Bornatowski et al., 2014). These factors combined, may mask their true population trajectories.
Reversing these declines through effective conservation and management strategies is important as elasmobranchs play a valuable role in marine ecosystems. As upper trophic level predators, many elasmobranchs exert top down effects by influencing prey populations through mortality and anti-predator behavior (Creel and Christianson, 2008; Heithaus et al., 2008; Ferretti et al., 2010). Some elasmobranch species also provide bottom up effects through the provision of nutrients into reef ecosystems from pelagic environments (Williams et al., 2018). The most appropriate conservation strategy can be difficult to define in many species due to their broad geographic distribution and migratory nature (Knip et al., 2012). Successful conservation of elasmobranch populations requires detailed knowledge of their breeding and feeding habitat, and their routes, timings and rates of movement between these areas (Simpfendorfer et al., 2010; Speed et al., 2010; Knip et al., 2012). As such, understanding how and why elasmobranchs move, migrate and aggregate is essential for their conservation and management at multiple spatial scales (Bonfil, 1997; Jacoby et al., 2012). Increased knowledge of movement patterns not only aid conservation strategies by optimally designing protected areas, but it also increases understanding of the risk posed by threats such as industrial fishing, habitat degradation, pollution and climate change (Chin et al., 2010; Espinoza et al., 2014; Schlaff et al., 2014).
Until recently, research has mainly focused on the “where” rather than the “why” aspects of elasmobranch movement ecology; where individuals or populations move and migrate, but not always why they do so (Hammerschlag et al., 2011). How the physical environment influences movement, is one of the key questions for understanding the movement ecology of marine megafauna (Speed et al., 2010; Hays et al., 2016; Jacoby and Freeman, 2016). Biotic factors, predator avoidance and prey availability, play a significant role in the movement ecology of elasmobranch species (Heithaus, 2001; Heithaus et al., 2002; Torres et al., 2006; Collins et al., 2007). However, permanent and transitory abiotic factors, for example bathymetry, sea surface temperature (SST), salinity and ocean currents, are also thought to strongly influence marine megafauna movements (Block et al., 2011). Schlaff et al. (2014) reviewed the influence of different environmental variables on the movement of elasmobranchs and identified strong environmental correlates of movement in some species. SST, for example, influenced the site fidelity of zebra sharks, Stegostoma fasciatum (Dudgeon et al., 2013), and the aggregation behavior of several shark species in north Western Australia (Speed et al., 2011). Furthermore, light intensity can affect daily movement patterns of elasmobranchs, acting as a trigger for foraging (Nelson et al., 1997; Cartamil et al., 2003; Andrews et al., 2009) and resting behavior (Papastamatiou and Lowe, 2012; Dudgeon et al., 2013).
Correlates of elasmobranch movement with other environmental variables are less clear. For example, salinity can alter the distribution and local abundance of elasmobranch species (Hopkins and Cech, 2003; Ubeda et al., 2009), but as most elasmobranch species are stenohaline, movement in response to salinity changes is most likely a response to avoid physiological stress (Schlaff et al., 2014). Productivity, often measured as the distribution and density of chlorophyll-a, has been linked to occurrence, movement and aggregation behavior in large filter feeding elasmobranchs, such as whale sharks (Rhincodon typus) and manta ray species (Heyman et al., 2001; Sleeman et al., 2007; Dewar et al., 2008; Couturier et al., 2011). In contrast, the relationship between primary productivity and movement is less clear in high trophic level species (Gende and Sigler, 2006). Most investigations have focused on how a small number of abiotic factors influence movement (Schlaff et al., 2014). However, abiotic factors vary in their level of impact between species, sex and life-history stage, and seldom act in isolation. It is often difficult to establish the relative contribution of different variables to movement and spatial patterns (Sleeman et al., 2007). As such, how the physical environment interacts with individual behavioral motivation to influence the movement of elasmobranchs is still not fully understood.
Data for the marine environment can be derived from both in situ or remotely sensed sources. In situ data sources include localized sensors and profiling floats [(e.g., the Argo program1, (Roemmich et al., 2009)]. These provide highly accurate point measurements but can have limited temporal and geographical coverage, and data is not always relayed in real time (Guinehut et al., 2004; Roemmich et al., 2009). Alternatively, remote sensing acquires information about the ocean surface without being in physical contact with the medium being measured (Martin, 2004). This can be done using sensors mounted on ships or aircraft, however, the most effective and common method is via satellite (Martin, 2004). The use of satellite sensors allows wide ranging observations of oceanic processes over various spatio-temporal scales (Yang et al., 2013). Satellite sensors can be passive, measuring natural sources of reflected or emitted electromagnetic radiation, or active, measuring backscattered electromagnetic radiation that they have produced [for more detail see Pettorelli et al. (2018)]. Although it provides a more indirect measurement than in situ methods, numerous environmental variables are being detected by satellite remote sensing (SRS) (Chassot et al., 2011), with the accuracy and resolution of several variables now comparable to in situ instrumentation (Zieger et al., 2009; Young et al., 2011; Lee, 2016). In addition, SRS does not have the spatial limitations of in situ environmental data (Zieger et al., 2009) and many satellites provide global coverage with open data policies, such as the European Space Agency’s Sentinel missions and the NASA/USGS Landsat Program (Malenovský et al., 2012; Roy et al., 2014). In recent years, SRS has become widely used for oceanic environmental data collection (Guinehut et al., 2004; Zieger et al., 2009; Yang et al., 2013).
Integrating SRS with information on elasmobranch distributions and movements allows behavior to be directly linked to spatially extensive measurements of ocean environmental variables. This can aid the prediction and mapping of likely future space use, distribution and behavior (Handcock et al., 2009), further improving our understanding of elasmobranch ecology. Biotelemetry techniques are frequently adopted to explore the movements and behavior of wide-ranging elasmobranchs (Simpfendorfer et al., 2010; Donaldson et al., 2014). The integration of SRS data with animal-borne tag data is a relatively new field, largely due to the spatial and temporal disparities between the two data types (Pettorelli et al., 2014; Rose et al., 2015). Recently, however, these disparities have begun to be resolved through modern technological developments in tagging, greater processing ability and increased access to data (Santos, 2000).
Here we review the application of SRS for elasmobranch ecology, conservation and management, with the following aims: (1) examine current uses of SRS in elasmobranch research and its integration with tagging technologies, (2) investigate which environmental variables and associated metrics are used most frequently, (3) provide an overview of the myriad of available SRS data sources and sensors, and (4) highlight gaps in knowledge and potential future directions in this emerging field of research.
Materials and Methods
This review took a systematic approach to searching the literature, enabling greater reproducibility, transparency and rigor (Tranfield et al., 2003; Armitage and Keeble-Allen, 2008; Moher et al., 2015). Several academic search tools were used in conjunction to conduct the bibliographic search, as recommended in the systematic review literature (Bramer et al., 2013, 2016; Giustini and Boulos, 2013). These included ISI Web of Science2, Scopus3, and Google Scholar4. As the first study on remote sensing in elasmobranch ecology was undertaken in the early 1980s (Priede, 1984), the search included articles published between 1 January 1980 and a cut-off date of 1 May 2018. The term “shark” was used as it obtained greater search results than the term “elasmobranch.” Due to the ambiguity of the term “ray,” however, “ray” and “elasmobranch” were used together. Additionally, the terms “movement,” “habitat,” “ecology” and “environment∗” were added as Boolean terms to our searches. How these terms were applied varied depending on the search engine (see Supplementary Table S1). Two separate searches were conducted using Google Scholar. The first used traditional Boolean search terms. The “shark” search produced 20,500 results and the first 1% (205) were filtered for relevance. The “elasmobranch AND ray” search produced 1,310 results. To match the “shark” search, the first 205 results were analyzed (see Supplementary Figure S1 for numbers produced by each search, per search term). There are biases toward highly cited articles and the occurrence of a search term in an article’s title in Google Scholar’s ranking algorithm (Beel and Gipp, 2009). As such, standard Google Scholar search results will contain highly cited articles that provide a broad overview of the topic (Giustini and Boulos, 2013). Specific or relevant literature may be missed or ranked so low that they will not be found. To account for these biases, a second search of Google Scholar (named “Smart Scholar”) was used, directly searching in the subject and title for our search terms (see Supplementary Table S1).
The initial searches yielded 412 articles for “shark” and 215 for “elasmobranch AND ray.” From this initial list, articles were selected for inclusion in the review following a process adapted from Moher et al. (2015). First, articles were excluded if their titles did not contain the terms “shark” and/or “remote sensing” (or any associated terms). Second, articles were excluded if they did not contain the terms “shark” or “ray” (or correlates) in the abstract, and satellite remote sensing was not used as the source of environmental data in the methods section. Finally, the full text and the data sources of the articles were screened, and articles were excluded if; elasmobranch data were not included as a data source for the study; the article was a review or from a non-peer-reviewed/respected source; or the full text could not be obtained. Additionally, 54 duplicate articles found between the collective searches were also removed. In total, 71 articles were retained for inclusion in the review. The overall process used for identification and screening of articles for the systematic review is outlined in Supplementary Figure S1.
Key information and metadata (as summarized in Supplementary Table S2) were extracted from the final 71 articles and consolidated into a database. Study applications were identified for each article (i.e., the predominant research question for which SRS data were used). Geographic coordinates for study locations were obtained either directly from the study if reported, or by obtaining latitude and longitude of study locations5. If data were obtained over a survey area, rather than a single site, then the average geographic coordinates for this area were used. Within the literature, the terms used to describe environmental data are highly changeable. In this review we use the term “variable” to describe a single measure of the environment, such as “SST,” or “salinity.” The term “metric” is used to describe a specific measure for quantifying a variable. For example, multiple metrics related to a single variable might be used in one article, or the same variable might be referred to differently in different articles (e.g., SST, thermal anomaly or change in SST). As such, we consolidated similar metrics into 10 different variables (Table 1).
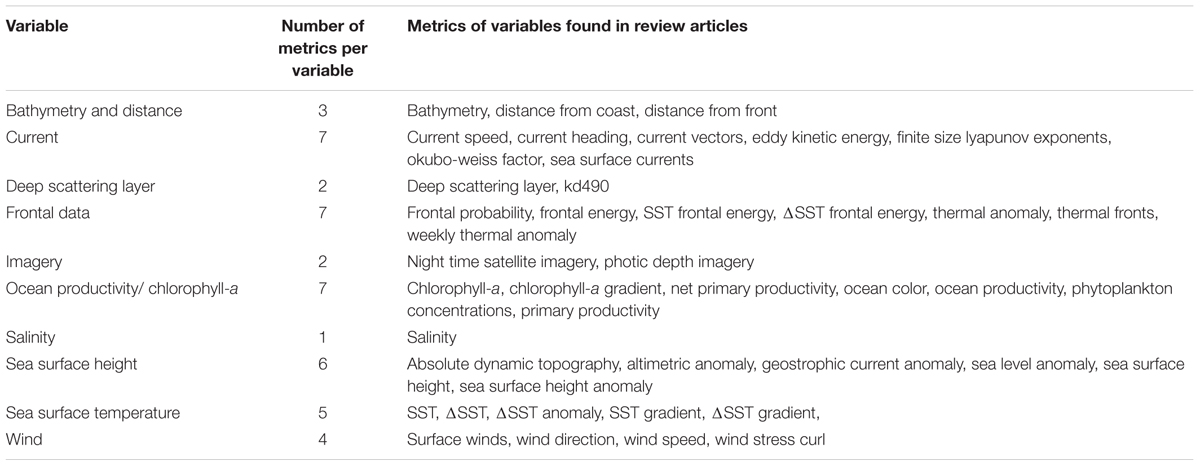
Table 1. Variable categories and reported metrics per variable found across reviewed articles.
To provide a detailed list of data sources and sensors available to researchers, those mentioned in the 71 reviewed articles were recorded and combined with other common SRS sources and sensors (Tables 2, 3). A glossary of acronyms and definitions of terms used in the tables can be found in Supplementary Tables S3, S4.
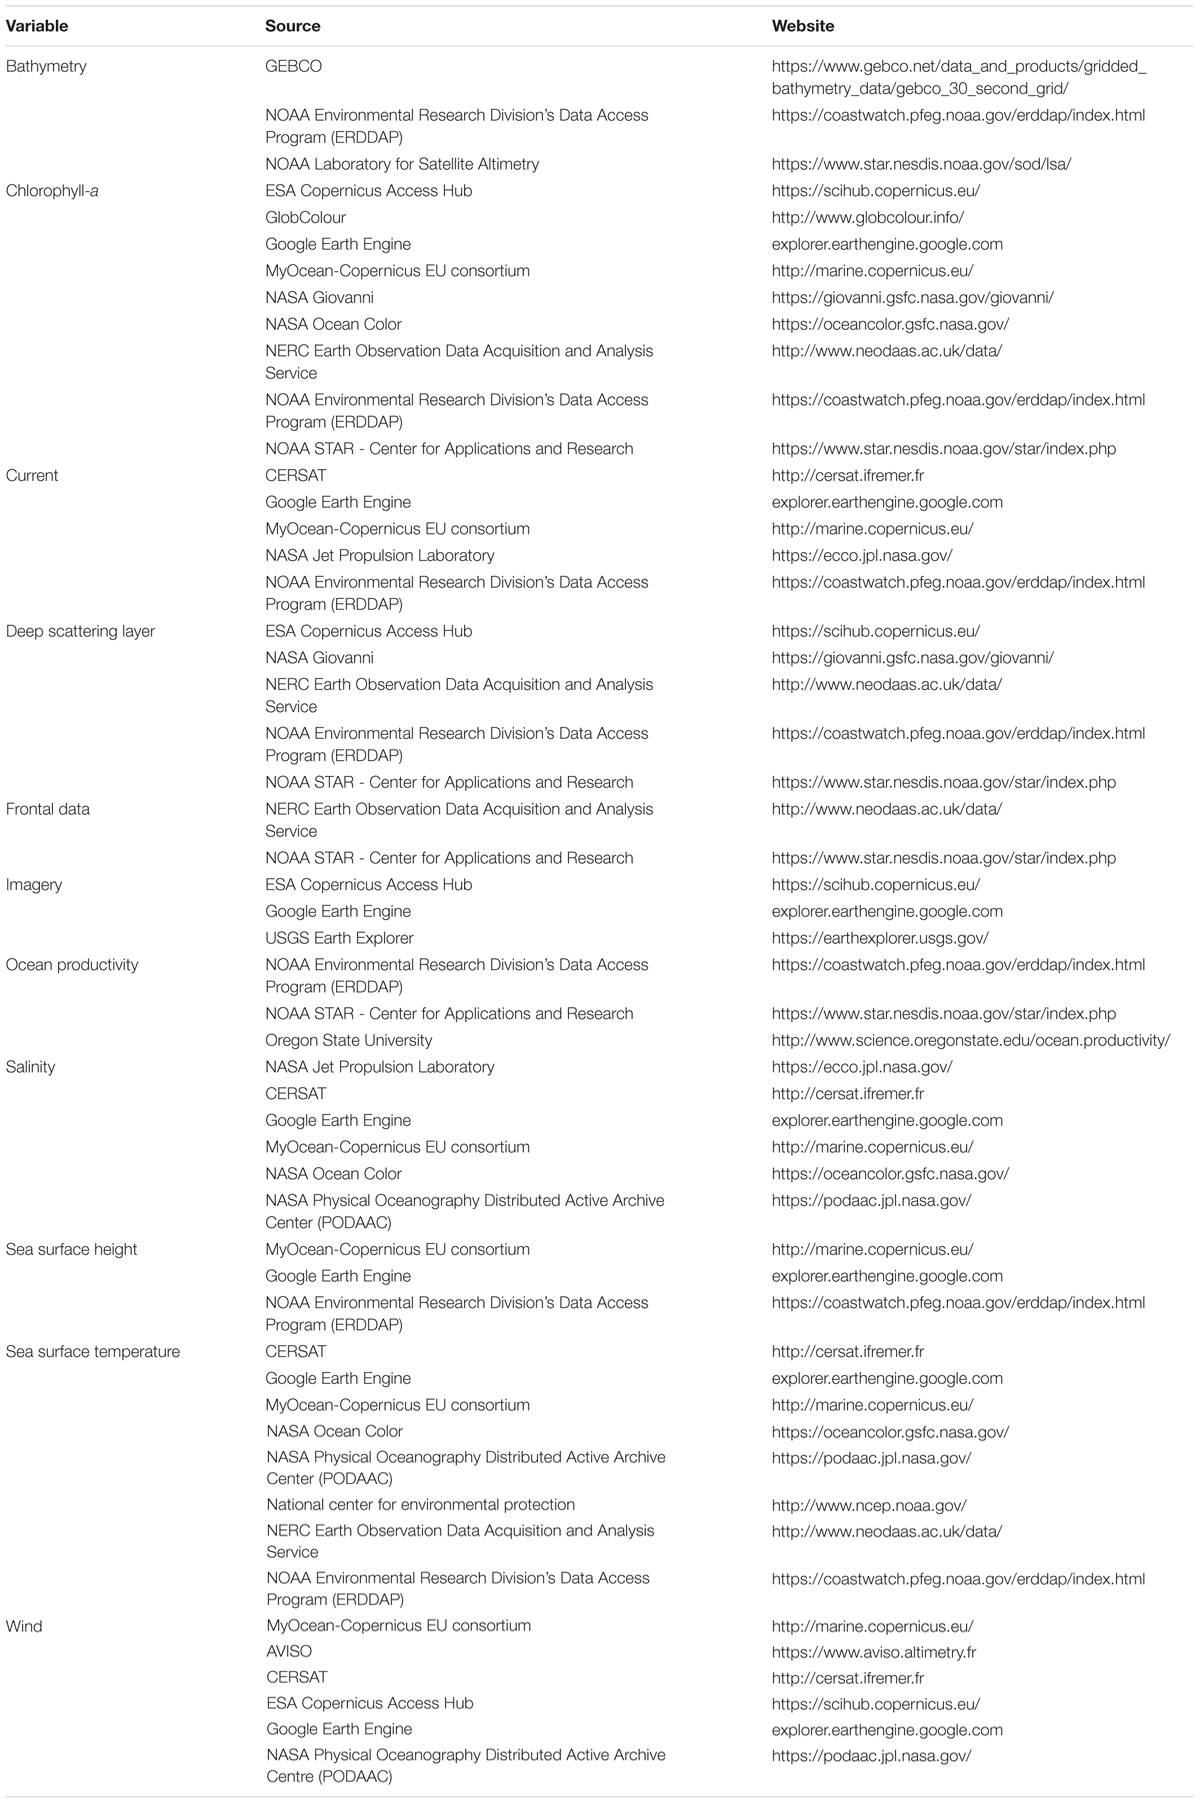
Table 2. Common sources of data for SRS environmental variables.
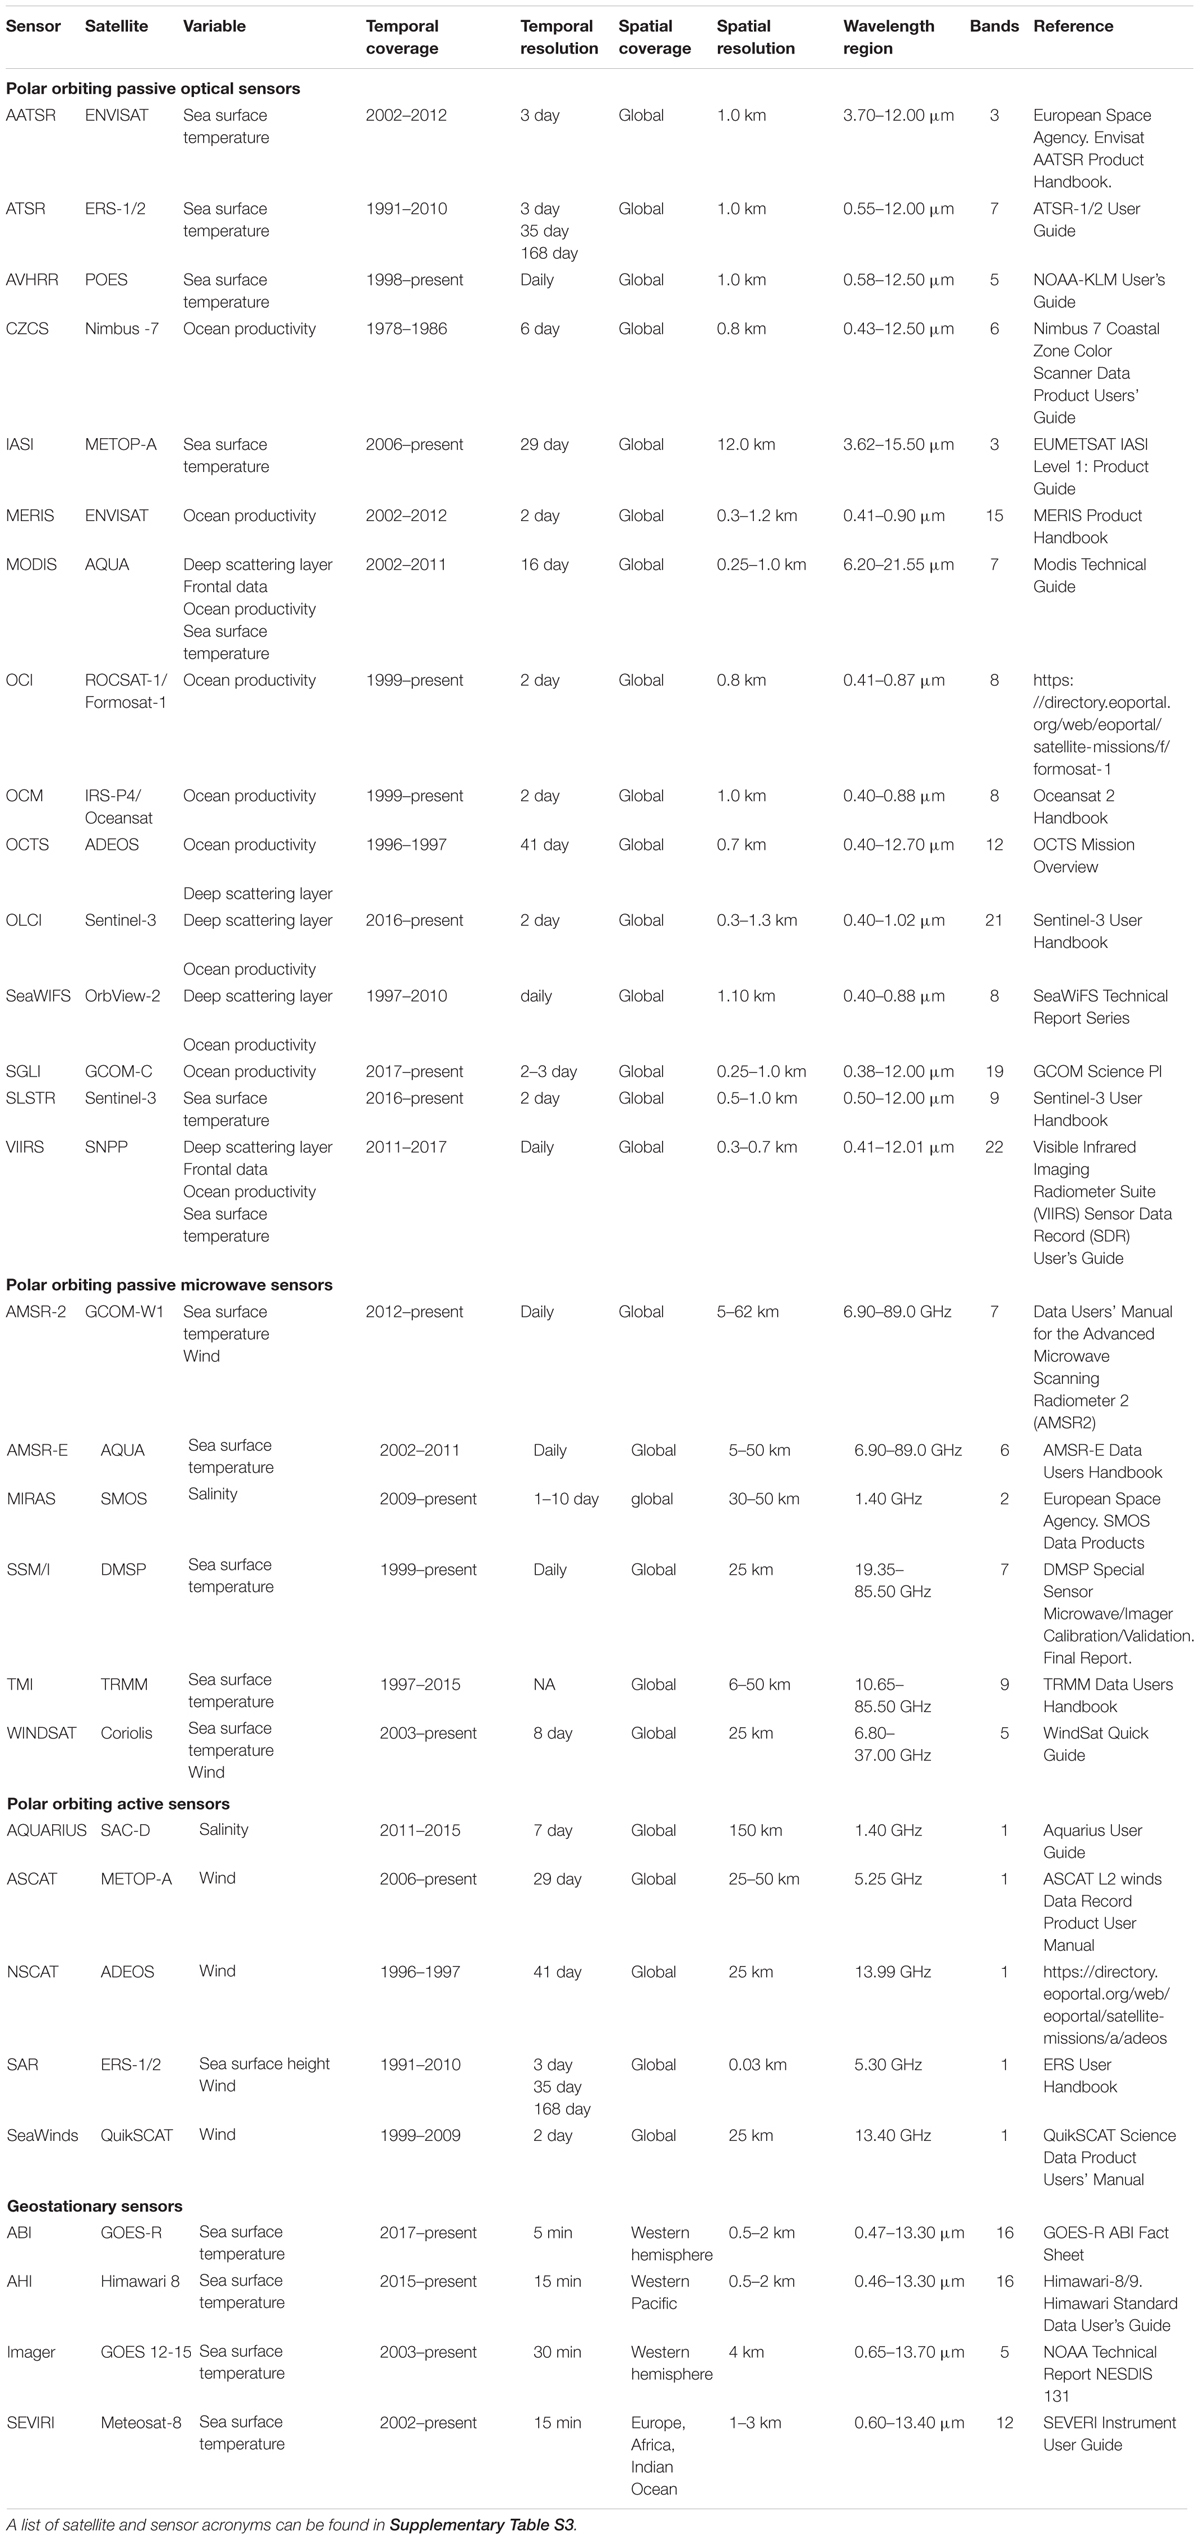
Table 3. Summary of satellite sensors used to obtain marine environmental variables, including details of temporal and spatial coverage and resolution, wavelength region sampled and number of spectral bands.
Review of Current Knowledge
The systematic literature search identified 71 articles for review. Further details of the bibliographic search results can be found in Supplementary Table S5 and Supplementary Figure S2. Reviewed articles were published from 1984 to May 2018. The number of publications, however, increased considerably between January 2000 to May 2018 (n = 68) compared to the previous two decades (n = 3). Journal articles made up the majority (n = 63) of the final reviewed articles. Other sources include conference proceedings (n = 2), book chapters (n = 2), Ph.D. theses” (n = 3) and reports (n = 1).
This section presents an overview of the current use of satellite remote sensing (SRS) within elasmobranch research. It includes a summary of the elasmobranch data used in the studies, and the geographical and taxonomic focus of the articles. Details of the SRS-derived environmental variables used within the reviewed articles are also presented.
Elasmobranch Data
Use of tagging technologies was common, with 48% of reviewed articles using animal-borne tags as a source of elasmobranch data, compared to 25% using fisheries data, and 18% using scientific surveys. Baited remote underwater video systems and citizen science each made up 4% of elasmobranch data sources. A single article used previously published data as the source of elasmobranch data for the investigation. Out of the 71 reviewed articles, 32 combined satellite-based telemetry (e.g., SPOT tags and PAT/PSAT tags) with SRS. For example, Sleeman et al. (2010) used satellite telemetry and SRS data to show that whale sharks move independently of geostrophic currents in the Indian Ocean. The use of SRS data with acoustic telemetry was not common (2/71 articles).
Geography, Taxonomy and Threat Status
There was a broad geographic spread of study locations covering the Atlantic, Pacific and Indian Oceans (Figure 1). There was a notable absence of research in the north-western Pacific Ocean, the Artic and the Antarctic. A total of 37 publications (52%) conducted studies in the Atlantic Ocean compared to the Pacific Ocean (27%), and Indian Ocean (20%). A single study by Sequeira et al. (2014) used data taken from the Atlantic, Pacific and Indian Oceans to assess ocean current, and predict future distributions of whale sharks. Studies were more common in temperate waters (63%) than in tropical regions (37%) and more common in coastal waters, within 200 nautical miles from a major land mass (79%) than open ocean (21%). These results may reflect the location of primary research institution (see Supplementary Figure S3) and the financial and time constraints of working in oceanic, opposed to coastal, environments. It should be noted that the geographic distribution is likely to be biased by the fact that this review was only able to consider publications written in English.
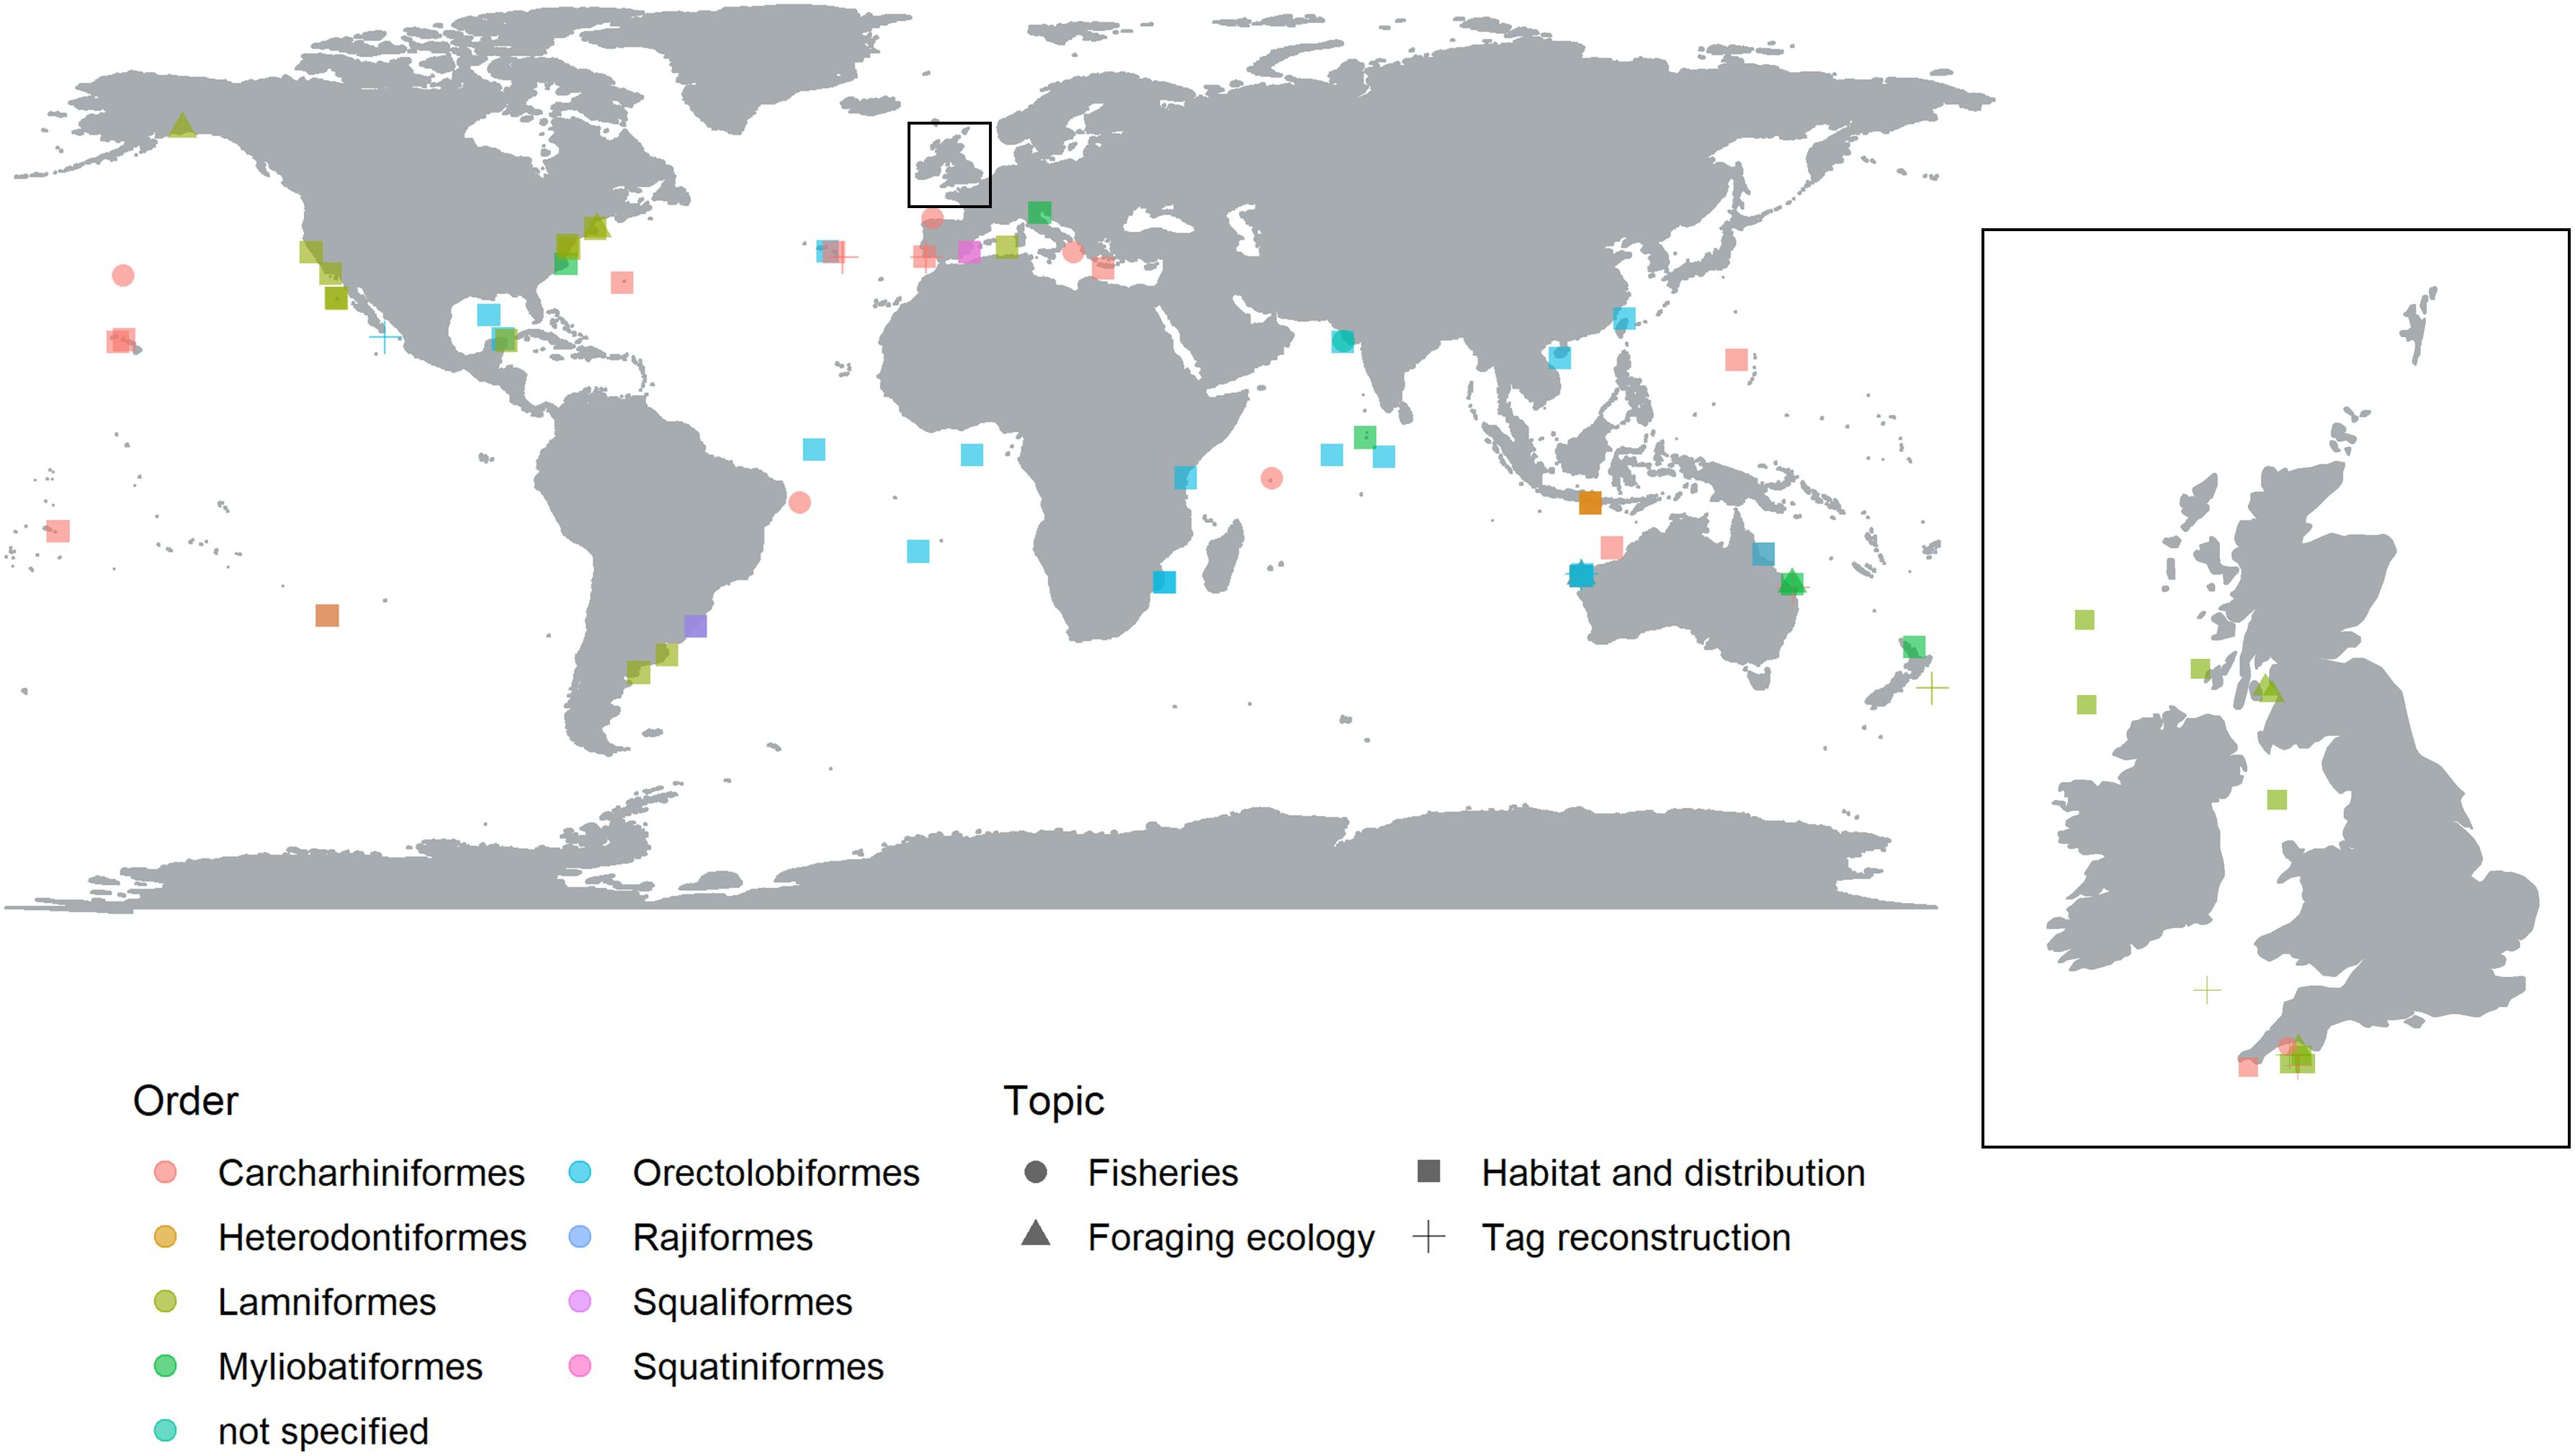
Figure 1. Global map illustrating the regions where SRS has been used in shark ecology, conservation and management, separated by taxonomic Order (color) and research topic (shape). The United Kingdom and Ireland have been expanded to visualize the studies around this region.
Of the 12 extant elasmobranch orders (Pavan-Kumar et al., 2018), eight were represented in the reviewed articles (Figure 1), representing of 37 different species. Unsurprisingly, there was a taxonomic bias toward highly mobile species with Carcharhiniformes and Lamniformes dominating, both featuring in 34% of the reviewed articles. Orectolobiformes (28%) were the next most frequent elasmobranch Order. The other remaining Orders included two ray Orders (Myliobatiformes, and Rajiformes, 10 and 1%, respectively), and three additional shark Orders (Heterodontiformes, Squaliformes and Squatiniformes, 1% each). A further 1% of articles did not specify the species the study was undertaken on. Of the 37 different model species, only one, the Brazilian guitar fish, Pseudobatos horkelii, was listed as Critically Endangered by the IUCN red list6. Endangered and Vulnerable species made up 16 and 41%, respectively. Near Threatened, Least Concern and Data Deficient species made up 16, 14 and 11% of species in the study.
SRS Technologies and Applications
SRS Environmental Variables
Two remotely sensed environmental variables dominated the review articles; SST (n = 64, 90%) and ocean productivity (n = 48, 68%), with sea surface height, ocean current metrics and metrics of frontal data present in 11, 6 and 6% of the articles, respectively (Figure 2). SST metrics were utilized for a variety of research applications including investigations into habitat and distribution (Laurs et al., 2006; Curtis et al., 2014; Lea et al., 2015; Miller et al., 2015; Reynolds et al., 2017), foraging ecology (Sims and Quayle, 1998; Weng et al., 2008; Weeks et al., 2015), elasmobranch fisheries (Bigelow et al., 1999; Mitchell et al., 2014; Selles et al., 2014) and track reconstruction (Wilson et al., 2007; Queiroz et al., 2010; Ramírez-Macías et al., 2017). Metrics of ocean productivity, such as primary productivity and chlorophyll-a, were used primarily in investigations into habitat and distribution but also foraging ecology. For example, Jaine et al. (2012) showed that primary productivity was a principal driver of reef manta ray (Manta alfredi) aggregations and Humphries et al. (2010) used metrics of ocean productivity to demonstrate that predatory fish, including several species of elasmobranch, conduct behavioral switching of search strategies in response to variation in productivity and thus food availability. Most articles focused on one or two variables (n = 27 and n = 24, respectively), with investigations analyzing three or more variables less frequently (three variables, n = 9; ≥ four variables, n = 11).
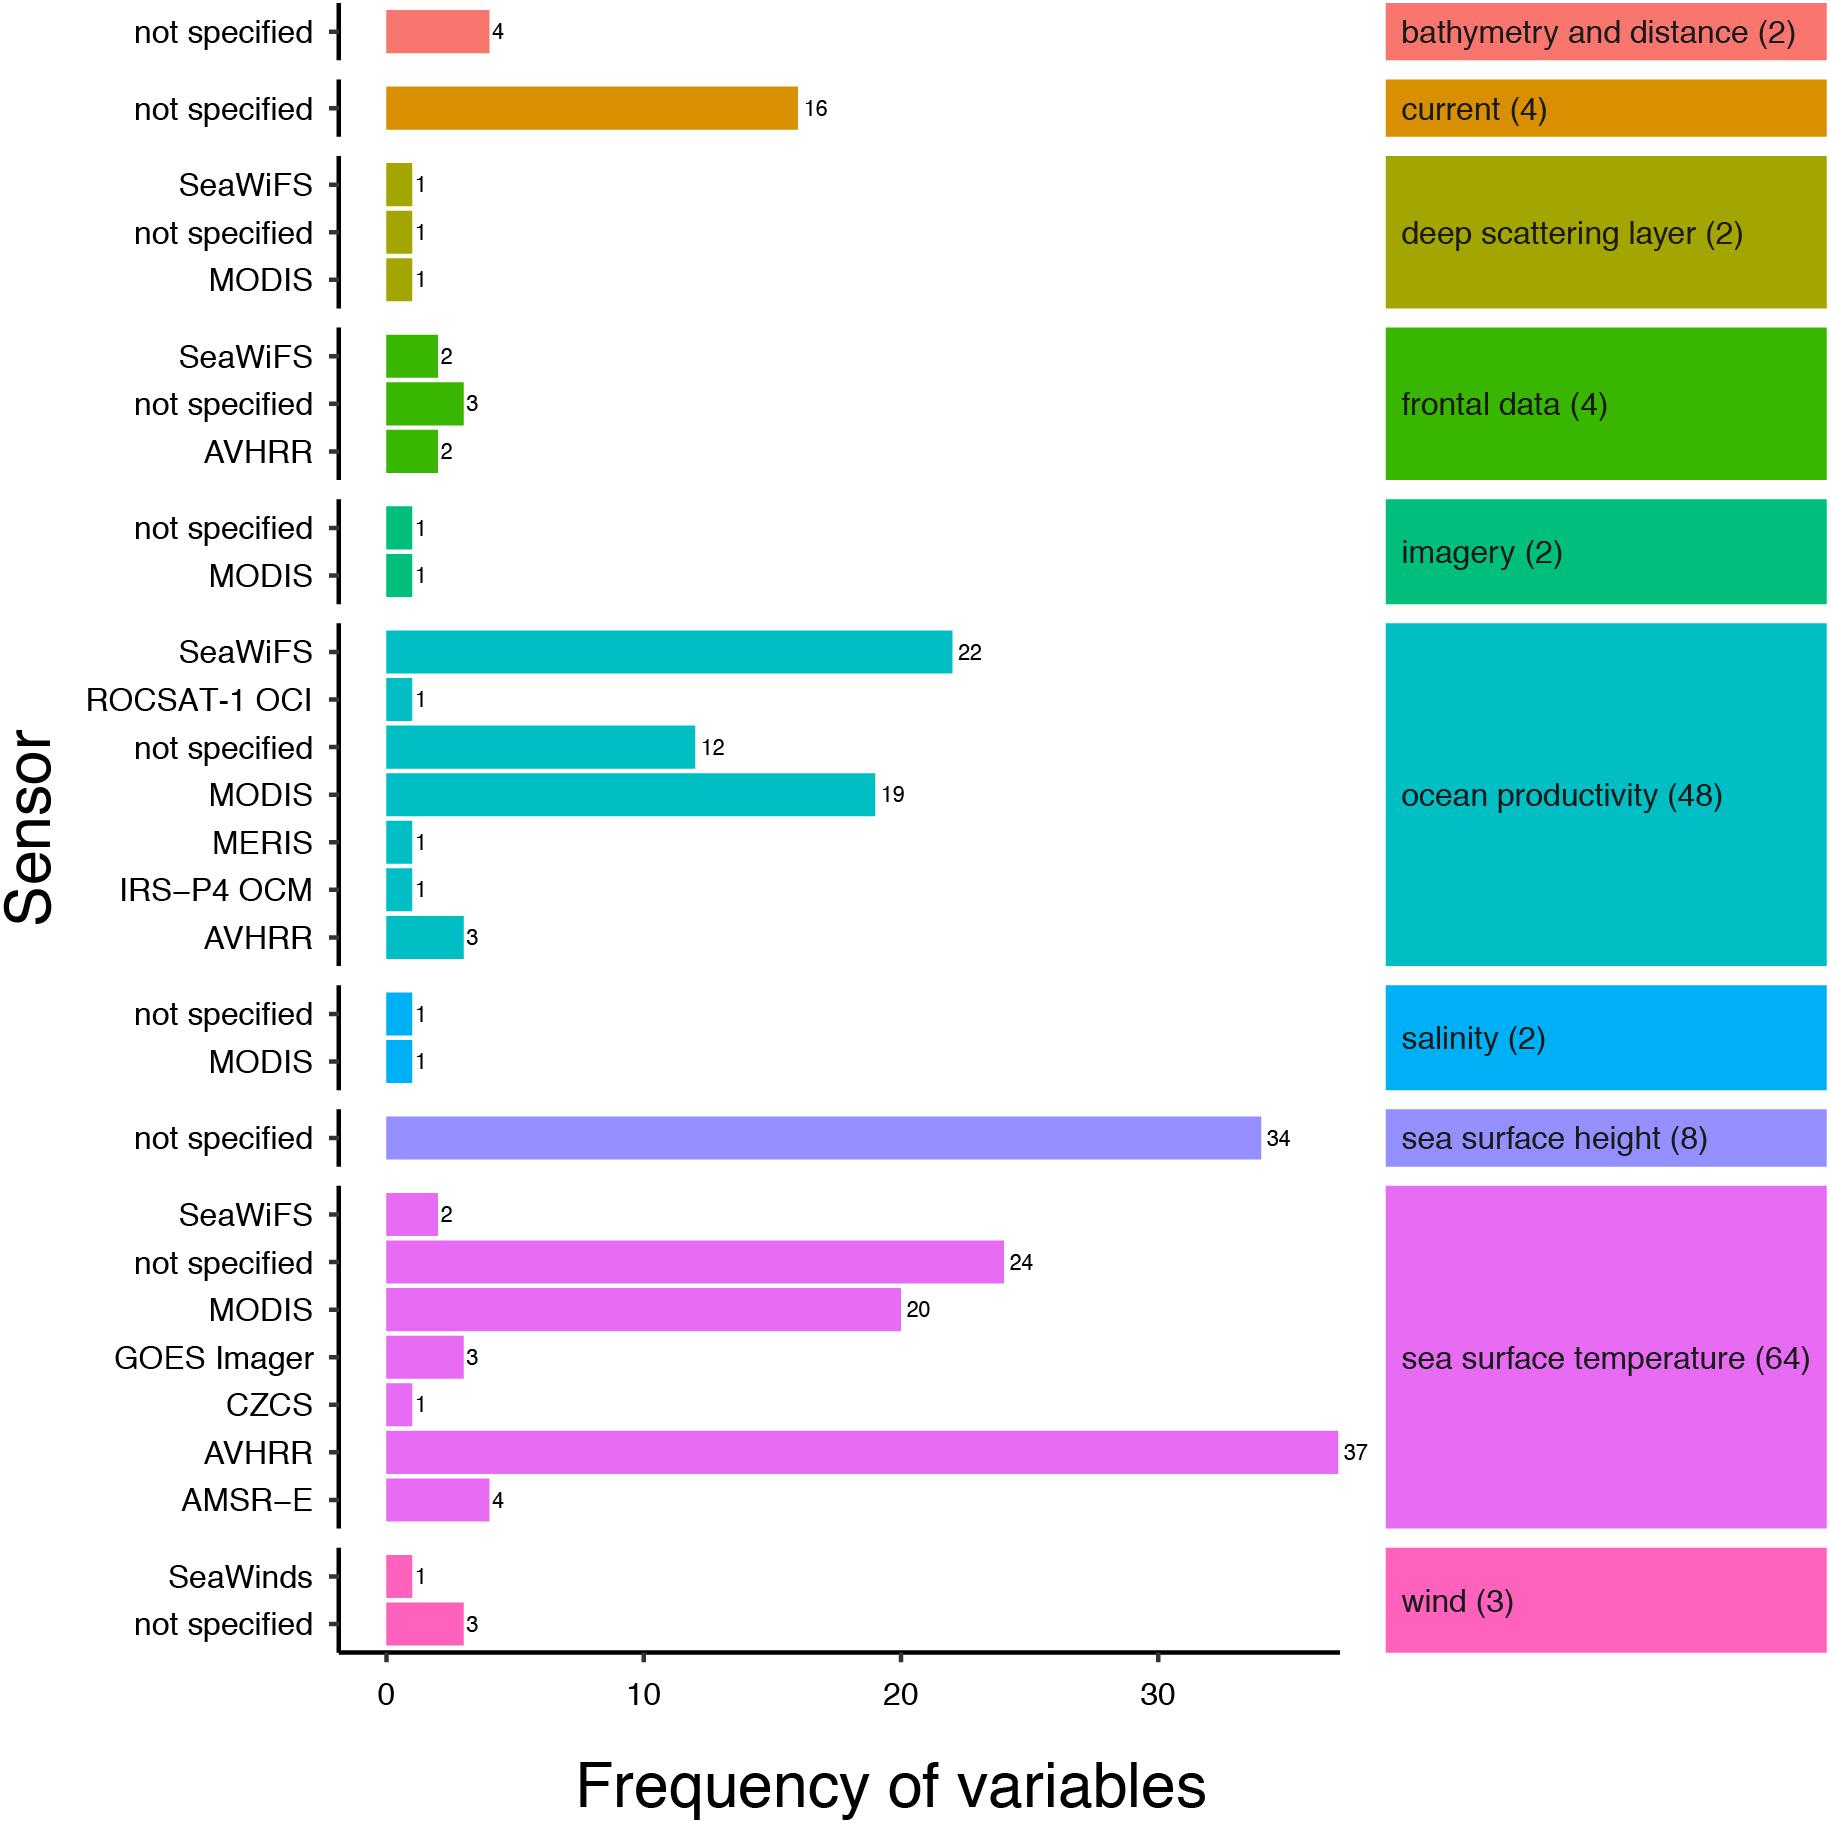
Figure 2. Frequency of SRS variables split by the sensor used to obtain the variable. Multiple metrics of an SRS variable were counted (see Table 1). Number of articles using a specific variable are in parentheses. A list of sensor acronyms can be found in Supplementary Table S3.
SRS Data Sources and Sensors
In total 16 different data repositories were used to obtain remotely sensed environmental variables and 72% of variables used in the reviewed articles had a specified data repository (Supplementary Figure S4). The National Oceanic and Atmospheric Administration (NOAA) (42%) and the National Aeronautics and Space Administration (NASA) (24%) were the primary sources for data acquisition. European satellite products, such as those from Copernicus Marine Environment Monitoring Service, were also used for data acquisition but were far less common (5%). Of the 71 reviewed articles, only one (Solanki et al., 2003) used commercial SRS data, to investigate potential fishing zones for an Indian elasmobranch fishery. All other reported SRS data came from free and open sources. Outlays for commercial SRS can be high (Turner et al., 2003, 2015). Despite falling costs, conservation and ecology remains underfunded (McCarthy et al., 2012) and researchers will only use commercial SRS data if they can afford them (Turner et al., 2015). In addition, the increased resolution of free and open SRS data is sufficient for many research questions related to the marine environment, precluding the need for expensive high-resolution commercial data. Furthermore, policies from institutions such as the United States Geological Survey (USGS) and the European Space Agency (ESA) to provide SRS data without cost (Woodcock et al., 2008; Donlon et al., 2012) has led to improved access to comprehensive global environmental variables that, due to the expense, were previously unavailable to a large part of the research community.
Currently, there are few repositories available in the literature for researchers to obtain information on the large number of different SRS variables. Where collated data do exist, [e.g., Toth and Jóźków (2016); Pettorelli et al. (2018)] there is a heavy focus on the terrestrial realm and often reference to satellite systems rather than specific environmental variables. Chassot et al. (2011) and Kachelriess et al. (2014) both summarize remote sensing variables for marine realms, however, these are not exhaustive, and a host of new sources and metrics have been made available since their publication. In this review, we provide a collection of different web platforms available to obtain SRS marine variables at the global scale (Table 2), as well as collating information on the various sensors which collect environmental data (Table 3). These lists are non-exhaustive but will add to and update previous collated data from reviews.
SRS data used in the studies came from multiple satellite sensors (Figure 2). A full glossary of the sensor acronyms can be found in Supplementary Table S3. The sensor used to collect the environmental data were specified for 64% of variables (Supplementary Figure S4), with the most commonly used sensors being AVHRR (n = 42), MODIS (n = 42), and SeaWiFS (n = 27), together providing 90% of the SRS variable data. The sensors used in the reviewed articles were primarily passive optical sensors, with bands at visible and infrared wavelengths. Most sensors used were onboard polar orbiting satellite platforms, delivering frequent global coverage (approximately every day) at spatial resolutions typically of the order of a few kilometers. One sensor onboard a geostationary orbiting satellite was used for SST retrieval (in combination with SST data from other polar orbiting satellites) (Domeier et al., 2012), the GOES (Geostationary Operational Environmental Satellite) Imager, a four-channel visible and infrared radiometer capable of imaging the western hemisphere every 30 min. In addition, two microwave sensors were used; the AMSR-E passive microwave radiometer was used for SST observations (n = 4) (Domeier et al., 2012) and the SeaWinds active microwave scatterometer provided wind data in one study (Wickham, 2011).
Importantly, the spatial and temporal resolution of the SRS data products used varied considerably between studies: spatial resolutions ranged from 1 km to over 100 km and temporal resolutions from daily to monthly. The spatial and temporal resolutions of SRS-derived variables used in the reviewed articles are summarized in Table 4.
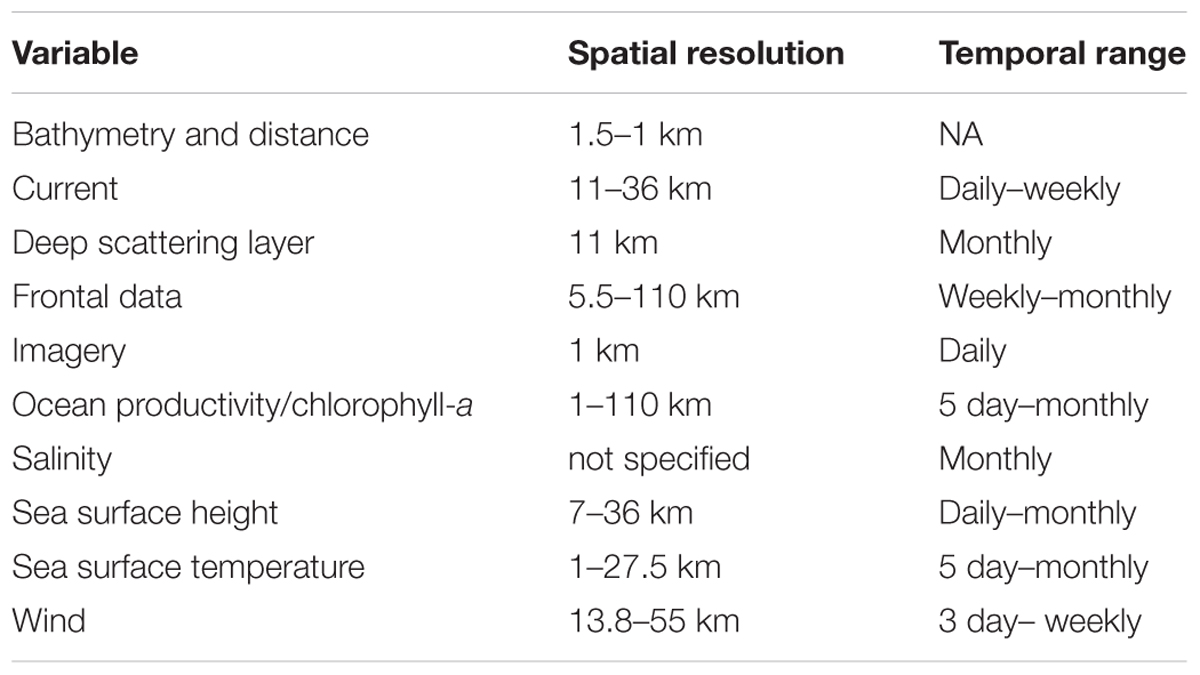
Table 4. Variable categories and ranges of spatial and temporal resolution from the literature search.
Applications of SRS Data
Habitat Use and Distribution
Most studies identified in this review used SRS to investigate habitat use and the distribution of elasmobranch populations (n = 48, 67%). Only by understanding where animals reside, and how they move, can the impact of their threats be evaluated. Reynolds et al. (2017) combined remotely sensed SST and chlorophyll-a with movement data from satellite telemetry to show that large areas of suitable habitat for whale sharks were not covered by the marine protected area (MPA) network in the south-eastern Indian Ocean. Oh et al. (2017) used SST from the SeaWiFS sensor in combination with baited remote underwater video systems to map species specific habitat requirements for juvenile sharks, the management of which is important for the survival and persistence of coastal shark species (Cortés, 2002). Furthermore, Lea et al. (2015) found that SST may trigger summer migrations in tiger sharks (Galeocerdo cuvier) in the northwest Atlantic. This baseline information on habitat use is of critical importance in elasmobranch conservation and has been the main focus of studies using SRS, reflecting both the relative novelty of this technology as well as the lack of baseline ecological data for many elasmobranch species globally (Dulvy et al., 2014). This and the other main applications of SRS in elasmobranch research are summarized in Figure 3.
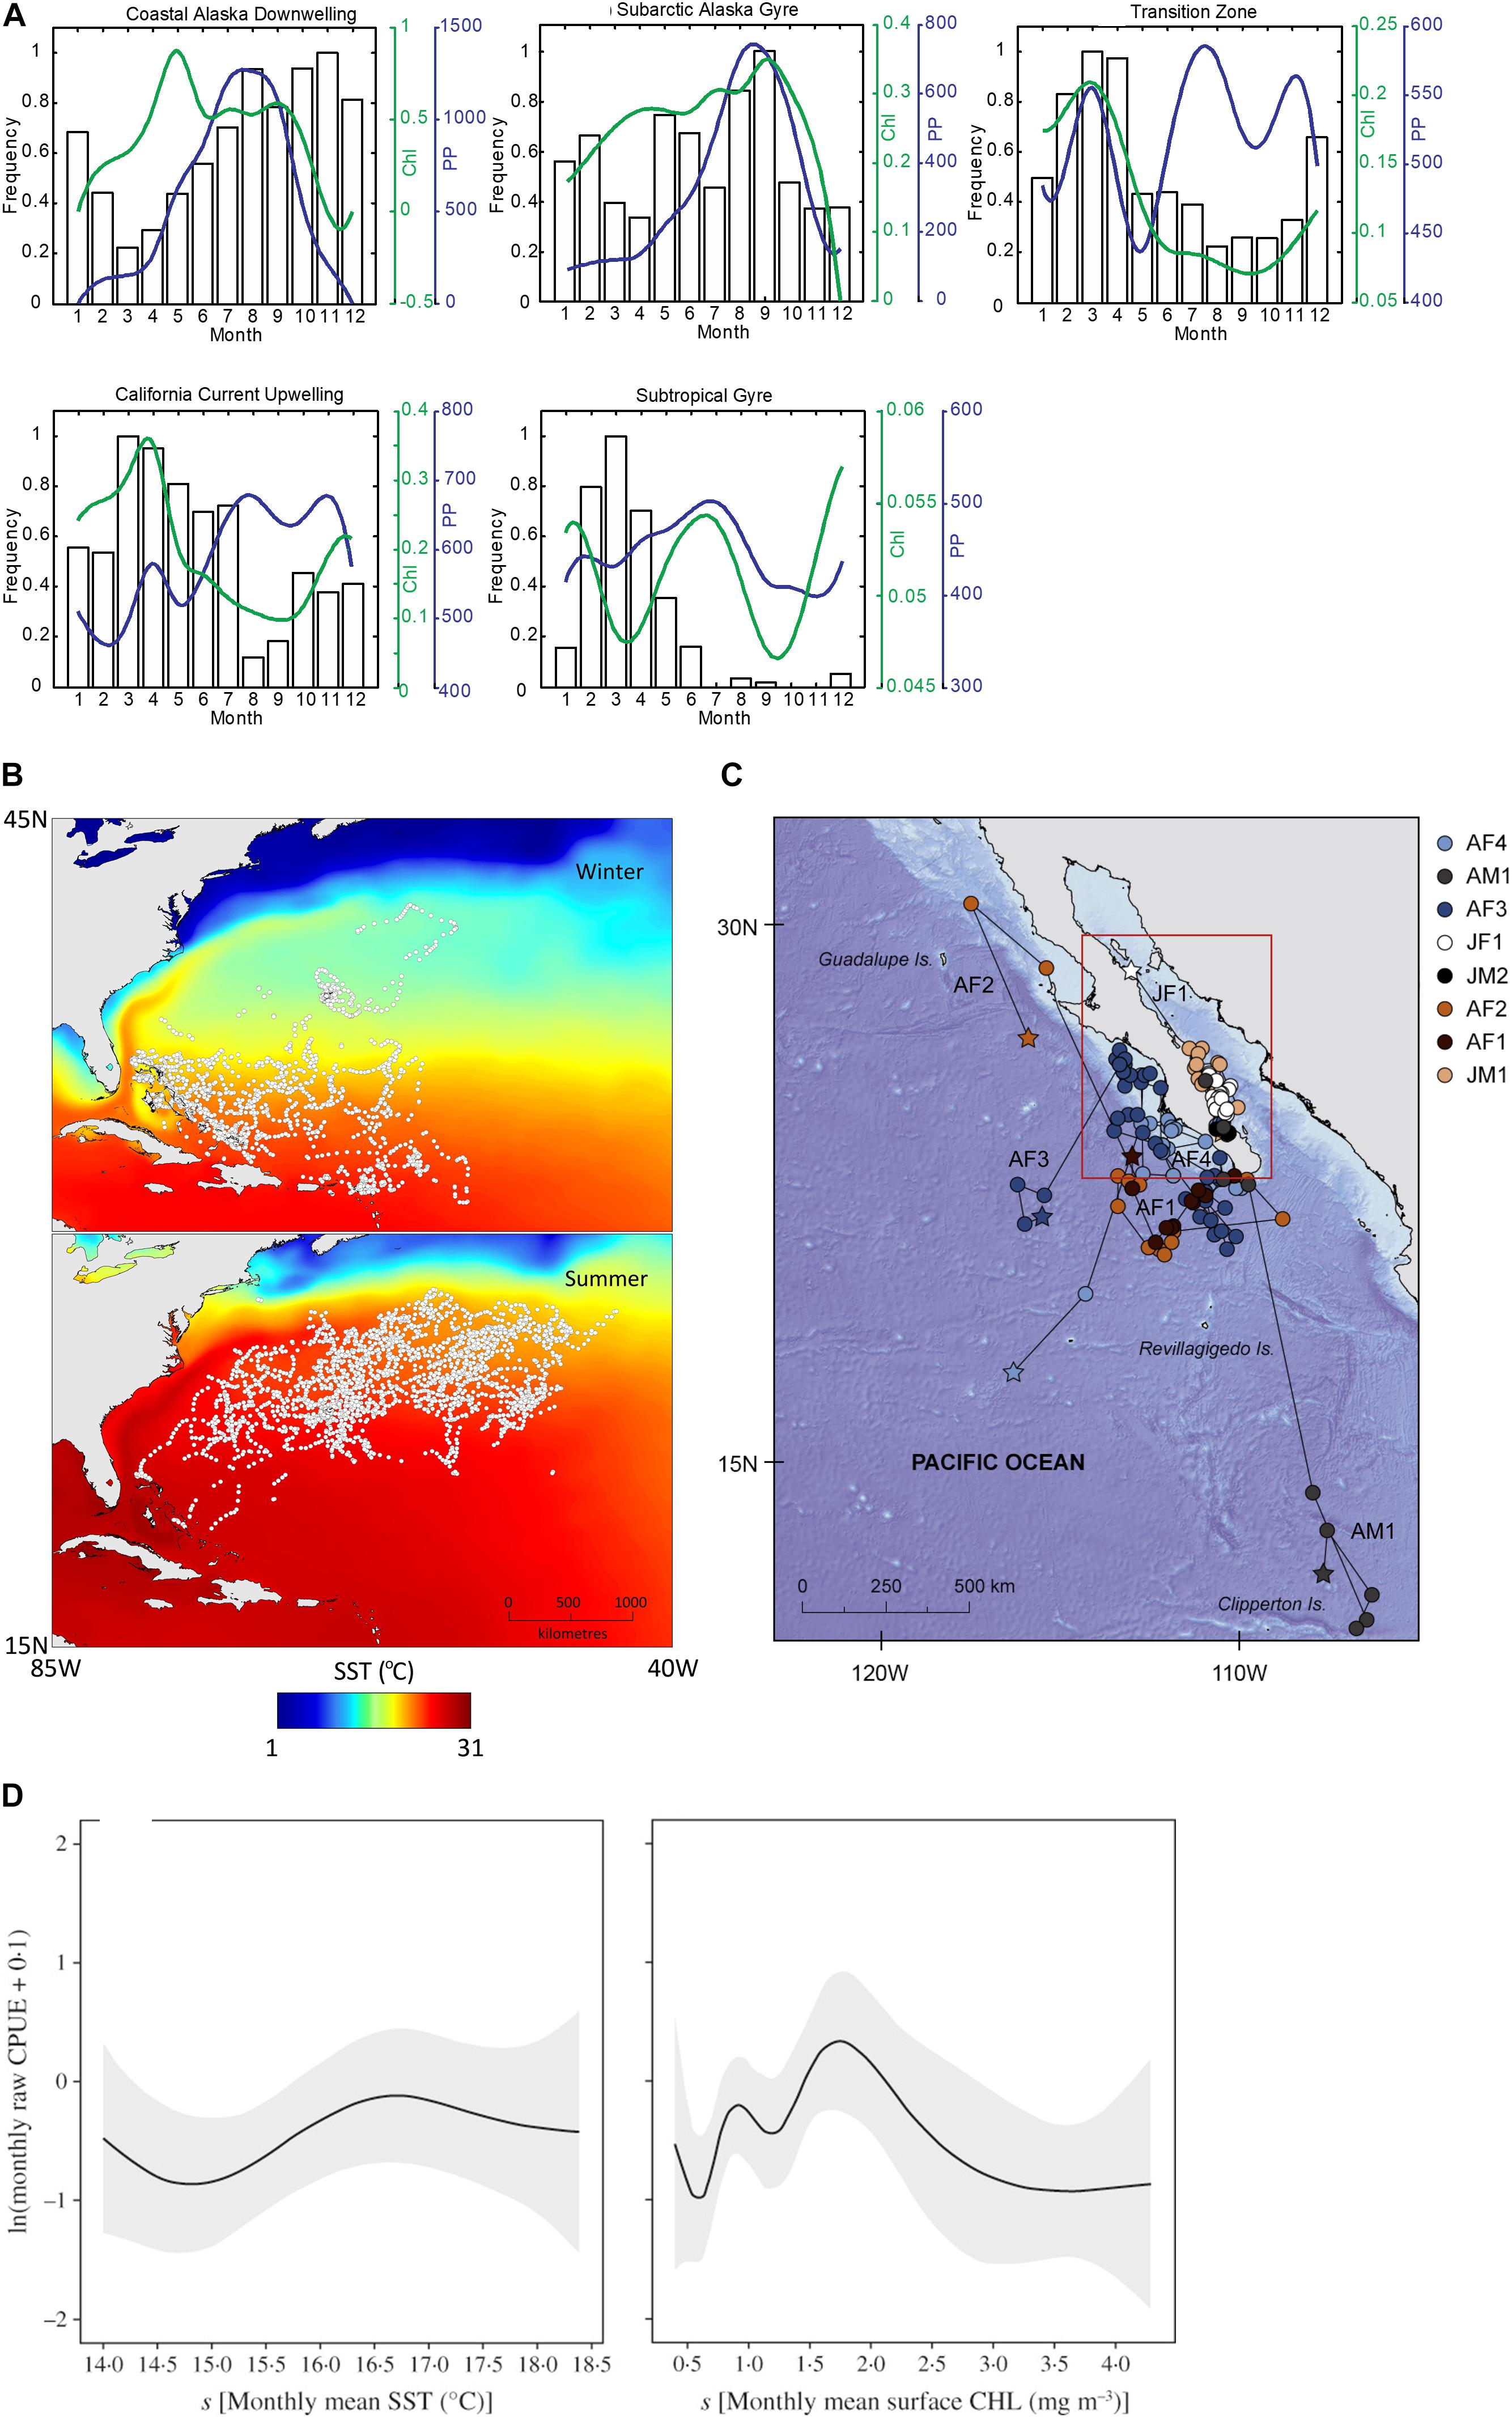
Figure 3. Example uses of SRS in elasmobranch research themes. (A) Seasonal utilization of foraging regions for migrating salmon sharks, Lamna ditropis, compared to monthly median cholorophyll-a (Chl) concentration and primary production (PP) (Weng et al., 2008). (B) Geolocations of tiger sharks, Galeocerdo cuvier, between winter and summer, overlaid on mean seasonal SST (Lea et al., 2015). (C) Geolocated tracks of whale sharks, Rhincodon typus, reconstructed using remotely sensed SST (Ramírez-Macías et al., 2017). (D) Monthly mean sea surface temperature (SST) and monthly mean surface chlorophyll a concentration (CHL) and blue shark, Prionace glauca, catch per unit effort (CPUE, total number fish caught per total number fishing trips) (Mitchell et al., 2014).
Fisheries
A total of nine studies (13%) integrated SRS variables with fishery data. When SRS was applied to elasmobranch fisheries, SST (primarily from AVHRR sensor) and chlorophyll-a (primarily from MODIS Aqua/Terra or SeaWiFS sensors) were principally utilized. In the reviewed articles, SST and chlorophyll-a were used to inform interactions for stock assessment models, explore spatial distributions, investigate factors affecting catch rates, and for developing models for predicting fishery catches of commercial elasmobranch species (Bigelow et al., 1999; Iglesias et al., 2004; Carvalho et al., 2011; Novianto et al., 2016). For example, Carvalho et al. (2011), Mitchell et al. (2014) and Novianto et al. (2016) all used SRS data to find optimal abiotic factors for peak catch per unit effort of blue sharks, Prionace glauca, in the southwest Atlantic Ocean, English Channel and Indonesia, respectively, whilst Solanki et al. (2003) found that using SST and chlorophyll-a to predict fishing zones increased catch per unit effort in elasmobranch fisheries in India.
Track Reconstruction
A total of seven studies (10%) used SRS data to reconstruct movement tracks from electronic tag datasets. SST is used in post-processing models to correct raw geolocations from tagging technologies, such as PSAT tags, to increase the horizontal accuracy of animal movement tracks (Ferreira et al., 2018). For example, Queiroz et al. (2010) matched tag-derived SST values with SRS-derived SST values to acquire more precise latitudinal estimates for the movements of blue sharks in the north-eastern Atlantic Ocean. PSAT tags require a substantial amount of extrapolation and interpolation to reconstruct the horizontal movements of elasmobranchs and SRS data can be essential in this post-processing.
Foraging Ecology
A small number of articles (n = 7, 10%) used SRS to study elasmobranch foraging ecology. For example, Weeks et al. (2015) used SST, chlorophyll-a and photic depth to show that anomalous river discharge levels can trigger feeding frenzies in reef manta rays and several elasmobranch species have been found to shift foraging strategies when entering areas of high primary productivity (Sims and Quayle, 1998; Weng et al., 2008; Humphries et al., 2010). For studies exploring foraging ecology, the course spatial resolution of SRS data [which may be 50 km2 or more (see Table 3)] compared to the area of the foraging study (typically measured in the order of seconds of latitude) has led to researchers using in situ observations, such as those from the Argos program (Roemmich et al., 2009), conductivity, temperature and depth profilers (CTDs) (Hayes et al., 1984), or sensors on tagging technologies (Wilson et al., 2005; Teo et al., 2009), rather than SRS data. However, increasing spatial resolution and reduced costs of SRS data mean that SRS can play an important role in future investigations of elasmobranch feeding and foraging.
Limitations of SRS
Despite the benefits offered by SRS in multiple areas of elasmobranch research, satellite observations also have their limitations. The relatively coarse spatial resolution of SRS data can affect their application to many research topics, as spatial and temporal variability in environmental conditions can affect all types of animal movement at any scale (Dodge et al., 2013). High variability over a research area can pose a particular issue for those studies investigating large scale movement (Dodge et al., 2013). Restrictions in temporal resolution, either from mission design or cloud cover, may reduce the capabilities of a study to capture events or changes in environmental dynamics that occur over short periods of time (Pettorelli et al., 2018). Constraints on spatial resolution of SRS data can also be a limiting factor. Position data of elasmobranch occurrence for research into behavior and ecology is available from a variety of sources, such as satellite or acoustic telemetry, fishery data, and boat or aerial-based surveys (Cartamil, 2009; Nadon et al., 2012; Sequeira et al., 2014; Lea et al., 2015; Weeks et al., 2015). The spatial error of these data sources is generally much smaller than the spatial resolution for most SRS-derived data (Espinoza et al., 2011; Hammerschlag et al., 2011), which for marine environmental variables is rarely less than 300 m and can be up to 50 km (Donlon et al., 2012; Table 3). As such, there is a still degree of mismatch in resolutions between position/movement data and SRS data. This, however, is becoming less of a problem, as recent and proposed satellite launches are greatly increasing the spatial resolution of available environmental data. For example, commercial satellite sensors now have spatial resolutions < 1 m and free and open data is available with pixel sizes as low as 10–60 m, depending on the band (Pettorelli et al., 2018); all of which are within the error associated with marine tagging and movement technologies (Palmer et al., 2015).
Due to technical limitations, SRS data is only sensitive to surface environmental conditions (Takano et al., 2009; Chassot et al., 2011). Ocean environmental variables are seldom uniform, and elasmobranchs rarely inhabit a narrow, shallow range in the water column. Analyzing changes of environmental variables on a vertical scale, and how they affect elasmobranch behavior, is a relatively novel, but important, area of research, particularly given the number of species that make diel vertical migrations (Takano et al., 2009). The integration of SRS data with models can help overcome this limitation and tell us what is in deeper layers of the ocean (Brodie et al., 2018; Kvile et al., 2018). For details see “Future Directions and Opportunities.”
In many of the reviewed articles, SRS was used as the source of environmental data to investigate the influence of abiotic factors on elasmobranch movement (Weng et al., 2008; Humphries et al., 2010; Sims et al., 2012). The use of SRS for movement ecology is dependent on the type of tag used for positional data collection. SRS-derived data is regularly used with satellite tagging studies [e.g., SST (Lea et al., 2015), sea surface height (Vandeperre et al., 2016) and primary productivity (Vaudo et al., 2017)], but for certain variables (such as temperature and salinity), tag-derived data and in situ measurements are preferred (Stokesbury et al., 2005; Wilson et al., 2006; Stevens et al., 2010; Hammerschlag et al., 2011). Studies that use acoustic telemetry for positional data primarily use in situ measurements due to the coarse spatial resolution of SRS data. However, many tagging technologies that record detailed environmental data, such as conductivity, temperature and depth satellite delay relay loggers (Boehme et al., 2009; Roquet et al., 2014), are still not appropriate for elasmobranchs, and the use of in situ measurements for species that move large distances is unrealistic (Dodge et al., 2013). As such, increased integration of SRS-derived environmental variables with both satellite and acoustic telemetry is expected to increase in the future as satellite data becomes more readily available and accessible, and as sensor capabilities continue to improve (Pettorelli et al., 2018).
An important finding of the systematic review was that the inclusion of SRS metadata in research articles was extremely variable (Supplementary Figure S4). Notably, many articles did not include key metadata, making it difficult to both interpret and replicate these studies. Furthermore, for those studies that did present metadata information, the presentation was neither consistent nor standardized, further complicating critical assessment of the different methods. Details such as spatial and temporal resolution are important as the required characteristics of SRS data depend on its application. In coastal zones, processes typically occur at small spatial scales and waters are often optically complex. They require greater spatial resolution and an increased number of spectral bands compared to the open ocean, where changes occur over much larger scales and sensors with low spatial resolution and fewer spectral bands are sufficient (Lee and Carder, 2002; Lee et al., 2007). Without the spatial and temporal resolution of the data the conclusions of an investigation cannot be fully appraised. A standardized approach to reporting SRS information in research articles should be adopted to enable transparency and reproducibility, and to facilitate more efficient exchange of information between SRS experts and marine research communities (Cooper and Gavin, 2005; Balestro et al., 2013).
Gaps Identified
Our review highlighted the following research gaps in the application of SRS within elasmobranch ecology, conservation and management:
Limited Set of Environmental Variables Used
The majority of studies used SST and chlorophyll-a, and only a small number used three or more environmental variables in concert (Weng et al., 2008; Hacohen-Domené et al., 2015; Vandeperre et al., 2016; Lopez et al., 2017). Multiple other variables available from SRS, such as salinity, wind speed and ocean current, frequently influence elasmobranch behavior (Schlaff et al., 2014), yet were rarely used in elasmobranch research (Figure 2). In particular, despite the importance of salinity in driving elasmobranch movements (Hopkins and Cech, 2003; Ubeda et al., 2009; Schlaff et al., 2014), only two studies used SRS-derived salinity data.
Limited Use of European SRS Data
Despite its utility for studying the ecology of other wide-ranging marine predators, e.g., Pardo et al. (2015), Bailey et al. (2018), ESA data were used infrequently in elasmobranch research and data from ESA’s Sentinel satellites were not used in any of the studies in our review. This may reflect the fact that historically satellite data from the United States has been easier to access than European data. Until recently ESA products, such as those from the Medium Resolution Imaging Spectrometer (MERIS), were available only after an application process (Verstraete et al., 1999; Bezy et al., 2000), which may have limited their use. In addition, Sentinels 1, 2 and 3 were only relatively recently launched, and this is likely to cause a delay in the publication of studies using these satellites. The Sentinel satellites offer huge potential for investigations of marine megafauna, as detailed in the “Future Directions and Opportunities” section.
Limited Use of Google Earth Engine
Interestingly, one major repository of SRS data not found in the reviewed articles was Google Earth Engine (GEE). GEE is a cloud-based geoprocessing platform, launched in 2010, that enables access to a wide variety of SRS datasets, including the Landsat series, Sentinels-1, 2 and 3, and MODIS, for analysis either within Earth Engine or to download and analyze externally with other software (Gorelick et al., 2017). Although GEE has had some use in research on terrestrial fauna (Joshi et al., 2016; Lewis et al., 2017), use of GEE in wildlife research is still infrequent compared to other data sources, in both marine and terrestrial realms. One reason for the slow uptake may be because GEE requires knowledge of either JavaScript or Python coding languages. The time and steep learning curve associated with learning this new skill, may put some researchers off of utilizing GEE, despite its clear benefits.
SRS Data and Acoustic Telemetry Are Rarely Combined
Despite the frequent use of acoustic telemetry in elasmobranch research (Heupel et al., 2018), the use of SRS data with acoustic telemetry was not common. Although in situ data is currently the preferred source of environmental variables for studies involving acoustic telemetry, in remote oceanic regions, where many elasmobranch species reside, obtaining and managing in situ environmental data may be difficult and expensive. With the recent improvement in the spatial resolution of open access SRS data, we expect the number of studies integrating SRS and acoustic telemetry to increase markedly, particularly in remote oceanic regions.
Limited Use of SRS Data in Conservation and Management
Although SRS has become a powerful tool for the conservation of terrestrial wildlife it is less frequently used in the marine environment (Kachelriess et al., 2014). SRS can establish baselines of quality and extent of habitats, detect loss and recovery (Nagendra et al., 2013; Pettorelli et al., 2018), and monitor population sizes and anthropogenic threats to endangered species and biodiversity (Donohue and Foley, 2007; Fretwell et al., 2012; Pettorelli et al., 2018).
Minimal Representation of Threatened Taxa
Of the seven most threatened elasmobranch families (Dulvy et al., 2014) only two were represented in our review, Alopiidae and Squatinidae. No freshwater elasmobranchs, some of the most threatened elasmobranch species (Dulvy et al., 2014), featured in our selected articles. This is perhaps unsurprising as freshwater elasmobranchs have received considerably less attention than marine species (Martin, 2005). SRS of freshwaters poses its own unique challenges, as these environments are optically complex (Brezonik et al., 2015) and require higher spatial resolution data for analyses.
Future Directions and Opportunities
Based on the gaps identified in the systematic review, this section summarizes the potential advances in SRS sensors and methodologies for furthering elasmobranch research. It serves to highlight some of the future opportunities for integrating SRS with elasmobranch positional data, in addition to more direct applications for elasmobranch fisheries, habitat degradation and marine protected area (MPA) management.
Advances in SRS Sensors and Methods
Sentinel Satellites
ESA’s Sentinel satellites7 provide a wealth of data for marine research. The first Sentinel satellite, 1-A, was launched in 2014, carrying a C-band synthetic aperture radar (SAR). SAR is a form of radar that creates two dimensional images and has an advantage over optical sensors as it is not impeded by cloud cover or low light levels. SAR can be used to monitor oceanic waves, which provide data on wind speed, wind direction and wave height (Tomiyasu, 1978). Sentinel 1-A was followed by Sentinel 2 in 2015, which carries a high spatial resolution optical sensor primarily used for land and coastal monitoring, useful for studying change in important elasmobranch habitats, such as coastal zones and coral reefs (Malenovský et al., 2012). Sentinel 3, launched in 2016, measures ocean and land surface temperature, ocean and land surface color, and sea-surface topography. The Sentinel missions have a fundamental focus on providing ocean data at a higher resolution than earlier satellites and sensors, such as MODIS and SeaWiFS (Donlon et al., 2012; Malenovský et al., 2012). Data from the Sentinel series has already been a useful tool for research into other marine predators, for example predicting abundance and densities of cetacean species (Pardo et al., 2015; Bailey et al., 2018). As such, data from Sentinel satellites will provide an invaluable source of information for investigating elasmobranch ecology, conservation and management in the coming years.
Derived Products
Primary measurements obtained directly from SRS data, such as SST, chlorophyll-a, and wind speed, are typically used directly in research. However, these primary variables are actually proxies for other variables, such as oceanic fronts or upwelling regions, which are better representations of oceanic habitats (Hobday and Hartog, 2014). Although not as common as primary SRS products, derived SRS products have been used to investigate foraging ecology of seabirds and cetaceans (Tew Kai et al., 2009; Scales et al., 2014), habitat hotspots for pelagic sharks (Queiroz et al., 2016), movement physiology in marine mammals (Abrahms et al., 2018), and regions of marine biodiversity (Miller and Christodoulou, 2014). Using these derived products, as opposed to primary SRS products, may lead to improvements of predictive models and a better understanding of the behavioral drivers of marine fauna (Hobday and Hartog, 2014).
Predicting Vertical Profiles
Satellite products can be assimilated into models, such as the Hybrid Coordinate Ocean Model (HYCOM) (Chassignet et al., 2007), the Regional Ocean Modeling System (ROMS) (Haidvogel et al., 2008), or the Bluelink Ocean Data Assimilation System (BODAS) (Oke et al., 2008), that develop three-dimensional ocean models taking vertical differences into consideration. HYCOM assimilates satellite altimetry (sea surface height) and satellite SST, along with various in situ datasets, and generates predictions of environmental variables, such as water velocity, SST, and salinity, at depths from 0 to 5000 m (Cummings and Smedstad, 2013). Investigating drivers of vertical migrations will improve our ability to predict species occurrence, investigate foraging strategies, and assess the effect of anthropogenic disturbance on elasmobranch species (Sims et al., 2006; Comfort and Weng, 2015). Further developments in the incorporation of SRS data into models that predict vertical profiles will impact our current understanding of many species’ ecology. For example, vertical data from the Regional Ocean Modeling System (ROMS) increased the suitability of species distribution models for four pelagic species off the Californian coast (Brodie et al., 2018), and enabled modeling of the transport of zooplankton Calanus finmarchicus, an important food resource for commercially important fish species (Opdal and Vikebø, 2015).
Salinity
The integration of additional environmental variables into elasmobranch research, beyond the frequently used SST and chlorophyll-a, is likely, especially as new satellite products become available. There is potential for SRS-derived salinity data to be integrated into studies of mobile marine megafauna. Only with the launches of the European Space Agency’s (ESA) Soil Moisture and Ocean Salinity (SMOS) mission (Kerr et al., 2010) and NASAs Aquarius mission in the early 2010s has SRS-derived salinity been available to researchers. Retrospective analyses using new SRS data have been used previously, for example for determining levels of suspended matter (Dekker et al., 2002). Thus, using salinity data from both the Aquarius and SMOS missions, retrospective analyses on past data could expand our knowledge of marine fauna, such as elasmobranchs.
Investigating Multiple Environmental Drivers Simultaneously
The wide range of SRS products and sensors currently available offers greater scope for investigating multiple environmental drivers simultaneously. Future investigations using three or more environment variables will be important to not only help disentangle the mechanistic drivers of elasmobranch movement but also to fully understand how elasmobranch species may respond to human mediated changes in their environment (Schlaff et al., 2014). Integrating environmental variables with animal movement is challenging due to the size and frequency of data collected and at different temporal and spatial scales (Dodge et al., 2013; Ferreira et al., 2018). This is now being facilitated by tools such as Bio-ORACLE (Tyberghein et al., 2012), MARSPEC (Sbrocco and Barber, 2013), and R packages rsMove (Remelgado et al., 2018) and rerddapXtracto (Mendelssohn, 2017), which have been developed to aid this integration process more manageably. Increased access to new variables, the rise of cloud-based processing platforms such as Google Earth Engine or Amazon Web Services and the advances in multivariate statistical approaches will continue to facilitate this process and analyses further. In addition, new artificial intelligence initiatives, such as Microsoft’s “AI for Earth” and Google’s “AutoML” have led to an explosion in machine learning algorithms suitable for processing SRS-derived “big data” that will further progress this field.
Future Applications
Acoustic Telemetry
Most articles considered in this review used SRS-derived environmental data with satellite, rather than acoustic, telemetry as the source of elasmobranch positional data. Acoustic telemetry is particularly useful for investigating short term fine-scale, and long term meso-scale patterns on individual movement and behavior (Heupel et al., 2006; Meyer et al., 2010). The longer battery life of acoustic tags and often internal implantation allows individuals to be tracked over longer time scales (years rather than months) compared to satellite tags (Hays et al., 2007; Heupel et al., 2018). Acoustic arrays may vary in size from regional through to national and global networks (Heupel et al., 2018). Researchers are now generating shared repositories for acoustic data for multiple marine species [e.g., the Australian Integrated Marine Observing System (IMOS), (Hill et al., 2010); the Ocean Tracking Network, (Cooke et al., 2011); and Movebank, (Kranstauber et al., 2011)] that combine multiple “independent” arrays and provide acoustic tracking data at spatial scales more suitable for integration with most SRS products. Data from these integrated arrays, combined with SRS data, will present opportunities to measure movement responses to large spatial and temporal scale environmental and oceanographic processes (Hazen et al., 2012). Simultaneously, the increasing spatial resolution of SRS data is beginning to align with scales more appropriate for regional acoustic array integration.
eDNA
We envisage SRS playing an important role in elasmobranch conservation, particularly in conjunction with environmental DNA (eDNA). eDNA is an efficient and non-invasive way of sampling biodiversity, particularly useful for animals with restricted accessibility, such as cryptic or endangered species [for more information see Thomsen and Willerslev (2015) and Barnes and Turner (2016)]. Combining SRS environmental data with eDNA offers an opportunity to create species distribution and habitat maps to expand the biological knowledge and aid conservation management of threatened elasmobranch species (Boothroyd et al., 2016).
Population Monitoring
High spatial resolution satellite imagery (as opposed to satellite-derived variables), with resolutions now down to less than 1 m, can be used to identify and count individual animals and estimate abundance. Examples include; southern right whales (Eubalaena australis) (Fretwell et al., 2014); emperor penguins (Mirounga leonina) (Fretwell et al., 2012); southern elephant seals (Mirounga leonina) (McMahon et al., 2014); Weddell seals (Leptonychotes weddellii) (LaRue et al., 2011); and southern hairy-nosed wombats (Lasiorhinus latifrons) (Swinbourne et al., 2018). LaRue et al. (2017) identified three main characteristics of species to be successfully monitored by satellite imagery; open landscape; organism color that contrasts with the landscape; and sufficient organism size. Certain elasmobranch species may therefore be suitable for monitoring using satellite imagery. Given calm conditions, the ocean surface is a suitable landscape for detection, and certain species such as whale sharks, basking sharks (Cetorhinus maximus) and manta rays have both the requisite color contrasts with the landscape and sufficient size to be successfully identified using very high-resolution satellite imagery. Although potentially limited by time at the surface, as well as the high-cost involved, satellite imagery could be used as a viable non-invasive tool for population monitoring of elasmobranch species, far exceeding the coverage obtained through drone technologies currently being employed for this purpose (Rieucau et al., 2018).
Fisheries
There is great potential in integrating environmental data from SRS with elasmobranch catch data to improve the quotas within elasmobranch targeted fisheries, both enhancing efficiency and reducing overfishing (Chassot et al., 2010). For example, blue shark catch is thought to be constrained by SST, frontal data, sea surface height, and chlorophyll-a concentration (Bigelow et al., 1999; Queiroz et al., 2012; Mitchell et al., 2014; Selles et al., 2014). By monitoring chlorophyll-a, fishing effort can be streamlined, preventing overfishing by decreasing effort in periods of low primary productivity and increasing back to appropriate levels during periods of high productivity. As well as overfishing, bycatch of elasmobranchs in non-target industrial fisheries is a primary driver of elasmobranch declines (Molina and Cooke, 2012; Dulvy et al., 2014). Current bycatch reduction methods are primarily based on regulation of fishing zones (Molina and Cooke, 2012). However, data on diel and seasonal variability in bycatch species is needed for efficient implementation, which is not always available (Molina and Cooke, 2012). SRS might be used to investigate baseline data on environmental drivers of elasmobranch bycatch, as well as subsequently informing spatial and temporal closures of fishing zones. To our knowledge this has not currently been undertaken in elasmobranch species, however, it has been used effectively to limit bycatch of loggerhead (Caretta caretta) and leatherback (Dermochelys coriacea) turtles in Hawaiian pelagic longline fisheries (Howell et al., 2008, 2015).
In recent years, dynamic ocean management, where management changes spatially and temporally depending on observed biological, oceanographic and socio-economic data, has increased (Maxwell et al., 2015; Dunn et al., 2016). Dynamic ocean management can greatly improve the efficiency of management of fishery catches and closures (Dunn et al., 2016). Using near-real-time SRS data, such as ocean color data from Sentinel-3, would improve the efficiency of dynamic management, helping avoid overfishing of already depleted stocks as well as preventing food security and economic uncertainty in fishery-dependent countries (Chassot et al., 2010). Increased availability and resolution, and decreased costs of SRS data might therefore improve dynamic ocean management by reducing bycatch rates and enhancing the efficiency of targeted elasmobranch fisheries (Dunn et al., 2016).
Allocation of fishing efforts, as well as control of fishing mortality, can aid in preventing overfishing (Maunder, 2002). High-resolution SRS imagery for vessel presence, used in conjunction with the Automatic Identification System (AIS), can calculate vessel density, fishing effort, rate of unreported vessels in specific fisheries, monitor vessel responses to management changes, identify illegal vessel numbers in closed regions, and reduce costs of current surveillance and control measures (Kourti et al., 2005; Corbane et al., 2010; Brusch et al., 2011; Bradley et al., 2018). Use of SRS for this purpose to date has been limited due to insufficient spatial coverage of very high-resolution imagery (Kourti et al., 2005) and because AIS systems are not a pre-requisite on all fishing vessels (Bradley et al., 2018). However, significant progress is envisaged in the next few years due to increased satellite numbers and coverage, and mandatory vessel monitoring systems. SRS has potential for monitoring vessels where AIS may not be present, such as artisanal and illegal, unreported and unregulated IUU) fishing vessels. Tools such as the Search for Unidentified Maritime Objects (SUMO) ship detector (Greidanus et al., 2017), the Integrated System for Surveillance of Illegal, Unlicensed and Unreported Fishing (INSURE) (Kurekin et al., 2019), and VIIRS boat detection data (Elvidge et al., 2018; Oozeki et al., 2018), have enabled real-time detection of IUU vessels, and the identification of vessels down to 1 m and fishing vessels using lights to attract catch, all of which can enable detection of illegal fishing by smaller artisanal vessels further aiding enforcement decisions. These systems could make SRS a powerful tool for surveillance and control, particularly in remote areas where little or no enforcement is currently undertaken (Corbane et al., 2010; Kachelriess et al., 2014).
Habitat Degradation
Land use change damages marine as well as terrestrial biodiversity (Kachelriess et al., 2014), with fertilizer use, land clearing and sediment run off, significantly impacting marine environments (Fabricius, 2005; Chérubin et al., 2008). In addition, sea level rise may severely impact important habitats, such as nesting areas, of marine fauna (Baker et al., 2006; Fuentes et al., 2010). The spectral signatures from SRS data can be used to monitor changes in the seas and oceans, such as turbidity, depth, temperature, salinity, sea surface height, and flow, all of which can impact elasmobranch species (Doxaran et al., 2002; Knip et al., 2010; Kachelriess et al., 2014). In the last decade SRS has been developed sufficiently to detect oil spills (Brekke and Solberg, 2005; Klemas, 2010), allowing the early detection, tracking and prediction of spills to be monitored, which is important for clean-up and effective counter measures (Kachelriess et al., 2014). Furthermore, there is potential for the development of hyperspectral sensors to monitor ocean plastic pollution (Kachelriess et al., 2014), and although full scale research is yet to be undertaken in this area, a proof of concept for this methodology has already been established (Garaba et al., 2018). SRS variables, such as ocean current, wind and SST, have been used to guide surveys to monitor levels of plastic debris in the Pacific Ocean (Pichel et al., 2007) and to assess the seasonality in risk of marine debris to Hawaiian monk seal (Monachus schauinslandi) populations, aiding their management (Donohue and Foley, 2007). Thus, SRS shows huge potential for monitoring dynamic threats to marine animals, including elasmobranchs, in future.
SRS data and high-resolution imagery is also likely to play a role in monitoring important elasmobranch habitats, such as mangroves and coral reefs, that act as nursery areas or refugia by evaluating the distribution, health status, productivity, resilience and resistance to change over time (Kuenzer et al., 2011; Duncan et al., 2018). SRS-derived SST and altimetry data can also monitor events, such as bleaching and sea level rise that may harm coral reef populations (Hoegh-Guldberg, 1999; Hughes et al., 2003). By identifying key factors influencing bleaching or disease events, such as coral cover and coral type, SRS might help generate metrics for evaluating and predicting the health of coral reef ecosystems (Hochberg et al., 2003; Xu and Zhao, 2014). Although mangroves and coral reef systems have been monitored using SRS, further development, and integration with elasmobranch ecological data is required. Global mapping of both mangrove and coral systems is limited or non-existent, and unified classification systems for monitoring mangroves and coral reefs are not available (Heumann, 2011; Xu and Zhao, 2014). Development in these areas will greatly aid elasmobranch monitoring, conservation and management.
Marine Protected Areas
Outside of fishery management, a primary model for elasmobranch conservation has been the establishment of marine protected areas (MPAs) (Davidson, 2012). Although the effectiveness of MPAs for elasmobranch conservation is still under debate (Davidson, 2012; Dulvy, 2013; Hilborn, 2015), MPAs have been shown to have measurable benefits to elasmobranch populations (Garla et al., 2005; Knip et al., 2012; White et al., 2017). The success and efficacy of MPAs are determined by multiple factors, with habitat identification being a critical feature (Edgar et al., 2014). SRS will likely become increasingly useful for monitoring environmental correlates of marine biodiversity, such as primary productivity, temperature and ocean currents, which may in turn be used for the identification of appropriate habitats and biological hotspots to feed into MPA designation (Palacios et al., 2006; Platt and Sathyendranath, 2008; Kachelriess et al., 2014). Further, SRS data may also play a role in the direct assessment of current MPAs for the conservation of elasmobranch species (White et al., 2017). Considering the dynamic, changing and unpredictable nature of certain marine zones, dynamic MPAs, developed with near-real-time SRS data, that vary spatio-temporally have been proposed (Hobday and Hartmann, 2006; Game et al., 2009). In addition, enforcement plays an important role in the success of MPAs (Edgar et al., 2014). As discussed, both high-resolution optical satellites, synthetic aperture radars and AIS provide options to aid and enhance enforcement efforts in MPAs by monitoring vessel presence and movement via imagery (Kourti et al., 2005; Corbane et al., 2010). In addition, SRS-derived data could be used to identify habitat hot spots within MPAs for more directed enforcement effort (Ross et al., 2011; Irigoyen et al., 2018). Consequently, we feel SRS will play a valuable role for the selection and enforcement of MPAs in future.
Conclusion
To our knowledge, this is the first systematic review of the use of satellite remote sensing in shark and ray ecology, conservation and management. Substantial progress in this field has been made in the last 10 years with remotely sensed environmental data facilitating significant advances in our understanding of species distributions, habitat use and movement, particularly for highly-mobile elasmobranchs. SRS data are now regularly integrated with satellite telemetry to address questions about elasmobranch ecology and behavior. Principally from free and open data sources, researchers now have access to a suite of environmental variables for analyses at varying resolutions, from multiple satellite sensors. Therefore, to support future research in this field, we have compiled inventories of online repositories for satellite data and current sensors available for the marine realm.
This review has identified several significant research gaps where satellite remote sensing has yet to be fully utilized. Most studies focused on SST and chlorophyll-a, and the wide range of satellite variables accessible to researchers are rarely combined to explore collective influence. Future studies would benefit from investigating multiple variables simultaneously and incorporating additional SRS variables that influence elasmobranch movements, such as salinity and ocean currents. Despite being a valuable source of marine data, use of European satellites has so far been limited in elasmobranch studies. In addition, the use of SRS has been restricted to marine elasmobranchs and, although presenting its own challenges, SRS for the conservation of freshwater species should also be explored. Application of SRS is limited by the coarse spatial resolution of many current satellite products but sensor capabilities are continually improving. Furthermore, we identified a need for more consistent reporting of SRS metadata for variables used in analyses to facilitate reproducibility.
There are substantial opportunities for satellite remote sensing to further advance our understanding of elasmobranchs and other marine fauna in the future. The improved availability and resolution of free and open satellite data sources, such as ESA’s Sentinel missions, and the increased use of derived and modeled SRS ocean products, will enhance the accuracy of predictive models and improve our understanding of behavioral and ecological processes. The increasing number of networks of receivers with national and international programs, and collaborations within the research community, combined with increased spatial resolution of SRS data, will improve the application of SRS with acoustic telemetry. These developments will aid in future applications for conservation and management, particularly in the areas of population monitoring, fisheries, habitat degradation and MPA design/management. This will have a huge impact particularly for species occupying remote ocean regions, where resources for science are scarce, where in situ data is often lacking and where little protection is afforded to them.
Data Availability
All datasets generated for this study are included in the manuscript and/or the Supplementary Files.
Author Contributions
MW, ET, and DJ conceived the review. MW conducted the literature survey methodology, analyzed the data, led the writing of the paper and prepared figures and tables. ET, DJ, and TD provided guidance on the survey design and analysis. All authors contributed to editing the manuscript.
Funding
This work was supported by the Natural Environment Research Council (Grant No. NE/L002485/1) to MW, as part of the London NERC Doctoral Training Partnership. Funding to DJ was provided by the Bertarelli Foundation and contributed to the Bertarelli Programme in Marine Science.
Conflict of Interest Statement
The authors declare that the research was conducted in the absence of any commercial or financial relationships that could be construed as a potential conflict of interest.
Acknowledgments
This review was undertaken as part of the Ph.D. thesis of MW, at the Department of Geography, King’s College London and the Institute of Zoology, London. The authors would like to thank the two reviewers for their comments to help improve the manuscript.
Supplementary Material
The Supplementary Material for this article can be found online at: https://www.frontiersin.org/articles/10.3389/fmars.2019.00135/full#supplementary-material
Footnotes
- ^ http://www.argo.ucsd.edu/
- ^ http://wok.mimas.ac.uk/
- ^ https://www.scopus.com
- ^ https://scholar.google.co.uk/
- ^ http://latitude.to/
- ^ https://www.iucnredlist.org
- ^ https://sentinel.esa.int/web/sentinel/missions
References
Abrahms, B., Scales, K. L., Hazen, E. L., Bograd, S. J., Schick, R. S., Robinson, P. W., et al. (2018). Mesoscale activity facilitates energy gain in a top predator. Proc. R. Soc. B 285:20181101. doi: 10.1098/rspb.2018.1101
Andrews, K. S., Williams, G. D., Farrer, D., Tolimieri, N., Harvey, C. J., Bargmann, G., et al. (2009). Diel activity patterns of sixgill sharks, Hexanchus griseus: the ups and downs of an apex predator. Anim. Behav. 78, 525–536. doi: 10.1016/j.anbehav.2009.05.027
Armitage, A., and Keeble-Allen, D. (2008). Undertaking a structured literature review or structuring a literature review: tales from the field. Electron. J. Bus. Res. Methods 6, 103–114.
Bailey, H., Hazen, E., Mate, B., Bograd, S. J., Irvine, L., Palacios, D. M., et al. (2018). “8 lessons learned from whalewatch,” in Satellite Remote Sensing for Conservation Action: Case Studies from Aquatic and Terrestrial Ecosystems, eds G. M. Buchanan and A. K. Leidner (Cambridge: Cambridge University Press), 229. doi: 10.1017/9781108631129.009
Baker, J. D., Littnan, C. L., and Johnston, D. W. (2006). Potential effects of sea level rise on the terrestrial habitats of endangered and endemic megafauna in the Northwestern Hawaiian islands. Endanger. Species Res. 2, 21–30. doi: 10.3354/esr002021
Balestro, G., Piana, F., Fioraso, G., Perrone, G., and Tallone, S. (2013). Sharing data and interpretations of geological maps via standardised metadata and geoportals. Ital. J. Geosci. 132, 254–262. doi: 10.3301/IJG.2012.35
Barnes, M. A., and Turner, C. R. (2016). The ecology of environmental DNA and implications for conservation genetics. Conserv. Genet. 17, 1–17. doi: 10.1007/s10592-015-0775-4
Baum, J. K., Myers, R. A., Kehler, D. G., Worm, B., Harley, S. J., and Doherty, P. A. (2003). Collapse and conservation of shark populations in the Northwest Atlantic. Science 299:389. doi: 10.1126/science.1079777
Beel, J., and Gipp, B. (2009). “Google scholar’s ranking algorithm: an introductory overview,” in Proceedings of the 12th International Conference on Scientometrics and Informetrics (ISSI’09), Vol. 1, eds B. Larsen, and J. Leta (Rio de Janeiro: International Society for Scientometrics and Informetrics), 230–241.
Bezy, J., Delwart, S., and Rast, M. (2000). MERIS-a new generation of ocean-colour sensor onboard Envisat. ESA Bull. 103, 48–56.
Bigelow, K. A., Boggs, C. H., and He, X. (1999). Environmental effects on swordfish and blue shark catch rates in the U.S. North Pacific longline fishery. Fish. Oceanogr. 8, 178–198. doi: 10.1046/j.1365-2419.1999.00105.x
Block, B. A., Jonsen, I. D., Jorgensen, S. J., Winship, A. J., Shaffer, S. A., Bograd, S. J., et al. (2011). Tracking apex marine predator movements in a dynamic ocean. Nature 475:86. doi: 10.1038/nature10082
Boehme, L., Lovell, P., Biuw, M., Roquet, F., Nicholson, J., Thorpe, S. E., et al. (2009). Animal-borne CTD-satellite relay data loggers for real-time oceanographic data collection. Ocean Sci. 5, 685–695. doi: 10.5194/os-5-685-2009
Bonfil, R. (1997). Status of shark resources in the southern Gulf of Mexico and Caribbean: implications for management. Fish. Res. 29, 101–117. doi: 10.1016/S0165-7836(96)00536-X
Boothroyd, M., Mandrak, N. E., Fox, M., and Wilson, C. C. (2016). Environmental DNA (eDNA) detection and habitat occupancy of threatened spotted gar (Lepisosteus oculatus). Aquat. Conserv. Mar. Freshw. Ecosyst. 26, 1107–1119. doi: 10.1002/aqc.2617
Bornatowski, H., Braga, R. R., and Vitule, J. R. S. (2014). Threats to sharks in a developing country: the need for effective simple conservation measures. Nat. Conserv. 12, 11–18. doi: 10.4322/natcon.2014.003
Bradley, D., Mayorga, J., Mccauley, D. J., Cabral, R. B., Douglas, P., and Gaines, S. D. (2018). Leveraging satellite technology to create true shark sanctuaries. Conserv. Lett. 2018:e12610. doi: 10.1111/conl.12610
Bramer, W. M., Giustini, D., and Kramer, B. M. R. (2016). Comparing the coverage, recall, and precision of searches for 120 systematic reviews in embase, medline, and google scholar: a prospective study. Syst. Rev. 5:39. doi: 10.1186/s13643-016-0215-7
Bramer, W. M., Giustini, D., Kramer, B. M. R., and Anderson, P. F. (2013). The comparative recall of google scholar versus pubmed in identical searches for biomedical systematic reviews: a review of searches used in systematic reviews. Syst. Rev. 2, 115–115. doi: 10.1186/2046-4053-2-115
Brekke, C., and Solberg, A. H. S. (2005). Oil spill detection by satellite remote sensing. Remote Sens. Environ. 95, 1–13. doi: 10.1016/j.rse.2004.11.015
Brezonik, P. L., Olmanson, L. G., Finlay, J. C., and Bauer, M. E. (2015). Factors affecting the measurement of CDOM by remote sensing of optically complex inland waters. Remote Sens. Environ. 157, 199–215. doi: 10.1016/j.rse.2014.04.033
Brodie, S., Jacox, M. G., Bograd, S. J., Welch, H., Dewar, H., Scales, K. L., et al. (2018). Integrating dynamic subsurface habitat metrics into species distribution models. Front. Mar. Sci. 5:219. doi: 10.3389/fmars.2018.00219
Brusch, S., Lehner, S., Fritz, T., Soccorsi, M., Soloviev, A., and Schie, B. V. (2011). Ship surveillance with TerraSAR-X. IEEE Trans. Geosci. Remote Sens. 49, 1092–1103. doi: 10.1109/TGRS.2010.2071879
Burgess, G. H., Beerkircher, L. R., Cailliet, G. M., Carlson, J. K., Cortés, E., Goldman, K. J., et al. (2005). Is the collapse of shark populations in the Northwest Atlantic Ocean and Gulf of Mexico real? Fisheries 30, 19–26. doi: 10.1577/1548-8446(2005)30[19:ITCOSP]2.0.CO;2
Cartamil, D. P. (2009). Movement Patterns, Habitat Preferences, and Fisheries Biology of the Common Thresher Shark (Alopias vulpinus) in the Southern California Bight. Ph.D. thesis, UC San Diego, San Diego, CA.
Cartamil, D. P., Vaudo, J. J., Lowe, C. G., Wetherbee, B. M., and Holland, K. N. (2003). Diel movement patterns of the Hawaiian stingray, Dasyatis lata: implications for ecological interactions between sympatric elasmobranch species. Mar. Biol. 142, 841–847. doi: 10.1007/s00227-003-1014-y
Carvalho, F. C., Murie, D. J., Hazin, F. H. V., Hazin, H. G., Leite-Mourato, B., and Burgess, G. H. (2011). Spatial predictions of blue shark (Prionace glauca) catch rate and catch probability of juveniles in the southwest Atlantic. ICES. J. Mar. Sci. 68, 890–900. doi: 10.1093/icesjms/fsr047
Chassignet, E. P., Hurlburt, H. E., Smedstad, O. M., Halliwell, G. R., Hogan, P. J., Wallcraft, A. J., et al. (2007). The HYCOM (Hybrid Coordinate Ocean Model) data assimilative system. J. Mar. Syst. 65, 60–83. doi: 10.1016/j.jmarsys.2005.09.016
Chassot, E., Bonhommeau, S., Dulvy, N. K., Mélin, F., Watson, R., Gascuel, D., et al. (2010). Global marine primary production constrains fisheries catches. Ecol. Lett. 13, 495–505. doi: 10.1111/j.1461-0248.2010.01443.x
Chassot, E., Bonhommeau, S., Reygondeau, G., Nieto, K., Polovina, J. J., Huret, M., et al. (2011). Satellite remote sensing for an ecosystem approach to fisheries management. ICES. J. Mar. Sci. 68, 651–666. doi: 10.1093/icesjms/fsq195
Chérubin, L. M., Kuchinke, C. P., and Paris, C. B. (2008). Ocean circulation and terrestrial runoff dynamics in the Mesoamerican region from spectral optimization of SeaWiFS data and a high resolution simulation. Coral Reefs 27, 503–519. doi: 10.1007/s00338-007-0348-1
Chin, A., Kyne, P. M., Walker, T. I., and Mcauley, R. B. (2010). An integrated risk assessment for climate change: analysing the vulnerability of sharks and rays on australia’s great barrier reef. Glob. Change. Biol. 16, 1936–1953. doi: 10.1111/j.1365-2486.2009.02128.x
Collins, A. B., Heupel, M. R., and Motta, P. J. (2007). Residence and movement patterns of cownose rays Rhinoptera bonasus within a south-west Florida estuary. J. Fish Biol. 71, 1159–1178. doi: 10.1111/j.1095-8649.2007.01590.x
Comfort, C. M., and Weng, K. C. (2015). Vertical habitat and behaviour of the bluntnose sixgill shark in Hawaii. Deep Sea Res. Part II Top. Stud. Oceanogr. 115, 116–126. doi: 10.1016/j.dsr2.2014.04.005
Cooke, S. J., Iverson, S. J., Stokesbury, M. J. W., Hinch, S. G., Fisk, A. T., Vanderzwaag, D. L., et al. (2011). Ocean tracking network Canada: a network approach to addressing critical issues in fisheries and resource management with implications for ocean governance. Fisheries 36, 583–592. doi: 10.1080/03632415.2011.633464
Cooper, A., and Gavin, E. J. O. (2005). “Spatial metadata in Africa and the Middle East,” in World Spatial Metadata Standards, eds H. Moellering, H. J. G. L. Aalders, and A. Crane (Oxford: Elsevier Science), 123–139. doi: 10.1016/B978-008043949-5/50009-7
Corbane, C., Najman, L., Pecoul, E., Demagistri, L., and Petit, M. (2010). A complete processing chain for ship detection using optical satellite imagery. Int. J. Remote Sens. 31, 5837–5854. doi: 10.1080/01431161.2010.512310
Cortés, E. (2002). Incorporating uncertainty into demographic modeling: application to shark populations and their conservation. Conserv. Biol. 16, 1048–1062. doi: 10.1046/j.1523-1739.2002.00423.x
Couturier, L. I. E., Jaine, F. R. A., Townsend, K. A., Weeks, S. J., Richardson, A. J., and Bennett, M. B. (2011). Distribution, site affinity and regional movements of the manta ray, Manta alfredi (krefft, 1868), along the east coast of Australia. Mar. Freshw. Res. 62, 628–637. doi: 10.1071/MF10148
Creel, S., and Christianson, D. (2008). Relationships between direct predation and risk effects. Trends Ecol. Evol. 23, 194–201. doi: 10.1016/j.tree.2007.12.004
Cummings, J. A., and Smedstad, O. M. (2013). “Variational data assimilation for the global ocean,” in Data Assimilation for Atmospheric, Oceanic and Hydrologic Applications, Vol. 2, eds S. K. Park and L. Xu (Berlin: Springer), 303–343.
Curtis, T. H., Zeeman, S. I., Summers, E. L., Cadrin, S. X., and Skomal, G. B. (2014). Eyes in the sky: linking satellite oceanography and biotelemetry to explore habitat selection by basking sharks. Anim. Biotelem. 2:12. doi: 10.1186/2050-3385-2-12
Davidson, L. N. K. (2012). Shark sanctuaries: substance or spin? Science 338:1538. doi: 10.1126/science.338.6114.1538
Dekker, A. G., Vos, R. J., and Peters, S. W. M. (2002). Analytical algorithms for lake water TSM estimation for retrospective analyses of TM and SPOT sensor data. Int. J. Remote Sens. 23, 15–35. doi: 10.1080/01431160010006917
Dewar, H., Mous, P., Domeier, M., Muljadi, A., Pet, J., and Whitty, J. (2008). Movements and site fidelity of the giant manta ray, Manta birostris, in the Komodo Marine Park, Indonesia. Mar. Biol. 155:121. doi: 10.1007/s00227-008-0988-x
Dodge, S., Bohrer, G., Weinzierl, R., Davidson, S. C., Kays, R., Douglas, D., et al. (2013). The environmental-data automated track annotation (Env-DATA) system: linking animal tracks with environmental data. Mov. Ecol. 1:3. doi: 10.1186/2051-3933-1-3
Domeier, M. L., Nasby-Lucas, N., and Palacios, D. M. (2012). “The Northeastern Pacific white shark shared offshore foraging area (SOFA),” in Global Perspectives on the Biology and Life History of the White Shark, ed. M. L. Domeier (Boca Raton, FL: CRC Press), 147–158.
Donaldson, M. R., Hinch, S. G., Suski, C. D., Fisk, A. T., Heupel, M. R., and Cooke, S. J. (2014). Making connections in aquatic ecosystems with acoustic telemetry monitoring. Front. Ecol. Environ. 12, 565–573. doi: 10.1890/130283
Donlon, C., Berruti, B., Buongiorno, A., Ferreira, M. H., Féménias, P., Frerick, J., et al. (2012). The global monitoring for environment and security (GMES) Sentinel-3 mission. Remote Sens. Environ. 120, 37–57. doi: 10.1016/j.rse.2011.07.024
Donohue, M., and Foley, D. G. (2007). Remote sensing reveals links among the endangered Hawaiian monk seal, marine debris, and El Niño. Mar. Mamm. Sci. 23, 468–473. doi: 10.1111/j.1748-7692.2007.00114.x
Doxaran, D., Froidefond, J.-M., Lavender, S., and Castaing, P. (2002). Spectral signature of highly turbid waters: application with SPOT data to quantify suspended particulate matter concentrations. Remote Sens. Environ. 81, 149–161. doi: 10.1016/S0034-4257(01)00341-8
Dudgeon, C. L., Lanyon, J. M., and Semmens, J. M. (2013). Seasonality and site fidelity of the zebra shark, Stegostoma fasciatum, in southeast Queensland, Australia. Anim. Behav. 85, 471–481. doi: 10.1016/j.anbehav.2012.12.013
Dulvy, N. K. (2013). Super-sized MPAs and the marginalization of species conservation. Aquat. Conserv. Mar. Freshw. Ecosyst. 23, 357–362. doi: 10.1002/aqc.2358
Dulvy, N. K., Baum, J. K., Clarke, S., Compagno, L. J. V., Cortés, E., Domingo, A., et al. (2008). You can swim but you can’t hide: the global status and conservation of oceanic pelagic sharks and rays. Aquat. Conserv. Mar. Freshw. Ecosyst. 18, 459–482. doi: 10.1002/aqc.975
Dulvy, N. K., Ellis, J. R., Goodwin, N. B., Grant, A., Reynolds, J. D., and Jennings, S. (2004). Methods of assessing extinction risk in marine fishes. Fish 5, 255–276. doi: 10.1111/j.1467-2679.2004.00158.x
Dulvy, N. K., Fowler, S. L., Musick, J. A., Cavanagh, R. D., Kyne, P. M., Harrison, L. R., et al. (2014). Extinction risk and conservation of the world’s sharks and rays. Elife 3:e00590. doi: 10.7554/eLife.00590
Duncan, C., Owen, H. J. F., Thompson, J. R., Koldewey, H. J., Primavera, J. H., and Pettorelli, N. (2018). Satellite remote sensing to monitor mangrove forest resilience and resistance to sea level rise. Methods. Ecol. Evol. 9, 1837–1852. doi: 10.1111/2041-210X.12923
Dunn, D. C., Maxwell, S. M., Boustany, A. M., and Halpin, P. N. (2016). Dynamic ocean management increases the efficiency and efficacy of fisheries management. Proc. Natl. Acad. Sci. U.S.A. 113:668. doi: 10.1073/pnas.1513626113
Edgar, G. J., Stuart-Smith, R. D., Willis, T. J., Kininmonth, S., Baker, S. C., Banks, S., et al. (2014). Global conservation outcomes depend on marine protected areas with five key features. Nature 506:216. doi: 10.1038/nature13022
Elvidge, C. D., Ghosh, T., Baugh, K., Zhizhin, M., Hsu, F.-C., Katada, N. S., et al. (2018). Rating the effectiveness of fishery closures with visible infrared imaging radiometer suite boat detection data. Front. Mar. Sci. 5:132. doi: 10.3389/fmars.2018.00132
Espinoza, M., Cappo, M., Heupel, M. R., Tobin, A. J., and Simpfendorfer, C. A. (2014). Quantifying shark distribution patterns and species-habitat associations: implications of marine park zoning. PLoS One 9:e106885. doi: 10.1371/journal.pone.0106885
Espinoza, M., Farrugia, T. J., and Lowe, C. G. (2011). Habitat use, movements and site fidelity of the gray smooth-hound shark (Mustelus californicus Gill 1863) in a newly restored southern California estuary. J. Exp. Mar. Biol. Ecol. 401, 63–74. doi: 10.1016/j.jembe.2011.03.001
Fabricius, K. E. (2005). Effects of terrestrial runoff on the ecology of corals and coral reefs: review and synthesis. Mar. Pollut. Bull. 50, 125–146. doi: 10.1016/j.marpolbul.2004.11.028
Ferreira, L. C., Mansfield, K. L., Thums, M., and Meekan, M. G. (2018). “Satellite tracking technologies and their application to shark movement ecology,” in Shark Research: Emerging Technologies and Applications for the Field and Laboratory, eds J. C. Carrier, M. R. Heithaus, and C. A. Simpfendorfer (Boca Raton, FL: CRC Press), 357–377.
Ferretti, F., Worm, B., Britten, G. L., Heithaus, M. R., and Lotze, H. K. (2010). Patterns and ecosystem consequences of shark declines in the ocean. Ecol. Lett. 13, 1055–1071. doi: 10.1111/j.1461-0248.2010.01489.x
Fretwell, P. T., LaRue, M. A., Morin, P., Kooyman, G. L., Wienecke, B., Ratcliffe, N., et al. (2012). An emperor penguin population estimate: the first global, synoptic survey of a species from space. PLoS One 7:e33751. doi: 10.1371/journal.pone.0033751
Fretwell, P. T., Staniland, I. J., and Forcada, J. (2014). Whales from space: counting southern right whales by satellite. PLoS One 9:e88655. doi: 10.1371/journal.pone.0088655
Fuentes, M., Limpus, C., Hamann, M., and Dawson, J. (2010). Potential impacts of projected sea-level rise on sea turtle rookeries. Aquat. Conserv. Mar. Freshw. Ecosyst. 20, 132–139. doi: 10.1002/aqc.1088
Game, E. T., Grantham, H. S., Hobday, A. J., Pressey, R. L., Lombard, A. T., Beckley, L. E., et al. (2009). Pelagic protected areas: the missing dimension in ocean conservation. Trends Ecol. Evol. 24, 360–369. doi: 10.1016/j.tree.2009.01.011
Garaba, S. P., Aitken, J., Slat, B., Dierssen, H. M., Lebreton, L., Zielinski, O., et al. (2018). Sensing ocean plastics with an airborne hyperspectral shortwave infrared imager. Environ. Sci. Technol. 52, 11699–11707. doi: 10.1021/acs.est.8b02855
Garla, R. C., Chapman, D. D., Wetherbee, B. M., and Shivji, M. (2005). Movement patterns of young caribbean reef sharks, Carcharhinus perezi, at Fernando de Noronha Archipelago, Brazil: the potential of marine protected areas for conservation of a nursery ground. Mar. Biol. 149, 189. doi: 10.1007/s00227-005-0201-4
Gende, S. M., and Sigler, M. F. (2006). Persistence of forage fish ‘hot spots’ and its association with foraging Steller sea lions (Eumetopias jubatus) in southeast Alaska. Deep Sea Res. Part II Top. Stud. Oceanogr. 53, 432–441. doi: 10.1016/j.dsr2.2006.01.005
Giustini, D., and Boulos, M. N. K. (2013). Google scholar is not enough to be used alone for systematic reviews. Online J. Public Health Inform. 5, 214–214. doi: 10.5210/ojphi.v5i2.4623
Gorelick, N., Hancher, M., Dixon, M., Ilyushchenko, S., Thau, D., and Moore, R. (2017). Google earth engine: planetary-scale geospatial analysis for everyone. Remote. Sens. Environ. 202, 18–27. doi: 10.1016/j.rse.2017.06.031
Greidanus, H., Alvarez, M., Santamaria, C., Thoorens, F.-X., Kourti, N., and Argentieri, P. (2017). The SUMO ship detector algorithm for satellite radar images. Remote Sens. 9:246. doi: 10.3390/rs9030246
Guinehut, S., Le Traon, P. Y., Larnicol, G., and Philipps, S. (2004). Combining argo and remote-sensing data to estimate the ocean three-dimensional temperature fields—a first approach based on simulated observations. J. Mar. Syst. 46, 85–98. doi: 10.1016/j.jmarsys.2003.11.022
Hacohen-Domené, A., Martínez-Rincón, R. O., Galván-Magaña, F., Cárdenas-Palomo, N., De La Parra-Venegas, R., Galván-Pastoriza, B., et al. (2015). Habitat suitability and environmental factors affecting whale shark (Rhincodon typus) aggregations in the Mexican Caribbean. Environ. Biol. Fishes 98, 1953–1964. doi: 10.1007/s10641-015-0413-5
Haidvogel, D. B., Arango, H., Budgell, W. P., Cornuelle, B. D., Curchitser, E., Di Lorenzo, E., et al. (2008). Ocean forecasting in terrain-following coordinates: Formulation and skill assessment of the regional ocean modeling system. J. Comput. Phys. 227, 3595–3624. doi: 10.1016/j.jcp.2007.06.016
Hammerschlag, N., Gallagher, A. J., and Lazarre, D. M. (2011). A review of shark satellite tagging studies. J. Exp. Mar. Biol. Ecol. 398, 1–8. doi: 10.1016/j.jembe.2010.12.012
Handcock, R., Swain, D., Bishop-Hurley, G., Patison, K., Wark, T., Valencia, P., et al. (2009). Monitoring animal behaviour and environmental interactions using wireless sensor networks, GPS collars and satellite remote sensing. Sensors 9:3586. doi: 10.3390/s90503586
Hayes, S. P., Milburn, H. B., and Ford, E. F. (1984). TOPS: a free-fall velocity and CTD profiler. J. Atmos. Ocean. Technol. 1, 220–236. doi: 10.1175/1520-0426(1984)001<0220:TAFFVA>2.0.CO;2
Hays, G. C., Bradshaw, C. J. A., James, M. C., Lovell, P., and Sims, D. W. (2007). Why do Argos satellite tags deployed on marine animals stop transmitting? J. Exp. Mar. Biol. Ecol. 349, 52–60. doi: 10.1016/j.jembe.2007.04.016
Hays, G. C., Ferreira, L. C., Sequeira, A. M. M., Meekan, M. G., Duarte, C. M., Bailey, H., et al. (2016). Key questions in marine megafauna movement ecology. Trends Ecol. Evol. 31, 463–475. doi: 10.1016/j.tree.2016.02.015
Hazen, E. L., Maxwell, S. M., Bailey, H., Bograd, S. J., Hamann, M., Gaspar, P., et al. (2012). Ontogeny in marine tagging and tracking science technologies and data gaps. Mar. Ecol. Prog. Ser. 457, 221–240. doi: 10.3354/meps09857
Heithaus, M., Dill, L., Marshall, G., and Buhleier, B. (2002). Habitat use and foraging behavior of tiger sharks (Galeocerdo cuvier) in a seagrass ecosystem. Mar. Biol. 140, 237–248. doi: 10.1007/s00227-001-0711-7
Heithaus, M. R. (2001). The biology of tiger sharks, Galeocerdo cuvier, in Shark Bay, Western Australia: sex ratio, size distribution, diet, and seasonal changes in catch rates. Environ. Biol. Fishes 61, 25–36. doi: 10.1023/a:1011021210685
Heithaus, M. R., Frid, A., Wirsing, A. J., and Worm, B. (2008). Predicting ecological consequences of marine top predator declines. Trends Ecol. Evol. 23, 202–210. doi: 10.1016/j.tree.2008.01.003
Heumann, B. W. (2011). Satellite remote sensing of mangrove forests: recent advances and future opportunities. Prog. Phys. Geogr. Earth Environ. 35, 87–108. doi: 10.1177/0309133310385371
Heupel, M. R., Kessel, S. T., Matley, J. K., and Simpfendorfer, C. A. (2018). “Acoustic telemetry,” in Shark Research: Emerging Technologies and Applications for the Field and Laboratory, eds J. C. Carrier, M. R. Heithaus, and C. A. Simpfendorfer (Boca Raton, FL: CRC Press), 133–156.
Heupel, M. R., Semmens, J. M., and Hobday, A. J. (2006). Automated acoustic tracking of aquatic animals: scales, design and deployment of listening station arrays. Mar. Freshw. Res. 57, 1–13. doi: 10.1071/MF05091
Heupel, M. R., and Simpfendorfer, C. A. (2010). Science or slaughter: need for lethal sampling of sharks. Conserv. Biol. 24, 1212–1218. doi: 10.1111/j.1523-1739.2010.01491.x
Heyman, W. D., Graham, R. T., Kjerfve, B., and Johannes, R. E. (2001). Whale sharks Rhincodon typus aggregate to feed on fish spawn in Belize. Mar. Ecol. Prog. Ser. 215, 275–282. doi: 10.3354/meps215275
Hilborn, R. (2015). Marine protected areas miss the boat. Science 350:1326. doi: 10.1126/science.350.6266.1326-a
Hill, K., Moltmann, T., Proctor, R., and Allen, S. (2010). The Australian Integrated Marine Observing System: delivering data streams to address national and international research priorities. Mar. Technol. Soc. J. 44, 65–72. doi: 10.4031/MTSJ.44.6.13
Hobday, A. J., and Hartmann, K. (2006). Near real-time spatial management based on habitat predictions for a longline bycatch species. Fish Manag. Ecol. 13, 365–380. doi: 10.1111/j.1365-2400.2006.00515.x
Hobday, A. J., and Hartog, J. R. (2014). Derived ocean features for dynamic ocean management. Oceanography 27, 134–145. doi: 10.5670/oceanog.2014.92
Hochberg, E. J., Atkinson, M. J., and Andréfouët, S. (2003). Spectral reflectance of coral reef bottom-types worldwide and implications for coral reef remote sensing. Remote Sens. Environ. 85, 159–173. doi: 10.1016/S0034-4257(02)00201-8
Hoegh-Guldberg, O. (1999). Climate change, coral bleaching and the future of the world’s coral reefs. Mar. Freshw. Res. 50, 839–866. doi: 10.1071/MF99078
Hopkins, T. E., and Cech, J. J. (2003). The influence of environmental variables on the distribution and abundance of three elasmobranchs in Tomales Bay. Calif. Environ. Biol. Fishes 66, 279–291. doi: 10.1023/a:1023907121605
Howell, E. A., Hoover, A., Benson, S. R., Bailey, H., Polovina, J. J., Seminoff, J. A., et al. (2015). Enhancing the turtlewatch product for leatherback sea turtles, a dynamic habitat model for ecosystem-based management. Fish. Oceanogr. 24, 57–68. doi: 10.1111/fog.12092
Howell, E. A., Kobayashi, D. R., Parker, D. M., Balazs, G. H., and Polovina, J. J. (2008). Turtlewatch: a tool to aid in the bycatch reduction of loggerhead turtles Caretta caretta in the Hawaii-based pelagic longline fishery. Endanger. Species Res. 5, 267–278. doi: 10.3354/esr00096
Hughes, T. P., Baird, A. H., Bellwood, D. R., Card, M., Connolly, S. R., Folke, C., et al. (2003). Climate change, human impacts, and the resilience of coral reefs. Science 301:929. doi: 10.1126/science.1085046
Humphries, N. E., Queiroz, N., Dyer, J. R. M., Pade, N. G., Musyl, M. K., Schaefer, K. M., et al. (2010). Environmental context explains lévy and brownian movement patterns of marine predators. Nature 465:1066. doi: 10.1038/nature09116
Iglesias, A., Arcay, B., Cotos, J. M., Taboada, J. A., and Dafonte, C. (2004). A comparison between functional networks and artificial neural networks for the prediction of fishing catches. Neural Comput. Appl. 13, 24–31. doi: 10.1007/s00521-004-0402-7
Irigoyen, A. J., De Wysiecki, A. M., Trobbiani, G., Bovcon, N., Awruch, C. A., Argemi, F., et al. (2018). Habitat use, seasonality and demography of an apex predator: sevengill shark notorynchus cepedianus in Northern Patagonia. Mar. Ecol. Prog. Ser. 603, 147–160. doi: 10.3354/meps12715
Jacoby, D. M. P., Croft, D. P., and Sims, D. W. (2012). Social behaviour in sharks and rays: analysis, patterns and implications for conservation. Fish 13, 399–417. doi: 10.1111/j.1467-2979.2011.00436.x
Jacoby, D. M. P., and Freeman, R. (2016). Emerging network-based tools in movement ecology. Trends Ecol. Evol. 31, 301–314. doi: 10.1016/j.tree.2016.01.011
Jaine, F. R. A., Couturier, L. I. E., Weeks, S. J., Townsend, K. A., Bennett, M. B., Fiora, K., et al. (2012). When giants turn up: sighting trends, environmental influences and habitat use of the manta ray Manta alfredi at a coral reef. PLoS One 7:e46170. doi: 10.1371/journal.pone.0046170
Joshi, A. R., Dinerstein, E., Wikramanayake, E., Anderson, M. L., Olson, D., Jones, B. S., et al. (2016). Tracking changes and preventing loss in critical tiger habitat. Sci. Adv. 2:e1501675. doi: 10.1126/sciadv.1501675
Kachelriess, D., Wegmann, M., Gollock, M., and Pettorelli, N. (2014). The application of remote sensing for marine protected area management. Ecol. Indic. 36, 169–177. doi: 10.1016/j.ecolind.2013.07.003
Kerr, Y. H., Waldteufel, P., Wigneron, J., Delwart, S., Cabot, F., Boutin, J., et al. (2010). The SMOS mission: new tool for monitoring key elements of the global water cycle. Proc. IEEE 98, 666–687. doi: 10.1109/JPROC.2010.2043032
Klemas, V. (2010). Tracking oil slicks and predicting their trajectories using remote sensors and models: case studies of the Sea Princess and Deepwater Horizon oil spills. J. Coast. Res. 26, 789–797. doi: 10.2112/10a-00012.1
Knip, D. M., Heupel, M. R., and Simpfendorfer, C. A. (2010). Sharks in nearshore environments: models, importance, and consequences. Mar. Ecol. Prog. Ser. 402, 1–11. doi: 10.3354/meps08498
Knip, D. M., Heupel, M. R., and Simpfendorfer, C. A. (2012). Evaluating marine protected areas for the conservation of tropical coastal sharks. Biol. Conserv. 148, 200–209. doi: 10.1016/j.biocon.2012.01.008
Kourti, N., Shepherd, I., Greidanus, H., Alvarez, M., Aresu, E., Bauna, T., et al. (2005). Integrating remote sensing in fisheries control. Fish Manag. Ecol. 12, 295–307. doi: 10.1111/j.1365-2400.2005.00452.x
Kranstauber, B., Cameron, A., Weinzerl, R., Fountain, T., Tilak, S., Wikelski, M., et al. (2011). The Movebank data model for animal tracking. Environ. Model. Softw. 26, 834–835. doi: 10.1016/j.envsoft.2010.12.005
Kuenzer, C., Bluemel, A., Gebhardt, S., Quoc, T. V., and Dech, S. (2011). Remote sensing of mangrove ecosystems: a review. Remote Sens. 3:878. doi: 10.3390/rs3050878
Kurekin, A. A., Loveday, B. R., Clements, O., Quartly, G. D., Miller, P. I., Wiafe, G., et al. (2019). Operational monitoring of illegal fishing in Ghana through exploitation of satellite earth observation and AIS data. Remote Sens. 11, 293. doi: 10.3390/rs11030293
Kvile, K. Ø., Romagnoni, G., Dagestad, K.-F., Langangen, Ø., and Kristiansen, T. (2018). Sensitivity of modelled North Sea cod larvae transport to vertical behaviour, ocean model resolution and interannual variation in ocean dynamics. ICES J. Mar. Sci. 75, 2413–2424. doi: 10.1093/icesjms/fsy039
LaRue, M. A., Rotella, J. J., Garrott, R. A., Siniff, D. B., Ainley, D. G., Stauffer, G. E., et al. (2011). Satellite imagery can be used to detect variation in abundance of weddell seals (Leptonychotes weddellii) in Erebus Bay. Antarctica. Polar Biol. 34:1727. doi: 10.1007/s00300-011-1023-0
LaRue, M. A., Stapleton, S., and Anderson, M. (2017). Feasibility of using high-resolution satellite imagery to assess vertebrate wildlife populations. Conserv. Biol. 31, 213–220. doi: 10.1111/cobi.12809
Laurs, R. M., Foley, D., and Musyl, M. (2006). “Identification of large pelagic marine fish habitats and habitat utilization using ‘pop-up’ satellite archival tag and oceanic satellite remote sensing technologies and ‘SODA’ simple ocean data simulation model analyses,” in Proceedings of the 2006 IEEE US/EU Baltic International Symposium (Klaipeda: IEEE), 1–9. doi: 10.1109/BALTIC.2006.7266148
Lea, J. S. E., Wetherbee, B. M., Queiroz, N., Burnie, N., Aming, C., Sousa, L. L., et al. (2015). Repeated, long-distance migrations by a philopatric predator targeting highly contrasting ecosystems. Sci. Rep. 5:11202. doi: 10.1038/srep11202
Lee, T. (2016). Consistency of Aquarius sea surface salinity with Argo products on various spatial and temporal scales. Geophys. Res. Lett. 43, 3857–3864. doi: 10.1002/2016GL068822
Lee, Z., Carder, K., Arnone, R., and He, M. (2007). Determination of primary spectral bands for remote sensing of aquatic environments. Sensors 7:3428. doi: 10.3390/s7123428
Lee, Z., and Carder, K. L. (2002). Effect of spectral band numbers on the retrieval of water column and bottom properties from ocean color data. Appl. Opt. 41, 2191–2201. doi: 10.1364/AO.41.002191
Lewis, J. S., Farnsworth, M. L., Burdett, C. L., Theobald, D. M., Gray, M., and Miller, R. S. (2017). Biotic and abiotic factors predicting the global distribution and population density of an invasive large mammal. Sci. Rep. 7:44152. doi: 10.1038/srep44152
Lopez, J., Alvarez-Berastegui, D., Soto, M., and Murua, H. (2017). “Modelling the oceanic habitats of silky shark (Carcharhinus falciformis), implications for conservation and management,” in Proceedings of the Informe Presentado a la International Commission for the Conservation of Atlantic Tunas (ICCAT), SCRS/2017/200, Sebastián.
Malenovský, Z., Rott, H., Cihlar, J., Schaepman, M. E., García-Santos, G., Fernandes, R., et al. (2012). Sentinels for science: potential of Sentinel-1, -2, and -3 missions for scientific observations of ocean, cryosphere, and land. Remote Sens. Environ. 120, 91–101. doi: 10.1016/j.rse.2011.09.026
Martin, R. A. (2005). Conservation of freshwater and euryhaline elasmobranchs: a review. J. Mar. Biol. Assoc. U. K. 85, 1049–1073. doi: 10.1017/S0025315405012105
Maunder, M. N. (2002). The relationship between fishing methods, fisheries management and the estimation of maximum sustainable yield. Fish 3, 251–260. doi: 10.1046/j.1467-2979.2002.00089.x
Maxwell, S. M., Hazen, E. L., Lewison, R. L., Dunn, D. C., Bailey, H., Bograd, S. J., et al. (2015). Dynamic ocean management: defining and conceptualizing real-time management of the ocean. Mar. Policy 58, 42–50. doi: 10.1016/j.marpol.2015.03.014
McCarthy, D. P., Donald, P. F., Scharlemann, J. P. W., Buchanan, G. M., Balmford, A., Green, J. M. H., et al. (2012). Financial costs of meeting global biodiversity conservation targets: current spending and unmet needs. Science 338, 946–949. doi: 10.1126/science.1229803
McMahon, C. R., Howe, H., Van Den Hoff, J., Alderman, R., Brolsma, H., and Hindell, M. A. (2014). Satellites, the all-seeing eyes in the sky: counting elephant seals from space. PLoS One 9:e92613. doi: 10.1371/journal.pone.0092613
Mendelssohn, R. (2017). Rerddapxtracto: Extracts Environmental Data from ERD’s ERDDAP Web Service. R Package Version 0.3.5.900. Available at: https://github.com/rmendels/rerddapXtracto.
Meyer, C. G., Papastamatiou, Y. P., and Holland, K. N. (2010). A multiple instrument approach to quantifying the movement patterns and habitat use of tiger (Galeocerdo cuvier) and Galapagos sharks (Carcharhinus galapagensis) at French Frigate Shoals. Hawaii. Mar. Biol. 157, 1857–1868. doi: 10.1007/s00227-010-1457-x
Miller, P. I., and Christodoulou, S. (2014). Frequent locations of oceanic fronts as an indicator of pelagic diversity: application to marine protected areas and renewables. Mar. Policy 45, 318–329. doi: 10.1016/j.marpol.2013.09.009
Miller, P. I., Scales, K. L., Ingram, S. N., Southall, E. J., Sims, D. W., and Costa, D. (2015). Basking sharks and oceanographic fronts: quantifying associations in the north-east Atlantic. Funct. Ecol. 29, 1099–1109. doi: 10.1111/1365-2435.12423
Mitchell, J. D., Collins, K. J., Miller, P. I., and Suberg, L. A. (2014). Quantifying the impact of environmental variables upon catch per unit effort of the blue shark Prionace glauca in the western English Channel. J. Fish Biol. 85, 657–670. doi: 10.1111/jfb.12448
Moher, D., Shamseer, L., Clarke, M., Ghersi, D., Liberati, A., Petticrew, M., et al. (2015). Preferred reporting items for systematic review and meta-analysis protocols (PRISMA-P) 2015 statement. Syst. Rev. 4, 1. doi: 10.1186/2046-4053-4-1
Molina, J. M., and Cooke, S. J. (2012). Trends in shark bycatch research: current status and research needs. Rev. Fish Biol. Fish 22, 719–737. doi: 10.1007/s11160-012-9269-3
Musick, J. A., Burgess, G., Cailliet, G., Camhi, M., and Fordham, S. (2000). Management of sharks and their relatives (elasmobranchii). Fisheries 25, 9–13. doi: 10.1577/1548-8446(2000)025<0009:MOSATR>2.0.CO;2
Myers, R. A., Baum, J. K., Shepherd, T. D., Powers, S. P., and Peterson, C. H. (2007). Cascading effects of the loss of apex predatory sharks from a coastal ocean. Science 315:1846. doi: 10.1126/science.1138657
Nadon, M. O., Baum, J. K., Williams, I. D., Mcpherson, J. M., Zgliczynski, B. J., Richards, B. L., et al. (2012). Re-creating missing population baselines for Pacific reef sharks. Conserv. Biol. 26, 493–503. doi: 10.1111/j.1523-1739.2012.01835.x
Nagendra, H., Lucas, R., Honrado, J. P., Jongman, R. H. G., Tarantino, C., Adamo, M., et al. (2013). Remote sensing for conservation monitoring: assessing protected areas, habitat extent, habitat condition, species diversity, and threats. Ecol. Indic. 33, 45–59. doi: 10.1016/j.ecolind.2012.09.014
Nelson, D. R., Mckibben, J. N., Strong, W. R., Lowe, C. G., Sisneros, J. A., Schroeder, D. M., et al. (1997). An acoustic tracking of a megamouth shark, Megachasma pelagios: a crepuscular vertical migrator. Environ. Biol. Fishes 49, 389–399. doi: 10.1023/a:1007369619576
Novianto, D., Susilo, E., Fahmi, Z., and Coelho, R. (2016). “Standardized CPUE of blue shark in Indonesian tuna longline fishery estimated from scientific observer data, for the period 2005–2016,” in Proceedings of the IOTC-13 Working Party on Ecosystems and Bycatch (WPEB), San Sebastián.
Oh, B. Z. L., Sequeira, A. M. M., Meekan, M. G., Ruppert, J. L. W., and Meeuwig, J. J. (2017). Predicting occurrence of juvenile shark habitat to improve conservation planning. Conserv. Biol. 31, 635–645. doi: 10.1111/cobi.12868
Oke, P. R., Brassington, G. B., Griffin, D. A., and Schiller, A. (2008). The Bluelink Ocean Data Assimilation System (BODAS). Ocean Model. 21, 46–70. doi: 10.1016/j.ocemod.2007.11.002
Oozeki, Y., Inagake, D., Saito, T., Okazaki, M., Fusejima, I., Hotai, M., et al. (2018). Reliable estimation of IUU fishing catch amounts in the northwestern Pacific adjacent to the Japanese EEZ: potential for usage of satellite remote sensing images. Mar. Policy 88, 64–74. doi: 10.1016/j.marpol.2017.11.009
Opdal, A. F., and Vikebø, F. B. (2015). Long-term stability in modelled zooplankton influx could uphold major fish spawning grounds on the Norwegian continental shelf. Can. J. Fish Aquat. Sci. 73, 189–196. doi: 10.1139/cjfas-2014-0524
Palacios, D. M., Bograd, S. J., Foley, D. G., and Schwing, F. B. (2006). Oceanographic characteristics of biological hot spots in the North Pacific: a remote sensing perspective. Deep Sea Res. Part II Top. Stud. Oceanogr. 53, 250–269. doi: 10.1016/j.dsr2.2006.03.004
Palmer, S. C. J., Kutser, T., and Hunter, P. D. (2015). Remote sensing of inland waters: challenges, progress and future directions. Remote Sens. Environ. 157, 1–8. doi: 10.1016/j.rse.2014.09.021
Papastamatiou, Y. P., and Lowe, C. G. (2012). An analytical and hypothesis-driven approach to elasmobranch movement studies. J. Fish Biol. 80, 1342–1360. doi: 10.1111/j.1095-8649.2012.03232.x
Pardo, M. A., Gerrodette, T., Beier, E., Gendron, D., Forney, K. A., Chivers, S. J., et al. (2015). Inferring cetacean population densities from the absolute dynamic topography of the ocean in a hierarchical bayesian framework. PLoS One 10:e0120727. doi: 10.1371/journal.pone.0120727
Pavan-Kumar, A., Gireesh-Babu, P., Jaiswar, A. K., Raje, S. G., Chaudhari, A., and Krishna, G. (2018). “Molecular phylogeny of elasmobranchs,” in DNA Barcoding and Molecular Phylogeny, eds S. Trivedi, H. Rehman, S. Saggu, C. Panneerselvam, and S. K. Ghosh (Cham: Springer International Publishing), 245–257. doi: 10.1007/978-3-319-90680-5_15
Perry, A. L., Low, P. J., Ellis, J. R., and Reynolds, J. D. (2005). Climate change and distribution shifts in marine fishes. Science 308:1912. doi: 10.1126/science.1111322
Pettorelli, N., Safi, K., and Turner, W. (2014). Satellite remote sensing, biodiversity research and conservation of the future. Philos. Trans. Royal Soc. B 369:20130190. doi: 10.1098/rstb.2013.0190
Pettorelli, N., Schulte BuüHne, H., Shapiro, A. C., and Glover-Kapfer, P. (2018). Satellite remote sensing for conservation. WWF Conserv. Technol. Ser. 1:124.
Pichel, W. G., Churnside, J. H., Veenstra, T. S., Foley, D. G., Friedman, K. S., Brainard, R. E., et al. (2007). Marine debris collects within the North Pacific subtropical convergence zone. Mar. Pollut. Bull. 54, 1207–1211. doi: 10.1016/j.marpolbul.2007.04.010
Platt, T., and Sathyendranath, S. (2008). Ecological indicators for the pelagic zone of the ocean from remote sensing. Remote. Sens. Environ. 112, 3426–3436. doi: 10.1016/j.rse.2007.10.016
Priede, I. G. (1984). A basking shark (Cetorhinus maximus) tracked by satellite together with simultaneous remote sensing. Fish. Res. 2, 201–216. doi: 10.1016/0165-7836(84)90003-1
Queiroz, N., Humphries, N. E., Mucientes, G., Hammerschlag, N., Lima, F. P., Scales, K. L., et al. (2016). Ocean-wide tracking of pelagic sharks reveals extent of overlap with longline fishing hotspots. Proc. Natl. Acad. Sci. U.S.A. 113, 1582–1587. doi: 10.1073/pnas.1510090113
Queiroz, N., Humphries, N. E., Noble, L. R., Santos, A., and Sims, D. W. (2010). Short-term movements and diving behaviour of satellite-tracked blue sharks Prionace glauca in the northeastern Atlantic Ocean. Mar. Ecol. Prog. Ser. 406, 265–279. doi: 10.3354/meps08500
Queiroz, N., Humphries, N. E., Noble, L. R., Santos, A. M., and Sims, D. W. (2012). Spatial dynamics and expanded vertical niche of blue sharks in oceanographic fronts reveal habitat targets for conservation. PLoS One 7:e32374. doi: 10.1371/journal.pone.0032374
Ramírez-Macías, D., Queiroz, N., Pierce, S. J., Humphries, N. E., Sims, D. W., and Brunnschweiler, J. M. (2017). Oceanic adults, coastal juveniles: tracking the habitat use of whale sharks off the Pacific coast of Mexico. PeerJ 5:e3271. doi: 10.7717/peerj.3271
Remelgado, R., Leutner, B., Safi, K., Sonnenschein, R., Kuebert, C., and Wegmann, M. (2018). Linking animal movement and remote sensing – mapping resource suitability from a remote sensing perspective. Remote Sens. Ecol. Conserv. 4, 211–224. doi: 10.1002/rse2.70
Reynolds, J. D., Jennings, S., and Dulvy, N. K. (2001). “Life histories of fishes and population responses to exploitation,” in Conservation of Exploited Species, eds J. D. Reynolds, G. M. Mace, K. H. Redford, and J. G. Robinson (Cambridge: Cambridge University Press), 147–168.
Reynolds, S. D., Norman, B. M., Beger, M., Franklin, C. E., Dwyer, R. G., and Hawkes, L. (2017). Movement, distribution and marine reserve use by an endangered migratory giant. Divers. Distrib. 23, 1268–1279. doi: 10.1111/ddi.12618
Rieucau, G., Kiszka, J. J., Castillo, J. C., Mourier, J., Boswell, K. M., and Heithaus, M. R. (2018). Using unmanned aerial vehicle (UAV) surveys and image analysis in the study of large surface-associated marine species: a case study on reef sharks Carcharhinus melanopterus shoaling behaviour. J. Fish Biol. 93, 119–127. doi: 10.1111/jfb.13645
Roemmich, D., Johnson, G. C., Riser, S., Davis, R., Gilson, J., Owens, W. B., et al. (2009). The Argo program: observing the global ocean with profiling floats. Oceanography 22, 34–43. doi: 10.5670/oceanog.2009.36
Roquet, F., Williams, G., Hindell, M. A., Harcourt, R., Mcmahon, C., Guinet, C., et al. (2014). A Southern Indian Ocean database of hydrographic profiles obtained with instrumented elephant seals. Sci. Data 1:140028. doi: 10.1038/sdata.2014.28
Rosa, R., Baptista, M., Lopes, V. M., Pegado, M. R., Ricardo Paula, J., Trübenbach, K., et al. (2014). Early-life exposure to climate change impairs tropical shark survival. Proc. R. Soc. B 281:20141738. doi: 10.1098/rspb.2014.1738
Rose, R. A., Byler, D., Eastman, J. R., Fleishman, E., Geller, G., Goetz, S., et al. (2015). Ten ways remote sensing can contribute to conservation. Conserv. Biol. 29, 350–359. doi: 10.1111/cobi.12397
Ross, P. S., Barlow, J., Jefferson, T. A., Hickie, B. E., Lee, T., Macfarquhar, C., et al. (2011). Ten guiding principles for the delineation of priority habitat for endangered small cetaceans. Mar. Policy 35, 483–488. doi: 10.1016/j.marpol.2010.11.004
Roy, D. P., Wulder, M. A., Loveland, T. R., Woodcock, C. E., Allen, R. G., Anderson, M. C., et al. (2014). Landsat-8: science and product vision for terrestrial global change research. Remote Sens. Environ. 145, 154–172. doi: 10.1016/j.rse.2014.02.001
Santos, A. M. P. (2000). Fisheries oceanography using satellite and airborne remote sensing methods: a review. Fish. Res. 49, 1–20. doi: 10.1016/S0165-7836(00)00201-0
Sbrocco, E. J., and Barber, P. H. (2013). MARSPEC: ocean climate layers for marine spatial ecology. Ecology 94, 979–979. doi: 10.1890/12-1358.1
Scales, K. L., Miller, P. I., Hawkes, L. A., Ingram, S. N., Sims, D. W., and Votier, S. C. (2014). Review: on the front line: frontal zones as priority at-sea conservation areas for mobile marine vertebrates. J. Appl. Ecol. 51, 1575–1583. doi: 10.1111/1365-2664.12330
Schlaff, A. M., Heupel, M. R., and Simpfendorfer, C. A. (2014). Influence of environmental factors on shark and ray movement, behaviour and habitat use: a review. Rev. Fish Biol. Fish. 24, 1089–1103. doi: 10.1007/s11160-014-9364-8
Selles, J., Sabarros, P. S., Romanov, E., Dagorne, D., Le Foulgoc, L., and Bach, P. (2014). “Characterisation of blue shark (Prionace glauca) hotspots in the South-West Indian Ocean,” in Proceedings of the 10th IOTC Working Party on Ecosystem and Bycatch, Yokohama.
Sequeira, A. M. M., Mellin, C., Fordham, D. A., Meekan, M. G., and Bradshaw, C. J. A. (2014). Predicting current and future global distributions of whale sharks. Glob. Change Biol. 20, 778–789. doi: 10.1111/gcb.12343
Simpfendorfer, C. A., Heupel, M. R., White, W. T., and Dulvy, N. K. (2011). The importance of research and public opinion to conservation management of sharks and rays: a synthesis. Mar. Freshw. Res. 62, 518–527. doi: 10.1071/MF11086
Simpfendorfer, C. A., Wiley, T. R., and Yeiser, B. G. (2010). Improving conservation planning for an endangered sawfish using data from acoustic telemetry. Biol. Conserv. 143, 1460–1469. doi: 10.1016/j.biocon.2010.03.021
Sims, D. W., Humphries, N. E., Bradford, R. W., and Bruce, B. D. (2012). Levy flight and brownian search patterns of a free-ranging predator reflect different prey field characteristics. J. Anim. Ecol. 81, 432–442. doi: 10.1111/j.1365-2656.2011.01914.x
Sims, D. W., and Quayle, V. A. (1998). Selective foraging behaviour of basking sharks on zooplankton in a small-scale front. Nature 393:460. doi: 10.1038/30959
Sims, D. W., Wearmouth, V. J., Southall, E. J., Hill, J. M., Moore, P., Rawlinson, K., et al. (2006). Hunt warm, rest cool: bioenergetic strategy underlying diel vertical migration of a benthic shark. J. Anim. Ecol. 75, 176–190. doi: 10.1111/j.1365-2656.2005.01033.x
Sleeman, J. C., Meekan, M. G., Wilson, S. G., Jenner, C. K. S., Jenner, M. N., Boggs, G. S., et al. (2007). Biophysical correlates of relative abundances of marine megafauna at Ningaloo Reef. Western Australia. Mar. Freshw. Res. 58, 608–623. doi: 10.1071/MF06213
Sleeman, J. C., Meekan, M. G., Wilson, S. G., Polovina, J. J., Stevens, J. D., Boggs, G. S., et al. (2010). To go or not to go with the flow: environmental influences on whale shark movement patterns. J. Exp. Mar. Biol. Ecol. 390, 84–98. doi: 10.1016/j.jembe.2010.05.009
Solanki, H. U., Dwivedi, R. M., Nayak, S. R., Somvanshi, V. S., Gulati, D. K., and Pattnayak, S. K. (2003). Fishery forecast using OCM chlorophyll concentration and AVHRR SST: validation results off Gujarat coast. India. Int. J. Remote Sens. 24, 3691–3699. doi: 10.1080/0143116031000117029
Speed, C. W., Field, I. C., Meekan, M. G., and Bradshaw, C. J. A. (2010). Complexities of coastal shark movements and their implications for management. Mar. Ecol. Prog. Ser. 408, 275–293. doi: 10.3354/meps08581
Speed, C. W., Meekan, M. G., Field, I. C., Mcmahon, C. R., Stevens, J. D., Mcgregor, F., et al. (2011). Spatial and temporal movement patterns of a multi-species coastal reef shark aggregation. Mar. Ecol. Prog. Ser. 429, 261–275. doi: 10.3354/meps09080
Stevens, J. D., Bradford, R. W., and West, G. J. (2010). Satellite tagging of blue sharks (Prionace glauca) and other pelagic sharks off Eastern Australia: depth behaviour, temperature experience and movements. Mar. Biol. 157, 575–591. doi: 10.1007/s00227-009-1343-6
Stokesbury, M. J. W., Harvey-Clark, C., Gallant, J., Block, B. A., and Myers, R. A. (2005). Movement and environmental preferences of Greenland sharks (Somniosus microcephalus) electronically tagged in the St. Lawrence Estuary, Canada. Mar. Biol. 148, 159–165. doi: 10.1007/s00227-005-0061-y
Swinbourne, M. J., Taggart, D. A., Swinbourne, A. M., Lewis, M., and Ostendorf, B. (2018). Using satellite imagery to assess the distribution and abundance of southern hairy-nosed wombats (Lasiorhinus latifrons). Remote Sens. Environ. 211, 196–203. doi: 10.1016/j.rse.2018.04.017
Takano, A., Yamazaki, H., Nagai, T., and Honda, O. (2009). A method to estimate three-dimensional thermal structure from satellite altimetry data. J. Atmos. Ocean. Technol. 26, 2655–2664. doi: 10.1175/2009JTECHO669.1
Teo, S. L. H., Kudela, R. M., Rais, A., Perle, C., Costa, D. P., and Block, B. A. (2009). Estimating chlorophyll profiles from electronic tags deployed on pelagic animals. Aquat. Biol. 5, 195–207. doi: 10.3354/ab00152
Tew Kai, E., Rossi, V., Sudre, J., Weimerskirch, H., Lopez, C., Hernandez-Garcia, E., et al. (2009). Top marine predators track Lagrangian coherent structures. Proc. Natl. Acad. Sci. U.S.A. 106, 8245–8250. doi: 10.1073/pnas.0811034106
Thomsen, P. F., and Willerslev, E. (2015). Environmental DNA – an emerging tool in conservation for monitoring past and present biodiversity. Biol. Conserv. 183, 4–18. doi: 10.1016/j.biocon.2014.11.019
Tomiyasu, K. (1978). Tutorial review of synthetic-aperture radar (SAR) with applications to imaging of the ocean surface. Proc. IEEE 66, 563–583. doi: 10.1109/PROC.1978.10961
Torres, L. G., Heithaus, M. R., and Delius, B. (2006). Influence of teleost abundance on the distribution and abundance of sharks in Florida Bay. USA. Hydrobiologia 569, 449–455. doi: 10.1007/s10750-006-0148-6
Toth, C., and Jóźków, G. (2016). Remote sensing platforms and sensors: a survey. ISPRS J. Photogramm. Remote Sens. 115, 22–36. doi: 10.1016/j.isprsjprs.2015.10.004
Tranfield, D., Denyer, D., and Smart, P. (2003). Towards a methodology for developing evidence-informed management knowledge by means of systematic review. Br. J. Manag. 14, 207–222. doi: 10.1111/1467-8551.00375
Turner, W., Rondinini, C., Pettorelli, N., Mora, B., Leidner, A. K., Szantoi, Z., et al. (2015). Free and open-access satellite data are key to biodiversity conservation. Biol. Conserv. 182, 173–176. doi: 10.1016/j.biocon.2014.11.048
Turner, W., Spector, S., Gardiner, N., Fladeland, M., Sterling, E., and Steininger, M. (2003). Remote sensing for biodiversity science and conservation. Trends Ecol. Evol. 18, 306–314. doi: 10.1016/S0169-5347(03)00070-3
Tyberghein, L., Verbruggen, H., Pauly, K., Troupin, C., Mineur, F., and De Clerck, O. (2012). Bio-ORACLE: a global environmental dataset for marine species distribution modelling. Glob. Ecol. Biogeogr. 21, 272–281. doi: 10.1111/j.1466-8238.2011.00656.x
Ubeda, A. J., Simpfendorfer, C. A., and Heupel, M. R. (2009). Movements of bonnetheads, Sphyrna tiburo, as a response to salinity change in a Florida estuary. Environ. Biol. Fishes 84, 293–303. doi: 10.1007/s10641-008-9436-5
Vandeperre, F., Aires-Da-Silva, A., Lennert-Cody, C., Santos, R. S., and Afonso, P. (2016). Essential pelagic habitat of juvenile blue shark (Prionace glauca) inferred from telemetry data. Limnol. Oceanogr. 61, 1605–1625. doi: 10.1002/lno.10321
Vaudo, J. J., Byrne, M. E., Wetherbee, B. M., Harvey, G. M., Shivji, M. S., and Trenkel, V. (2017). Long-term satellite tracking reveals region-specific movements of a large pelagic predator, the shortfin mako shark, in the western North Atlantic Ocean. J. Appl. Ecol. 54, 1765–1775. doi: 10.1111/1365-2664.12852
Verstraete, M. M., Pinty, B., and Curran, P. J. (1999). MERIS potential for land applications. Int. J. Remote Sens. 20, 1747–1756. doi: 10.1080/014311699212452
Weeks, S., Magno-Canto, M., Jaine, F., Brodie, J., and Richardson, A. (2015). Unique sequence of events triggers manta ray feeding frenzy in the southern Great Barrier Reef. Australia. Remote Sens. 7, 3138–3152. doi: 10.3390/rs70303138
Weng, K. C., Foley, D. G., Ganong, J. E., Perle, C., Shillinger, G. L., and Block, B. A. (2008). Migration of an upper trophic level predator, the salmon shark Lamna ditropis, between distant ecoregions. Mar. Ecol. Prog. Ser. 372, 253–264. doi: 10.3354/meps07706
White, T. D., Carlisle, A. B., Kroodsma, D. A., Block, B. A., Casagrandi, R., De Leo, G. A., et al. (2017). Assessing the effectiveness of a large marine protected area for reef shark conservation. Biol. Conserv. 207, 64–71. doi: 10.1016/j.biocon.2017.01.009
Wickham, C. V. (2011). Whither the Whale Shark Wanders: Tools and Methods for Modelling Whale Shark Movement. Berkeley, CA: UC Berkeley.
Williams, J. J., Papastamatiou, Y. P., Caselle, J. E., Bradley, D., and Jacoby, D. M. P. (2018). Mobile marine predators: an understudied source of nutrients to coral reefs in an unfished atoll. Proc. R. Soc. B 285:20172456. doi: 10.1098/rspb.2017.2456
Wilson, S. G., Lutcavage, M. E., Brill, R. W., Genovese, M. P., Cooper, A. B., and Everly, A. W. (2005). Movements of bluefin tuna (Thunnus thynnus) in the northwestern Atlantic Ocean recorded by pop-up satellite archival tags. Mar. Biol. 146, 409–423. doi: 10.1007/s00227-004-1445-0
Wilson, S. G., Polovina, J. J., Stewart, B. S., and Meekan, M. G. (2006). Movements of whale sharks (Rhincodon typus) tagged at Ningaloo reef. Western Australia. Mar. Biol. 148, 1157–1166. doi: 10.1007/s00227-005-0153-8
Wilson, S. G., Stewart, B. S., Polovina, J. J., Meekan, M. G., Stevens, J. D., and Galuardi, B. (2007). Accuracy and precision of archival tag data: a multiple-tagging study conducted on a whale shark (Rhincodon typus) in the Indian Ocean. Fish Oceanogr. 16, 547–554. doi: 10.1111/j.1365-2419.2007.00450.x
Woodcock, C. E., Allen, R., Anderson, M., Belward, A., Bindschadler, R., Cohen, W., et al. (2008). Free access to landsat imagery. Science 320:1011. doi: 10.1126/science.320.5879.1011a
Xu, J., and Zhao, D. (2014). Review of coral reef ecosystem remote sensing. Acta Ecol. Sin. 34, 19–25. doi: 10.1016/j.chnaes.2013.11.003
Yang, J., Gong, P., Fu, R., Zhang, M., Chen, J., Liang, S., et al. (2013). The role of satellite remote sensing in climate change studies. Nat. Clim. Change 3:875. doi: 10.1038/nclimate1908
Young, I. R., Zieger, S., and Babanin, A. V. (2011). Global trends in wind speed and wave height. Science 332, 451–455. doi: 10.1126/science.1197219
Keywords: elasmobranch, satellite, remote sensing, conservation, ecology, shark, ray, management
Citation: Williamson MJ, Tebbs EJ, Dawson TP and Jacoby DMP (2019) Satellite Remote Sensing in Shark and Ray Ecology, Conservation and Management. Front. Mar. Sci. 6:135. doi: 10.3389/fmars.2019.00135
Received: 05 December 2018; Accepted: 04 March 2019;
Published: 28 March 2019.
Edited by:
Alastair Martin Mitri Baylis, South Atlantic Environmental Research Institute, Falkland IslandsReviewed by:
Luciana C. Ferreira, Australian Institute of Marine Science (AIMS), AustraliaDaniel M. Palacios, Oregon State University, United States
Copyright © 2019 Williamson, Tebbs, Dawson and Jacoby. This is an open-access article distributed under the terms of the Creative Commons Attribution License (CC BY). The use, distribution or reproduction in other forums is permitted, provided the original author(s) and the copyright owner(s) are credited and that the original publication in this journal is cited, in accordance with accepted academic practice. No use, distribution or reproduction is permitted which does not comply with these terms.
*Correspondence: Michael J. Williamson, michael.williamson@kcl.ac.uk