The Ocean Observatories Initiative
 John Trowbridge1*
  Robert Weller2
  Deborah Kelley3
  Edward Dever4
  Albert Plueddemann2
  John A. Barth4
  Orest Kawka3
- 1Applied Ocean Physics and Engineering Department, Woods Hole Oceanographic Institution, Woods Hole, MA, United States
- 2Physical Oceanography Department, Woods Hole Oceanographic Institution, Woods Hole, MA, United States
- 3School of Oceanography, College of The Environment, University of Washington, Seattle, WA, United States
- 4College of Earth, Ocean, and Atmospheric Sciences, Oregon State University, Corvallis, OR, United States
The Ocean Observatories Initiative (OOI) is an integrated network that enables scientific investigation of interlinked physical, chemical, biological and geological processes throughout the global ocean. With near real-time data delivery via a common Cyberinfrastructure, the OOI instruments two contrasting ocean systems at three scales. The Regional Cabled Array instruments a tectonic plate and overlying ocean in the northeast Pacific, providing a permanent electro-optical cable connecting multiple seafloor nodes that provide high power and bandwidth to seafloor sensors and moorings with instrumented wire crawlers, all with speed-of-light interactive capabilities. Coastal arrays include the Pioneer Array, a relocatable system currently quantifying the New England shelf-break front, and the Endurance Array, a fixed system off Washington and Oregon with connections to the Regional Cabled Array. The Global Arrays host deep-ocean moorings and gliders to provide interdisciplinary measurements of the water column, mesoscale variability, and air-sea fluxes at critical high latitude locations. The OOI has unique aspects relevant to the international ocean observing community. The OOI uses common sensor types, verification protocols, and data formats across multiple platform types in diverse oceanographic regimes. OOI observing is sustained, with initial deployment in 2013 and 25 years of operation planned. The OOI is distributed among sites selected for scientific relevance based on community input and linked by important oceanographic processes. Scientific highlights include real-time observations of a submarine volcanic eruption, time-series observations of methane bubble plumes from Southern Hydrate Ridge off Oregon, observations of anomalous low-salinity pulses off Oregon, discovery of new mechanisms for intrusions of the Gulf Stream onto the shelf in the Middle Atlantic Bight, documentation of deep winter convection in the Irminger Sea, and observations of extreme surface forcing at the most southerly surface mooring in the world ocean.
Introduction
Overview
The Ocean Observatories Initiative (OOI) is a distributed, integrated network designed to enable next-generation scientific investigations of the complex, interlinked physical, chemical, biological, and geological processes that operate throughout the global ocean (ORION Executive Steering Committee, 2005, 2007). Since inception, the OOI has been a community-driven effort that continually incorporates and adapts state-of-the-art technology, with a goal of answering fundamental questions in Ocean and Earth Sciences, and contributing vital information to societally important activities, including fisheries management, maritime shipping, public safety, homeland security, hazards, and weather and climate forecasting. The OOI arrays (Figure 1), supported by documented procedures and metadata, and distributed to users in real-time via a common Cyberinfrastructure, address important questions at global, regional and local scales.
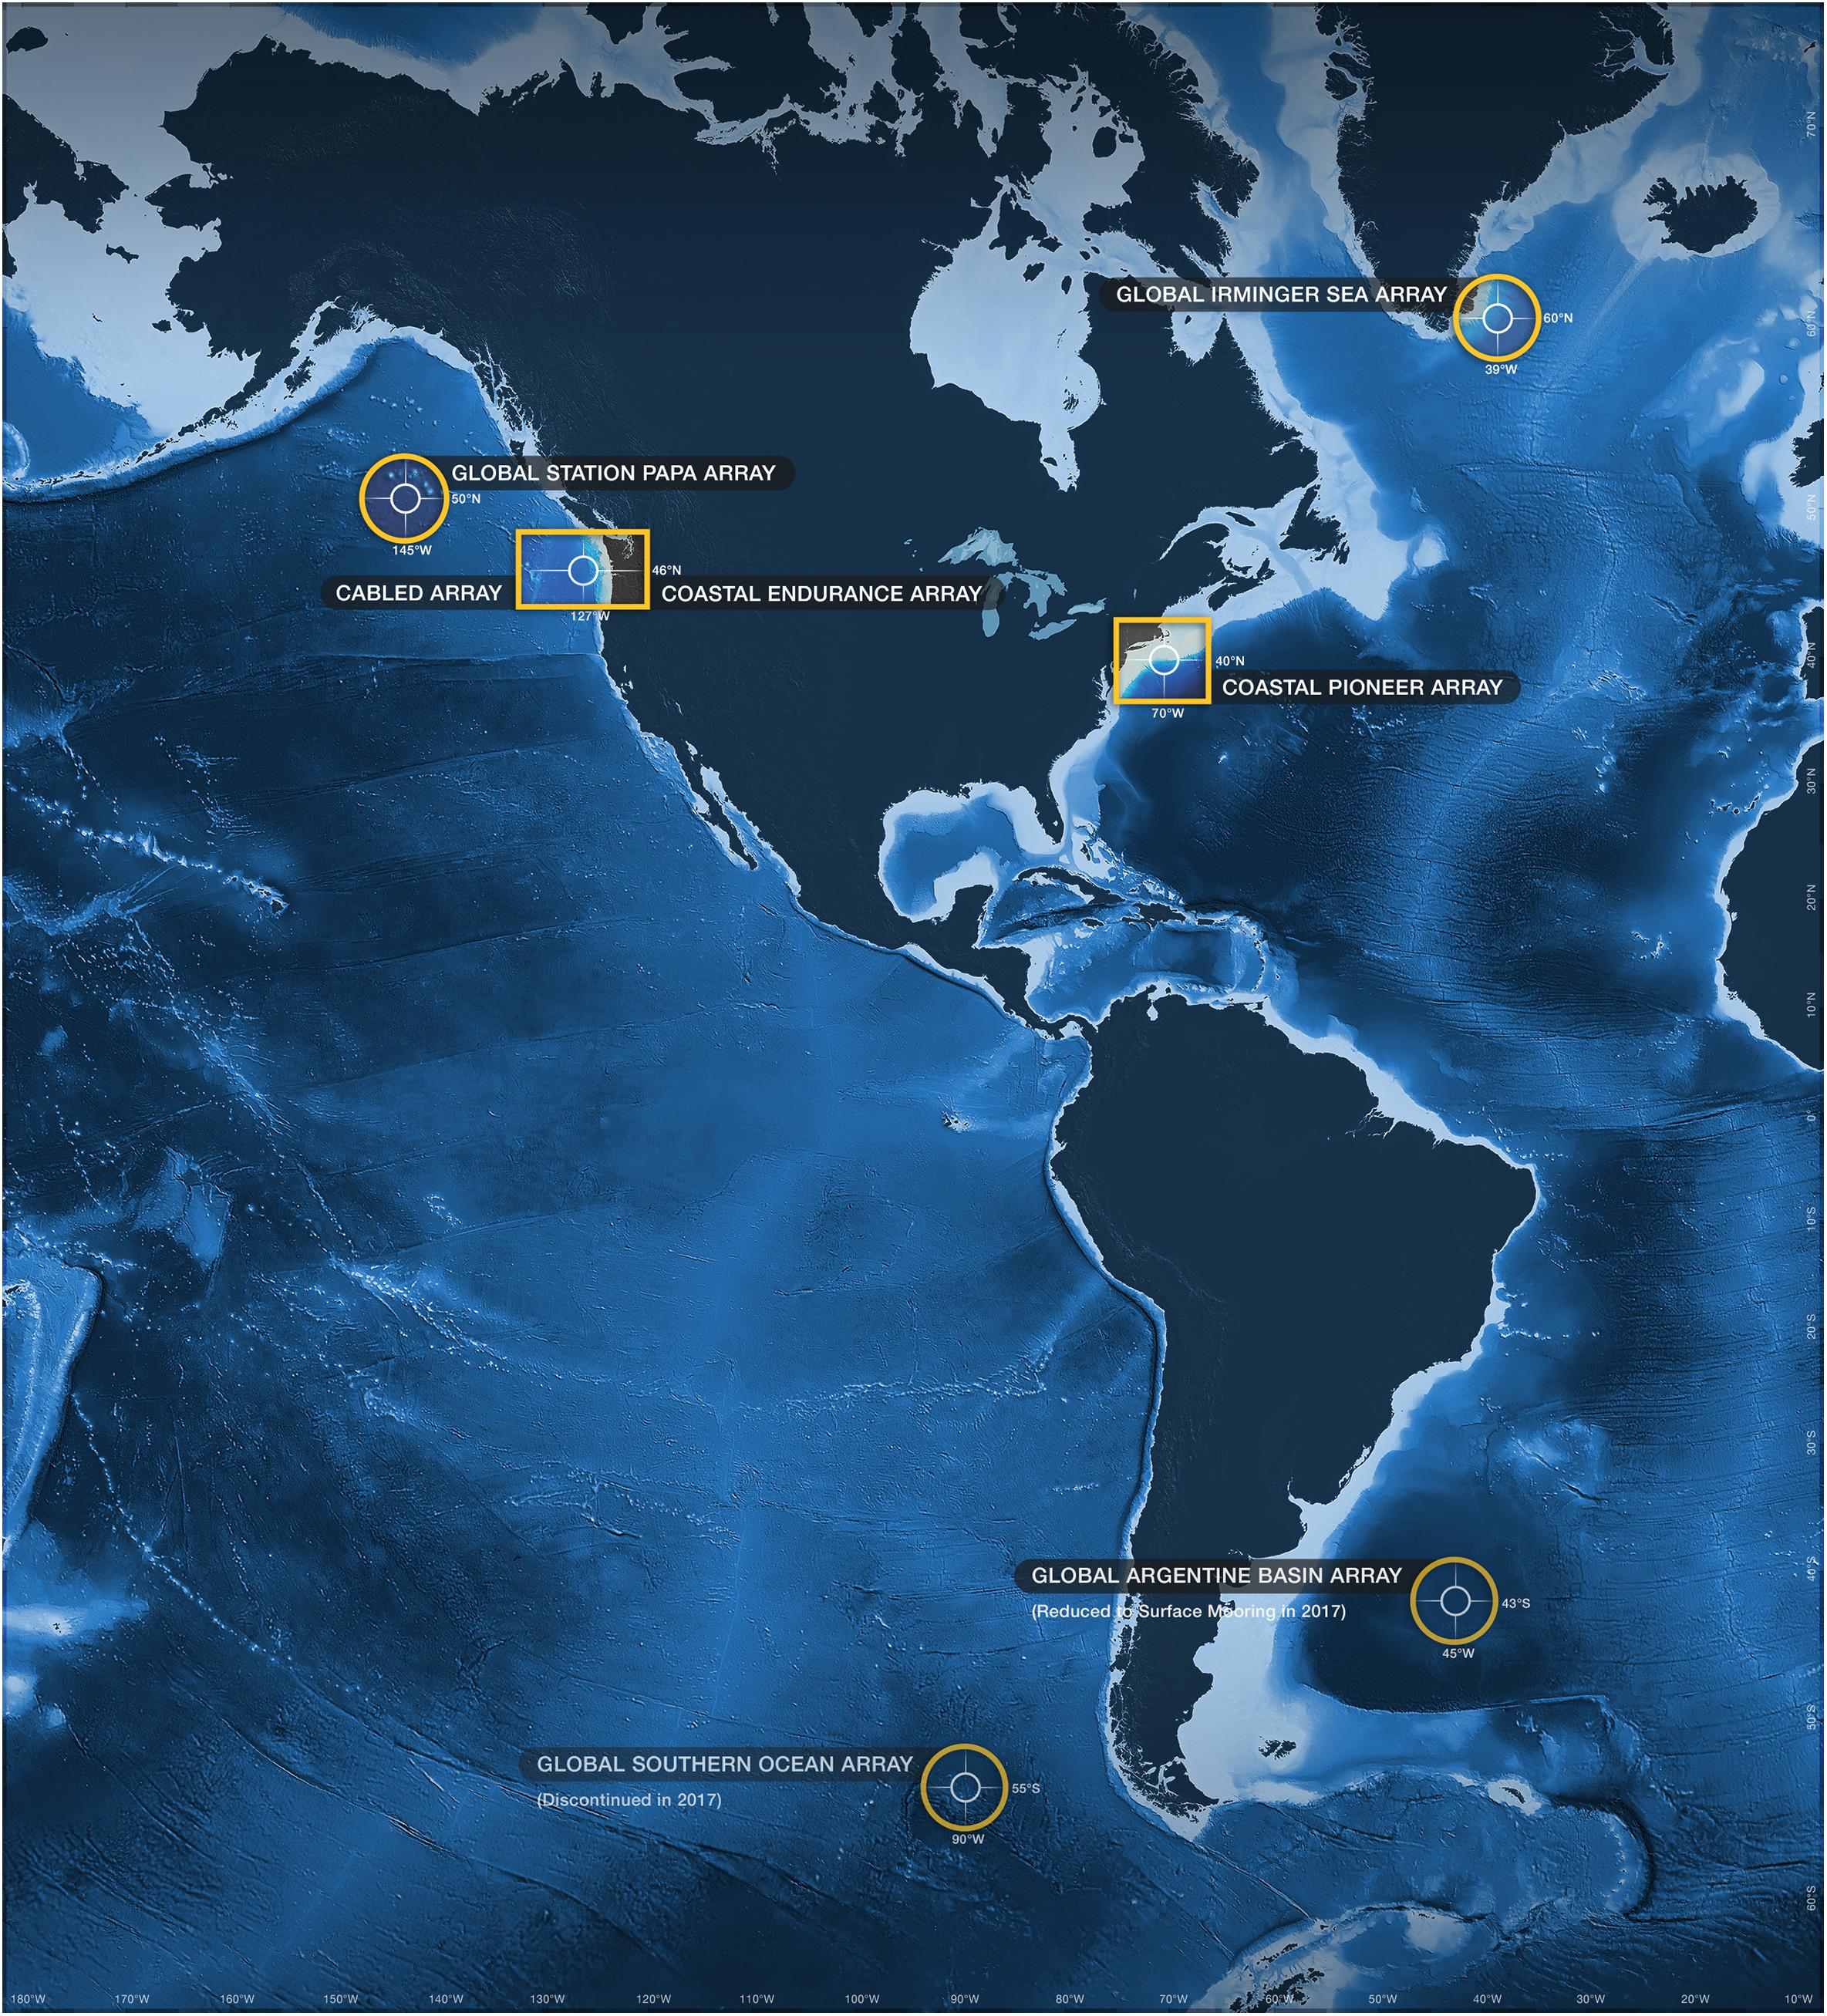
Figure 1. OOI Arrays. Figure credit: Center for Environmental Visualization, UW School of Oceanography.
The Regional Cabled Array instruments a tectonic plate and overlying ocean at key locations in the northeast Pacific off Oregon, providing a permanent electro-optical cable connecting multiple seafloor nodes that provide high power and bandwidth for sensors from the seafloor to the ocean surface (Kelley et al., 2016). This system, which brings high-power and high- bandwidth real-time, two-way communications into the oceans with adaptive sampling capabilities, will continue to provide new insights into interlinked seismic, volcanic, and hydrothermal processes operating off the Oregon coast, the flux of methane from the seafloor, and the seafloor biosphere. The cabled moorings, which include instrumented wire crawlers and winched profilers, and associated seafloor instrumentation provide high-resolution temporal measurements of blue water and coastal ocean dynamics and ecosystems (e.g., hypoxia, thin layers, plumes, upwelling), biogeochemical interactions, and turbulent mixing.
The Coastal Arrays include the Endurance Array, a fixed system with connections to the Cabled Array, located off Washington and Oregon, and the Pioneer Array, a relocatable system with approximately 5 years planned at a series of locations to be selected by the National Science Foundation. The Endurance Array includes moorings and gliders to observe the coastal upwelling region of the Oregon and Washington coasts, and provides synoptic, multi-scale observations of the eastern boundary current regime, focusing on shelf-slope and air-sea exchange, carbon cycling, and acidification. The Pioneer Array currently occupies the New England shelf break, where moorings, gliders and propeller-driven underwater vehicles (e.g., Nicholson and Healey, 2008) are quantifying shelf-slope exchange and related interdisciplinary processes near the persistent shelf-slope front, which drive some of the nation’s most productive ecosystems.
The Global Arrays consist of deep ocean moorings (e.g., Weller et al., 2012) and buoyancy-driven ocean gliders (Rudnick et al., 2004) that provide interdisciplinary measurements of the water column, mesoscale variability, and air-sea fluxes at critical locations worldwide. Locations include the Irminger Sea off Greenland, a site of the deep-water formation that forms part of the Atlantic meridional overturning circulation, a key component of the climate system; Station Papa in the Northeast Pacific, a site of longstanding interdisciplinary interest; the Argentine Basin, a highly biologically productive, energetic, data-sparse region; and the Southern Ocean off Chile, seen as central to the global carbon cycle and global heat and energy budgets (National Academies of Sciences, Engineering and Medicine, 2015).
The OOI CI is based on the uFrameTM software, developed by Raytheon, Inc., and adapted and extended for OOI use. The uFrame-based system parses and processes raw data and presents it in response to user queries, made over the Internet through the CI web-based portal access point. A machine-to-machine (M2M) interface provides programmatic access to a Program network, termed OOINet, through a representational state transfer (RESTful) application programming interface (API). M2M supports an alternative ERDDAP data delivery solution. The CI system uses a life-cycle management architecture that integrates a redundant enterprise storage area network (disk-based) and a robotic library (tape-based), with redundancy implemented at different layers. The CI software system uses a service-oriented architecture (AOA) and implements dataset drivers, cabled instrument and platform drivers, and data product algorithms to produce data products on demand. The OOI CI system implements a multi-tier security approach, supporting traffic encryption, network traffic segregation, multi-layer traffic filtering, multi-layer access control, and monitoring.
The OOI was designed to provide a unified approach to the comprehensive investigation of themes central to Ocean and Earth Science (ORION Executive Steering Committee, 2005): (1) ocean-atmosphere exchange; (2) climate variability, ocean circulation, and ecosystems; (3) turbulent mixing and biophysical interactions; (4) coastal ocean dynamics and ecosystems; (5) fluid-rock interactions and the subseafloor biosphere; and (6) plate-scale, ocean geodynamics.
As a science-driven ocean observing program, the OOI is related to but distinct from the Integrated Ocean Observing System (IOOS), which has the mission of producing and communicating information that meets the safety, economic, and stewardship needs of the United States (e.g., Rayner, 2010). The OOI Coastal Pioneer Array complements the nearby IOOS arrays maintained by the Northeastern Association of Coastal Ocean Observing Systems (NERACOOS) and the Mid-Atlantic Regional Association Coastal Ocean Observing System (MARACOOS). Similarly, the OOI Regional Cabled Array and the OOI Coastal Endurance Array complement the nearby IOOS array maintained by the Northwest Association of Networked Ocean Observing Systems (NANOOS).
Elements of OOI History
After extensive planning, advocacy, and collaboration by community leaders in the 1990s, the National Science Board in 2000 approved the OOI (then called ORION) as a potential Major Research Equipment and Facilities Construction project for possible incorporation in a National Science Foundation (NSF) budget. The NSF established the OOI Project Office in 2004 and an Executive Steering Committee in 2005 to coordinate further planning.
In 2005, the OOI Project Office issued a Request for Assistance, resulting in submission of 48 proposals, which were peer reviewed. NSF Advisory Committees used the proposals and reviews to develop the Conceptual Network Design, which was presented at a community-wide Design and Implementation Workshop in 2006. In 2006, the NSF assembled a Science Panel, which reviewed and endorsed the Conceptual Network Design, and a Conceptual Design Review, which endorsed the feasibility, budget, and plans.
In 2007, through competitive peer-reviewed processes, the NSF selected the University of Washington (UW) as the Implementing Organization (IO) for the Regional Cabled Array, the University of California San Diego (UCSD) as the IO for the Cyberinfrastructure, and the Woods Hole Oceanographic Institution (WHOI), in partnership with the Scripps Institution of Oceanography (SIO) and Oregon State University (OSU), as the IO for the Coastal and Global Scale Nodes, consisting of the Coastal Endurance and Pioneer Arrays and the Global Arrays. The Consortium for Ocean Leadership (COL) hosted the Project Management Office. NSF held Preliminary and Final Design Reviews in 2007 and 2008, resulting in acceptance of the OOI Final Network Design and a recommendation to proceed with construction. The NSF held a Cost and Schedule Review and a Science Review Panel in 2009. Following authorization by the National Science Board, the NSF in 2009 established a Cooperative Agreement with COL to initiate funding for design and construction, and COL established subawards to the IOs.
Design commenced in 2009, and the subsequent construction, installation, testing, and validation culminated in commissioning of the OOI arrays in 2016, followed by initial operation. During design and construction, OSU became a separate IO responsible for the coastal Endurance Array, SIO withdrew from the Coastal and Global Scale Nodes, and the Cyberinfrastructure transitioned first to SIO and then, using an alternative technological approach, to Rutgers University. In 2017, because of budget constraints, the Global Array in the Argentine Basin was discontinued, although data collected at this site continues to be served through the OOI Cyberinfrastructure, and the Global Array in the Southern Ocean was reduced in scope, although continued under joint funding from the NSF through the OOI and from the United Kingdom.
In 2016, the NSF issued a solicitation for operation and management of a five-year continuation of the OOI, termed OOI 2.0, with an option to renew. The NSF reviewed and evaluated the proposals and submitted status and plans to the National Science Board, which in 2018 approved allocation of funds to the continuation of the OOI. The NSF established a Cooperative Agreement with WHOI, which in turn established Cooperative Agreements with partners UW, OSU, and Rutgers. WHOI hosts the Program Management Office and is responsible for the Coastal Pioneer and Global Arrays. UW, OSU, and Rutgers are responsible for the Regional Cabled Array, Coastal Endurance Array, and Cyberinfrastructure, respectively. OOI 2.0 commenced in October 2018.
Scope of This Article
The following describes science drivers, infrastructure, and science highlights for the Regional Cabled Array (Section “Regional Cabled Array”), the Coastal Endurance and Pioneer Arrays (Sections “Coastal Endurance Array” and “Coastal Pioneer Array”), and the Global Arrays (Section “Global Arrays”). Section “The Future” addresses the future. The Cyberinfrastructure is described elsewhere (Rodero Castro and Parashar, 2016, 2019; Zamani et al., 2017).
Regional Cabled Array
Science Drivers
The network design for the high-power and -bandwidth Regional Cabled Array (RCA, Figures 1, 2) is based on the premise that many globally significant processes, which operate beneath/at the seafloor and throughout the overlying water column, are expressed at or below a regional scale (Regional Cabled Observatory Network (of Networks) [RECONN], 2004). Hence, the implemented RCA extends >500 km across the Juan de Fuca Plate spanning coastal to blue water environments and from the Cascadia Margin to the Juan de Fuca mid-ocean ridge spreading center. The extended spatial coverage of the RCA, real-time two-way communication capabilities, 24/7 measurements over decades, and sampling periods from microseconds to minutes provide unparalleled capacity to examine in both space and time processes at the scales at which they are operating and interacting with a representative suite of natural phenomena that occur throughout the world’s ocean. The key site locations and science drivers for the RCA were honed from sixteen proposals involving >175 scientists that responded to the NSF’s Request for Assistance in 2005. Primary science drivers and detailed rational for the RCA are described in the RECONN report (Regional Cabled Observatory Network (of Networks) [RECONN], 2004) and in the OOI Science Prospectus (ORION Executive Steering Committee, 2005, 2007). Each RCA site, briefly described below, is located in a specific geographic region (Figure 2) to address the most science for the widest community.
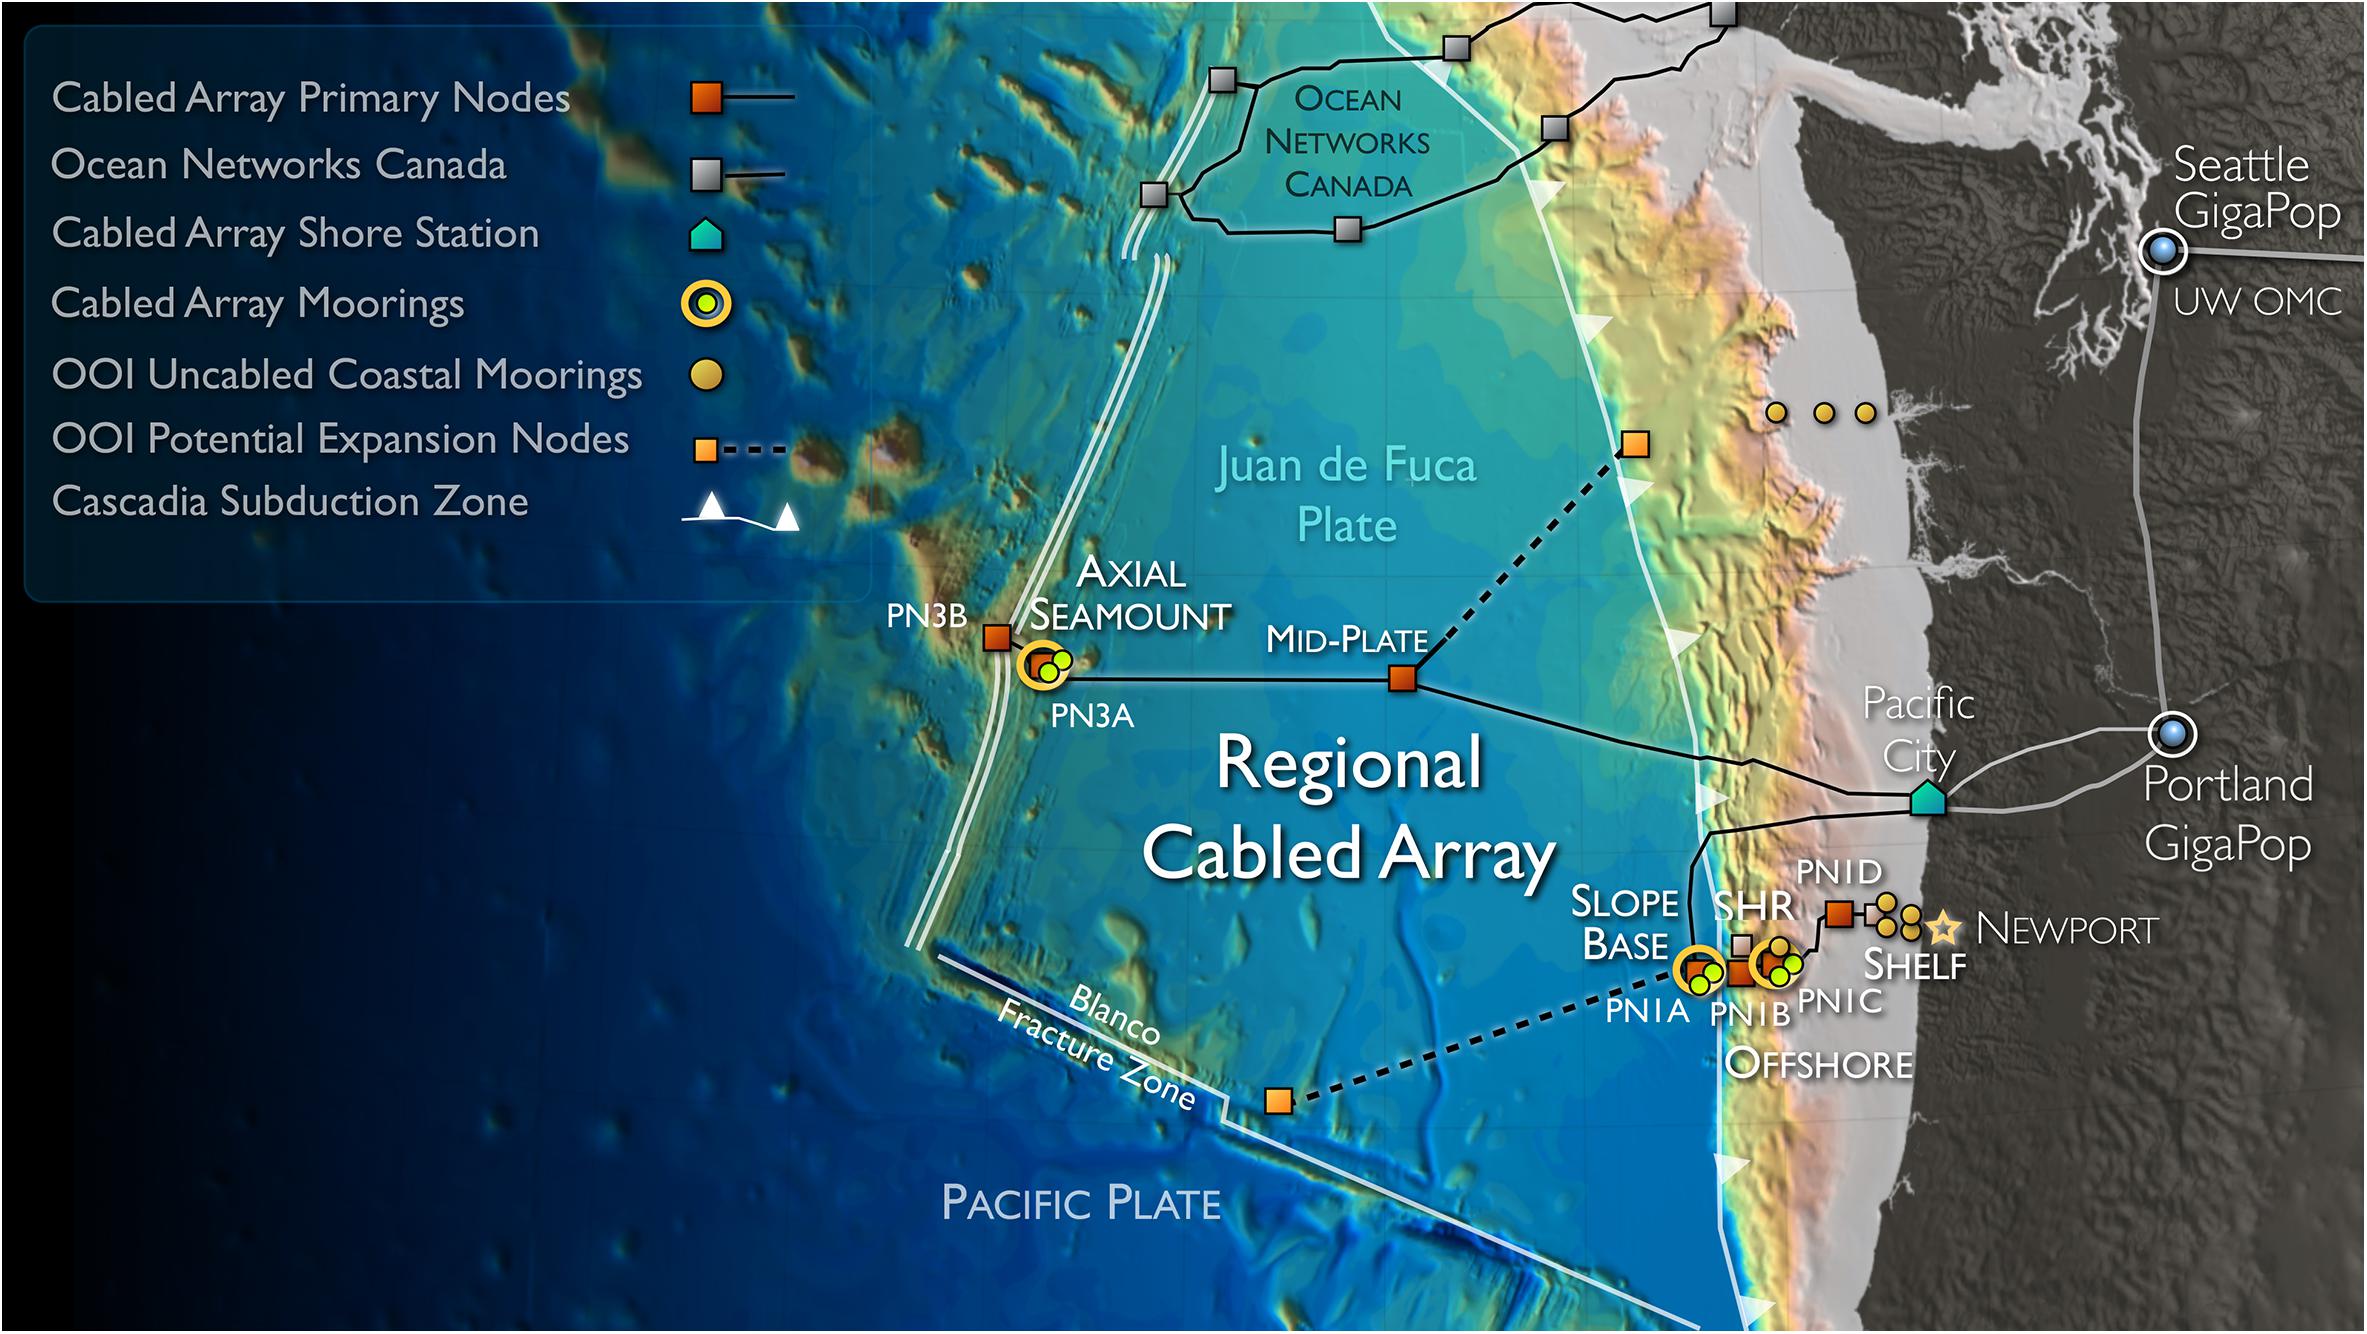
Figure 2. Location of the Regional Cabled Array spanning the Cascadia Margin and Juan de Fuca Plate. Coupled Shallow Profiler and Deep Profiler Moorings are located at the Slope Base, Oregon Endurance Offshore and Axial Base sites. Location of Primary Nodes (PN1B–PN3B and the mid-plate site (PN5A) are shown connected to the backbone cable. Potential expansion capabilities include the Blanco Fracture Zone and sites off of Grays Harbor, WA. Figure credit: Center for Environmental Visualization, UW School of Oceanography.
The Slope Base – Cascadia Margin site is located ∼125 km east of Newport, Oregon (OR), adjacent to the continental slope at a water depth of approximately 2,900 m. Here, RCA geophysical sensors focus on detection of seismic and tsunami events associated with earthquakes along the Cascadia Subduction Zone and within the accretionary prism. Shallow Profiler and Deep Profiler moorings with a complementary set of seafloor sensors are directed at understanding processes associated with climate change, ocean and ecosystem dynamics, biogeochemical cycles, and topographic forcing effects in an area impacted by the eastern boundary California Current.
The Southern Hydrate Ridge site (780 m water depth) hosts abundant vigorously venting seeps that emit methane-rich fluids with bubble plumes reaching >400 m above the seafloor, possibly supporting life in the upper water column (Philip et al., 2016). The seeps support dense colonies of methane-metabolizing microbes and animals with methane hydrogen sulfide utilizing symbionts (Suess, 2014). Science drivers include quantifying the flux of methane from the seafloor into the overlying ocean, critical to understanding carbon-cycle dynamics and the impacts of global warming on methane release. Other science drivers include understanding biogeochemical coupling, associated with gas hydrate formation and destruction, and linkages between seismic activity and methane release.
The Oregon Endurance Array Offshore and Shelf Sites include both uncabled and RCA infrastructure (Figure 2). This is a multi-scale array utilizing fixed and mobile assets to observe cross- and along-shelf variability in the coastal upwelling region off the OR coast, while simultaneously providing an extended spatial footprint that encompasses a prototypical eastern boundary current regime (the California Current). This integrated infrastructure bridges processes from the coastal zone (OR and Washington Endurance Arrays; Southern Hydrate Ridge) through their transition into the ocean basin interior (Slope Base and Axial Seamount). These sites are designed to examine biogeochemical and physical oceanographic processes within such highly productive coastal environments (see Section “Coastal Endurance Array”), specifically, the impacts of wind-driven upwelling of nutrient-rich currents on biological communities and hypoxia events.
The Axial Seamount site is located far from the continental shelf (>350 km) and hence represents an open-ocean or pelagic site in the continuum of observing scales represented in the RCA system (Figures 2, 3; Kelley et al., 2014). Here, large-scale currents including the North Pacific Current, the subpolar gyre and the northern end of the California Current interact. These currents transport heat, salt, oxygen, and biota, all of which are crucial to the region’s ecosystem. The currents’ variability arises from forcing with timescales as varied as tide and winds to interannual (El Niño) and decadal (Pacific Decadal Oscillation) processes. Science themes focused on Axial Base include: (1) How, and how strongly do tidal currents break down into turbulence, and what are the feedbacks on the large scale current system? (2) What is the impact of long- and short-term forcing changes on the structure and transports of the large-scale current system? and (3) What are their effects on the ecosystem? Additional focus is on monitoring plate scale seismicity and local earthquakes associated with magma migration within the volcano, as well as spreading events along the Juan de Fuca Ridge and far-field earthquakes.
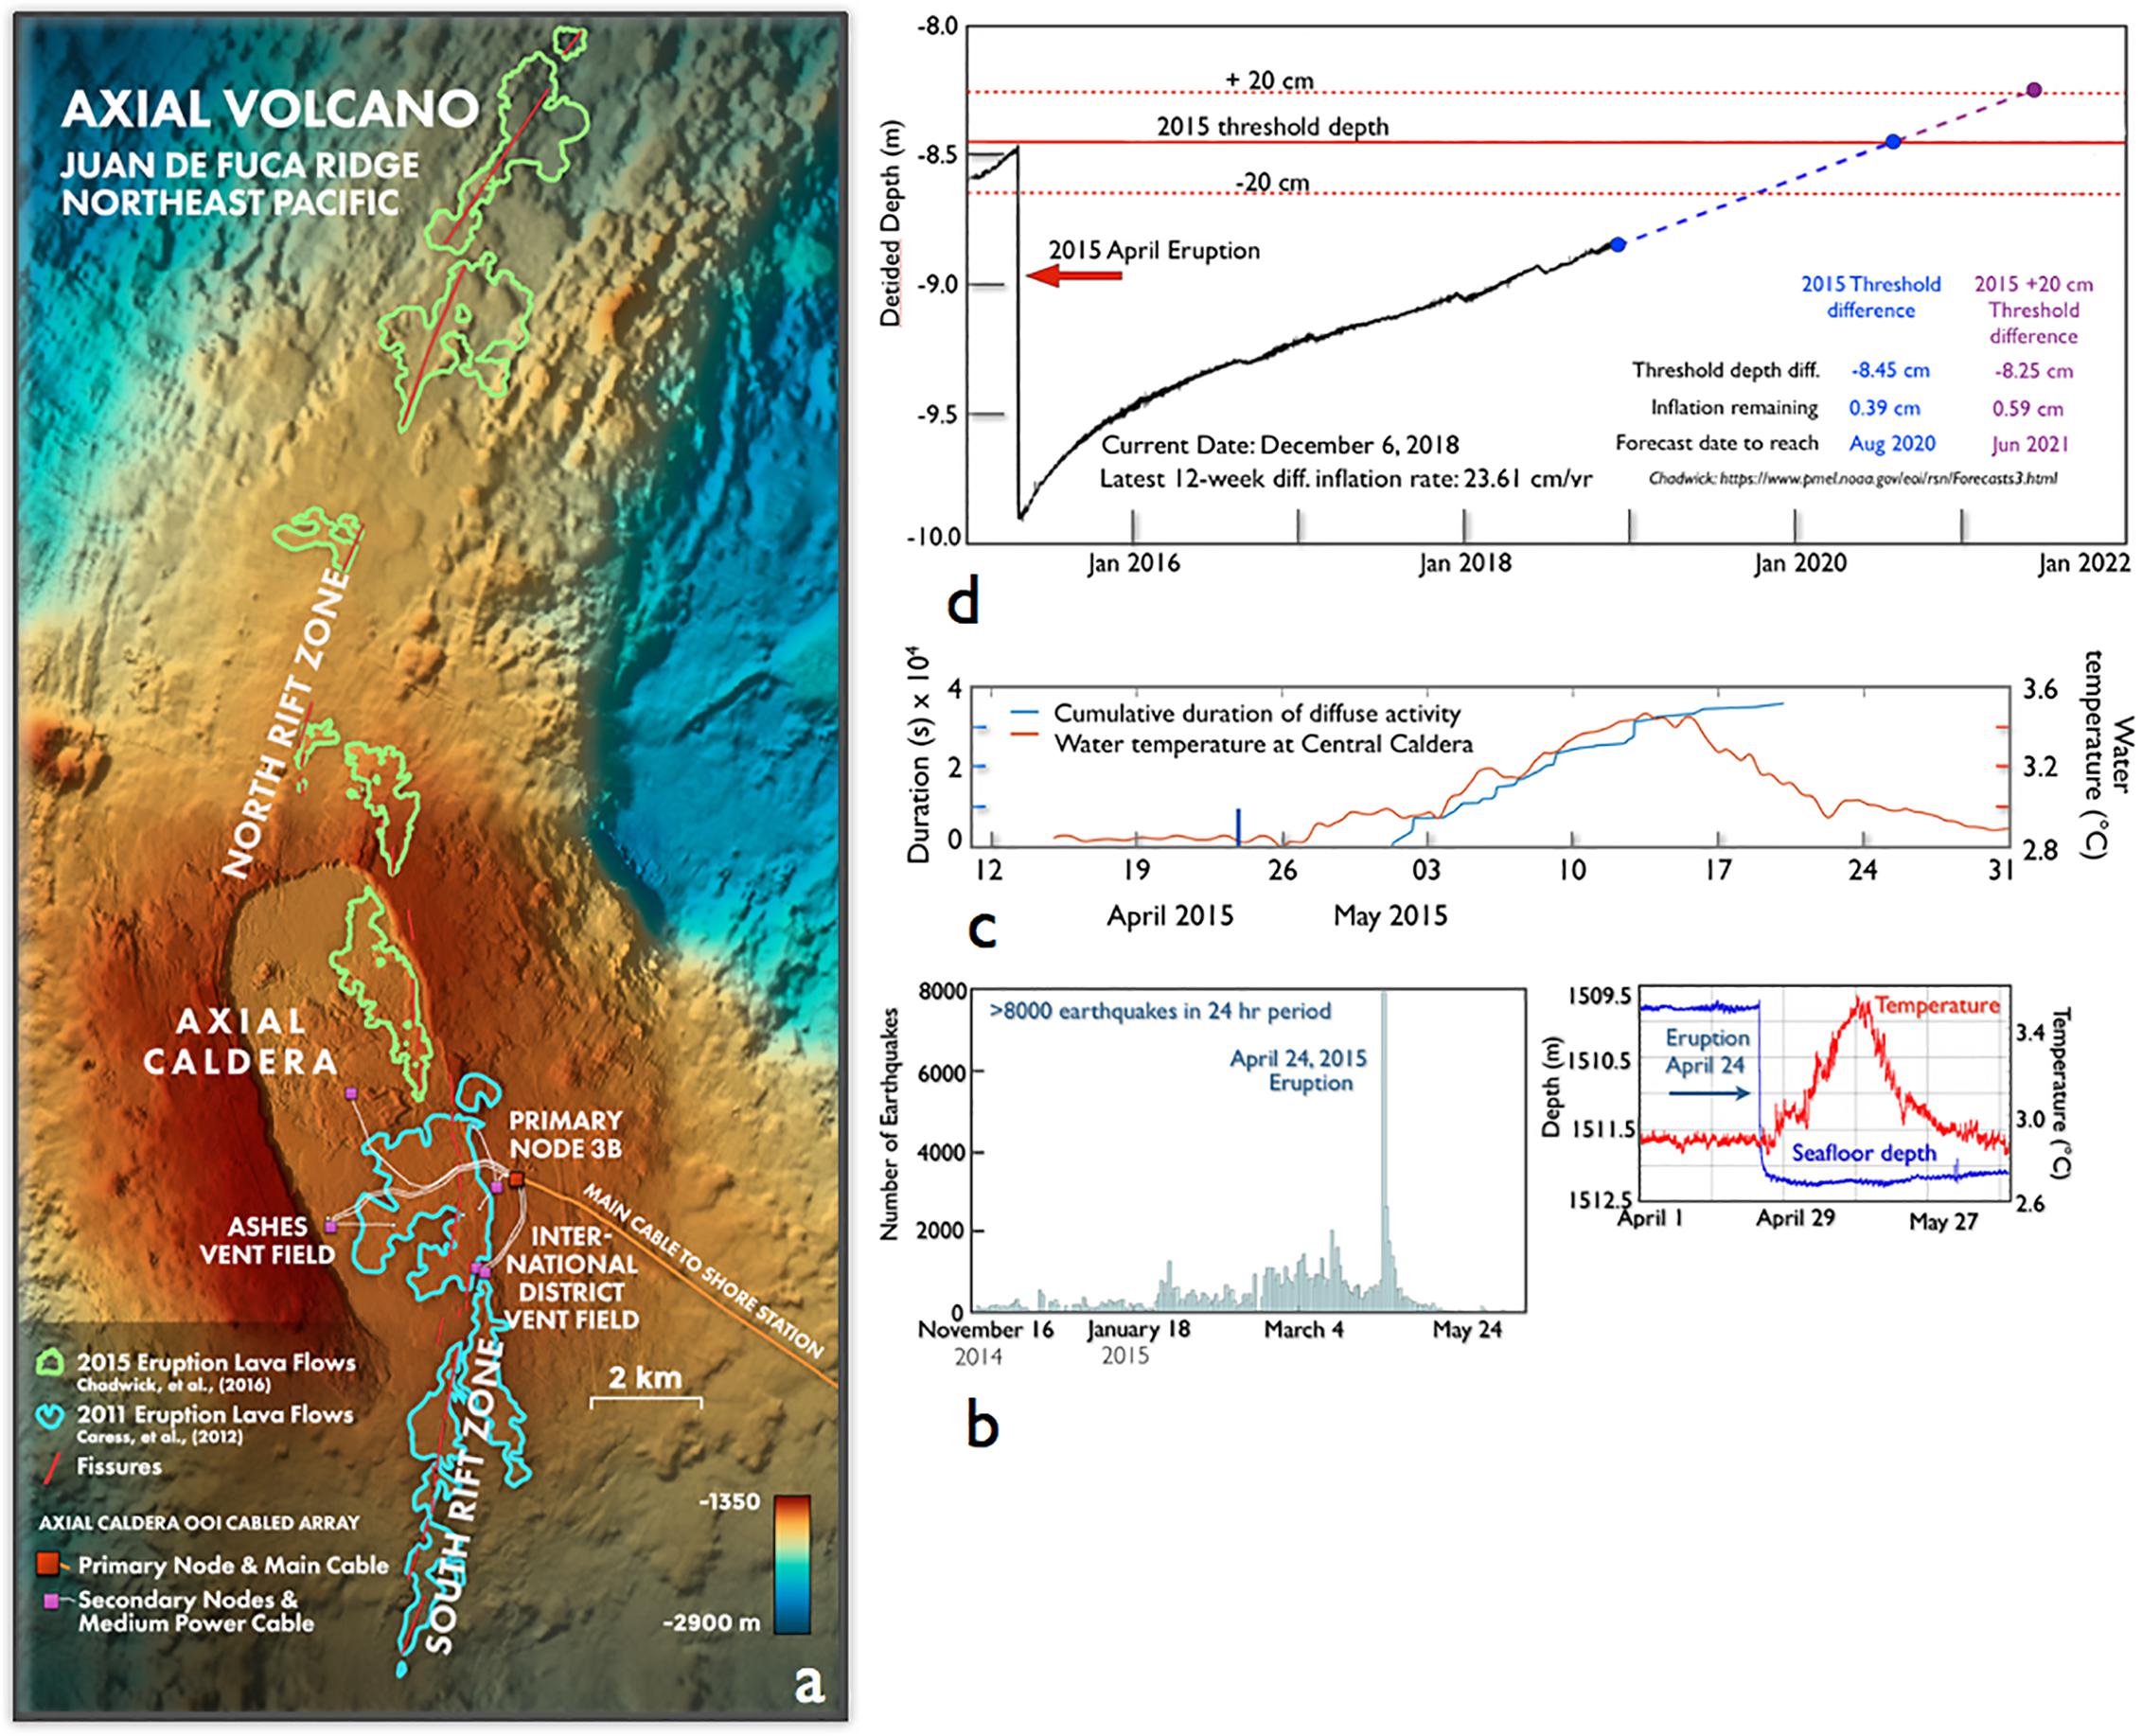
Figure 3. (a) Summit and flanks of Axial Seamount showing location of the 2011 and 2015 eruptions in relation to the RCA infrastructure installed in 2014. Figure credit: Center for Environmental Visualization, UW School of Oceanography. (b) Left – Number of earthquakes each day as streamed to shore live by RCA short-period seismometers and the initiation of the April 24, 2015 eruptive event (after Wilcock et al., 2016). Right – Coincident deflation of the seafloor measured by cabled bottom pressure-tilt instruments and increase in water temperatures (https://www.pmel.noaa.gov/eoi/rsn/24April2015_event.html; after Xu et al., 2018). (c) Diffusive (10–100 Hz) hydrophone signals indicative of explosive events and increase in water temperatures in the caldera following (after Caplan-Auerbach et al., 2018). (dx) Daily forecast of eruptive threshold by W. Chadwick based on detided data from the cabled bottom pressure-tilt instruments.
The Axial Caldera site is the most advanced underwater volcanic observatory in the worlds’ oceans (Figures 2, 3; Kelley et al., 2014, 2016). The submarine volcano, located ∼500 km off the OR coast, is the most magmatically robust volcano on the Juan de Fuca Ridge (Figure 2). A diverse seafloor instrument array at the summit of the volcano focuses on better understanding of crustal formation processes, including diking-eruptive events; relationships between seismic activity and fluid flow in diffuse and black smoker sites; and how changes in fluid temperature and chemistry impacts microbial and macrofaunal communities. Here, formation of snowblowers associated with diking eruptive events provides insights into the deep biosphere.
Infrastructure
The submarine network includes two high power (8 kW) and bandwidth (10 Gb/s) telecommunication fiber-optic subsea cables extending westward from a Shore Station in Pacific City, OR (Figure 2). The northern branch extends ∼480 km across the Juan de Fuca Plate to Axial Seamount. The second branch runs parallel to the northern branch initially, but extends southward 208 km along the base of the Cascadia Subduction Zone (2900 m water depth) and then eastward 147 km to 80 m water depth offshore of Newport, Oregon. The RCA is composed of (1) Primary Infrastructure that includes the Shore Station, ∼900 km of submarine backbone fiber optic cables, and seven Primary Nodes; and (2) the Secondary Infrastructure that includes 33 km of extension cables, 18 junction boxes, 6 moorings, and more than 140 cabled instruments.
Primary Infrastructure
The Shore Station is the terrestrial termination facility for the RCA system (Figure 2). A suite of high-voltage components provides 10 kV DC output for transmission to the undersea cables and nodes. Network management systems allow controlled allocation of resources across the network (e.g., power) and real-time monitoring of communication and power systems for activity, status, utilization, and alarms. The systems also receive and aggregate streaming science data from the Primary Nodes. Three redundant high-bandwidth terrestrial telecommunication backhaul cables provide connectivity from the Shore Station to the Pacific Northwest Gigapop (PNWGP), Seattle, WA. The PNWGP Internet network provides transfer of RCA data to the OOI Cyberinfrastructure at Rutgers University and to the UW Operations Center.
The two northern and southern submarine Backbone Cables provide power and redundant communication to each Primary Node, which are distribution centers for extension cables that provide direct access to the specific sites of scientific interest. Each Primary Node provides 8 kW of total power, 10 GbE bandwidth, and pulse per second (PPS) timing. Five science ports (1 GbE, 375 V), two high- bandwidth science ports (10 GbE, 375 V), and two backbone expansion ports (10 kV) on each node provide power and communication to the secondary junction boxes.
Secondary Infrastructure
Key observational sites are accessed by the Secondary Infrastructure, which includes 33 km of extension cables, 18 low- and medium-power junction boxes and low-voltage nodes, three instrumented Shallow Profiler Moorings, three instrumented Deep Profiler Moorings, and 140 instruments of >30 types.
To access specific experimental sites, low- to medium-power and low-voltage Junction Boxes (Secondary Nodes), designed and built by the UW Applied Physics Laboratory (APL), are connected to the Primary Nodes by extension cables that can reach up to ∼5 km in length. Each junction box includes eight configurable instrument ports, and all 18 have been fully operational since installation in 2014.
Pairs of Deep Profiler and Shallow Profiler Moorings are located at Slope Base (2900 m), on the Oregon Margin at the Endurance Offshore (600 m), and at the base of Axial Seamount (2600 m). The moorings includereal-time command and control, and are designed to measure global and local currents, megaplumes, ocean chemistry (e.g., pH, CO2, nutrients), heat flux, thin layers, and biological parameters (e.g., zooplankton times series distribution and chlorophyll).
The Deep Profiler mooring is a single cabled, vertical mooring that hosts an instrumented McLane wire-following vehicle that measures ocean properties from ∼10 m above the seafloor to ∼ 150 m water depth. A basal docking station provides inductive charging for the vehicle battery and inductive communications during profiling. While in the dock, a Wi-Fi antenna provides high-speed download of stored profiler datasets from the vehicle, with data transmission to shore via the cabled network.
The state-of-the-art cabled Shallow Profiler Mooring is a two-legged mooring built by the UW APL (McRae, 2016). The mooring includes a 3.66 m wide and 7,000-lb platform situated at ∼200 m water depth. Each platform, which receives up to 3 kW power, hosts a stationary, instrumented Platform Interface Assembly and a winched Science Pod that traverses the upper ∼200 m water column to ∼5 m beneath the oceans’ surface, depending on wave conditions. Real-time two-way communication capabilities of the Cabled Array interface with an array of 15 to 18 science instruments. The operating system provides command and control capabilities that include implementation and switching of predefined missions, and changing of mission parameters “on the fly” with commands from the UW Operations Center. Current profiler missions include 9 round-trip profiles/day through the water column with automated stops at specific depths on the downcast of two of them to allow the profiler pod to stop at specific depths and turning of instruments on and off that require stationary measurements (e.g., pCO2). Engineering and science data are streamed back live to shore and the profilers have conducted >30,000 profiles since 2015. Significant expansion capabilities are also built into the mooring assembly for addition of new technologies (e.g., flow cytometers, 3D imagers, DNA analyzers). In concert, the instrument and platform capabilities allow high temporal and spatial measurements (e.g., upcast at 5 cm/s) to be made that were never before possible. Because of shore-based mission control, instruments on the winched Science Pod are particularly well suited to examine, in real-time, biologically rich thin layers 1–2 m thick or less, stemming from small scale chemical or hydrodynamic gradients. A complementary set of instruments near the seafloor address hypoxia, tsunami, and seismic events; internal tides; and flow of currents onto the shelf.
In addition to the water column instruments on the moorings and near the seafloor, an interdisciplinary suite of seafloor instruments is focused on geophysical, biogeochemical, and physical processes associated with deformation along the subduction zone margin, and at Axial Seamount, crustal formation, hydrothermal vents, and methane seeps. Geophysical instruments are located at Slope Base, Southern Hydrate Ridge, Axial Base, and at the summit of Axial Seamount. Many of the geophysical-biogeochemical-physical instruments are novel to the RCA, including in situ mass spectrometers, pore-fluid flow meters, hydrothermal fluid and particulate DNA samplers, bottom pressure-tilt instruments, and a temperature-resistivity instrument and pH-H2S-temperature instrument located in >300°C chimney orifices.
Science Highlights
In 2016, NSF announced opportunities for proposals to use OOI data and to add instrumentation onto the OOI arrays. A key outcome of this was that numerous awards were made to non-OOI Principal Investigators (PIs) to add instrumentation onto the RCA, facilitated by the systems significant built-in expansion capabilities and real-time command and control and data flow. New awards were distributed among multiple funding agencies that included the NSF, Office of Naval Research, NASA, and an international award from Germany. PI instrument awards included the addition to the RCA of two instruments that provide high resolution drift-corrected pressure measurements for geodynamic studies on volcanoes and subduction zones; a short baseline flipping tilt meter for deformation studies at Axial, with follow-on applications for detecting slow slip events; sonars for quantifying hydrothermal plumes and bubble plumes emanating from methane seeps and associated changes in seafloor geomorphology; and energy extraction from hydrothermal vents.
Several NSF OOI data-use awards were made also made for numerous RCA data projects focused on Axial Seamount, with emphasis on the 2015 eruption. Results from these studies provide unprecedented insights into the eruptive evolution of this highly active volcano and have led to the first predictive models of when a submarine eruption will occur (Figure 3) (Nooner and Chadwick, 2016). On April 24, 2015 the cabled network captured live the eruption of Axial. Over an ∼24 h period >8,000 earthquakes were recorded (Wilcock et al., 2016) and the seafloor fell by >2 m (Nooner and Chadwick, 2016). Several lava flows erupted on the Northern Rift, one of which reached 127 m in thickness (Kelley et al., 2014; Chadwick et al., 2016). Over 37,000 water-born impulsive events, consistent with underwater explosions, were recorded spatially associated with the lava flows (Wilcock et al., 2016). Explosions near the northern flows continued until May 21, coincident with when the caldera started inflating again (Wilcock et al., 2016). Diffuse, prolonged broadband signals over four distinct time periods starting April 24 and lasting ∼2 min to 1 h duration are interpreted to reflect explosive degassing and production of ash material similar to explosive volcanism observed in Hawaii (Caplan-Auerbach et al., 2018); ash was also observed on RCA instruments in the central portion of the caldera. Some of the diffuse signals were coincident with an 0.6–0.7°C increase in water temperatures across the southern half of the caldera, which may reflect the release of warm dense brines previously stored in the crust (Xu et al., 2018) through phase segregation processes associated with boiling and supercritical phase separation (Butterfield et al., 1990; Kelley et al., 2002). Warm circulation of fluids within and out of the northern flows, elevated in methane and hydrogen, formed snow blowers and near seafloor plumes with microbiologically distinct communities (Spietz et al., 2018). Real-time data from the RCA bottom pressure-tilt instruments at Axial are currently incorporated into inflation models for forecasting when thresholds will may be reached for a new eruption, based on the three prior eruptive events (Chadwick1).
Coastal Endurance Array
Science Drivers
As far back as 2003, a research-driven coastal observatory was visualized as a long-term Endurance Array and a relocatable Pioneer Array (Jahnke et al., 2003). The Endurance Array would provide continuous observations at key locations, documenting episodic events and longer-term changes and would complement existing and planned regional observations. The Pioneer Array (Section “Coastal Pioneer Array”) in turn would provide higher resolution for process studies.
The OOI Endurance Array proposed and funded from these early concepts is located off the coasts of Oregon and Washington in an archetypal coastal upwelling system. Its location, platforms and sensors were designed to address the major OOI Science Themes of Ocean-Atmosphere Exchange, Ocean Circulation, Mixing and Ecosystems, Climate Variability and Ecosystems, and Coastal Ocean Dynamics and Ecosystems with a particular focus on Hypoxia on Continental Shelves and Shelf/Slope Exchange (ORION Executive Steering Committee, 2007).
Physically, the coastal ocean off Oregon and Washington is characterized by a relatively narrow shelf, wind-driven upwelling and downwelling, and buoyancy forcing from regional rivers including the Columbia River, the largest source of freshwater to the US west coast. Regional mesoscale variability is forced by bathymetry, fluid dynamical instabilities and coastally trapped waves. At the largest scales, interannual variability is forced by fluctuations in the tropical Pacific (e.g., El Niño Southern Oscillation), as well as variations in the large-scale circulation of the North Pacific (e.g., Pacific Decadal Oscillation).
The chemical and biological variability of the regional ecosystem is embedded within the larger California Current Ecosystem (Mackas, 2006). Oregon and Washington coastal waters are home to a diverse range of fisheries that rely on the injection of nutrients into the euphotic zone by upwelling and the subsequent blooms of phytoplankton that form the base of the oceanic food web. The amount and timing of the spring-summer upwelling season is crucial to the regional ecosystem. At longer time scales, interannual variability can drive ecosystem variability such as swings between northern, “fatty” zooplankton and southern, “skinny” zooplankton (Peterson and Schwing, 2003).
In recent years, hypoxic and even anoxic events have regularly occurred off Washington and Oregon as they have in upwelling regions worldwide (Grantham et al., 2004; Chan et al., 2008). During these same years, the threat of Ocean Acidification to marine organisms in this area and across the California Current Ecosystem has become very clear (Feely et al., 2008; Barton et al., 2012; Klinger et al., 2017). While a known threat to ocean and human health, harmful algal blooms in this region (Trainer et al., 2009) were particularly severe during recent years with the upper-ocean warming introduced by the “Warm Blob” (McCabe et al., 2016; McKibben et al., 2017).
Within the coastal ocean, physical processes, water properties and biological community size and composition vary most strongly in the cross-shelf direction. A well-instrumented array spanning the continental shelf is key to sorting out physical and ecosystem response across this strong gradient. Shelf stratification and upper-ocean properties differ north and south of the Columbia River, so observations along both lines are needed to understand coastal ocean ecosystem responses. The whole system shows strong, linked variability from diurnal to synoptic, seasonal and interannual time scales. The observational requirements that ocean properties from physics, to chemistry to biology be measured on many different time and space scales drive the design of the Endurance Array infrastructure.
Infrastructure
The Endurance moored array includes the Oregon Line, off Newport near 44.6°N, and the Washington Line, off Grays Harbor near 47°N (Figure 4). These lines each have three sites. One at the inner shelf (∼25–30 m water depth, 4–6 km from shore, “Inshore”), the “Shelf” (∼80–90 m depth, 20–30 km from shore), and the continental slope (∼500–600 m depth, 60–65 km from shore, “Offshore”). These cross-shelf locations were chosen to sample distinct dynamical regions: the inner shelf where wind, waves and river plumes all influence the circulation and stratification, and where the ocean connects to the sandy shores and rocky intertidal reefs; the shelf where upwelling fronts, alongshore jets and plankton blooms are found, and where the bottom is muddy and near-bottom hypoxia has been observed to peak; and the continental slope where a subsurface, poleward undercurrent exists, zooplankton migrate from a few hundred meters to the surface each day and night, and wind-stress curl and offshore eddies interact with the coastal circulation.
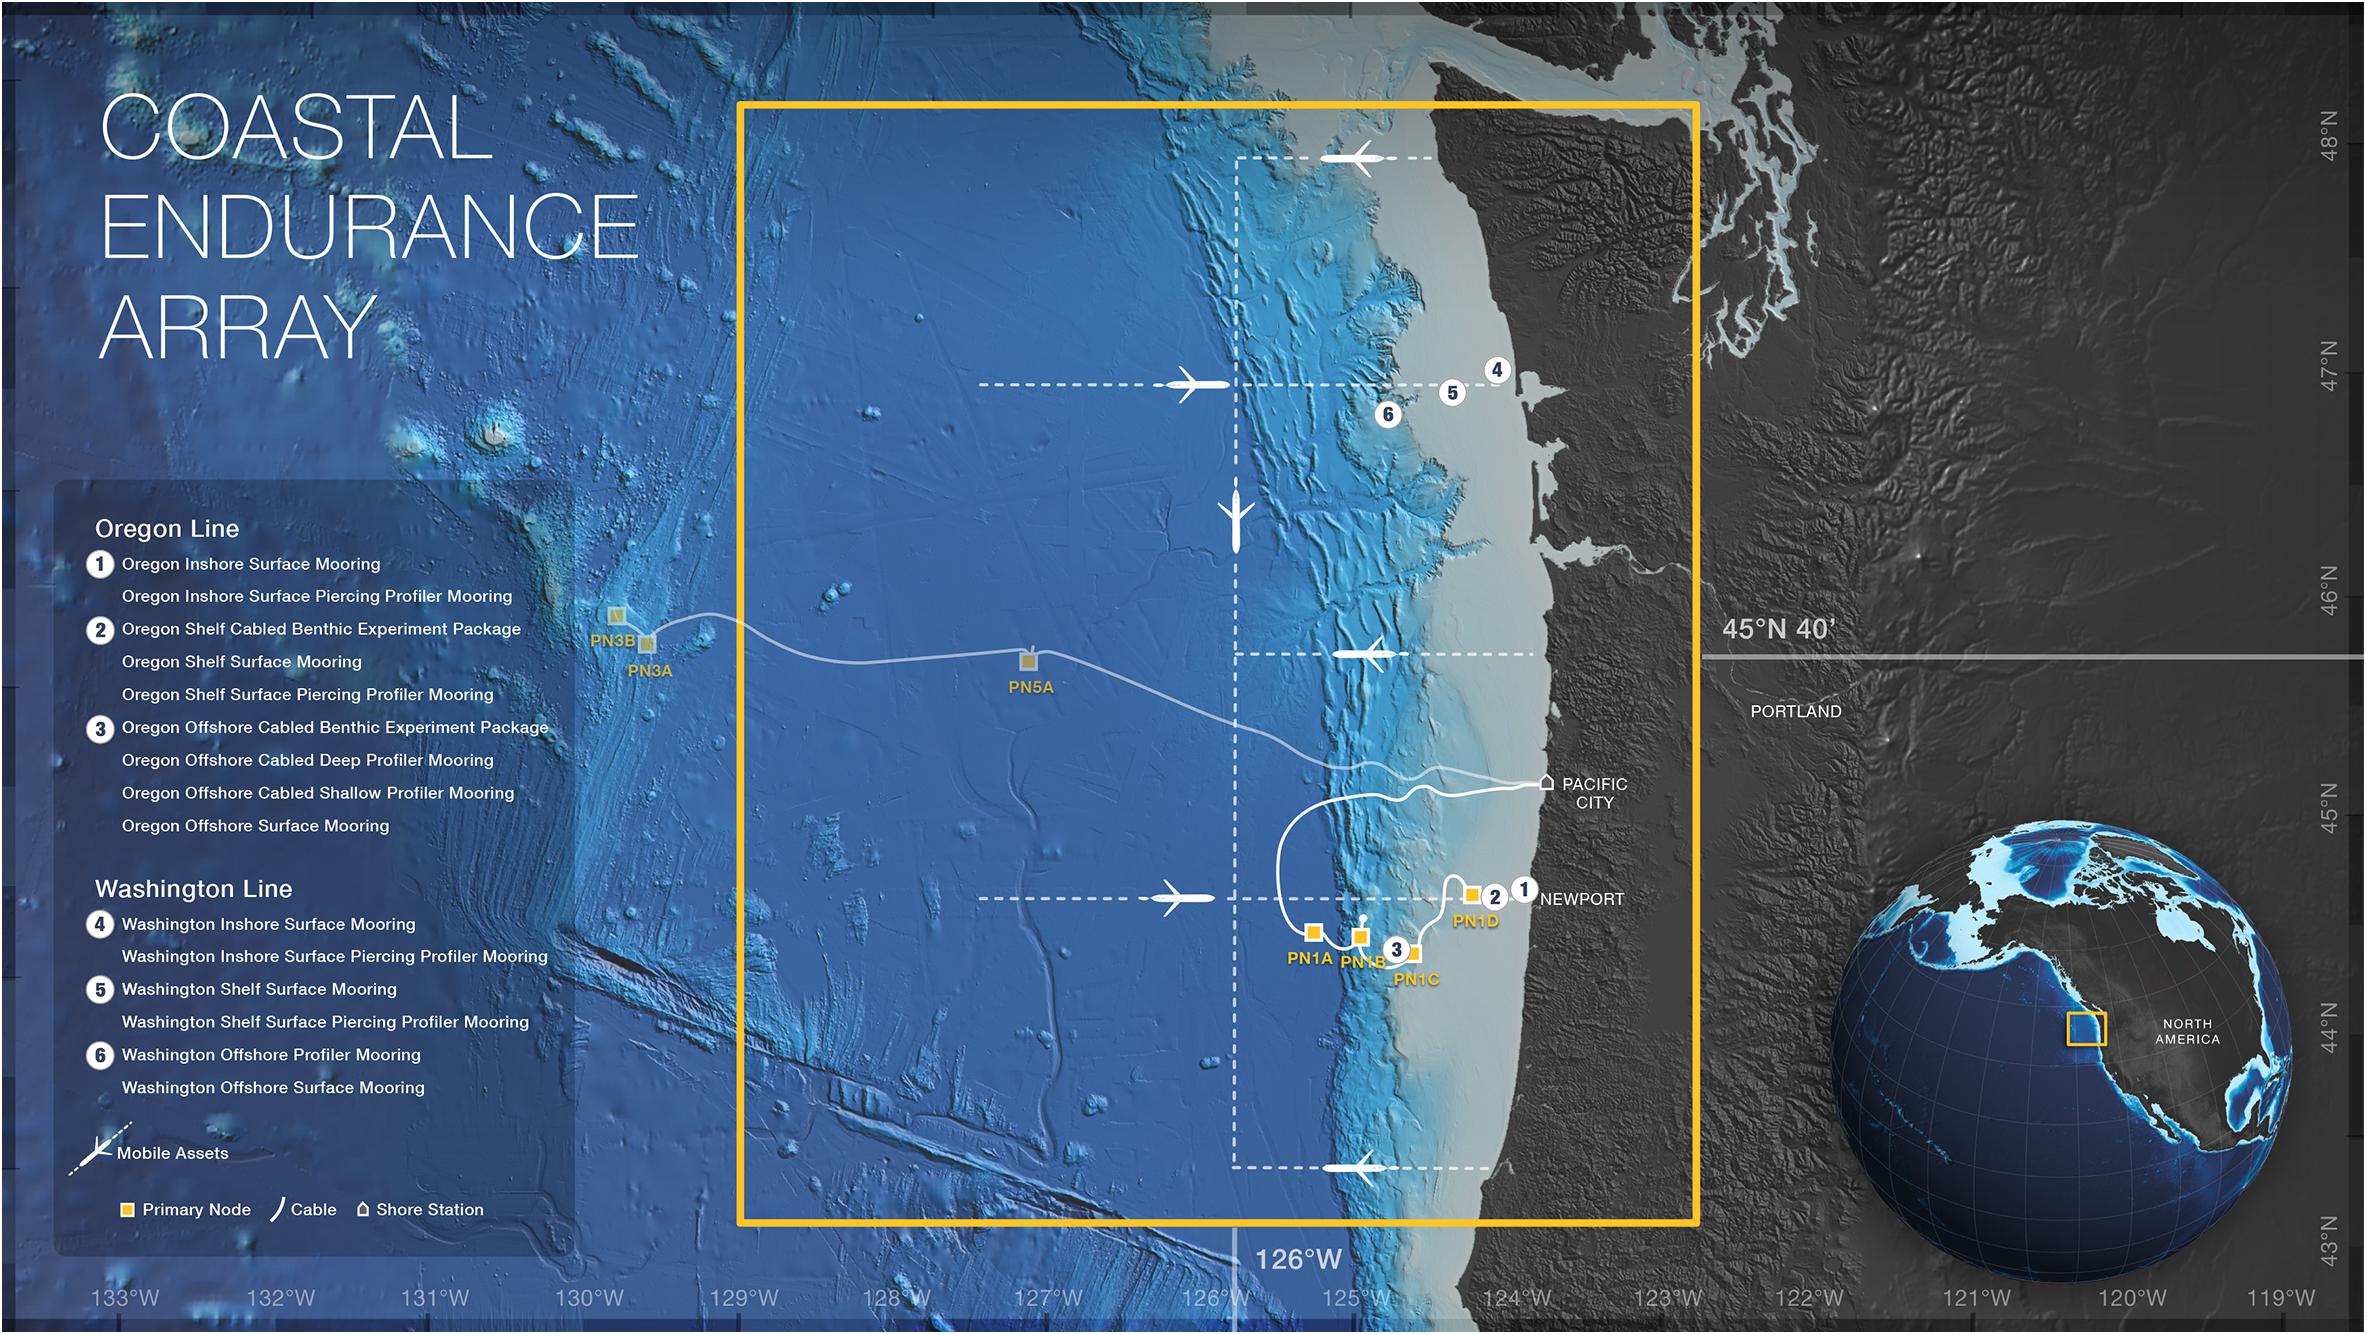
Figure 4. The Endurance Array mooring locations (numbered dots) and glider track lines (dashed) are shown relative to the Pacific Northwest US continental shelf (gray) and slope (medium blue). The Endurance array mooring lines include the Washington Line sampling north of the Columbia River and the Oregon Line sampling south of the river. The Oregon line is tied in with the Regional Cabled Array at the Oregon shelf and offshore sites. Figure credit: Center for Environmental Visualization, UW School of Oceanography.
The Endurance Array shares platform types found across the OOI. Each Endurance Array site includes a surface buoy with measurements, profiling water column measurements and near bottom measurements. On the Oregon line, the Endurance Array near-bottom and water column instruments are operated and maintained as part of the Regional Cabled Array (Section “Regional Cabled Array”). Glider lines connect the Endurance Array sites in the cross-shelf direction and provide some measure of along-shelf resolution.
The Endurance Array employs three types of surface moorings, the coastal surface mooring (CSM), inshore surface mooring, and coastal profiler mooring (CPM). At the shelf and offshore sites, CSMs such as the one shown in Figure 5 support meteorological and oceanographic instruments on the buoy. Within the euphotic zone, there is a highly instrumented platform at 7-m depth. Physical, chemical and bio-optical measurements are made here. These buoys and their near surface frames are the same design used on the Pioneer Array (see discussion in Section “Coastal Pioneer Array”). At the Oregon shelf and offshore sites, the buoys are connected to an un-instrumented recovery frame at the bottom. For these sites, the near bottom observations are provided by the benthic experiment packages deployed as part of the RCA (Figure 5 and Section “Regional Cabled Array”). At the Washington sites and at the Oregon inshore site, the surface moorings are connected to an instrumented multifunction node as at the Pioneer Array. This platform is similar to the bottom frame depicted below the surface mooring in Figure 5, but it is fully instrumented with near-real time reporting through the surface mooring. The cabled benthic experiment packages and instrumented multifunction nodes are designed to provide similar capabilities insofar as is possible.
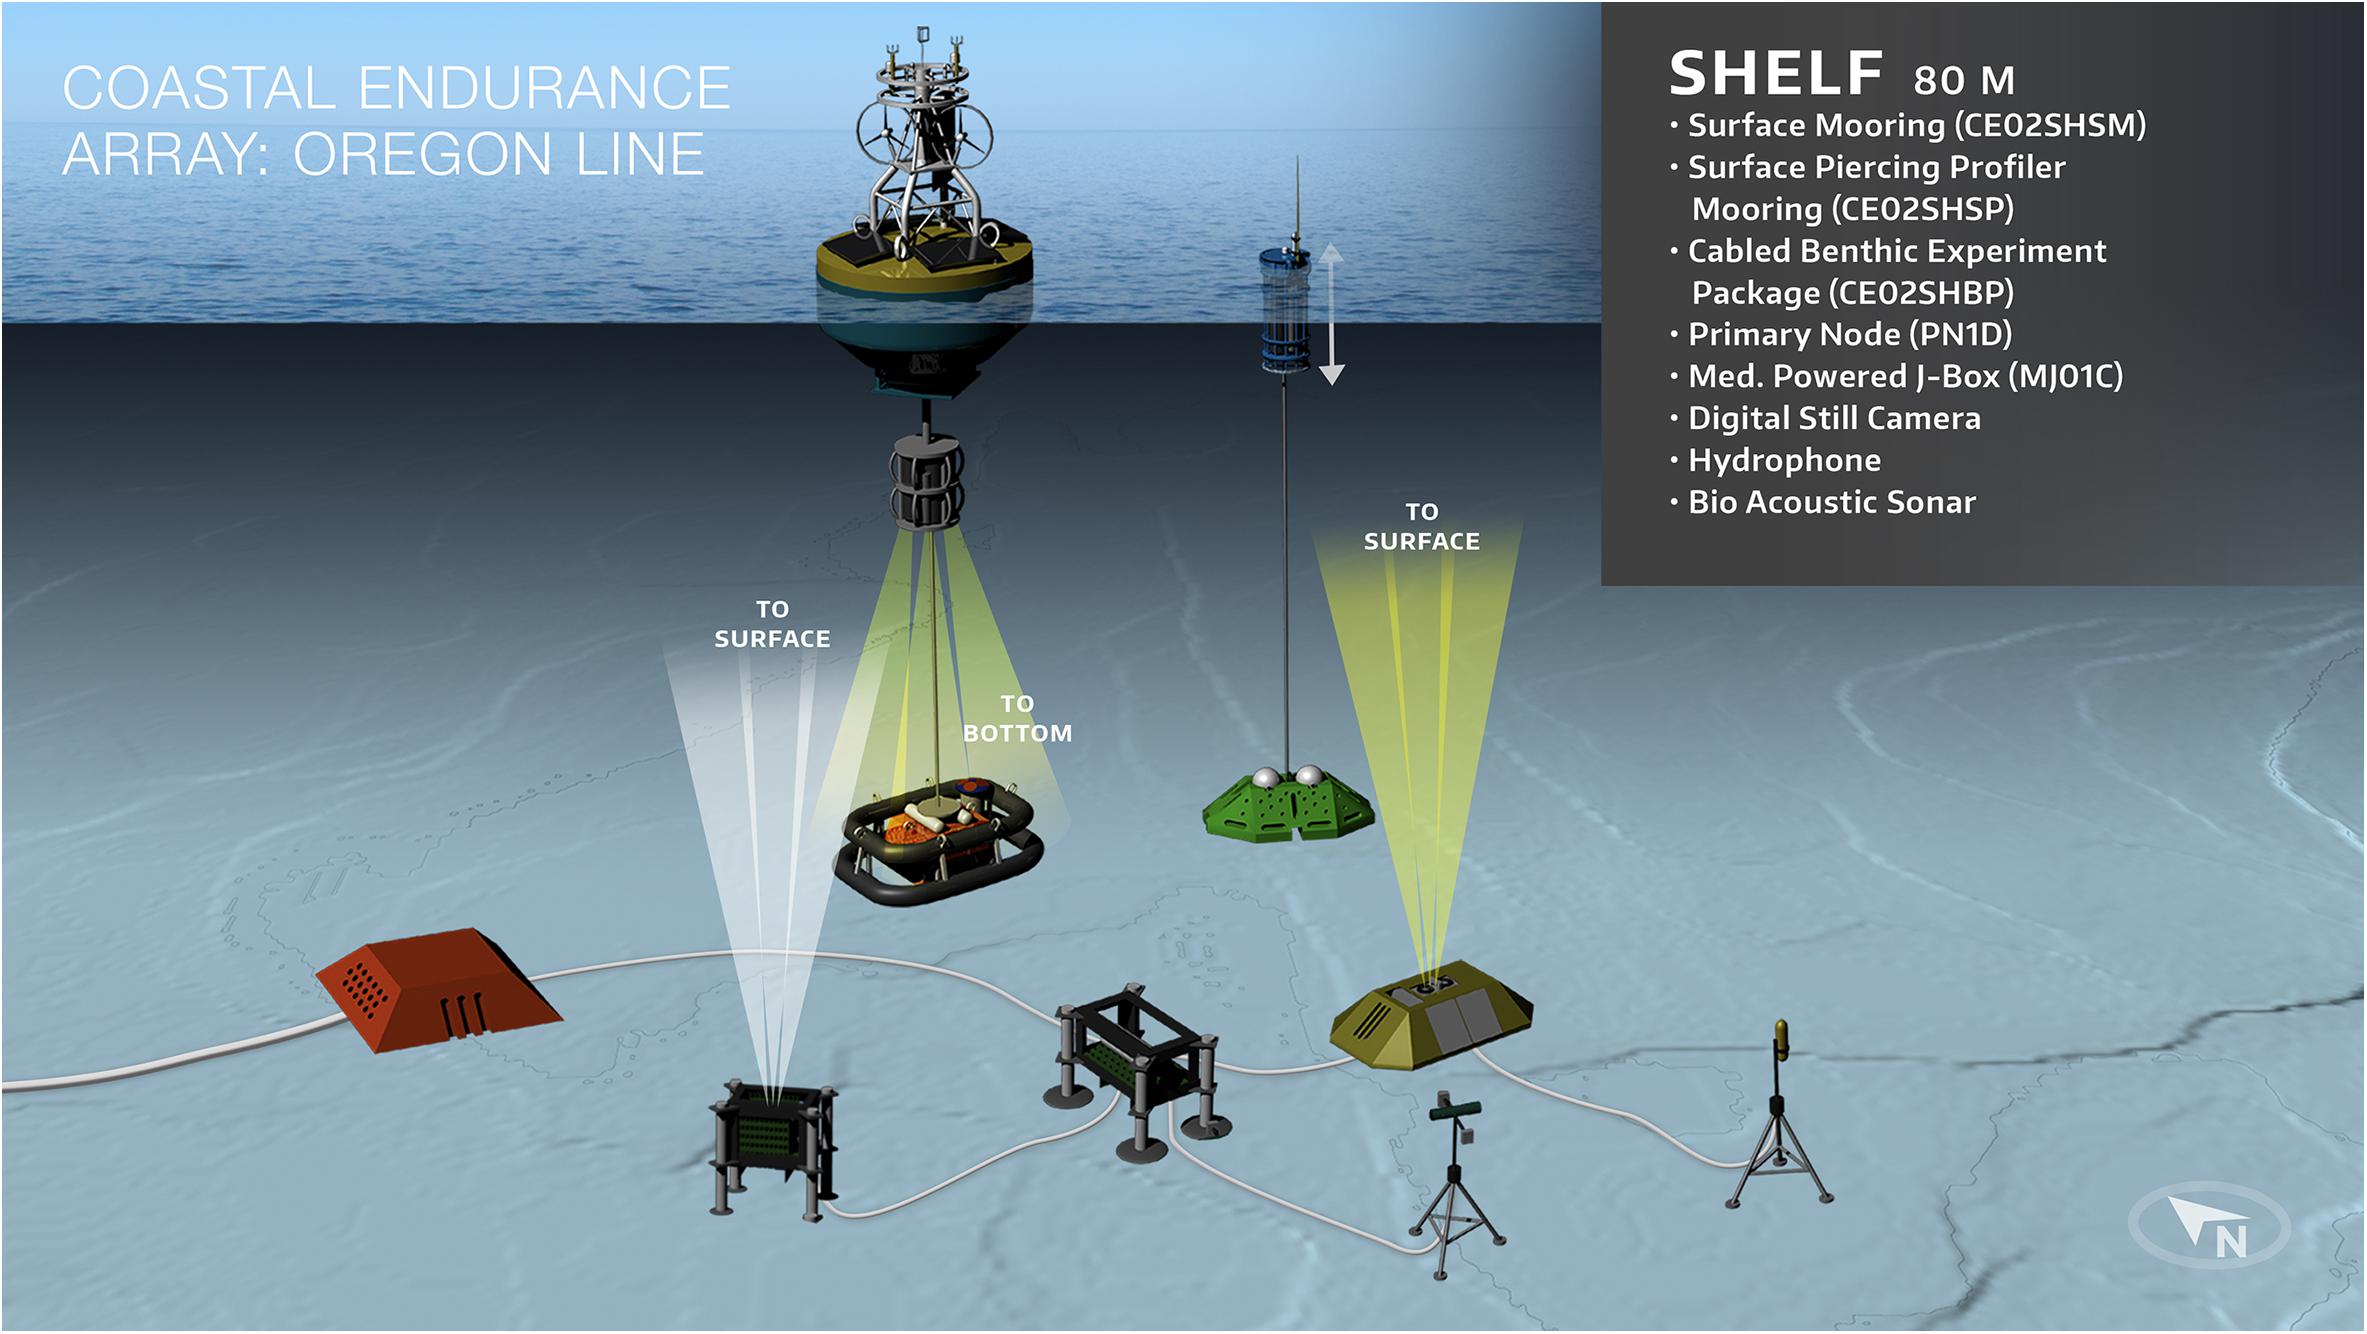
Figure 5. Schematic of the Endurance Array Oregon Shelf site showing the platforms spanning from the air-sea interface to the seabed. The surface mooring includes buoy and near surface instrument frame sensors. The coastal surface piercing profiler provides high vertical resolution water column measurements. The Oregon Shelf and Offshore sites link the Regional Cabled Array (RCA) and the Endurance Array. The near-bottom sensors at this site are part of the RCA. While platform types vary across the Endurance Array, other sites provide analogous top to bottom coverage. Figure credit: Center for Environmental Visualization, UW School of Oceanography.
The second type of surface mooring deployed on the Endurance Array is the inshore CSM. These moorings are designed to provide year round coverage at the Oregon and Washington inshore sites. Due to high wave events in winter, the inner-shelf has historically been a very difficult area to measure. Endurance inshore moorings meet this challenge using submersible surface buoys attached to the seafloor instrument package with a flexible mechanical and electrical element that can stretch up to two times its length. The moorings have a reduced set of measurements on the buoy itself, but have the same near surface and bottom platforms and instruments as other OOI CSMs.
All Endurance surface moorings are paired with a profiling mooring to link the surface and bottom fixed measurements. The Endurance Array has four types of profilers. All have self-contained instrument packages that move up and down through the water column and provide fine (0.25 m) vertical resolution at a fixed location. At the Oregon offshore site, the surface mooring is paired with the RCA Shallow and Deep Profiler Moorings (see Section “Regional Cabled Array”). These profilers use the high power and bandwidth capabilities of the RCA. Other Endurance sites are paired with uncabled profilers. At the Washington offshore site, the surface mooring is paired with the third surface mooring type on Endurance. The CPM supports an uncabled wire following profiler identical to those deployed on Pioneer (see Section “Coastal Pioneer Array”). These profilers carry low-power instruments measuring temperature, salinity, pressure, water velocity, light, chlorophyll fluorescence, light backscatter from particles, and dissolved oxygen.
The Endurance shelf and inshore sites off Oregon and Washington (four sites total) are paired with coastal surface piercing profilers (CSPP’s) as shown in Figure 5. Endurance Array engineers and scientists worked with Sea-Bird Scientific’s WET Labs to make the original autonomous coastal profiling concept (Barnard et al., 2010) more robust. The CSPP’s measure from a few meters above the sea floor to the air-sea interface. Their capability to measure to the air-sea interface is unique among OOI profilers. CSPP instruments include nitrate, light attenuation and absorption, and spectral irradiance in addition those noted above. CSPP’s are part of the year round sampling plan at the Oregon and Washington shelf sites. At the inshore sites, CSPP’s are deployed between about April and September as the wave climate precludes deployment between October and March.
Underwater gliders provide the greatest geographic coverage, spanning about 500 km from northern Washington south to Coos Bay, Oregon (Figure 4). The two glider lines on the Endurance Array main mooring lines of Newport, Oregon, and Grays Harbor, Washington, run from the coast to 128°W, about 300 km. Gliders with 200-m buoyancy pumps sample the inshore parts of the cross-shelf lines weekly in order to capture wind-driven changes, while gliders equipped with 1000-m pumps sample the offshore parts of the lines less frequently to measure the more slowly varying deep ocean. Glider coverage is prioritized along the Washington and Oregon lines. The gliders sample the fine vertical structure of the ocean from the sea surface to within meters of the seafloor or up to 1000 m depth, whichever is deepest. Endurance coastal gliders have the same low-power sensors as those on Pioneer. Sensors consist of CTD, photosynthetically active radiation, oxygen, three-channel bio-optics (chl-a, CDOOM fluorescence and backscatter), and 600 kHz ADCP.
All the Endurance Array platforms and sites including profilers and gliders measure essential ocean variables such as temperature, salinity, pressure, water velocity, chlorophyll fluorescence, and dissolved oxygen. Instruments that require significant power, space and bandwidth are deployed as fixed instruments on the moorings. These instruments include the full suite of meteorological instruments on the buoys, and chemical, bio-optical and bio-acoustic instruments near the surface and at the bottom. A partial list of Endurance fixed depth measurements includes partial pressure of carbon dioxide, pH, nitrate, multi-spectral optical attenuation and absorption, spectral irradiance, three frequency acoustic backscatter, and digital still images. Together, the Endurance moored instruments monitor and characterize many elements of the local physics, chemistry, and biology.
The Endurance instrument sampling protocols are designed to satisfy science requirements for observing coastal ocean phenomena. On the surface moorings, all instruments collect at least one burst of data per hour and there additional evenly spaced bursts as there is power to support. A few instruments are limited by chemical reagents and a couple are limited by calibration drift. The uncabled Coastal Surface Piercing Profiler is designed so that its instruments can measure the water column with the same 0.25-m resolution as the underwater gliders; the CSPP’s CTD measures every 1.5-cm with the goal to resolve “thin layers” of plankton.
Science Highlights
Here we focus on results pertinent to two Key Endurance science drivers, Climate Variability and Ecosystems, and Hypoxia on Continental Shelves. Henderikx Freitas et al. (2018) describe and contrast variability between the Washington and Oregon shelves using OOI and satellite data. Barth et al. (in press) use OOI data to describe short term changes in hypoxia over the Oregon inner shelf in response to wind forcing.
Henderikx Freitas et al. (2018) incorporate OOI mooring, and glider estimates of chlorophyll-a and chromophoric dissolved organic matter (CDOM) fluorescence over the Endurance Washington and Oregon lines to characterize seasonal patterns cross-shelf gradients in particle concentrations between the Washington and Oregon shelves. The Columbia River exerts a strong seasonal influence on the Washington shelf, but smaller coastal rivers and resuspension processes also appear important in determining particle distributions nearshore during winter. Glider chlorophyll fluorescence is similar in magnitude across the two shelves for the period examined. The in situ observations contrast with differences observed from satellite data, which show higher chlorophyll concentrations off the Washington coast. Their research suggests that differences in CDOM between Washington and Oregon may be a partial explanation for perceived trends in satellite-derived chlorophyll. However, greater temporal and spatial coverage of OOI data sets is needed to more conclusively link physical forcing and biogeochemical responses.
Barth et al. (in press) use OOI Endurance Array data to describe a low-oxygen event off central Oregon. Changes in near-bottom oxygen off central Oregon vary through the summer season (Adams et al., 2013), but can also vary on the time scale of days as the wind-driven upwelling circulation advects the low dissolved oxygen pool back and forth across the shelf. Data from July 2017 illustrate this variability when several upwelling-favorable (southward) and downwelling-favorable (northward) wind events lasting from 2 to 10 days influenced near-bottom oxygen off Newport, Oregon (Figure 6).
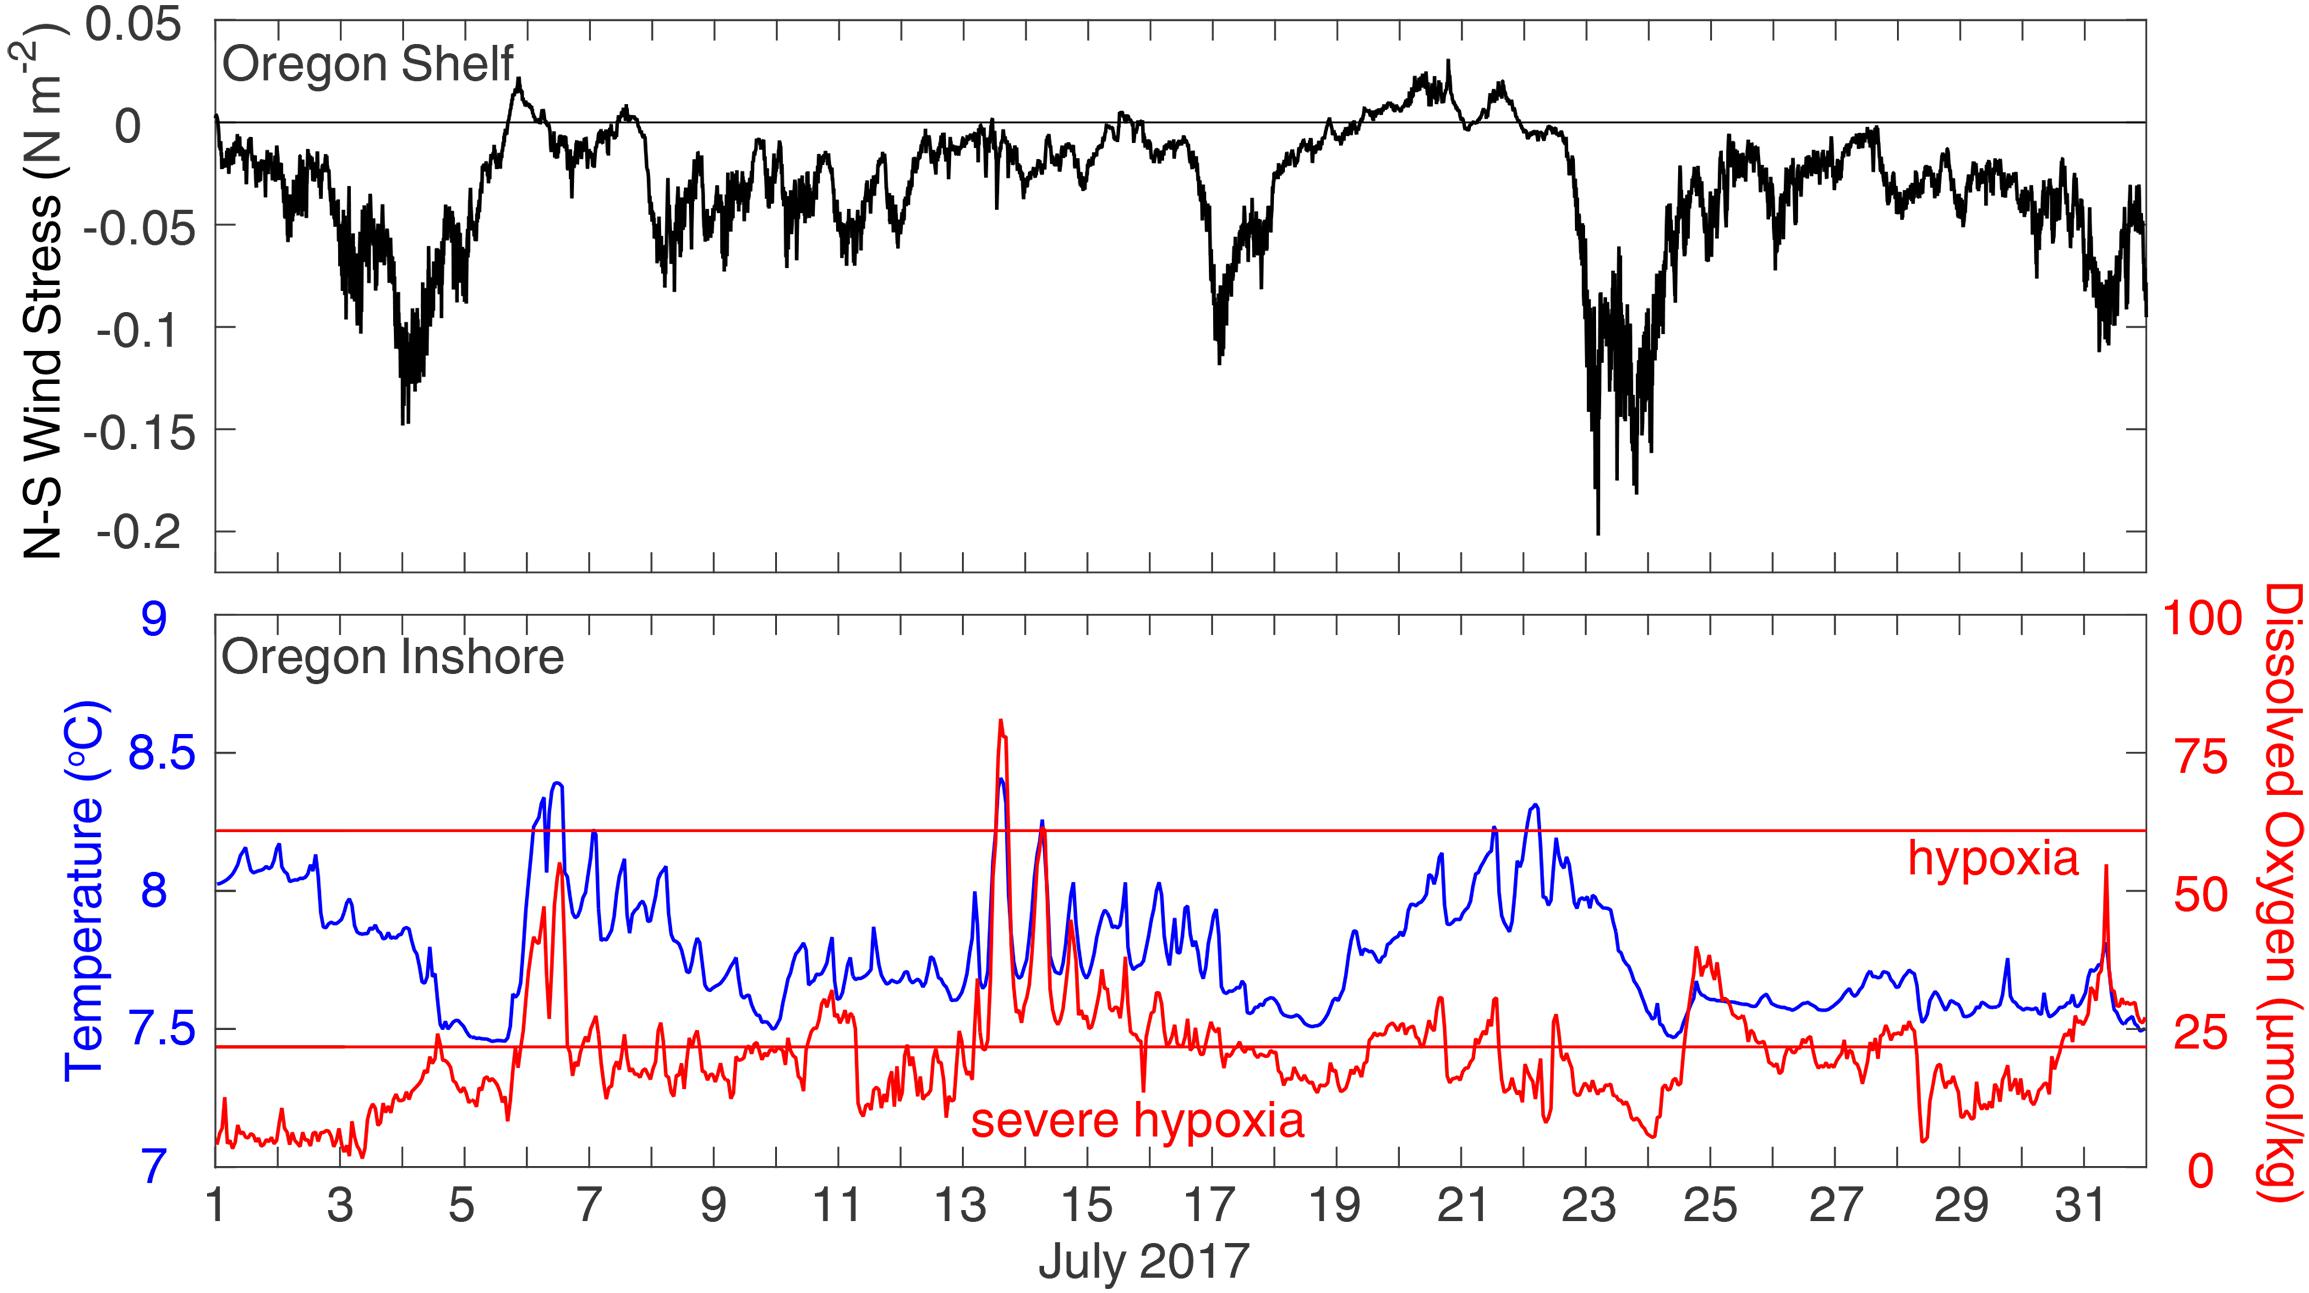
Figure 6. Dissolved oxygen (μ Mol kg−1, red) and temperature (°C, blue) from near the bottom at the 25-m OOI Oregon Inshore mooring, and north-south wind stress (N m−2, black) from the OOI Oregon Shelf surface mooring. Levels of dissolved oxygen for hypoxia (∼62 μ Mol kg−1, 1.4 mL/L) and “severe” hypoxia (∼22 μ Mol kg−1, 0.5 mL/L) are indicated by horizontal red lines (Adapted from Barth et al., in press). Reproduced with permission from the Oceanography Society.
During this time, near-bottom dissolved oxygen levels at the bottom of the OOI Oregon Inshore Surface mooring were often below the hypoxia threshold. When winds blow to the south, the near-bottom temperature decreases due to coastal upwelling, with a slight lag relative to the wind. During these upwelling events, near-bottom oxygen usually decreases, a good example of which is from 23 to 25 July. Conversely, during wind relaxation or downwelling the near-bottom temperature and dissolved oxygen increase rapidly. These changes are consistent with the upwelling circulation drawing near-bottom cold water low in dissolved oxygen toward the coast during upwelling and pushing warm water containing more oxygen down and away from the coast near the bottom during downwelling. The dissolved oxygen does not follow the winds or temperature as clearly as temperature follows the wind because there are the additional biological processes of photosynthesis and microbial decay that raise or lower dissolved oxygen levels, respectively. Since this report, OOI data continue to be used to characterize hypoxia in summer 2018. There is increasing interest in, and use of, OOI data by mission oriented agencies such as the Oregon Department of Fish and Wildlife.
From a larger northeast Pacific perspective, the Endurance Array is part of a more extensive observational capability in this region that includes the OOI Cabled Array, the OOI global site at Station Papa augmented by National Oceanic and Atmospheric Administration (NOAA) assets (see Section “Global Arrays”), the Ocean Networks Canada NEPTUNE and VENUS arrays, observations acquired by the Northwest Association of Networked Ocean Observing Systems (NANOOS) and other assets (see Barth et al., in press). This combination of ocean observatories allows regional climate and ocean phenomena to be tracked from formation to impact. An excellent example, predicted during the design phase of the OOI, was the formation of an anomalous “Warm Blob” in the Gulf of Alaska during late 2013 and early 2014 and its subsequent spread to the US west coast over recent years (Bond et al., 2015).
Coastal Pioneer Array
Science Drivers
The primary science driver for the Pioneer Array is understanding the processes of cross-frontal exchange between the continental shelf and slope, and their relation to synoptic, seasonal, and inter-annual forcing. The Pioneer Array is most closely aligned with themes (1), (2) and (4) of the OOI (ORION Executive Steering Committee, 2005): ocean-atmosphere exchange, climate variability, ocean circulation and ecosystems, and coastal ocean dynamics and ecosystems. The key science question articulated in the OOI Science Prospectus (ORION Executive Steering Committee, 2007) remains valid: How do shelf/slope exchange processes structure the physics, chemistry, and biology of continental shelves? This overarching question was refined at a 2011 community workshop to include four additional concepts: nutrient and carbon cycling; phytoplankton production, distribution, and diversity; extreme events, including winter storms and hurricanes; and controls on distribution and abundance of zooplankton and higher trophic levels.
Exchange processes transferring heat, salt, nutrients and organic matter between continental shelves and the deep sea are complex due to spatial and temporal complexity on a range of scales. Horizontal scales range from a few kilometers to 100 km, while vertical scales range from a few meters to the full water column (∼100 m). It is difficult for a given observing platform type to effectively observe this range of scales. Some exchange processes occur over a few days and others may be sustained for months. Extreme events such as storms and the interaction of Gulf Stream eddies and filaments play important roles in exchange, but intermittent and only occasionally observed by expeditionary observing approaches.
The Pioneer Array is located over the continental shelf and slope in the Northwest Atlantic Ocean, centered about 80 nm south of Cape Cod (Figure 7). The characteristic dynamical feature in the region is the shelfbreak front. The front separates relatively cold, fresh water on the continental shelf from the warmer saltier water of the slope sea. The front is typically located near break in topography between shelf and slope – roughly the 150 m isobath. The Pioneer Array location was chosen to focus on frontal processes and to minimize the influence of other features such as canyons, river outflows, and the Gulf Stream. Prior process studies in the region provided information about the horizontal, vertical, and temporal scales in the region, allowing a deliberate approach to array design (Gawarkiewicz and Plueddemann, in press).
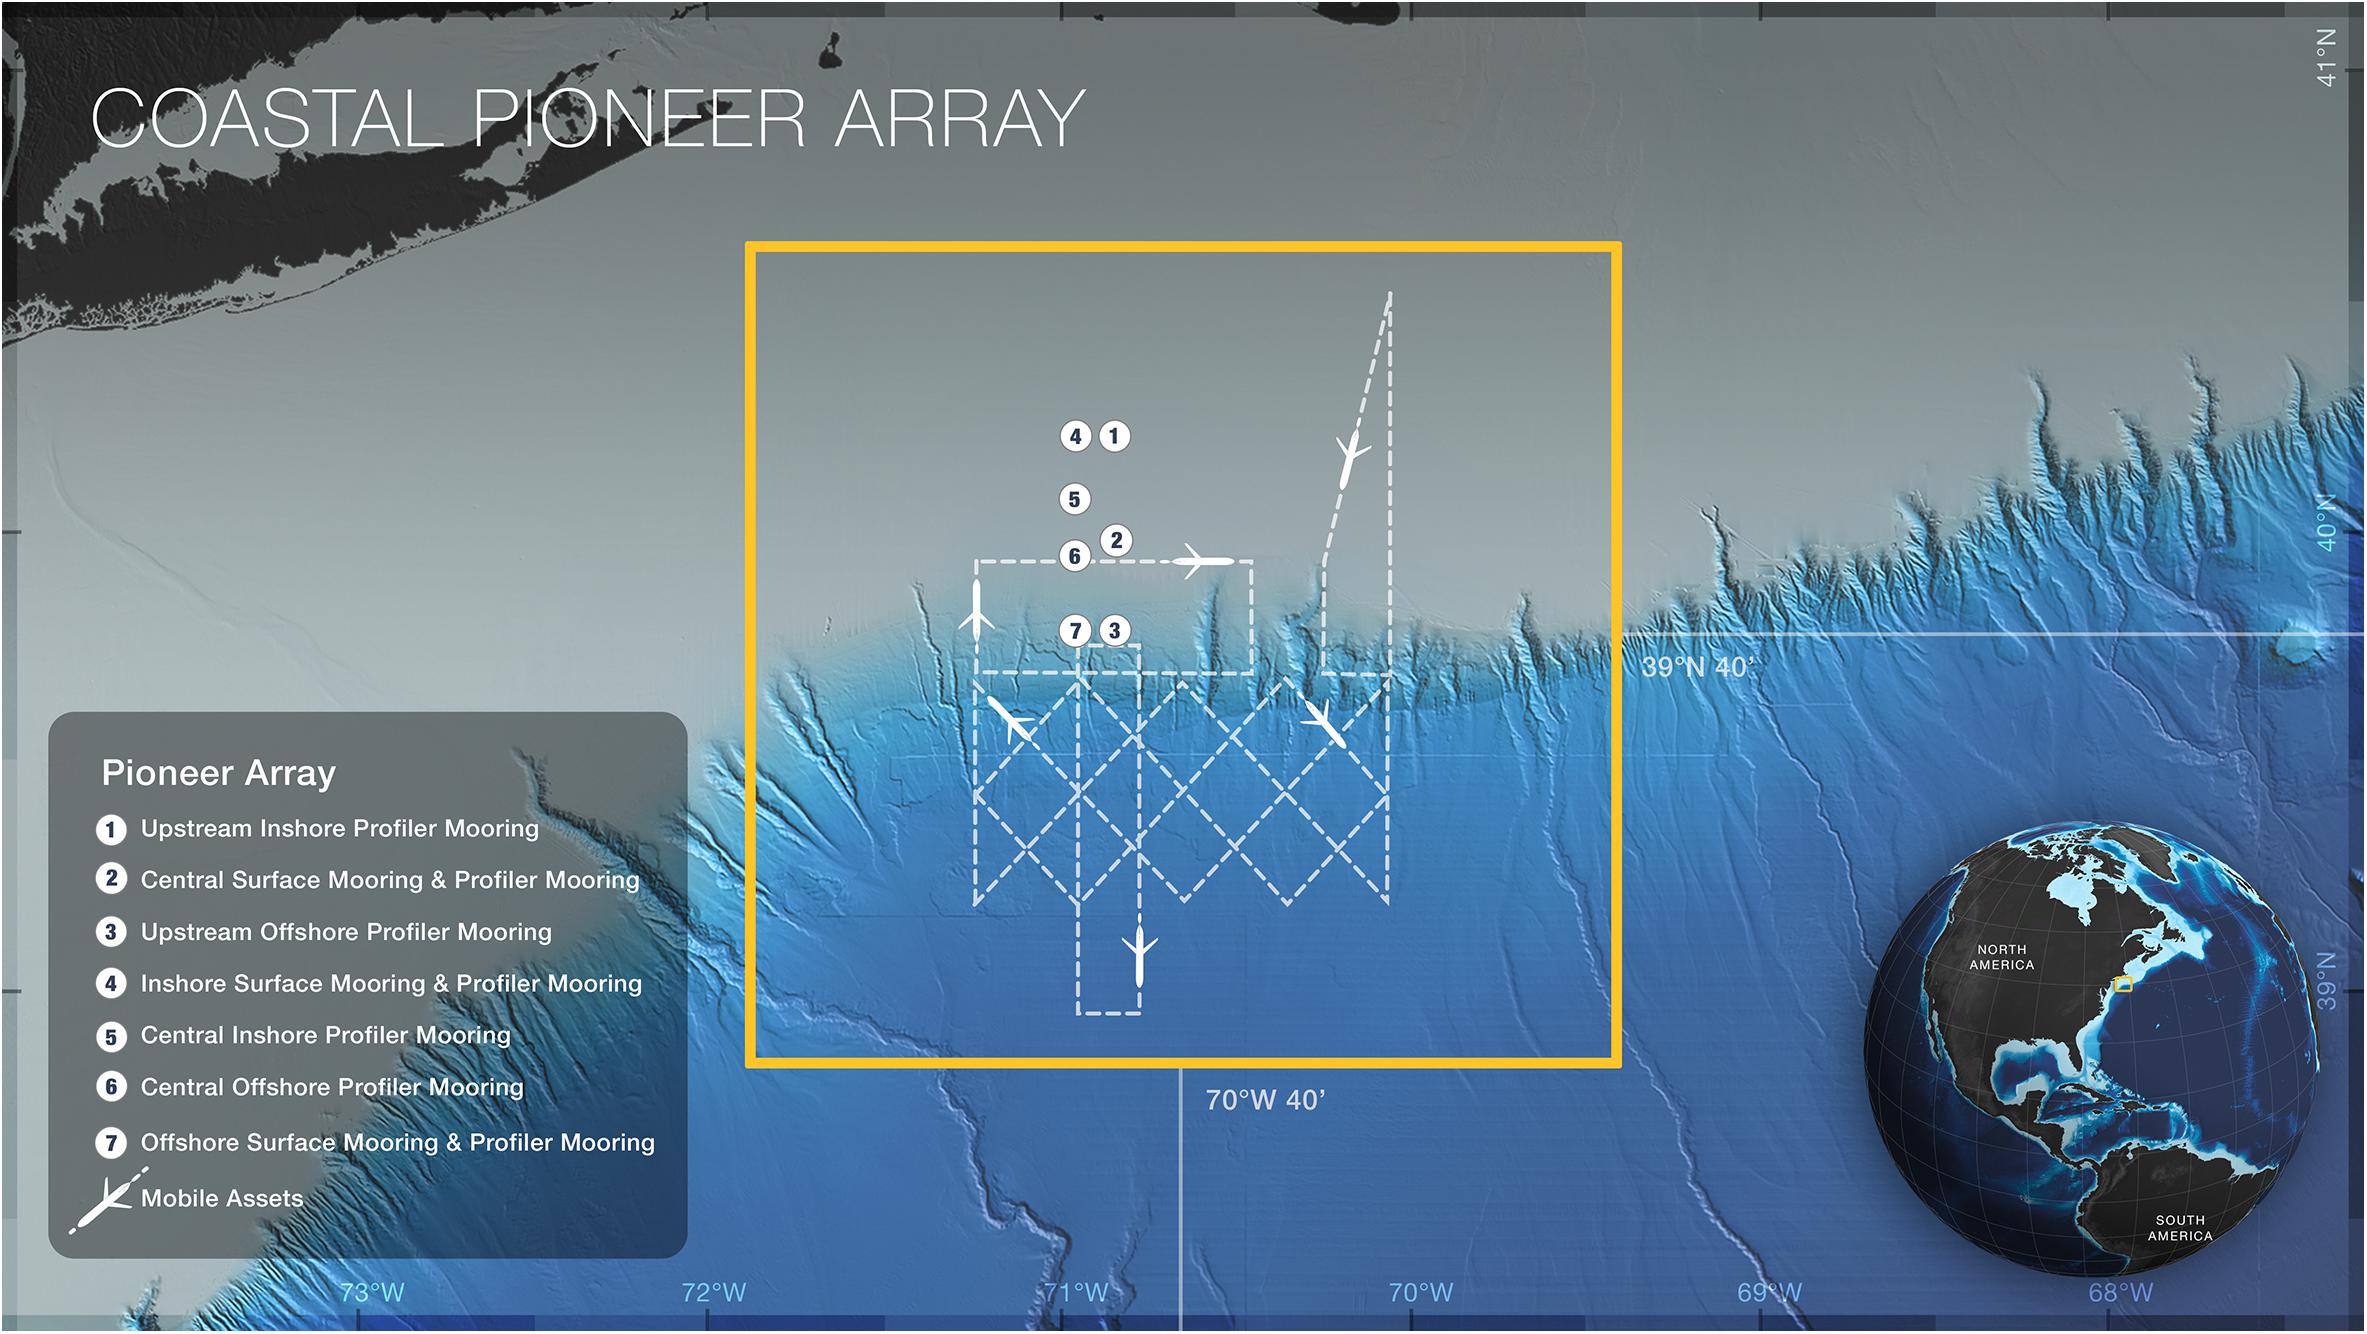
Figure 7. The Pioneer Array mooring locations (numbered dots) and glider track lines (dashed) are shown relative to the northeast US continental shelf and slope. The AUVs operate in the vicinity of the moored array. The shelfbreak front is a persistent feature found where the relatively flat shelf transitions to the slope (indicated by the bathymetry color change). Figure credit: Center for Environmental Visualization, UW School of Oceanography.
Infrastructure
In order to resolve multiple spatial scales, the Pioneer Array contains a combination of fixed and mobile platforms (Figure 8). The moored array is centered near the shelfbreak front and samples the shelf waters inshore and the slope sea offshore. Buoyancy-driven ocean gliders patrol the frontal region as well as the slope sea to the south. Propeller-driven Autonomous Underwater Vehicles (AUVs) provide “snapshots” of cross- and along-shelf structure in the vicinity of the front.
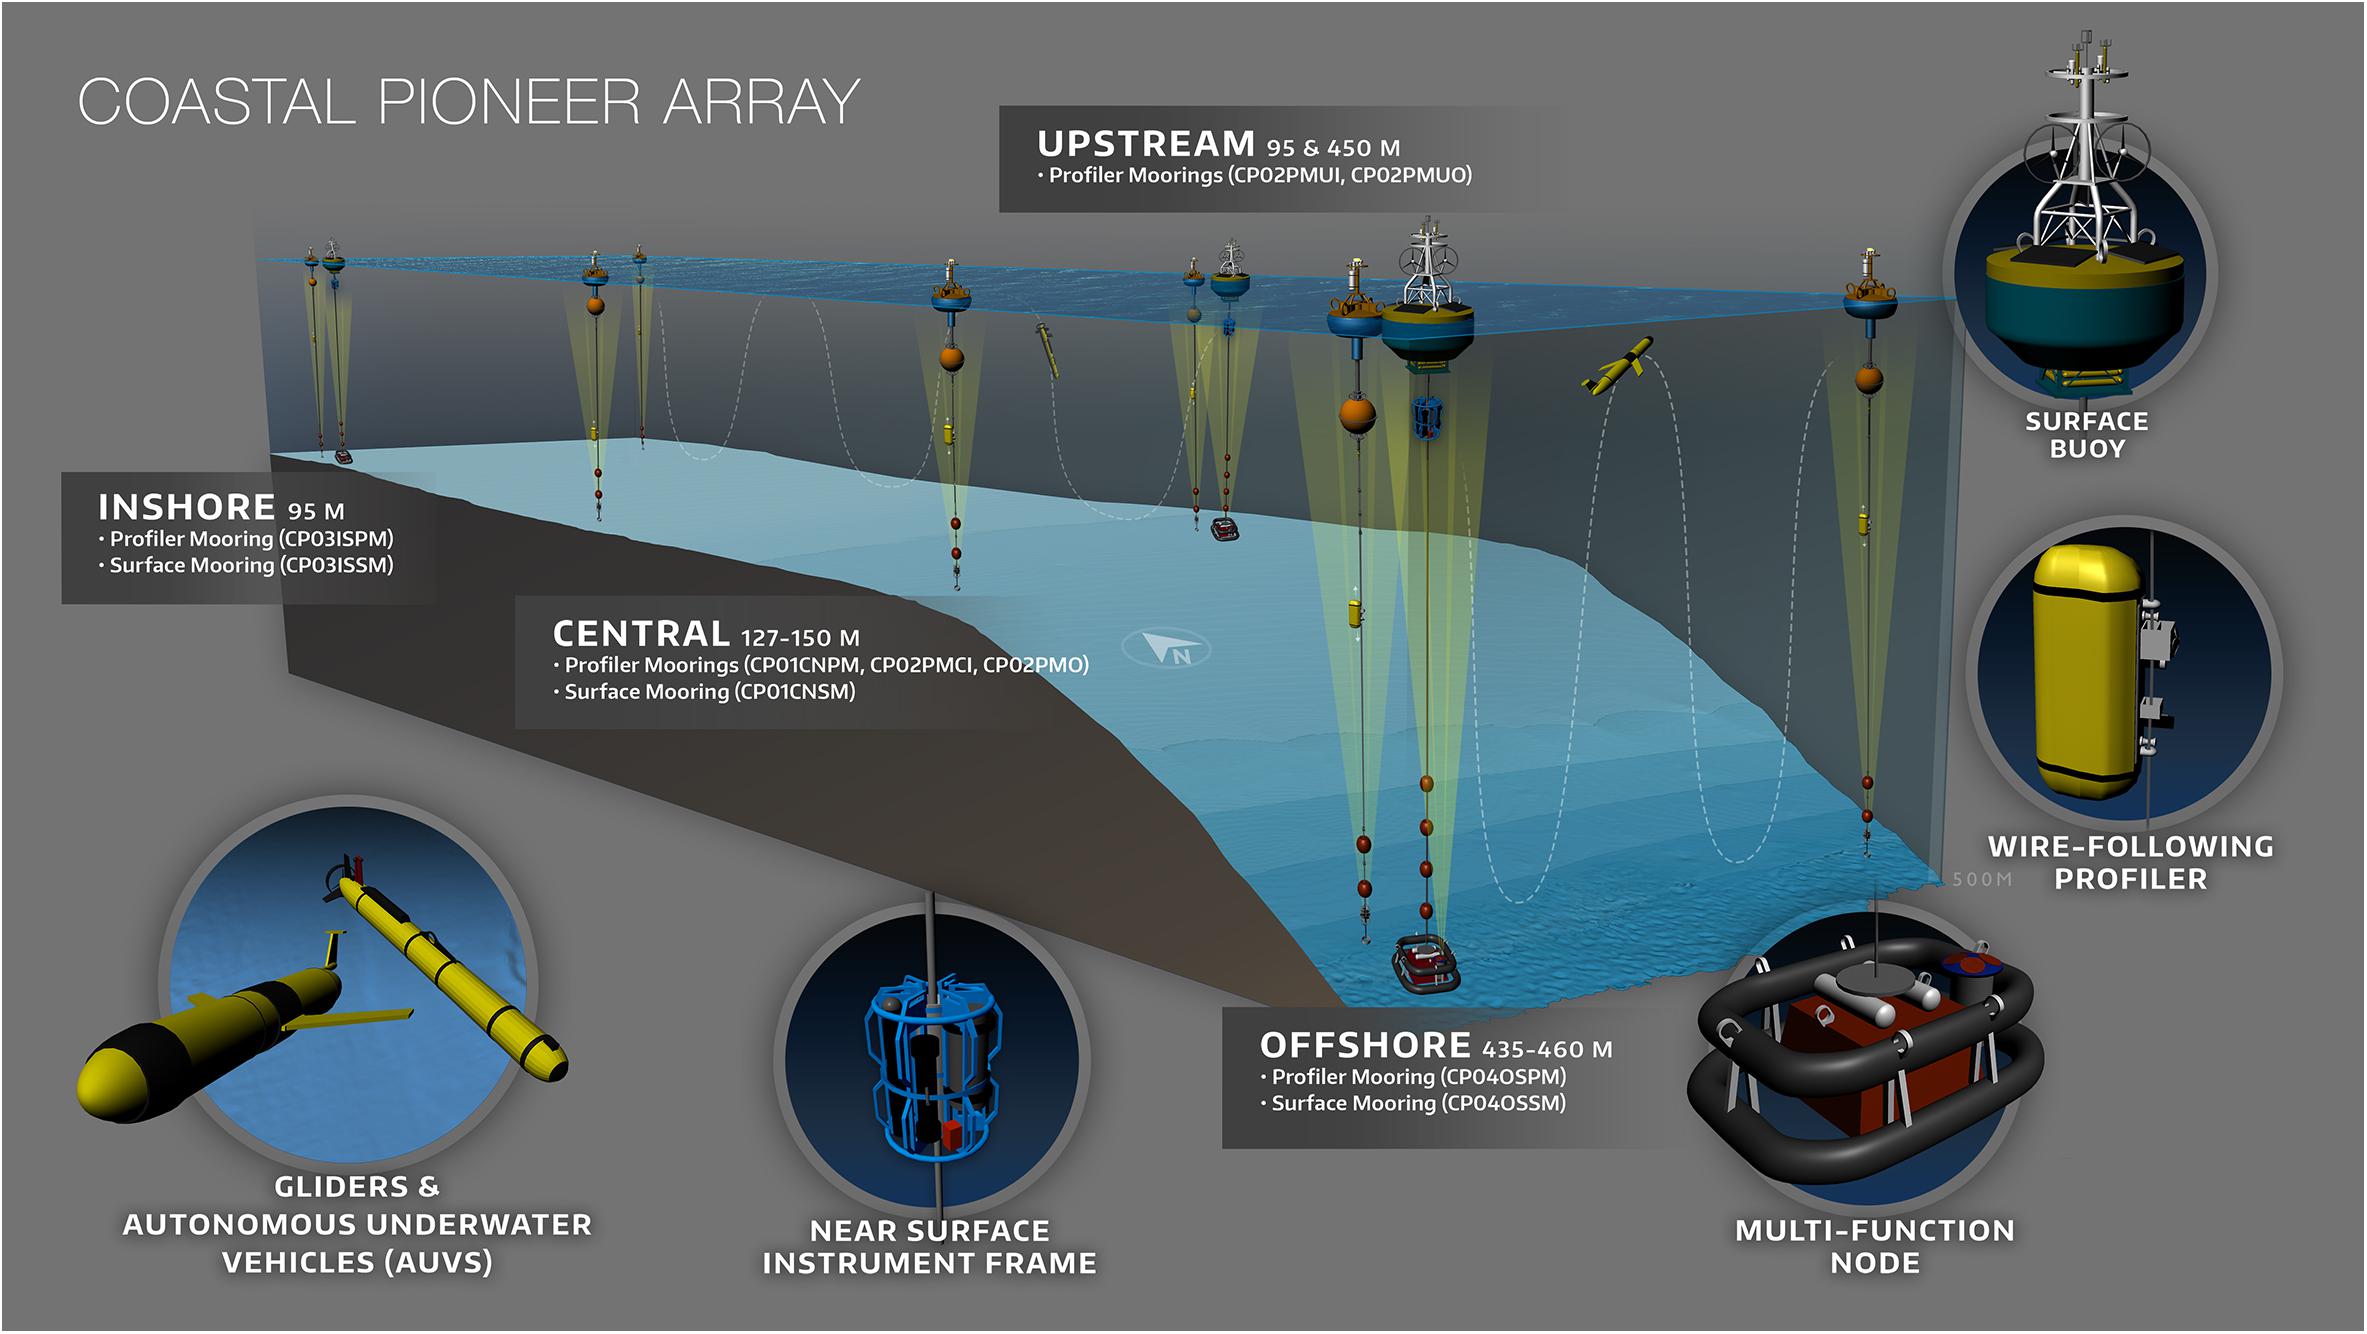
Figure 8. Schematic of the Pioneer Array showing the moored array spanning the continental shelf and slope and representations of glider and AUV track lines. Breakouts highlight major array elements. Figure credit: Center for Environmental Visualization, UW School of Oceanography.
The Pioneer moored array includes seven sites between 95 and 450 m depth and utilizes two different mooring types. CSMs are distinguished by a surface buoy with a 3 m tower which in includes telemetry systems, power generation from solar panels and wind turbines, and sensors for meteorological and sea-surface observations. CSMs also have a Near Surface Instrument Frame (NSIF) at 7 m depth and an instrumented Multi-Function Node (MFN) on the sea floor that incorporates an anchor. The NSIF and MFN support an interdisciplinary sensor suite measuring a variety of essential ocean variables (see Section “Infrastructure”). The CSM mooring riser contains stretch hoses with coiled conductors that provide electrical connectivity for power and communication from the buoy to instruments on the NSIF and MFN. CPMs are distinguished by McLane wire-following profilers which travel up and down a section of jacketed wire rope and upward-looking Acoustic Doppler Profilers mounted below the lower profiler bump-stop. Instrumentation on the CPMs is the same as described for the Endurance Array (Section “Infrastructure”). CPMs have surface buoys with communication systems analogous to those on the CSMs, but do not carry instrumentation or power generation equipment. Specially designed systems associated with the MFN and the CPM anchors allow all Pioneer Array mooring anchors to be recovered and reused.
In winter, there are ten moorings occupying the seven Pioneer sites; all sites contain CPMs and three sites contain both CSM and CPM. In summer, CPMs at the central and inshore sites are replaced by profiling gliders (see description below). The mooring array spans along- and across-shelf distances of 9 and 47 km, respectively, and moorings are separated from each other by distances of 9.2 to 17.5 km. At the inshore (95 m) and offshore (450 m) ends of the array, there are mooring sites along the same isobath separated by 9 km, intended to provide the ability to estimate cross-shore gradients and property fluxes.
To provide multiscale observations of the frontal region, and the slope sea, the mooring array is supplemented by two types of autonomous vehicles. Coastal Gliders are custom configurations of the Teledyne Webb Research Slocum G2, and are designed for shallow-water operations (either 200 m or 1000 m buoyancy engines). Six track-line following gliders are piloted along five pre-defined routes within the glider operating area of 185 km × 130 km. Two profiling gliders, which “hold station” to provide a virtual mooring, are operated at inshore and central Pioneer Array sites in summer. This provides observations of near-surface stratification that would be missed by CPMs. The Pioneer gliders have a nominal three-month deployment and refurbishment cycle and carry the same sensors as the Endurance gliders. The two Pioneer AUVs are Kongsberg-Hydroid REMUS-600 vehicles with a payload customized to meet OOI science requirements. Variables measured match those of the gliders, while adding velocity profiles and nitrate. Although the original vision was for the AUVs to be operated from and recharged by seafloor docking stations, a decision was made in 2016 to operate the AUVs in campaign mode from ships. The nominal AUV missions are 14 km × 47 km rectangles centered on the mooring array, one oriented along-shelf and one oriented cross-shelf.
Science Highlights
A variety of scientific results utilizing Pioneer Array data are published or in progress, and views of the New England shelfbreak region are changing. Gawarkiewicz et al. (2018) provide a recent review, noting that that slope waters have been warmer and saltier, while anomalous onshore intrusions of warm, salty water associated with warm core rings appear to be more frequent and penetrate further inshore. Selected examples of Pioneer-related science results are provided below.
Pre-commissioned data from OOI were used in a study of an unusual northward excursion of the Gulf Stream path in October 2011, combined with a large meander that brought that warm, salty water to the shelfbreak south of New England (Gawarkiewicz and Plueddemann, in press). The presence of warm water in the region was noted by the New England commercial fishing community. Near-bottom temperature measurements from lobster traps on the outer continental shelf showed distinct warming events (temperature increases exceeding 6°C). OOI Wire Following Profiler measurements, from a site at about 500 m depth over the continental slope, confirmed high salinities associated with the high temperatures, indicating that the warm water on the continental shelf originated in the Gulf Stream.
A possible explanation for the increase in Gulf Stream interactions a change in location of the Gulf Stream destabilization point – where meandering (which eventually leads to instabilities and eddies) begins. Andres (2016) used satellite altimetry data to show that the destabilization point has shifted to the west, and that this has changed increased the frequency of eddies in the MAB.
Pre-commissioned data from Pioneer gliders were used along with satellite SST imagery to document an intrusion of Gulf Stream warm-core ring water onto the Mid-Atlantic Bight continental shelf (Figure 9; Zhang and Gawarkiewicz, 2015). The authors argue that this is a previously unknown exchange process, with the intrusion extending hundreds of kilometers to the southwest along the shelfbreak. Idealized numerical simulations, indicate that the intrusion results from topographically induced vorticity variation of the ring water, rather than from entrainment in the shelfbreak frontal jet. Such intrusions have important biogeochemical implications, such as facilitating migration of marine species across the shelfbreak barrier and transporting low-nutrient surface Gulf Stream ring water to the otherwise productive shelfbreak region.
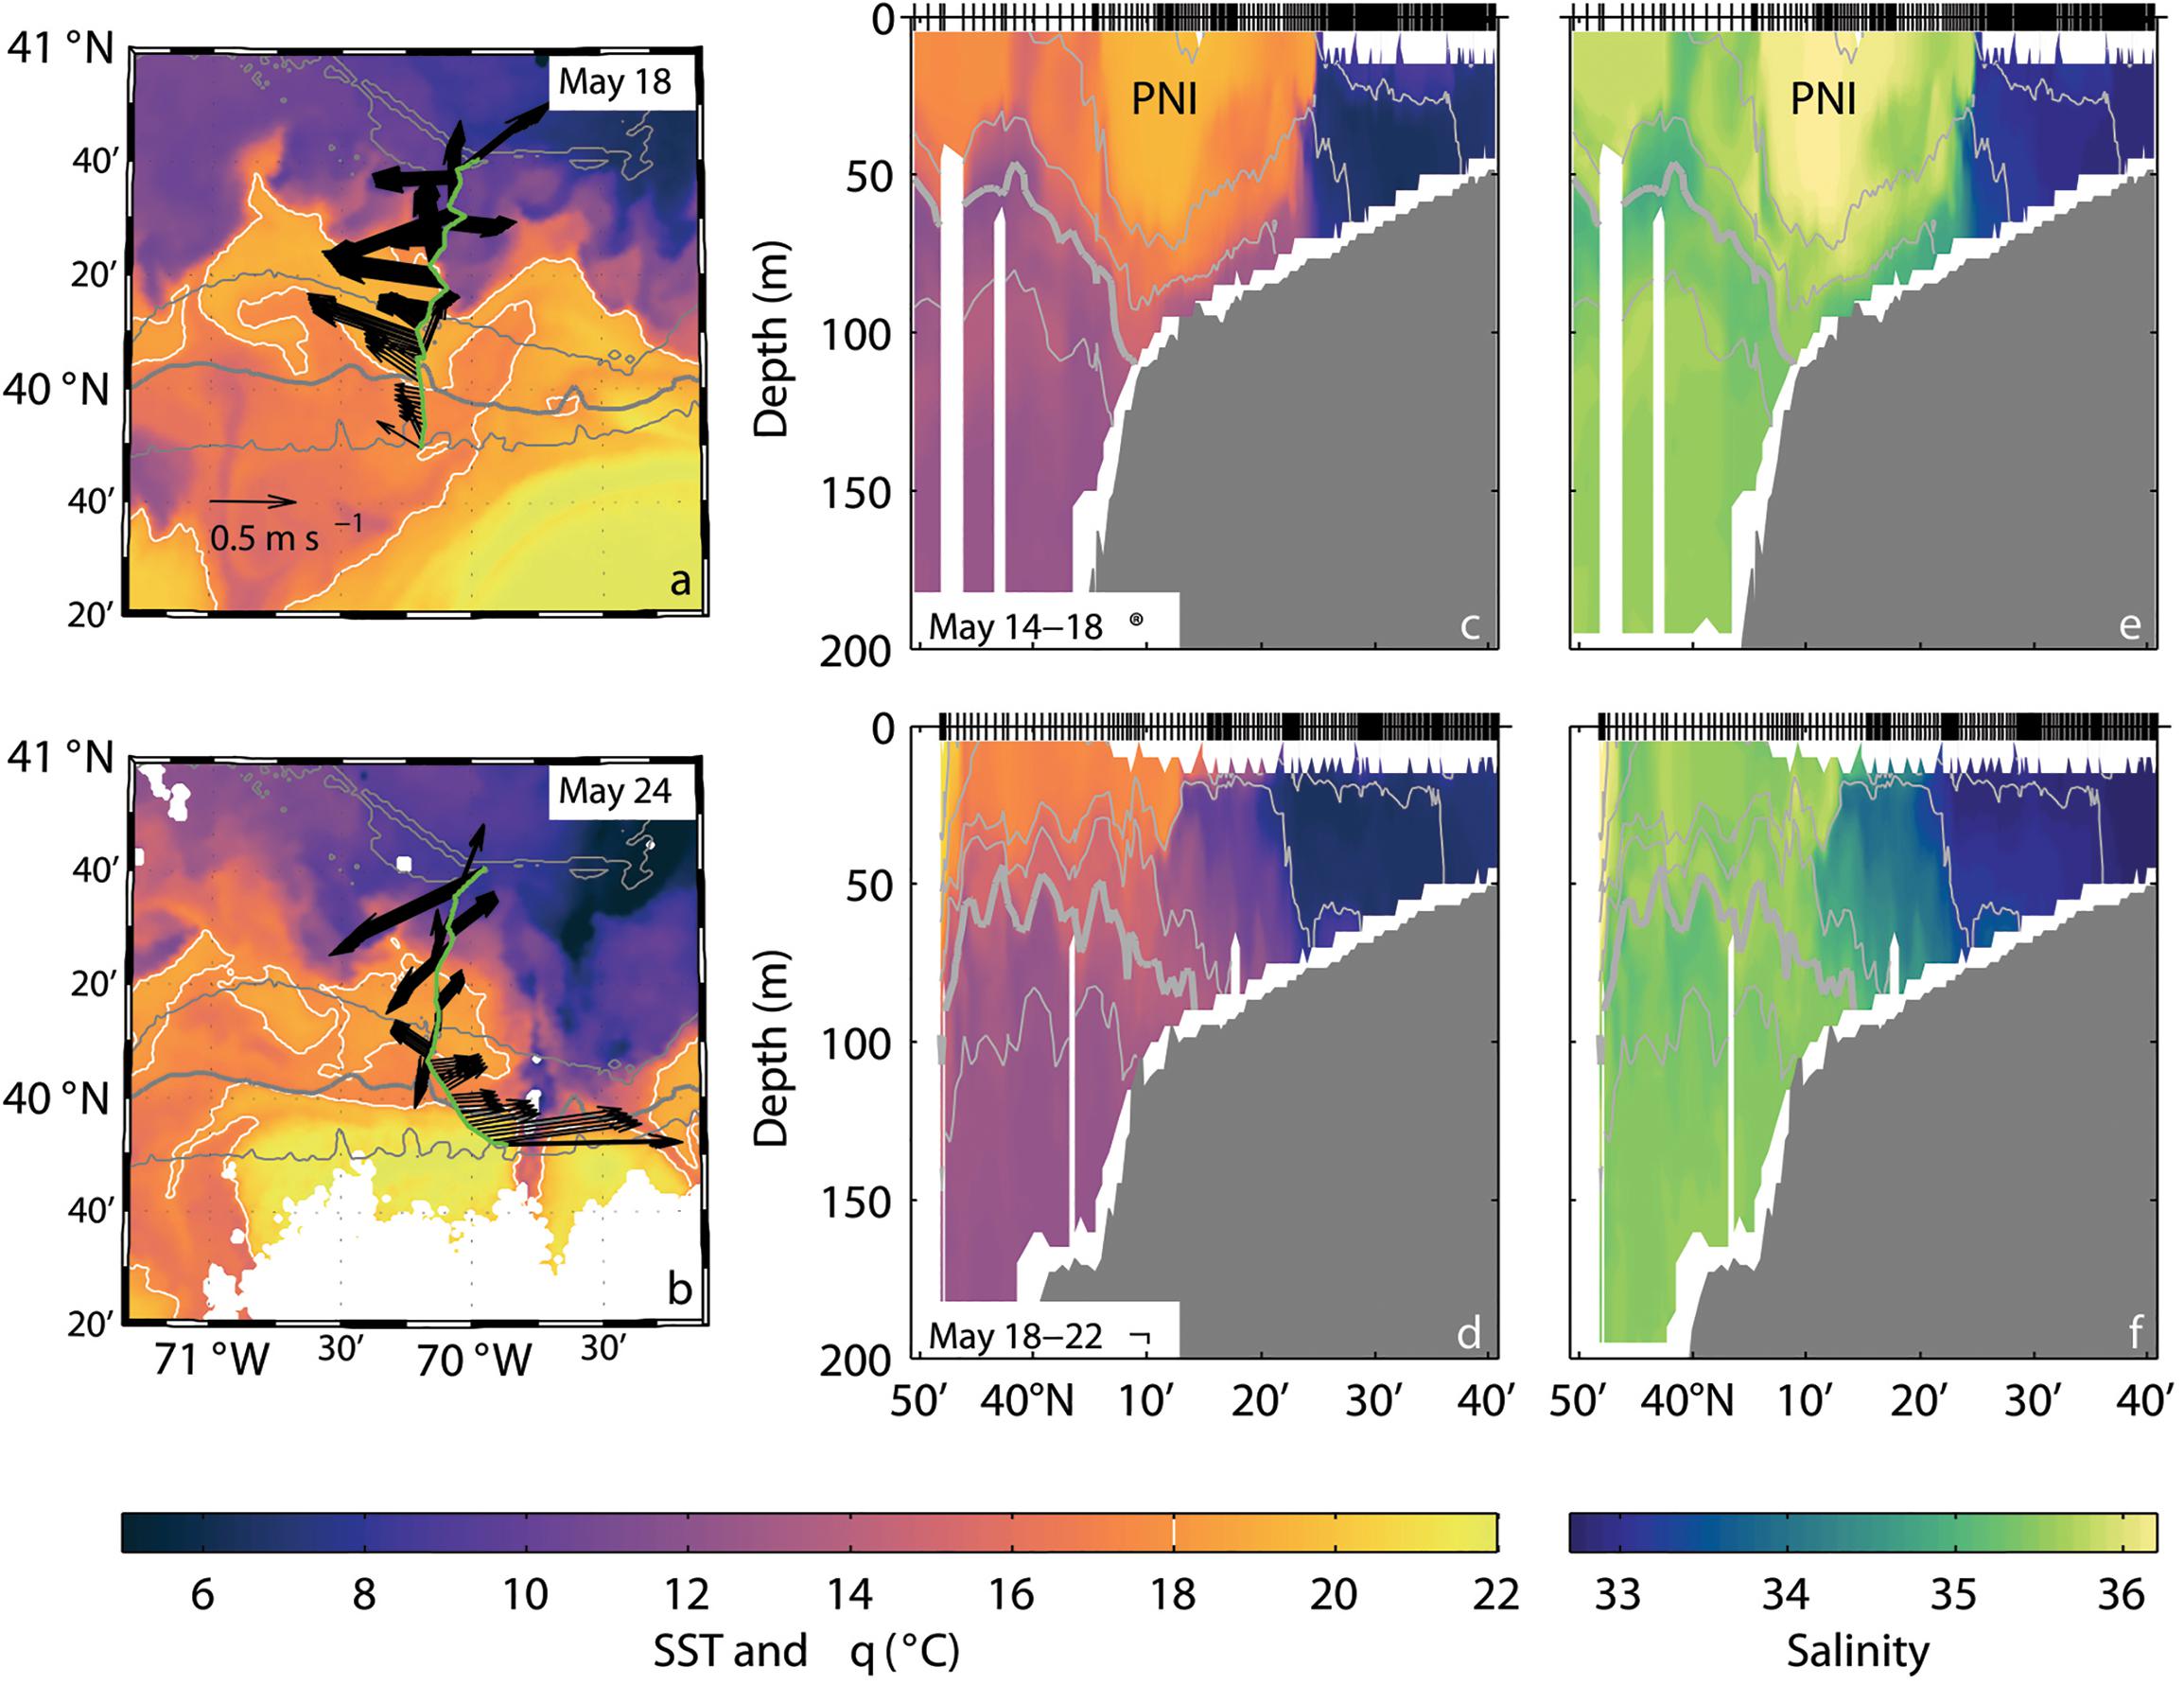
Figure 9. Rapid evolution of temperature and salinity at the Pioneer Array observed by gliders. (a) Sea surface temperature (SST) on 18 May 2014 with the 18°C isotherm highlighted (white). (b) SST on 24 May 2014. (c) potential temperature, and (e) salinity from a glider during 14–18 May; PNI denotes an intrusion. (d,f) Show the same properties as (c,e) a few days later. In (a,b), the trajectory of the glider (green) and vertically averaged current vectors are shown. Gray contours are the 50, 100, 200 (bold), and 1,000 m isobaths. In (c,d), isopycnals are shown in gray, with a contour interval of 0.25 kg m−3. Tick marks on the upper axes denote locations of glider profiles. Arrows indicate the direction of glider motion during the indicated dates. (Adapted from Gawarkiewicz et al., 2018). Reproduced with permission from the Oceanography Society.
Global Arrays
Science Drivers
Leading science themes for OOI motivated the initial design of the global arrays: ocean-atmosphere exchange; climate variability, ocean circulation and ecosystems; turbulent mixing and biophysical interactions; and modeling and data assimilation. The Final Network Design added foci on ocean ecosystem health, climate change, carbon cycling, and ocean acidification. Aware of the sparseness of ocean sampling at high latitude regions, community consensus was that the most pressing need was for sustained, multidisciplinary observations at key high latitude sites. Further, the need was for time series capturing the range of variability from the high frequencies and episodic events to decadal and multidecadal modes. These high latitude regions, though critical to understanding the ocean’s role in the earth system, were not yet being observed in a comprehensive, sustained way due to the technical challenge.
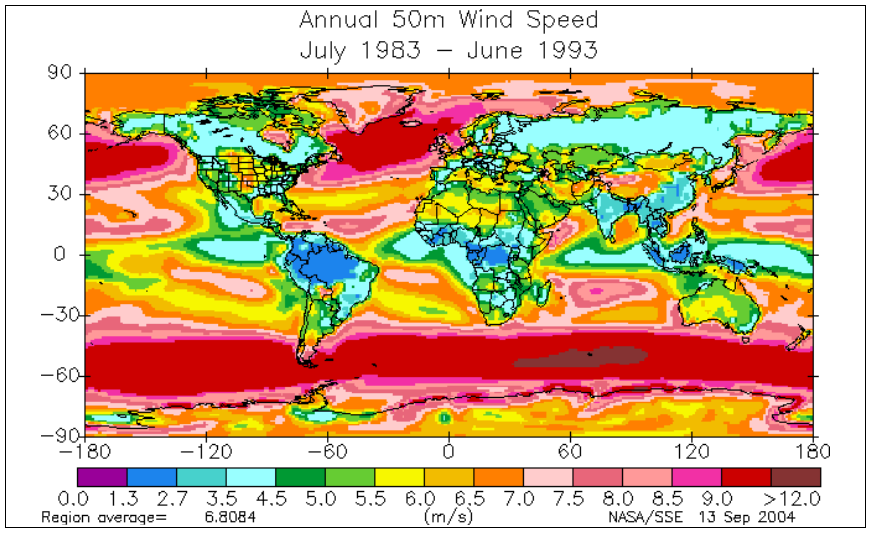
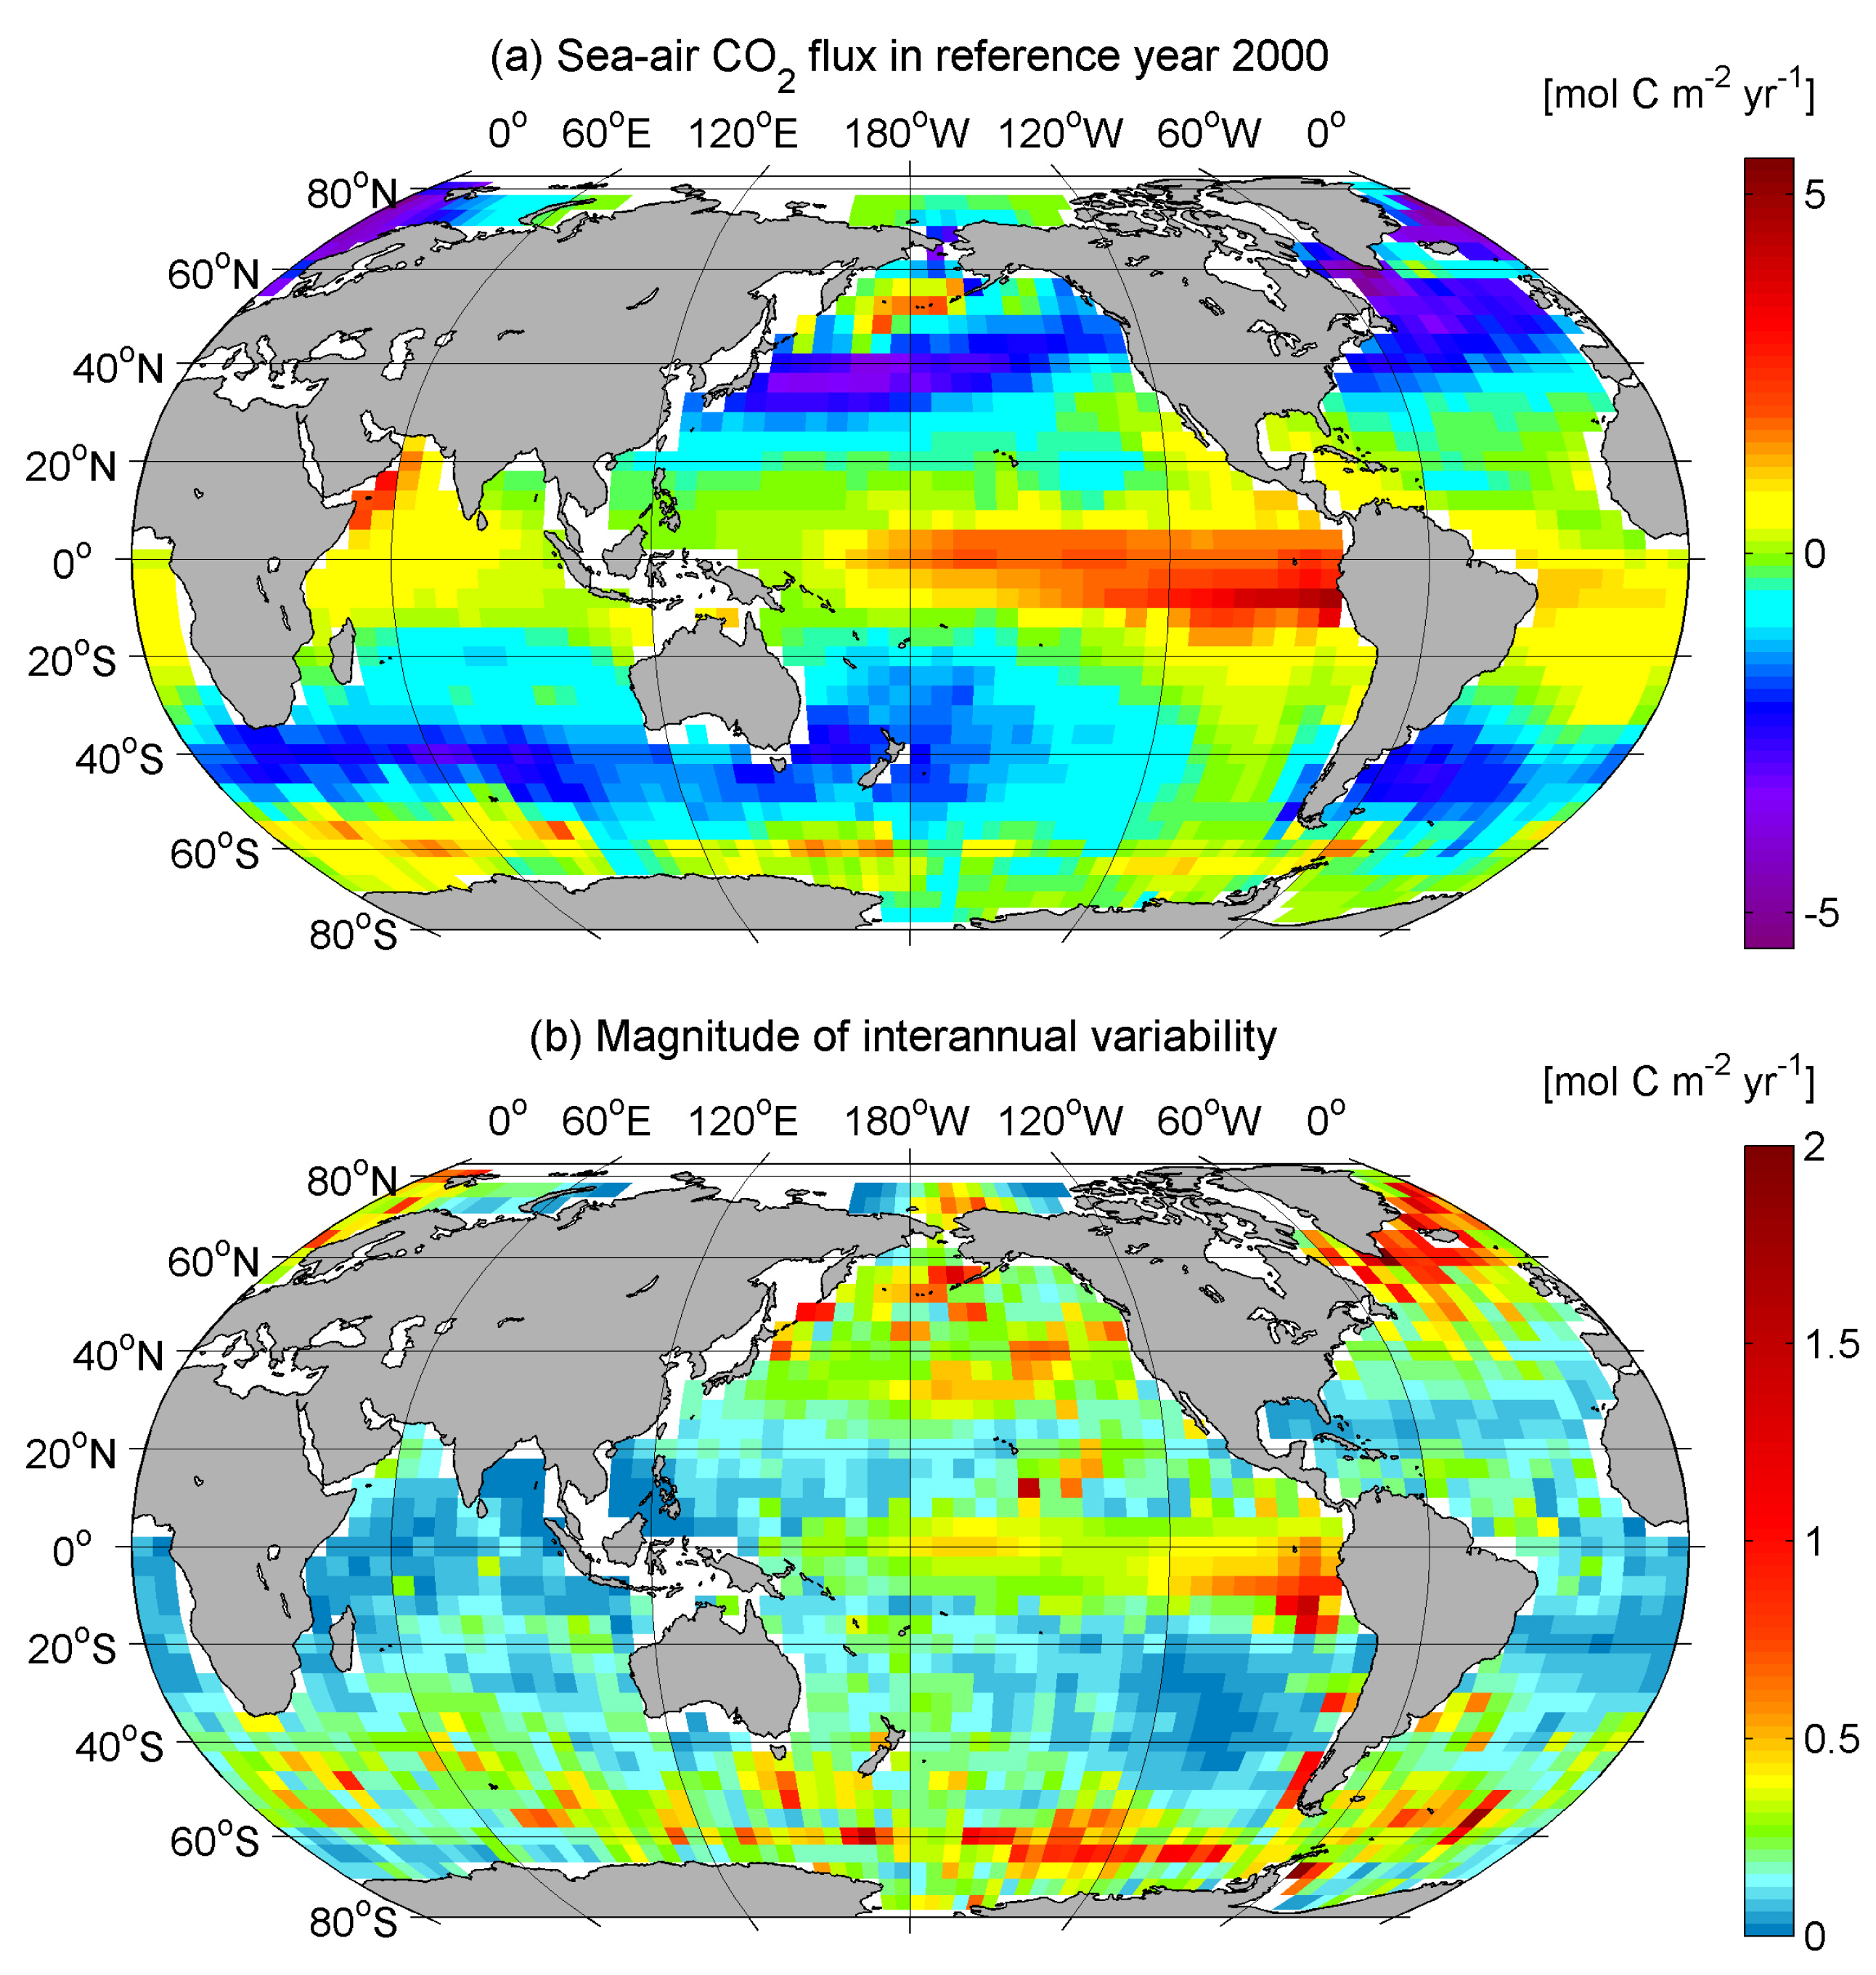
Considerable discussion and community input led to the identification of the sites for the OOI global nodes. In addition to having high regional scientific merit, the desire was to sample contrasting or different biological or biogeochemical regimes. Figure 10 shows maps that were used in planning. Very energetic air-sea interaction accompanies the very strong winds south of about 50°S, in the North Atlantic southeast of Greenland, and in the Gulf of Alaska. High ocean heat loss there contributes to the production of the deep and intermediate waters. With little in situ data from these regions, model-based and other characterizations of the air-sea fluxes of heat, fresh water, momentum, CO2, and other properties have error and uncertainty, so in situ observations of the surface meteorology and air-sea fluxes, including direct covariance flux observations of the turbulent fluxes, would have great value in building improved understanding of air-sea interaction at high latitudes, of water mass formation, and of the phytoplankton blooms found there. Maps of air-sea CO2 flux show flux into the ocean in the high latitude North Atlantic, North Pacific, and South Atlantic; but the southeast South Pacific does not show in this map flux into the ocean. Yet, maps of column inventory CO2 not only show elevated anthropogenic CO2 inventory close to the source and to where deep-water forms, but also show elevated column inventory levels in the South Atlantic, South Indian Ocean, and southeast South Pacific, suggesting that thermohaline circulation as well as air-sea fluxes contribute to the column inventory and add to the motivation to investigate the air-sea exchanges and sequestration of carbon at high latitudes. From a perspective of biological productivity, SeaWiFS imagery highlights a strong chlorophyll signal in the high latitude North Atlantic, a moderate signal in the high latitude North Pacific, a localized region of productivity off the coast of southern Argentina in the South Atlantic, and little productivity in the southeast South Pacific. As the design was advanced for the global array, there was speculation that while productivity had no limiting factors in the North Atlantic, the southeast South Pacific and Gulf of Alaska might be nutrient rich but iron limited and the southwest South Pacific might also nutrient rich but iron limited except when it received dust and aerosols from the South American continent. In situ sampling of biology and nutrients at high latitudes was needed to investigate further.
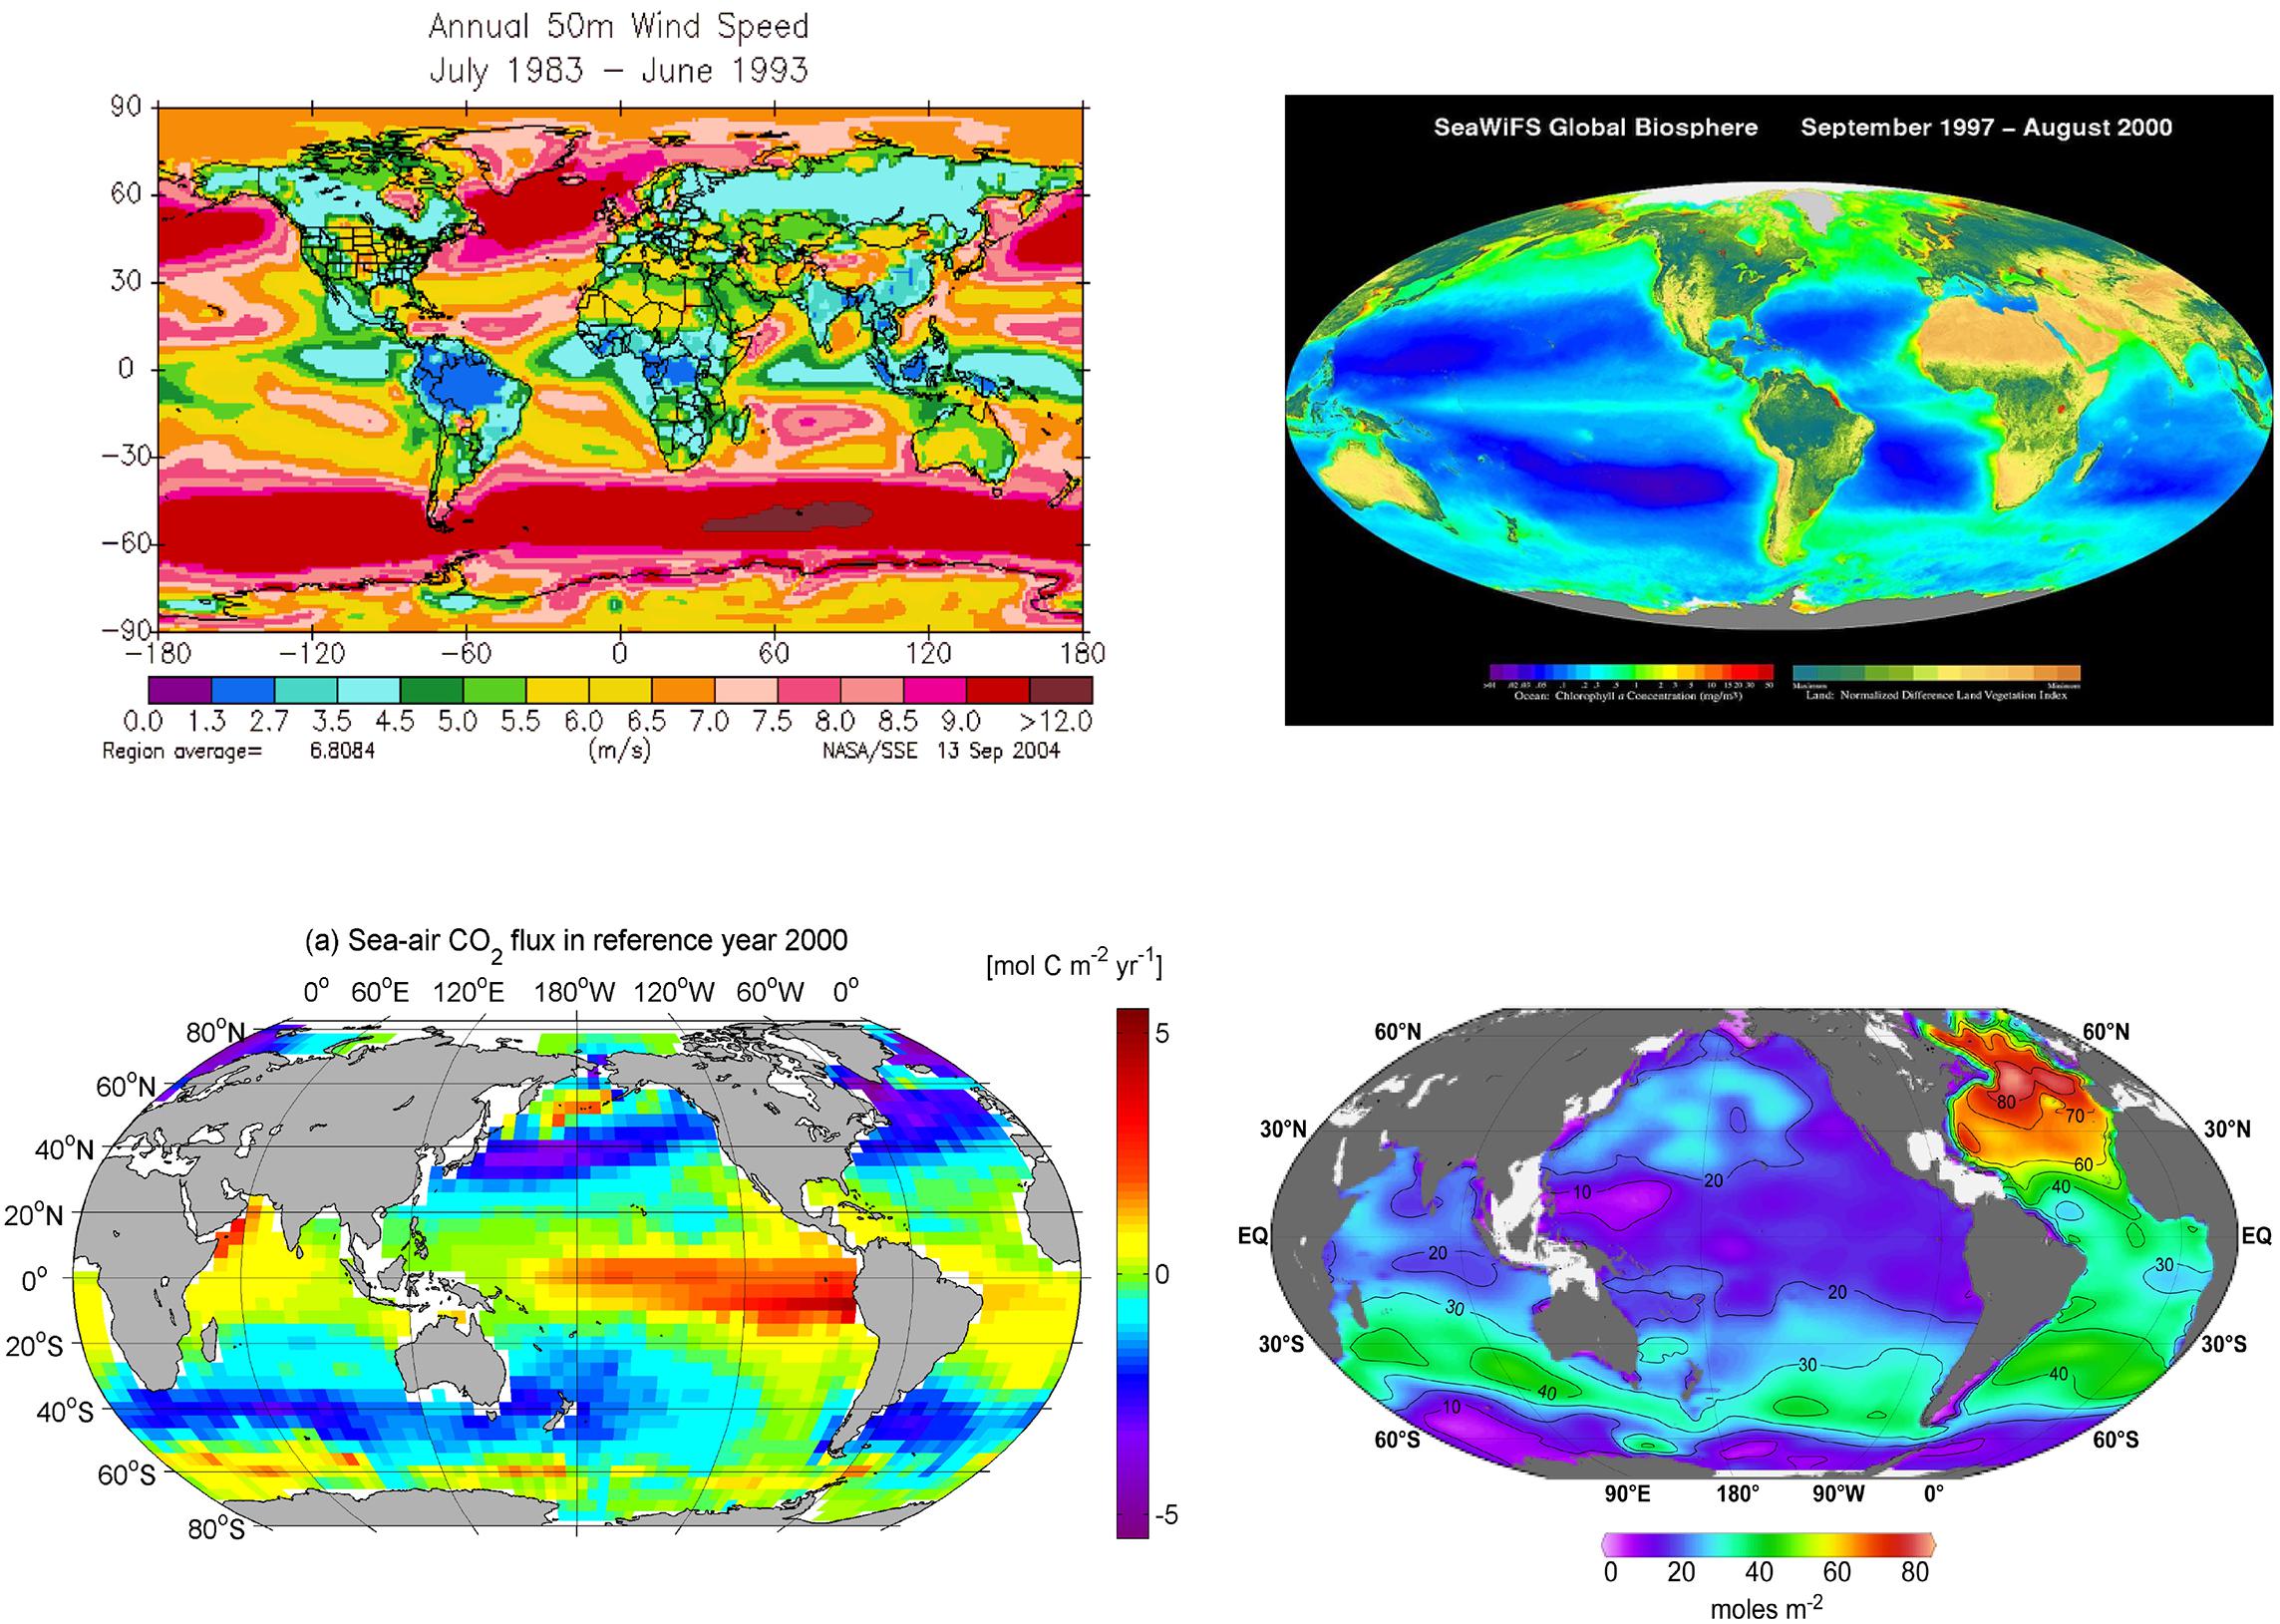
Figure 10. Upper left, 10-year mean wind speeds at 50 m height, from https://upload.wikimedia.org/wikipedia/commons/4/46/Global_Annual_50m_Average_Wind_Speed.png; upper right, long term mean chlorophyll from SeaWiFS, from https://earthobservatory.nasa.gov; lower left, atmosphere-ocean exchange of CO2 in 2000, from https://www.pmel.noaa.gov/co2/files/fluxmap.jpg; lower right, anthropogenic CO2 column inventory from Sabine et al. (2004), from https://www.pmel.noaa.gov/co2/file/column+inventory+of+anthropogenic+CO2.
Thus, the plan matured to occupy two sites in the northern hemisphere and two in the southern hemisphere; all would be strongly forced, but there would be contrast in the carbon and biological regimes. In addition, sites with different ocean dynamics were sought.
The sites chosen included the Irminger Sea (60°N, 39°W), the Southern Ocean (55°S, 90°W), the Argentine Basin (42°S, 42°W), and the Gulf of Alaska (50°N, 145°W). The Gulf of Alaska had an existing NOAA surface mooring, and OOI planned to add to that site to match the other global sites. Observing requirements included sampling: surface forcing (surface meteorology, air-sea fluxes), the full water column (sea surface to sea floor), and the mesoscale and smaller scale horizontal structure and variability.
The Irminger Sea site was identified early in the planning as of the highest priority. Some of the strongest regional atmospheric forcing occurs there. Shipboard sampling had shown water column freshening in the Denmark Straits and Faroe-Shetland Channel (Dickson et al., 2002) region of the high latitude North Atlantic for decades, and international attention has focused on potential changes that could result in the large-scale thermohaline circulation if freshening arrested deep convection. Key questions about this site include: What are the processes that form the deeper water? What is the role of regional air-sea interaction? What are the roles of the ocean mesoscale and 3-D processes in water mass transformation? Is the ongoing freshening of the water in the region having an impact on the water mass transformation and thermohaline circulation? These questions can be addressed by an OOI global node, which observes the surface forcing, samples the mesoscale, and has a planned duration of deployment of 20 to 25 years. Further, the sampling by the global node would sample year-round and capture episodic and strong forcing events most likely missed in the historical record of shipboard sampling. An international effort, the Overturning in the Subpolar North Atlantic Program (OSNAP, Lozier et al., 2017), planned to deploy a line of subsurface moorings spanning the North Atlantic, from the United Kingdom to Greenland and then from Greenland to Canada to measure transports to and from the northern North Atlantic. Siting of OOI Irminger Sea node was coordinated with OSNAP, with the two flanking moorings placed in the OSNAP line of moorings. OOI selection of the Irminger Sea also reflected community interest in the global ocean carbon cycle, consideration of biological productivity, and desire to support investigation of links between ecosystems and climate. The Irminger Sea region is an area with a high level of anthropogenic CO2 and a large flux of CO2 into the ocean (Takahashi et al., 2002; Sabine et al., 2004). It also has as strong spring bloom. The covariability of species such as Calanus with climate variability in the region has been studied (Gislason et al., 2015) as has the poleward migration of marine species in response to climate variability (Sundby et al., 2016). Thus, the Irminger Sea site’s data would support study of a region with high wind and large surface waves, strong atmosphere-ocean exchanges of energy and gases, deep water formation and CO2 sequestration, high biological productivity and an important fishery, and a climate sensitive ecosystem. Further, it represented a convergence and collaboration of US ocean science studies and observing with European ocean science and observing efforts.
Another high priority site identified in planning the global OOI nodes was the high latitude South Pacific. The region near 55°S, 90°W, to the west of the southern tip of Chile, is important from the perspective of the large-scale thermohaline circulation and had been a focus for study on intermediate water formation (e.g., Sloyan et al., 2010). Like the Irminger Sea it is strongly forced and a region of CO2 sequestration with a large fetch and powerful storms regularly moving west to east. This site would provide new insight into the challenges that weather, climate, and ocean models face in regions where very little data exist for initialization and for verification. It would also provide data important to improved understanding of the Southern Ocean and of links between the Southern Ocean and the Antarctic (National Research Council [NRC], 2015), including the strengthening westerly winds and their role in increased upwelling of warmer waters around the Antarctic continent’s ice shelves. Like the Irminger Sea site, there was interest in regional collaboration, and Chilean oceanographers and meteorologists looked forward to data from this site, which is located in a region where weather systems that move toward Chile originate. From a biological perspective, the Southern Ocean site provided a sought-after contrast with the Irminger Sea, as although it was nutrient rich it had low biological productivity due to iron limitation (Morrissey and Bowler, 2012). Further, from a climate perspective, whereas climate models pointed to a warmer and fresher water column in the Irminger Sea, climate models suggested a cooling of surface waters off southern Chile.
As planning proceeded, the NSF placed increasing emphasis on investigating the carbon cycle. This elevated the priority placed on occupying a southern hemisphere location of high biological productivity and led to the selection of the site at 42°S, 42°W in the Argentine Basin, where high biological productivity is evident in SeaWiFS imagery. Productivity is believed to be limited by iron, but there is also the possibility that micronutrients reach that region when transported from the continent in dust (Li et al., 2008). There is also CO2 sequestration, and strong atmospheric forcing. Unique to this site in the global OOI array are very strong currents and elevated eddy kinetic energy. Strong currents reach the seafloor and suspended particulate matter (Richardson et al., 1993) and mud waves on the sea floor (Flood and Shor, 1988) have been studied there in the past. Eddy kinetic energy levels are similar there to those in the Gulf Stream (Stammer, 1997), and the site will be an excellent location for investigation of mesoscale variability and its role in ocean processes. The confluence of currents there leads to interest in the interaction of different water masses and exchange between gyres of mass, heat and salt there (e.g., Jullion et al., 2010). In planning this site, interest arose from physical oceanographers and fisheries scientists in Argentina and from the UK GEOTRACES program, which planned a shipboard sampling line to investigate cycles of trace elements and isotopes that would pass near the site and through the Argentine Basin.
The fourth global OOI site was in the Gulf of Alaska at the historical location of Ocean Weather Station PAPA (50°N, 145°W). Observing at this site has had a long history. Over the years, PAPA data was used in the development of ocean models. Canadian oceanographers have maintained shipboard sampling in the years following the removal of the weather ship. PAPA adds a contrasting regime OOI global node array. There is CO2 sequestration, but the site has the lowest level of anthropogenic CO2 of the four global nodes. Biologically productivity is thought to be limited by iron, but the region has an important and productive fishery. There is long-period variability related to the Pacific Decadal Oscillation, which may be reflected in the biology as well as in physical variability. PAPA has low eddy variability compared to the other sites. PAPA could form the basis for ongoing collaboration with Canadian oceanographers and with NOAA Pacific Marine Environmental Laboratory (PMEL).
Global Array Design
The scientific drivers set the capabilities required at a global node to address the science: surface meteorology and air-sea fluxes, including of CO2; structure and variability of temperature, salinity, and velocity from the sea surface to the sea floor; biological and chemical sampling, including of pH, chlorophyll, biomass, and nutrients; and provision of as much data as possible to users in near real time. While sampling in the upper ocean, including the euphotic zone and the surface mixed layer and seasonal thermocline, the ability to obtain observations with good vertical resolution up to and through the sea surface was sought. In addition, the goal was to push beyond sampling in time and just the vertical dimension, and to provide the capabilities to sample the horizontal variability at the mesoscale and smaller scales. The design of an OOI global scale node developed for high latitude deployment is shown in Figure 11.
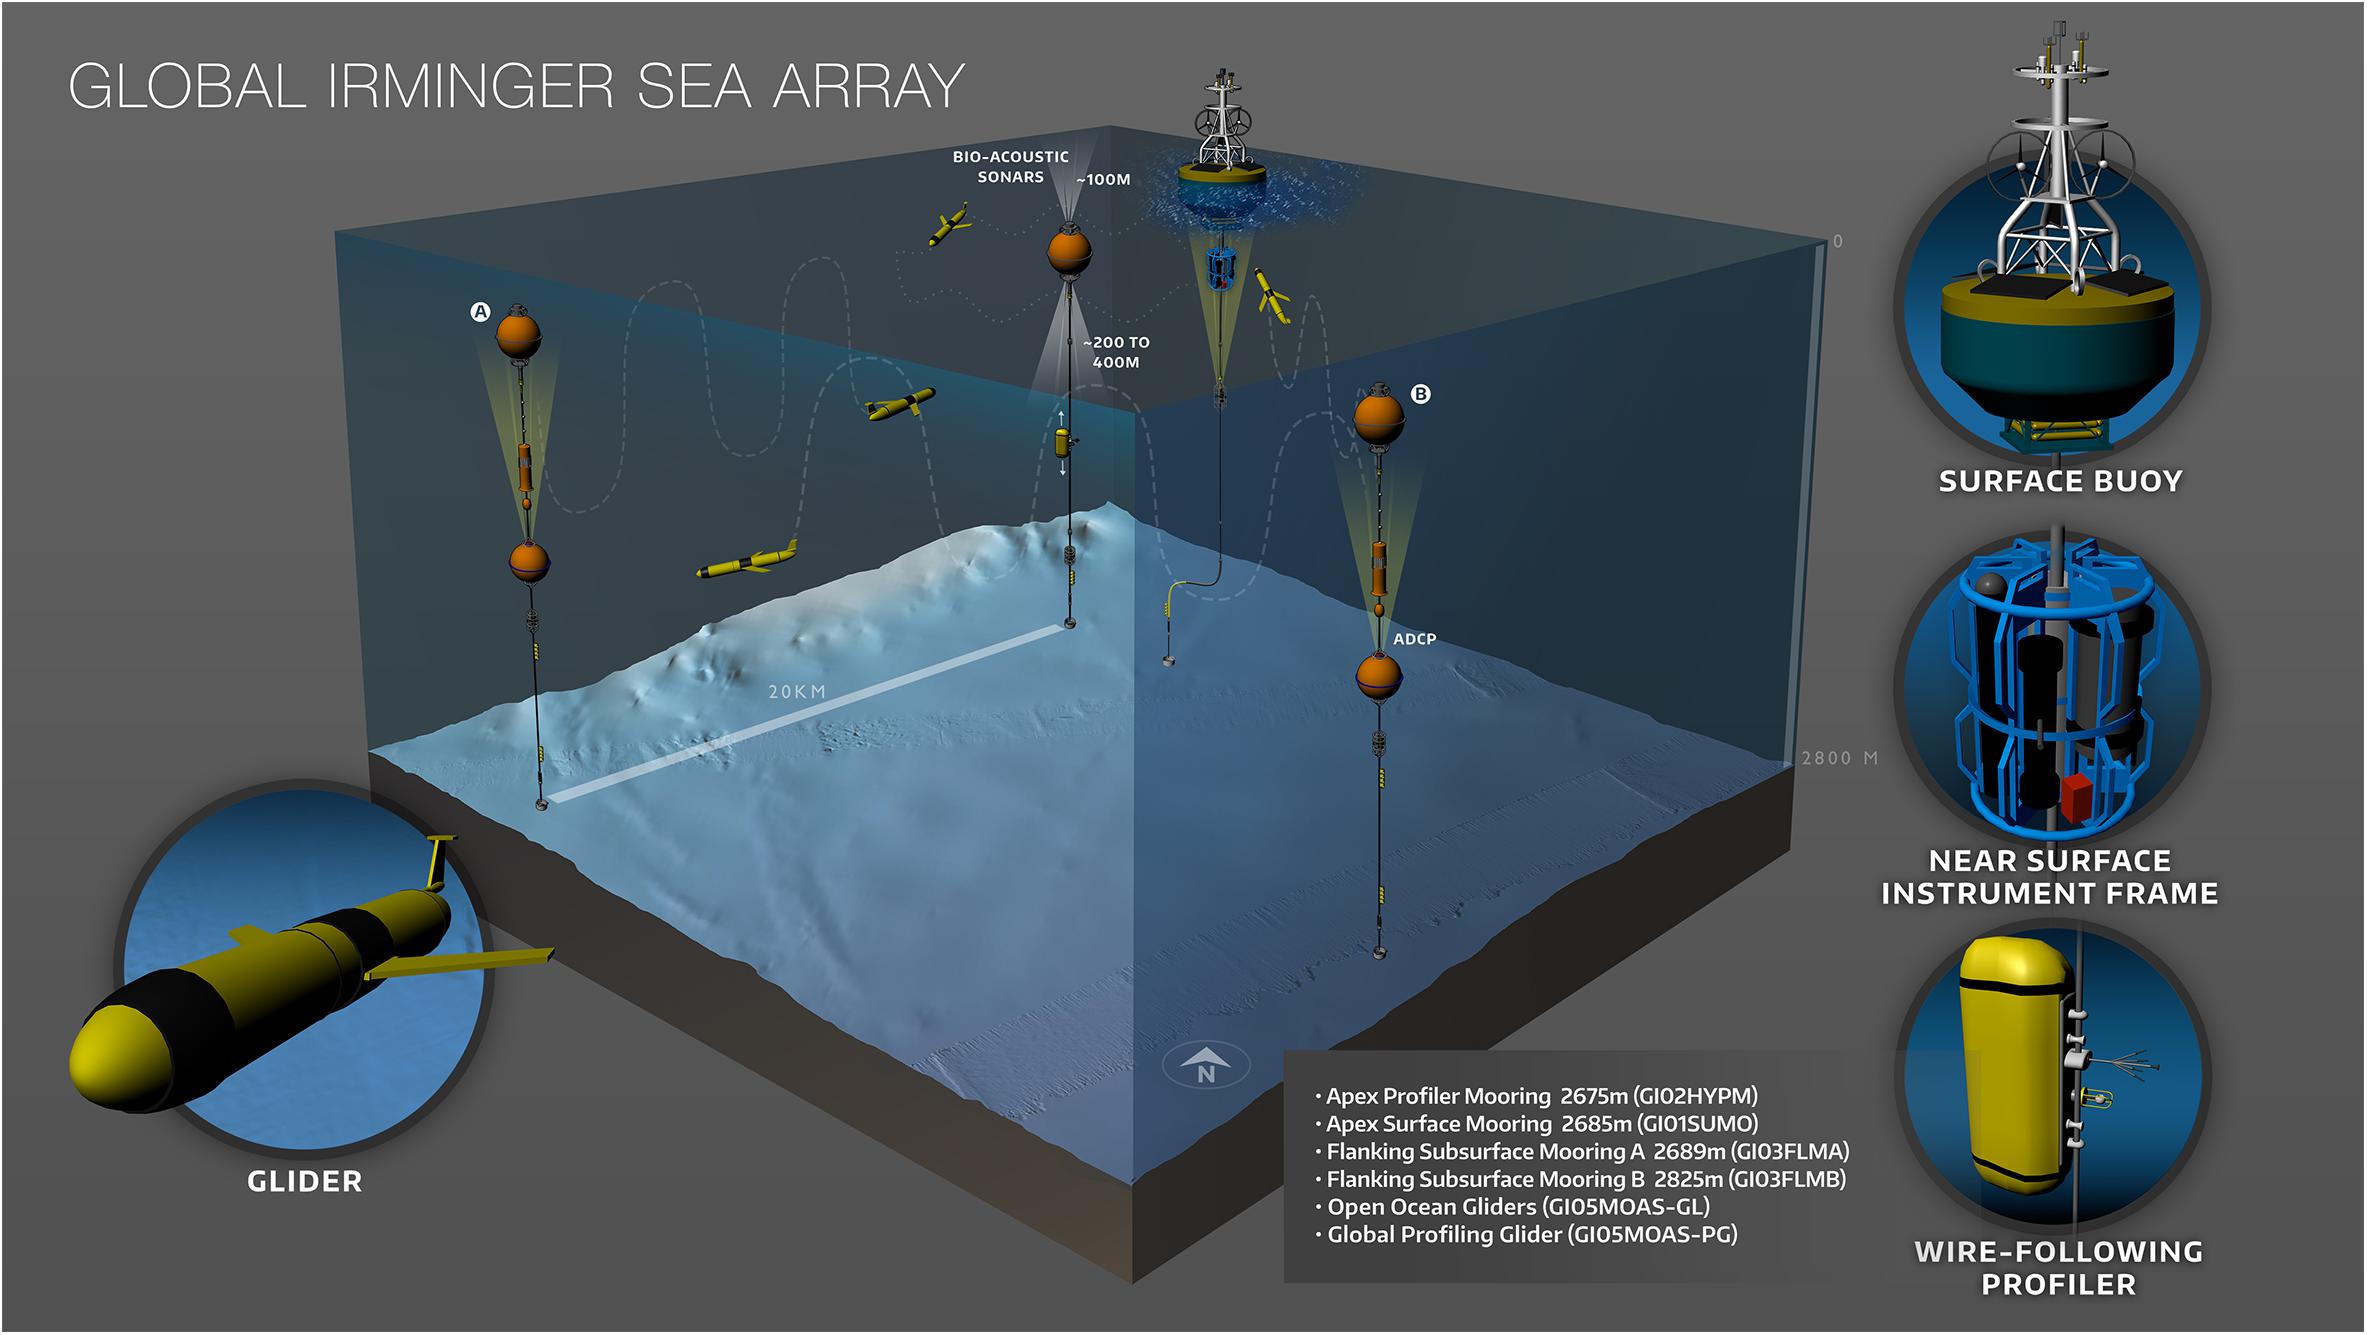
Figure 11. A schematic of the Global Irminger Sea Array, with four moorings and several ocean gliders. Figure credit: Center for Environmental Visualization, UW School of Oceanography.
Four moorings are at each site, pairing a surface mooring and a taut subsurface mooring with a profiler together at one corner of the triangular moored array and placing two taut subsurface moorings called Flanking Moorings at the other corners of the triangle. To complement the moorings, two ocean gliders are deployed to sample in scales within and around the moored array and two more gliders collect vertical profiles up through the sea surface. Thus one corner of the triangle provides the sampling from the sea surface to the sea floor. The surface mooring has a well-instrumented surface buoy and carries ocean sensors in the upper 200 m of the water column. To sample the full water column, the adjacent taut subsurface mooring is deployed next to the surface mooring with profiling instruments that move up and down the wire rope, covering the depths not sampled by the surface mooring. The full water column and surface sampling at that corner is complemented by taut subsurface moorings at the other two corners. These moorings, the flanking moorings, have surface flotation close to 30 m and discrete instruments at fixed depths. The sides of the mooring triangle are roughly 10 times the water depth, with the intent of sampling the variability associated with the characteristic eddy scales. Additional sampling of spatial variability within and around the moored array was to be done with ocean gilders. Community input emphasized the importance of near-surface profiles that penetrated the sea surface, and two ocean gliders were included in the global node design to obtain profiles through the sea surface.
Further design features were driven by environmental conditions. The height of the tower of the surface buoy was set at 5 m in recognition of the anticipated sea states and freezing spray. The surface buoy had comprehensive and redundant telemetry systems including Fleet Broadband. To support these systems and provide power up to about 200 W, rechargeable lead-acid batteries together with wind turbines and solar panels were mounted. Two redundant bulk meteorological systems were deployed together with a direct covariance flux system at Irminger and Southern Ocean. Access to the data from the subsurface moorings and the ability to interact with them was planned via ocean gliders. The subsurface moorings had controllers that aggregated data from instruments. Gliders with acoustic modems downloaded these observations and when back at the surface telemetered these data and could carry commands from shore back to the subsurface moorings The two vertically profiling gliders carried between them a 3-wavelength fluorometer, a CTD, dissolved oxygen sensor, nitrate sensor, and a photosynthetically available radiation sensor. The gliders tasked to sample within the volume of the moored array dove to 1,000 m and carried a 2-wavelength fluorometer, CTD, and dissolved oxygen sensor.
Science Highlights
Very strong air-sea fluxes of heat and momentum are anticipated at the Southern Ocean. Ogle et al. (2018) found episodic heat loss events with daily mean ocean het losses of up to –294 W m−2 in association with cold, dry air from the southwest. These extreme heat losses lead to convective deepening of the mixed layer and formation of Subantarctic Mode Water. Figure 12 (from Ogle et al., 2018) illustrates the strong surface forcing and resultant deep mixed layer formation.
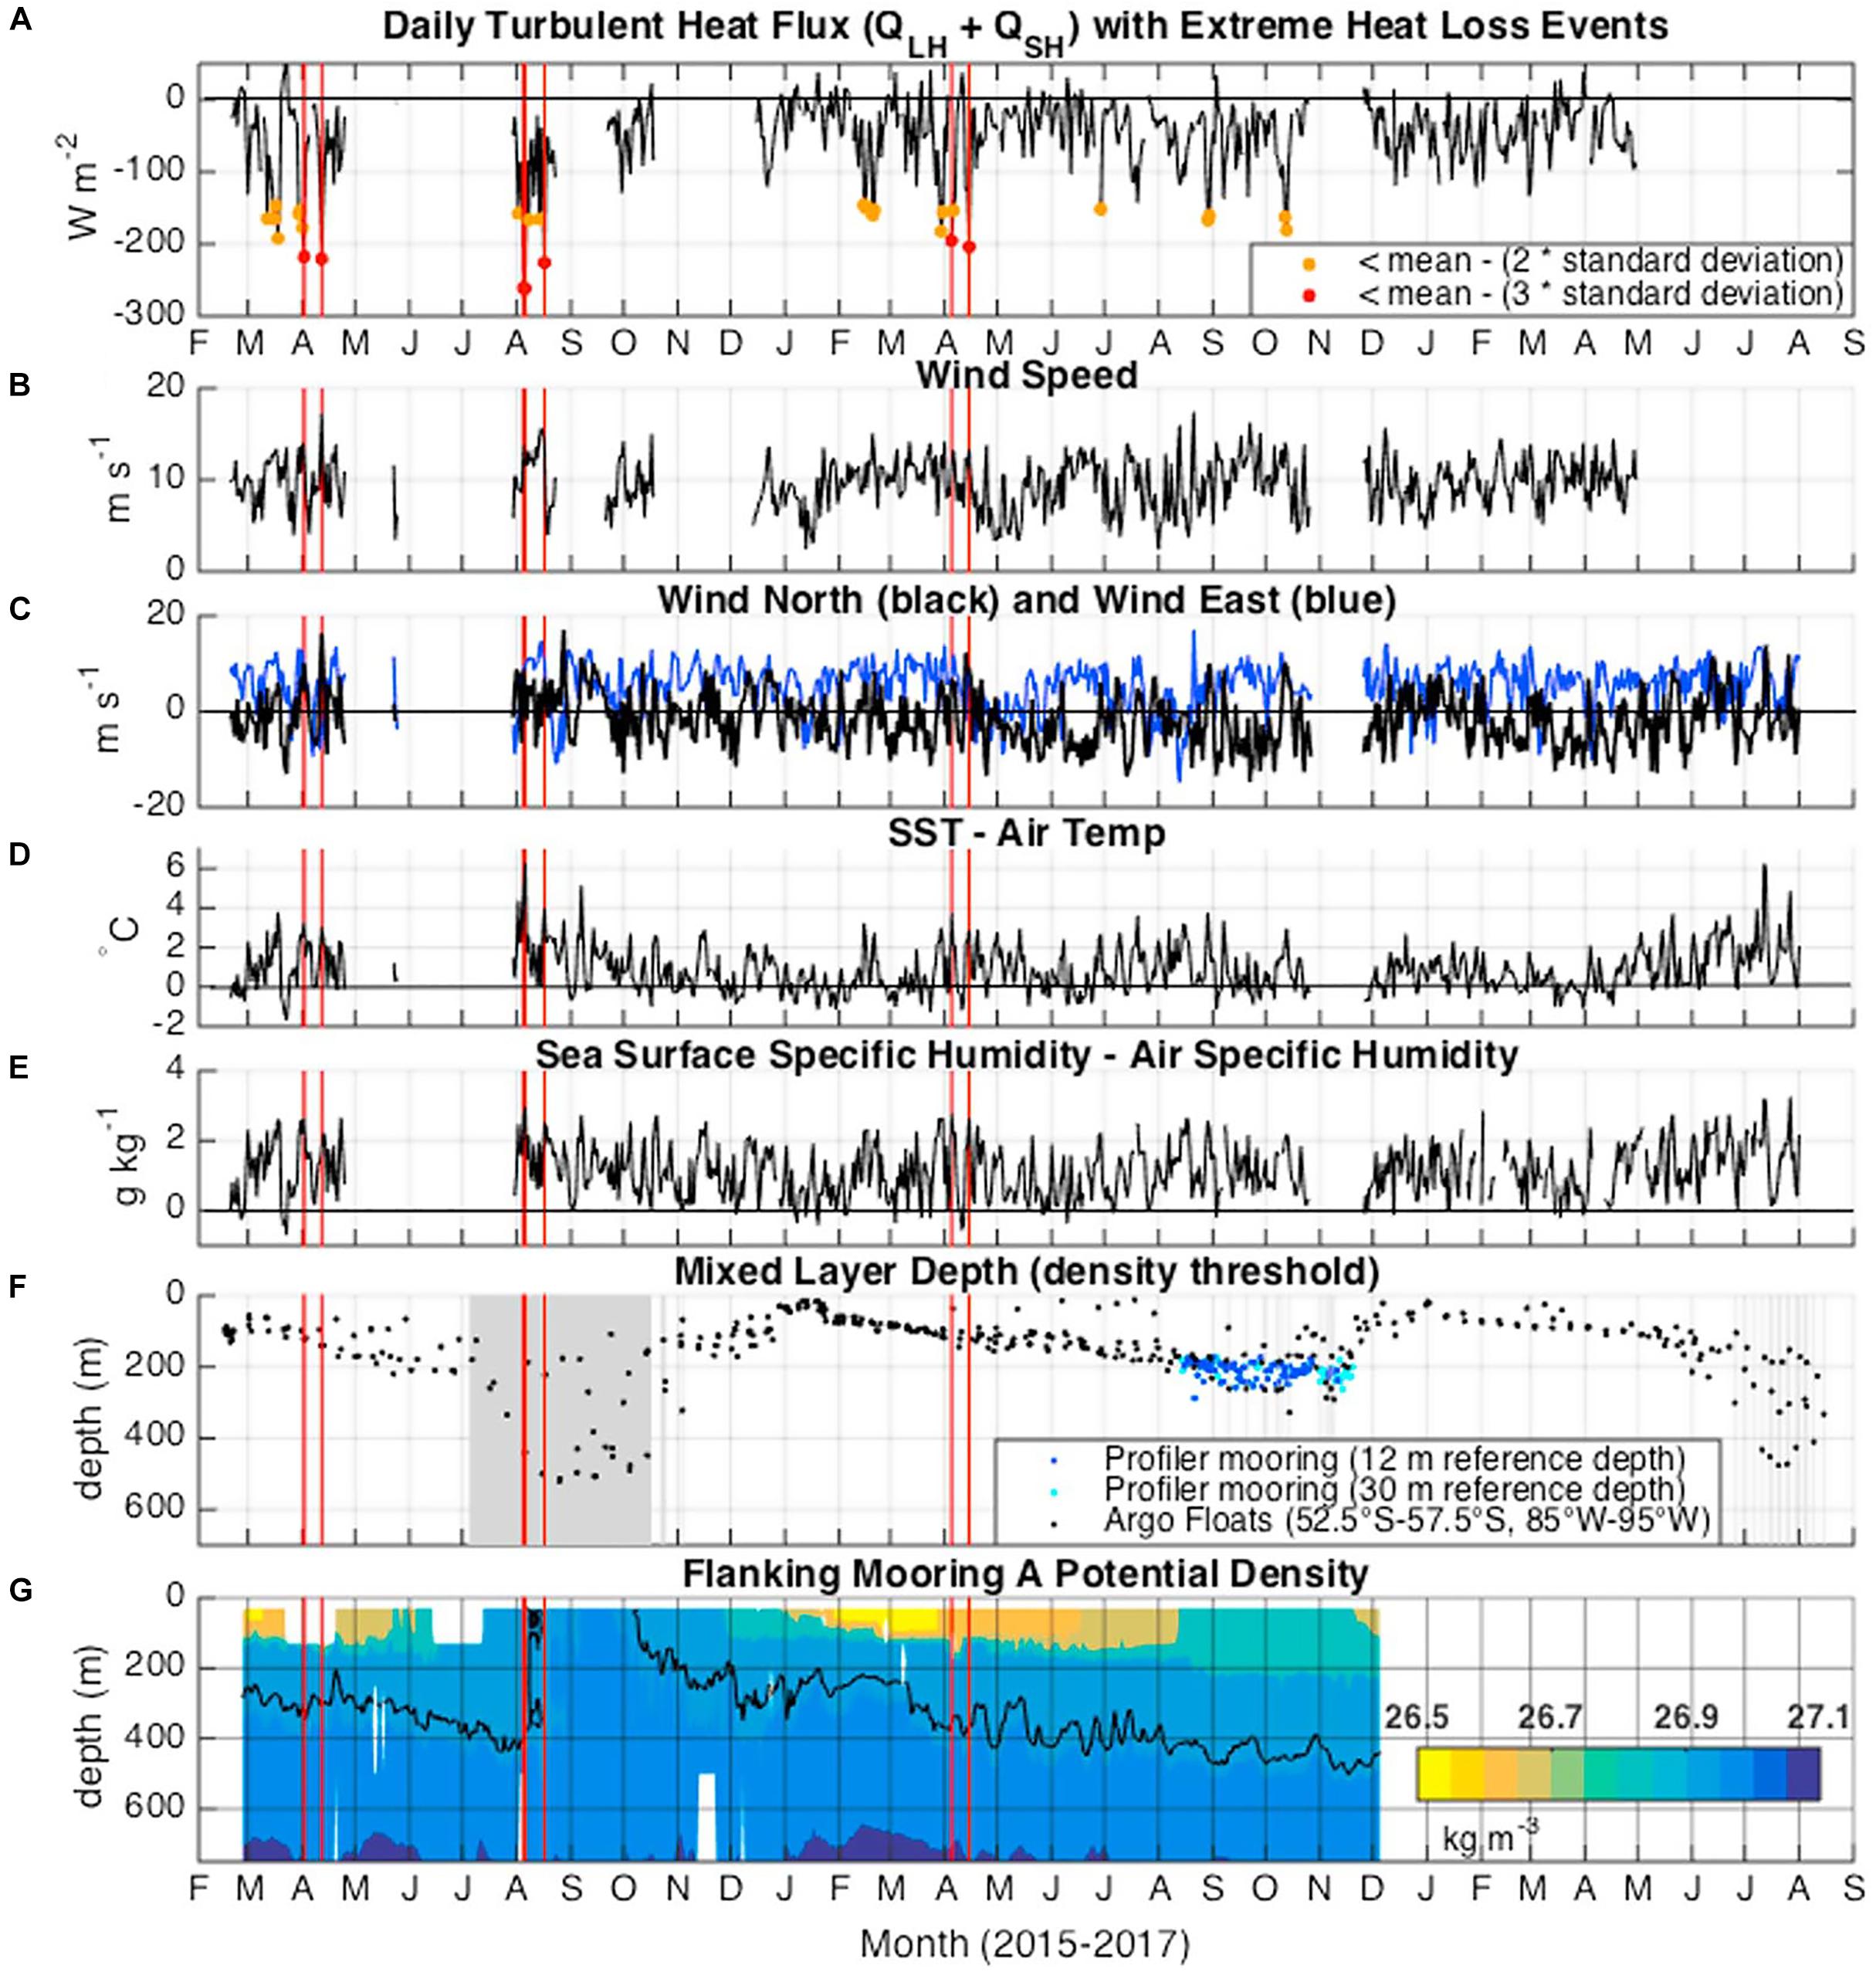
Figure 12. Figure 3 from Ogle et al. (2018) shows in panel (A) the sum of the daily latent and sensible heat losses, with extreme events marked in red, in panel (B) the relative wind speed, in panel (C) the north (black) and east (blue) wind components, in panel (D) the air-temperature gradient, SST minus air temperature, in panel (E) the air-sea humidity gradient, surface saturated specific humidity minus buoy specific humidity, in panel (F) mixed layer depths from Argo floats and the profiler mooring, and in panel (G) a contour plot of potential density with the black line the boundary of Subantarctic Mode Water. Reproduced with permission from the American Geophysical Union and from John Wiley and Sons.
Early results from the OOI moorings at the Irminger site and the nearby German Central Irminger Sea (CIS) and Dutch Long-Term Ocean Circulation Observations (LOCO) moorings have captured winter time convection events in the winters of 2014–2015 and 2015–2016 and stimulated great interest the observed spatial variability in the winter deep convection (de Jong et al., 2018). Figure 13, taken from that paper, is an amazing distillation of the surface forcing and ocean observations across the six moorings. Strong eddy variability was evident and the role of these eddies in modulating surface layer response to the atmosphere is of great interest. In addition, the biological and biogeochemical data from the array are being used to better understand the biological pump that transports carbon into the deep ocean and the contributions to the biological pump from the spring bloom of plankton as well as the deep winter mixed layer formation and accompanying sinking of particles (Palevsky and Nicholson, 2018).
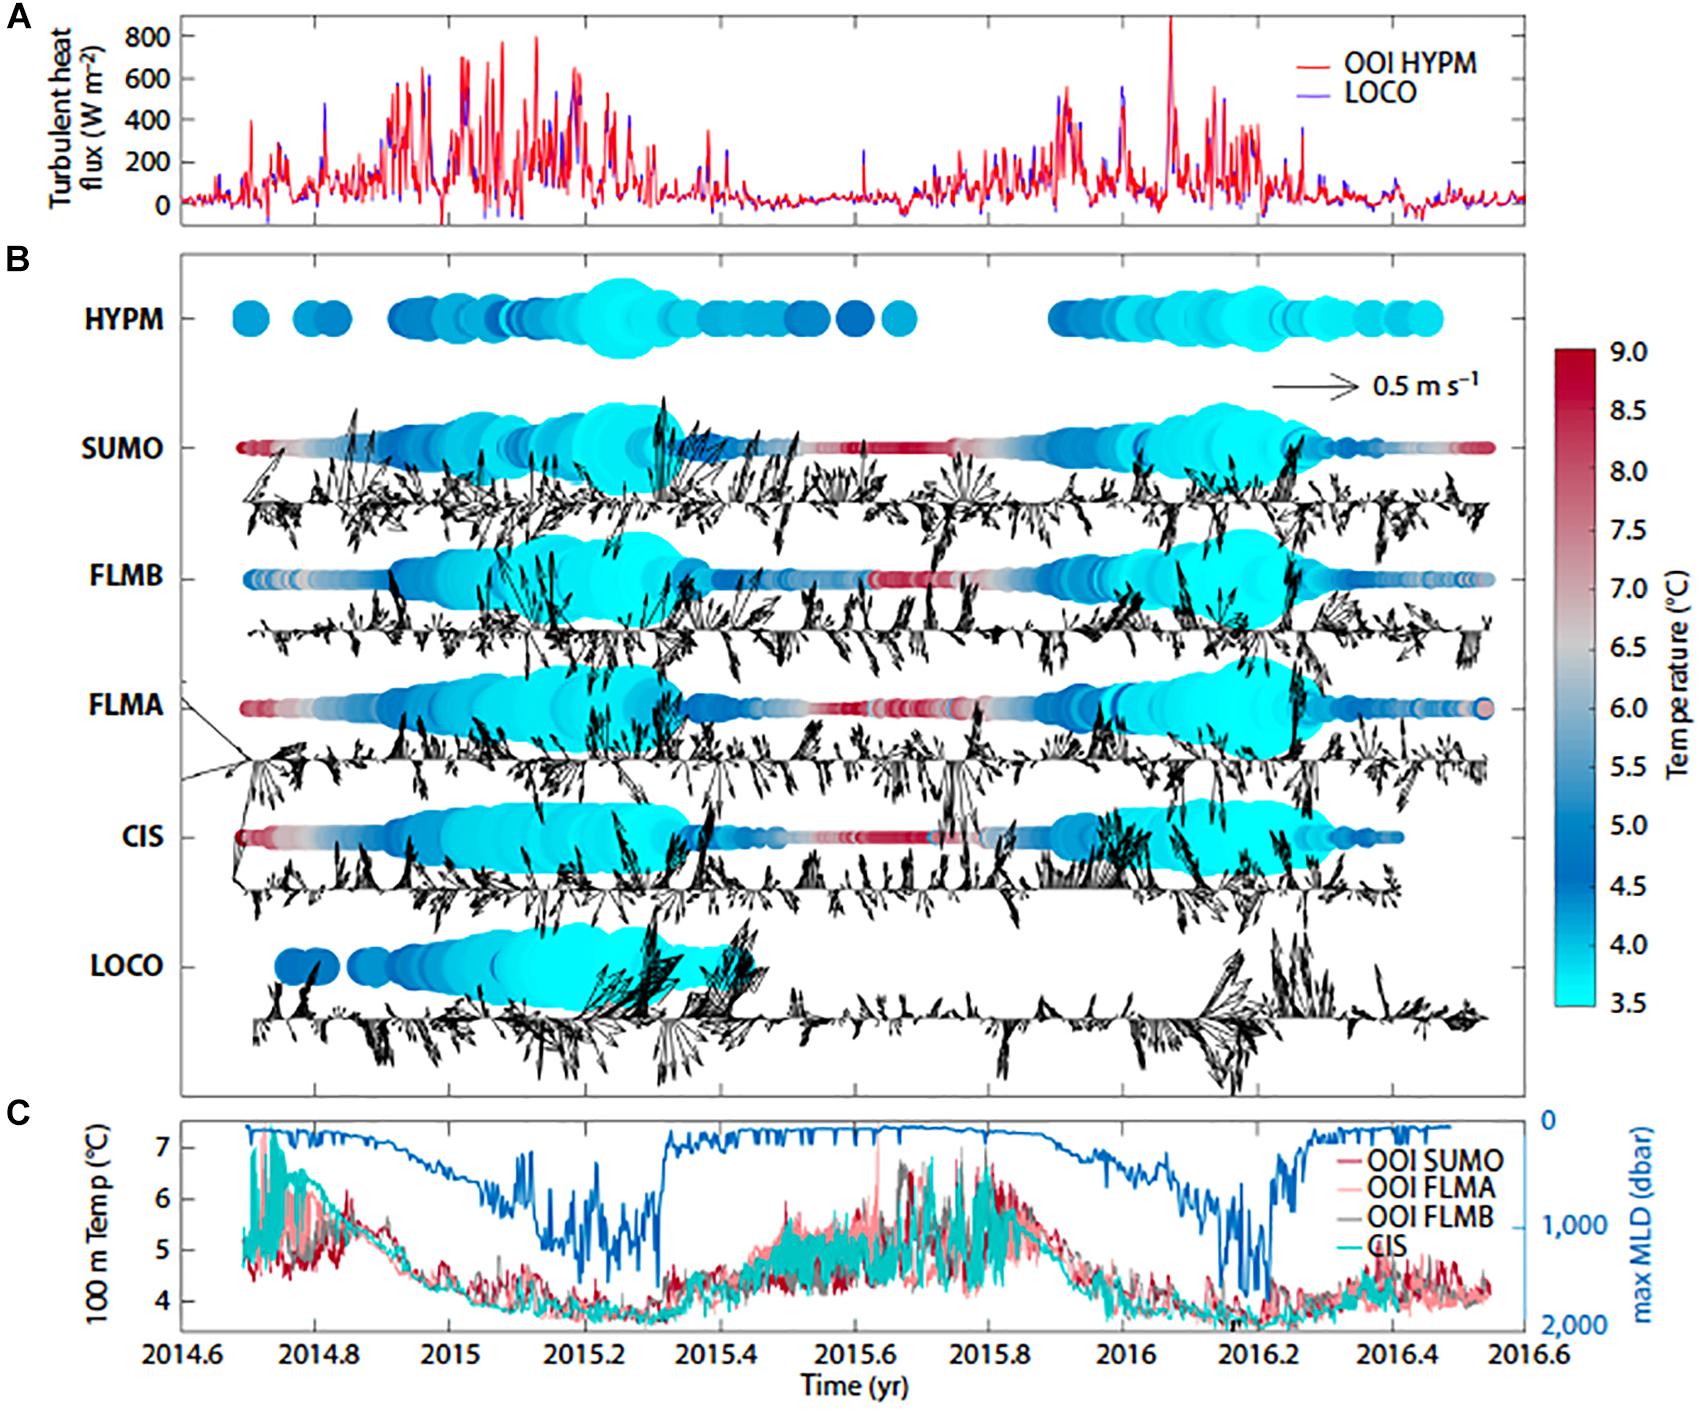
Figure 13. From de Jong et al. (2018). A shows the turbulent heat flux at the most northerly mooring OOI HYPM) and most southerly mooring (LOCO). B summarizes mixed layer depth (size of the shaded circles) and temperature (color) and velocities (arrows). C shows daily maximum mixed layer depth (blue) and 100 m depth temperatures from four of the moorings. Reproduced with permission from the Oceanography Society.
The Future
Submarine cabled observatories are an emerging technological trend as shown by the installation of observatories in Japan, Taiwan, Norway, China, and Canada, as well as numerous smaller ones in the Mediterranean (Delaney and Kelley, 2015). The provision of high bandwidth and power to submarine cables that span tectonic plates, full ocean depths, and coastal marine environments provides powerful infrastructure/facilities to optimize next-generation science in the ocean basins by fully capitalizing on a suite of emergent technologies. These cutting edge capabilities include, but are not limited to, nanotechnology, biotechnology, information technology, in situ genomic analysis, mass spectrometry, computational modeling, imaging technologies, and robotics. More powerful than any single technology will be their progressive integration into highly sophisticated submarine systems designed to conduct challenging remote operations in novel ways coupled with Cloud Computing and Ocean Informatics.
Science questions pertaining to coastal ocean dynamics and ecosystems change drove much of the design of the Endurance Array. Science drivers such as hypoxia, ocean acidification, swings between zooplankton species, and harmful algal blooms remain a focus of the array. However, in the 10 years since the array design, additional significant, and in some cases unanticipated, rapid ecosystem changes have been observed. The recent 2013–2015 warm “blob” event drove significant ecosystem changes in the Endurance Array region (Cavole et al., 2016) including shifts in species composition. Events like sea star wasting disease (Menge et al., 2016) and the recent abundance of pyrosomes off Oregon and Washington (Sutherland et al., 2018) may be a preview of long term changes in the region. The Endurance Array glider grid occupies the northern end of a west-coast underwater glider array that spans from the Strait of Juan de Fuca in the north to San Diego, California, in the south, and includes about ten, long cross-margin lines. This glider array will be key to tracking the north-south progression of climate events into the Pacific Northwest from both the north (warm blob) and the south (El Niño/La Niña). Like other elements of OOI, the Endurance Array has the expansion capability to accommodate sensors added by individual principal investigators. The Endurance Array and Cabled Array can host additional hydrophones to help track tagged fish species of interest in the Pacific Northwest, e.g., green sturgeon that occupy similar isobaths ranges as anticipated marine renewable energy devices. Emerging technologies such as genomic sensors (e.g., harmful algal blooms (HABs), eDNA, toxins), and imaging sensors (e.g., plankton) together with the long term core physical, chemical and biological measurements on the Endurance Array would be a powerful combination and provide unique insights into regional ecosystem changes.
Recent research on shelf/slope processes in the Middle Atlantic Bight indicates long-term warming of the continental shelf (Forsyth et al., 2015) with potential impacts on ecosystems (Pershing et al., 2015; Hare et al., 2016), as well as anomalously warm years (Chen et al., 2014) that have impacts on commercial fisheries (Mills et al., 2013; Gawarkiewicz et al., 2018). New processes (Zhang and Gawarkiewicz, 2015) and unusual phenomena (Gawarkiewicz and Plueddemann, in press) impacting shelf/slope exchange have been exposed as offshore forcing, perhaps due to a change in the destabilization point of the Gulf Stream (Andres, 2016), appears to be increasingly important. The mean frontal conditions appear to be impacted by these changes (Gawarkiewicz et al., 2018). The impact of anomalous warming and extreme shelf/slope exchange events on commercial fisheries has already been realized, and it is likely that such disruptions will continue. Within this backdrop of environmental change and societal impacts, the sustained, multi-scale, multi-platform observations from the Pioneer Array are of increasing importance. The Pioneer Array supports a Northeast US Shelf (NES) Long-Term Ecological Research (LTER) program funded by the NSF2. The Pioneer Array is anticipated to have impacts beyond the Middle Atlantic Bight. For example, there is interest in developing shelf and shelfbreak observatories in the East China Sea, the South China Sea, the Bay of Bengal and the Norwegian coast. The approach to design and implementation of the Pioneer Array serves as guidance for these efforts (Gawarkiewicz and Plueddemann, in press). Furthermore, an open competition for relocation of the Pioneer Array is anticipated after 5 years of operation, which will stimulate new scientific applications in new geographic regions that can benefit from the Array infrastructure.
The two southern hemisphere sites fill large areas of data sparse ocean. They have been brought in under the umbrella of the Southern Ocean Observing Serving (SOOS), an international group working to develop the Southern Ocean component of the Global Ocean Observing System (GOOS). The surface moorings from these sites and their data are drawing high interest and use. Some investigators working to make global ocean fields of air-sea fluxes (the transfers of heat, freshwater and momentum) blends satellite observations together with data from the surface analyses from weather prediction models. They make an optimal combination by weighting the satellite and model data to correct for errors and biases. These investigators have found that quality time series from a surface buoy of air temperature and humidity, wind speed and direction, incoming solar and longwave radiation, rain, barometric pressure, and SST are needed to develop these adjustments and tunings and that the optimization varies region to region. The Southern Ocean and Argentine Basin are in cold, dry areas that require a region-specific tuning, and these investigators have used the surface mooring data from these sites. Continuation of the Southern Ocean array is desired to examine the interannual variability in the surface forcing, mixed layer deepening, and mode water formation.
The Southern Ocean site has drawn interest from investigators looking at change and variability in Antarctic. During the international Year of Polar Prediction-Southern Hemisphere (YOPP-SH), the predictability of Southern Ocean and Antarctic weather systems has been one focus. To test whether or not the Southern Ocean data would have impact on regional weather prediction Southern Ocean surface meteorology, data was passed on to the Global Telecommunication System (GTS) via the National Data Buoy Center (NDBC) allowing the European Centre for Medium Range Weather Forecasting (ECMWF) to conclude that the Southern Ocean surface mooring data improved the forecast of synoptic weather systems.
A workshop on Irminger Sea Regional Science was held in late 2017 at the National Oceanography Centre in Southampton, United Kingdom. At the highest level, there was high interest in the Irminger Node from several perspectives. First, the array was located where we believe there are very large ocean heat losses and where this cooling makes surface water dense, causing sinking or convection that converts surface water to the deeper water that flows southward as part of the large-scale global circulation. Improved understanding and prediction of the formation of deeper water at the surface in this region is the goal of many researchers. Second, there is a strong desire to get accurate observations of the air-sea fluxes in the Irminger Sea and thus improve understanding of how the atmosphere drives the formation of deep water there. So even though the Irminger Sea surface mooring has had challenges with icing; the four seasons of partial records are being analyzed and looked at as the means to identify errors and biases in model-based estimates of the air-sea fluxes. Josey et al. (2018) found that the winter of 2014–2015 had strong wind events associated with Greenland tip jets where hourly mean heat loss exceeded 800 W m−2. Looking at following years, year to year variability in net heat loss was large and linked to the frequency of the Greenland tip jets. The workshop recommended: sustain OOI Irminger, including additional sampling on flanking moorings to match OSNAP; make every effort to improve data return on OOI Irminger surface buoy, with attention to the surface meteorology and air-sea fluxes, as these are key to improving understanding of the surface forcing for the region; deploy routinely gliders as their non-physical data provide unique, valued information; sustain the OOI Irminger profiler, as the Dutch LOCO and German CIS moorings will be discontinued and the OOI Irminger profiler used to return the profile data needed to observe deep convection and other processes.
Author Contributions
JT coordinated and was responsible for section “Introduction.” DK, ED, AP, and RW were responsible for sections “Regional Cabled Array,” “Coastal Endurance Array,” “Coastal Pioneer Array,” and “Global Arrays,” respectively. OK and JB contributed to sections “Regional Cabled Array” and “Coastal Endurance Array”. All authors contributed to section “The Future”.
Funding
This work was supported by NSF funded Construction and Initial Operation of the OOI under Award 0957938 and Management and Operation of the OOI under Award 1743430.
Conflict of Interest Statement
The authors declare that the research was conducted in the absence of any commercial or financial relationships that could be construed as a potential conflict of interest.
Acknowledgments
The authors are grateful for the consistent support and guidance provided by NSF and for the vision, professionalism, hard work, and dedication of the many colleagues who have participated in the conception and realization of the OOI.
Footnotes
References
Adams, K. A., Barth, J. A., and Chan, F. (2013). Temporal variability of near-bottom dissolved oxygen during upwelling off central Oregon. J. Geophys. Res. 118, 4839–4854. doi: 10.1002/jgrc.20361
Andres, M. (2016). On the recent destabilization of the gulf stream path downstream of Cape Hatteras. Geophys. Res. Lett. 43, 9836–9842. doi: 10.1002/2016GL069966
Barnard, A. H., Barth, J. A., Levine, M. D., Rhoades, B. K., Koegler, J. M. III, Derr, A. R., et al. (2010). “The coastal autonomous profiling and boundary layer system (CAPABLE),” in Proceedings of the MTS/IEEE Oceans 2010, Seattle, WA. doi: 10.1109/OCEANS.2010.5664447
Barth, J. A., Allen, S. E., Dever, E. P., Dewey, R. K., Evans, W., Feely, R. A., et al. (in press). Better regional ocean observing through cross-nation cooperation: a case study from the Northeast Pacific. Front. Mar. Sci.
Barth, J. A., Fram, J., Dever, E. P., Risien, C., Wingard, C., Collier, R. W., et al. (2018). Warm blobs, low-oxygen events and an eclipse: the ocean observatories initiative endurance array captures them all. Oceanography 31, 90–97. doi: 10.5670/oceanog.2018.114
Barton, A., Hales, B., Waldbusser, G. G., Langdon, C., and Feely, R. A. (2012). The Pacific oyster, Crassostrea gigas, shows negative correlation to naturally elevated carbon dioxide levels: implications for near-term ocean acidification effects. Limnol. Oceanogr. 57, 698–710. doi: 10.4319/lo.2012.57.3.0698
Bond, N. A., Cronin, M. F., Freeland, H., and Mantua, N. (2015). Causes and impacts of the 2014 warm anomaly in the NE Pacific. Geophys. Res. Lett. 42, 3414–3420. doi: 10.1002/2015GL063306
Butterfield, D. A., Massoth, G. J., McDuff, R. E., Lupton, J. E., and Lilley, M. D. (1990). Geochemistry of hydrothermal fluids from axial seamount emissions study vent field, Juan de Fuca Ridge: subseafloor boiling and subsequent fluid rock interaction. J. Geophys. Res. 95, 12895–12921. doi: 10.1029/JB095iB08p12895
Caplan-Auerbach, J., Dziak, R. P., Haxel, J., Bohnenstiehl, D. R., and Garcia, C. (2018). Explosive processes during the 2015 eruption of axial seamount, as recorded by seafloor hydrophones. Geochem. Geophys. Geosyst. 18, 1761–1774. doi: 10.1002/2016GC006734
Cavole, L. M., Demko, A. M., Diner, R. E., Giddings, A., Koester, I., Pagniello, C. M. L. S., et al. (2016). Biological impacts of the 2013–2015 warm-water anomaly in the Northeast Pacific: winners, losers, and the future. Oceanography 29, 273–285. doi: 10.5670/oceanog.2016.32
Chadwick, W. W. Jr., Paduan, J. B., Clague, D. A., Dreyer, B. M., Merle, S. G., Bobbitt, A. M., et al. (2016). Voluminous eruption from a zoned magma body after an increase in supply rate at Axial Seamount. Geophys. Res. Lett. 43, 12063–12070. doi: 10.1002/2016GL71327
Chan, F., Barth, J. A., Lubchenco, J., Kirincich, A., Weeks, H., Peterson, W. T., et al. (2008). Novel emergence of anoxia in the California current system. Science 319:920. doi: 10.1126/science.1149016
Chen, K., Gawarkiewicz, G. G., Lentz, S. J., and Bane, J. M. (2014). Diagnosing the warming of the northeastern US coastal ocean in 2012: a linkage between the atmospheric jet stream variability and ocean response. J. Geophys. Res. 119, 218–227. doi: 10.1002/2013JC009393
de Jong, M. F., Oltmanns, M., Kartsensen, J., and de Steur, L. (2018). Deep convection in the Irminger Sea observed with a dense mooring array. Oceanography 31, 50–59. doi: 10.5670/oceanog.2018.109
Delaney, J. R., and Kelley, D. S. (2015). “Understanding the planetary life support system: next generation science in the ocean basins,” in A New Vision of the Earth from the Abyss, eds P. Favali, A. de Santis, and L. Beranzoli (Chichester: Praxis publishing), 465–502.
Dickson, B., Yashayaev, I., Meincke, J., Turrell, B., Dye, S., and Holfort, J. (2002). Rapid freshening of the deep North Atlantic Ocean over the past four decades. Nature 416, 832–837. doi: 10.1038/416832a
Feely, R. A., Sabine, C. L., Hernandez-Ayon, J. M., Ianson, D., and Hales, B. (2008). Evidence for upwelling of corrosive “Acidified” water onto the continental shelf. Science 320, 1490–1492. doi: 10.1126/science.1155676
Flood, R. D., and Shor, A. N. (1988). Mud waves in the Argentine Basin and their relationship to regional bottom circulation patterns. Deep Sea Res. Part A 35, 943–971. doi: 10.1016/0198-0149(88)90070-2
Forsyth, J. S. T., Andres, M., and Gawarkiewicz, G. G. (2015). Recent accelerated warming of the continental shelf off New Jersey: observations from the CMV Oleander expendable bathythermograph line. J. Geophys. Res. 120, 2370–2384. doi: 10.1002/2014JC010516
Gawarkiewicz, G. G., and Plueddemann, A. J. (in press). Scientific rationale and conceptual design of a process-oriented shelfbreak observatory: the ooi pioneer array. J. Operational Oceanogr.
Gawarkiewicz, G. G., Todd, R. E., Plueddemann, A. J., Andres, M., and Manning, J. P. (2012). Direct interaction between the Gulf Stream and the shelfbreak south of New England. Nat. Sci. Rep. 2:553. doi: 10.1038/srep00553
Gawarkiewicz, G. G., Todd, R. E., Zhang, W., Partida, J., Gangopadhyay, A., Monim, M.-U.-H., et al. (2018). The changing nature of shelf-break exchange revealed by the OOI Pioneer Array. Oceanography 31, 60–70. doi: 10.5670/oceanog.2018.110
Gislason, A., Petursdottir, H., and Gudmundsson, K. (2015). Long-term changes in abundance of Calanus finmarchicus south and north of Iceland in relation to environmental conditions and regional diversity in spring 1990-2013. ICES J. Mar. Sci. 71, 2539–2549. doi: 10.1093/icesjms/fsu098
Grantham, B. A., Chan, F., Nielsen, K. J., Fox, D. S., Barth, J. A., Huyer, A., et al. (2004). Upwelling-driven nearshore hypoxia signals ecosystem and oceanographic changes in the northeast Pacific. Nature 429, 749–754. doi: 10.1038/nature02605
Hare, J. A., Morrison, W. E., Nelson, M. W., Stachura, M. M., Teeters, E. J., Griffis, R. B., et al. (2016). A vulnerability assessment of fish and invertebrates to climate change on the northeast US continental shelf. PLoS One 11:e0146756. doi: 10.1371/journal.pone.0146756
Henderikx Freitas, F., Saldias, G. S., Goni, M., Shearman, R. K., and White, A. E. (2018). Temporal and spatial dynamics of physical and biological properties along the Endurance Array of the California current ecosystem. Oceanography 31, 80–89. doi: 10.5670/oceanog.2018.113
Jahnke, R., Bane, J., Barnard, A., Barth, J., Chavez, F., Dam, H., et al. (2003). Coastal Observatory Research Arrays: A Framework for Implementation Planning. Report on the CoOP CORA Workshop Skidaway Institute of Oceanography Technical Report TR-03-01. Savannah, GA: Skidaway Institute of Oceanography, 78.
Josey, S. A., de Jong, F., Oltmanns, M., Moore, G. K., and Weller, R. A. (2018). Extreme variability in irminger sea winter heat loss revealed by ocean observatories initiative mooring and the ERA5 reanalysis. Geophys. Res. Lett. 46, 293–302. doi: 10.1029/2018GL080956
Jullion, L., Heywood, K. J., Garabato, A. C. N., and Stevens, D. P. (2010). Circulation and water mass modification in the Brazil-Malvinas confluence. J. Phys. Oceanogr. 40, 845–864. doi: 10.1175/2009/JPO4174.1
Kelley, D. S., Baross, J. A., and Delaney, J. R. (2002). Volcanoes, fluids, and life in submarine environments. Ann. Rev. Earth Planet. Sci. 30, 385–491. doi: 10.1126/sciadv.aao4631
Kelley, D. S., Delaney, J. R., and Cabled Array Team (2016). “NSF’s cabled array: a wired tectonic plate and overlying ocean,” in Paper Presented at the OCEANS 2016 MTS/IEEE Monterey, Monterey, CA. doi: 10.1109/OCEANS.2016.7761398
Kelley, D. S., Delaney, J. R., and Juniper, S. K. (2014). Establishing a New Era of submarine volcanic observatories: cabling axial seamount and the endeavour segment of the Juan de Fuca Ridge. Mar. Geol. 352, 426–450. doi: 10.1016/j.margeo.2014.03.010
Klinger, T., Chornesky, E. A., Whiteman, E. A., Chan, F., Largier, J. L., and Wakefield, W. W. (2017). Using integrated, ecosystem-level management to address intensifying ocean acidification and hypoxia in the California current large marine ecosystem. Elem. Sci. Anth. 5:16. doi: 10.1525/elementa.198
Li, F., Ginoux, P., and Ramaswamy, V. (2008). Distribution, transport, and deposition of mineral dust in the Southern Ocean and Antarctica: contribution of major sources. J. Geophys. Res. 113:D10207. doi: 10.1029/2007JD009190
Lozier, M. S., Bacon, S., Bower, A. S., Cunningham, S. A., Femke de Jong, M., de Steur, L., et al. (2017). Overturning in the subpolar North Atlantic program: a new imternational ocean observing system. Bull. Amer. Met. Soc. 98, 737–752. doi: 10.1175/BAMS-D-16-0057.1
Mackas, D. L. (2006). “Interdisciplinary oceanography of the Western North American continental margin: vancouver Island to the tip of Baja California,” in The Sea, Chapter 12: The Global Coastal Ocean: Interdisciplinary Regional Studies and Syntheses, eds A. R. Robinson and K. H. Brink (Cambridge, MA: Harvard University Press), 840.
McCabe, R. M., Hickey, B. M., Kudela, R. M., Lefebvre, K. A., Adams, N. G., Bill, B. D., et al. (2016). An unprecedented coastwide toxic algal bloom linked to anomalous ocean conditions. Geophys. Res. Lett. 43, 10366–10376. doi: 10.1002/2016GL070023
McKibben, S. M., Peterson, W., Wood, A. M., Trainer, V. L., Hunter, M., and White, A. E. (2017). Climatic regulation of the neurotoxin domoic acid. Proc. Natl. Acad. Sci. U.S.A. 114, 239–244. doi: 10.1073/pnas.1606798114
McRae, E. (2016). “Continuous real time scanning of the upper ocean water column,” in Proceedings of the OCEANS 2016 MTS/IEEE, Monterey, CA. doi: 10.1109/OCEANS.2016.7761350
Menge, B. A., Cerny-Chipman, E. B., Johnson, A., Sullivan, J., Gravem, S., and Chan, F. (2016). Sea star wasting disease in the keystone predator Pisaster ochraceus in Oregon: insights into differential population impacts, recovery, predation rate, and temperature effects from long-term research. PLoS One 11:e0153994. doi: 10.1371/journal.pone.0153994
Mills, K., Pershing, A., Brown, C., Chen, Y., Chiang, F.-S., Holland, D., et al. (2013). Fisheries management in a changing climate: lessons from the 2012 ocean heat wave in the Northwest Atlantic. Oceanography 26, 191–195. doi: 10.5670/oceanog.2013.27
Morrissey, J., and Bowler, C. (2012). Iron utilization in marine cyanobacteria and eukaryotic algae. Front. Microbiol. 3:43. doi: 10.3389/fmicb.2012.00043
National Academies of Sciences, Engineering and Medicine (2015). A Strategic Vision for NSFInvestments in Antarctic and Southern Ocean Research. Washington, DC: National Academies Press.
National Research Council [NRC] (2015). A Strategic Vision for NSF Investments in Antarctic and Southern Ocean Research. Washington, DC: The National Academies Press. doi: 10.17226/21741
Nicholson, J. W., and Healey, A. J. (2008). The present state of autonomous underwater vehicle (AUV) applications and technology. Mar. Tech. Soc. J. 42, 44–51. doi: 10.4031/002533208786861272
Nooner, S. L., and Chadwick, W. W. Jr. (2016). Inflation-predictable behavior and co-eruption deformation at Axial Seamount. Science 354, 1399–1403. doi: 10.1126/science.aah4666
Ogle, S. E., Tamsitt, V., Josey, S. A., Gille, S. T., Cerovecki, I., Talley, L. D., et al. (2018). Episodic Southern Ocean heat loss and its mixed layer impacts revealed by the farthest south multiyear surface flux mooring. Geophys. Res. Lett. 45, 5002–5010. doi: 10.1029/2017/GL076909
ORION Executive Steering Committee (2005). Ocean Observatories Initiative Science Plan. Washington, DC: Joint Oceanographic Institutions Inc.
ORION Executive Steering Committee (2007). Ocean Observatories Initiative Scientific Objectives and Network Design: A Closer Look. Washington, DC: Joint Oceanographic Institutions, Inc.
Palevsky, H. J., and Nicholson, D. P. (2018). The North Atlantic Biological Pump: insights from the ocean observatories initiative irminger Sea array. Oceanography 31, 42–49. doi: 10.5670/oceanog.2018.08
Pershing, A., Alexander, M., Hernandez, C., Kerr, L., Le Bris, A., Mills, K., et al. (2015). Slow adaptation in the face of ocean warming leads to collapse of Gulf of Maine cod fishery. Science 350, 809–812. doi: 10.1126/science.aac9819
Peterson, W. T., and Schwing, F. B. (2003). A new climate regime in northeast pacific ecosystems. Geophys. Res. Lett. 30, 1896. doi: 10.1029/2003GL017528
Philip, B. T., Denny, A. R., Solomon, E. A., and Kelley, D. S. (2016). Times-series measurements of bubble-plume variability and water column methane distribution above Southern Hydrate Ridge, Oregon. Geochem. Geophys. Geosyst. 17, 1182–1196. doi: 10.1002/2016GC006250
Rayner, R. (2010). The U.S. integrated ocean observing system in a global context. Mar. Technol. Soc. J. 44, 26–31. doi: 10.4031/MTSJ.44.6.1
Regional Cabled Observatory Network (of Networks) [RECONN] (2004). RECONN: Regional Cabled Observatory Network (of Networks). Report of the Cabled Regional Observatory Workshop. San Francisco, CA: National Science Foundation, 1–64.
Richardson, M. J., Weatherly, G. L., and Gardner, W. D. (1993). Benthic storms in the Argentine Basin. Deep Sea Res. II 40, 975–987. doi: 10.1016/0967-0645(93)90044-N
Rodero Castro, I., and Parashar, M. (2016). Architecting the cyberinfrastructure for National Science Foundation Ocean Observatories Initiative (OOI). Available at: http://hdl.handle.net/2117/100206
Rodero Castro, I., and Parashar, M. (2019). “Data cyber-infrastructure for end-to-end science - experiences from the NSF ocean observatories initiative,” in Proceedings of the Keynote at the 12th International Conference on Parallel Processing and Applied Mathematics, Lublin. doi: 10.1109/MCSE.2019.2892769
Rudnick, D. L., Davis, R. E., Eriksen, C. C., Fratantoni, D. M., and Perry, M. J. (2004). Underwater gliders for ocean research. Mar. Tech. Soc. J. 38, 48–59. doi: 10.4031/002533204787522703
Sabine, C. L., Feely, R. A., Gruber, N., Key, R. M., Lee, K., Bullister, J. M., et al. (2004). The oceanic sink for anthropogenic CO2. Science 305, 367–371. doi: 10.1126/science.1097403
Sloyan, B., Talley, L. D., Chereskin, T., Fine, R., and Holte, J. (2010). Antarctic Intermediate water and Subantarctic Mode water formation in the southeast Pacific: the role of turbulent mixing. J. Phys. Oceanogr. 40, 1558–1574. doi: 10.1175/2010JPO4114.1
Spietz, R. L., Butterfield, D. A., Buck, N. J., Larson, B. L., Chadwick, W. W. Jr., Walker, S. L., et al. (2018). Deep-sea volcanic eruptions create unique chemical and biological linkages between the subsurface lithosphere and the oceanic hydrosphere. Oceanography 31, 128–135. doi: 10.5670/oceanog.2018.120
Stammer, D. (1997). Global characteristics of ocean variability esti- mated from regional TOPEX/POSEIDON altimeter measurements. J. Phys. Oceanogr. 27, 1743–1769. doi: 10.1175/1520-0485(1997)027<1743:GCOOVE>2.0.CO;2
Suess, E. (2014). Marine cold seeps and their manifestations: geological control, biogeochemical and environmental conditions. Int. J. Earth Sci. 103, 1889–1916. doi: 10.1007/s00531-014-1010-0
Sundby, S., Drinkwater, K., and Kjesbu, O. S. (2016). The North Atlantic spring-bloom system—where the changing climate meets the winter dark. Front. Mar. Sci. 3:28. doi: 10.3389/fmars.2016.00028
Sutherland, K. R., Sorensen, H. L., Blondheim, O. N., Brodeur, R. D., and Galloway, A. W. E. (2018). Range expansion of tropical pyrosomes in the northeast Pacific Ocean. Ecology 99, 2397–2399. doi: 10.1002/ecy.2429
Takahashi, T., Stewart, C. S., Sweeney, C., Poisson, A., Metz, N., Tilbrook, B., et al. (2002). Global sea–air CO2 flux based on climatological surface ocean pCO2, and seasonal biological and temperature effects. Deep Sea Res. 49, 1601–1622. doi: 10.1016/S0967-0645(02)00003-6
Trainer, V. L., Wells, M. L., Cochlan, W. P., Trick, C. G., Bill, D. B., Baugh, K. A., et al. (2009). An ecological study of a massive bloom of toxigenic Pseudo-nitzschia cuspidata off the Washington State coast. Limnol. Oceanogr. 54, 1461–1474. doi: 10.4319/lo.2009.54.5.1461
Weller, R. A., Bigorre, S. P., Lord, J., Ware, J. D., and Edson, J. B. (2012). A surface mooring for air–sea interaction research in the Gulf Stream. Part I: mooring design and instrumentation. J. Atmos. Ocean Technol. 29, 1363–1376. doi: 10.1175/JTECH-D-12-00060.1
Wilcock, W. S. D., Tolstoy, M., Waldhauser, F., Garcia, C., Tan, J. J., Bohnenstiehl, D. R., et al. (2016). Seismic constraints on caldera dynamics from the 2015 Axial Seamount eruption. Science 354, 1395–1399. doi: 10.1126/science.aah5563
Xu, G., Chadwick, W. W. Jr., Wilcock, W. S. D., Bemis, K. G., and Delaney, J. (2018). Observations and modeling of hydrothermal response to the 2015 eruption at Axial Seamount, Northeast Pacific. Geochem. Geophys. Geosyst. 19, 2780–2797. doi: 10.1029/2018GC007607
Zamani, R., AbdelBaky, M., Balouek-Thomert, D., Rodero, E., and Parashar, M. (2017). “Supporting data-driven workflows enabled by large scale observatories,” in Proceedings of the 2017 IEEE 13th International Conference on e-Science (e-Science), Auckland, 592–595. doi: 10.1109/eScience.2017.95
Keywords: ocean observing, marine geology and geophysics, physical oceanography, biological oceanography, chemical oceanography, ocean engineering
Citation: Trowbridge J, Weller R, Kelley D, Dever E, Plueddemann A, Barth JA and Kawka O (2019) The Ocean Observatories Initiative. Front. Mar. Sci. 6:74. doi: 10.3389/fmars.2019.00074
Received: 31 October 2018; Accepted: 08 February 2019;
Published: 04 March 2019.
Edited by:
Justin Manley, Just Innovation Inc., United StatesReviewed by:
Zdenka Willis, Veraison Consulting LLC, United StatesDonna M. Kocak, Harris Corporation, United States
Copyright © 2019 Trowbridge, Weller, Kelley, Dever, Plueddemann, Barth and Kawka. This is an open-access article distributed under the terms of the Creative Commons Attribution License (CC BY). The use, distribution or reproduction in other forums is permitted, provided the original author(s) and the copyright owner(s) are credited and that the original publication in this journal is cited, in accordance with accepted academic practice. No use, distribution or reproduction is permitted which does not comply with these terms.
*Correspondence: John Trowbridge, jtrowbridge@whoi.edu