Out of Sight, But Within Reach: A Global History of Bottom-Trawled Deep-Sea Fisheries From >400 m Depth
 Lissette Victorero
 Les Watling
 Maria L. Deng Palomares
 Claire Nouvian5
- 1National Oceanography Centre, University of Southampton, Waterfront Campus, Southampton, United Kingdom
- 2University of Southampton, Ocean and Earth Science, Southampton, United Kingdom
- 3Department of Biology, University of Hawaii at Mānoa, Honolulu, HI, United States
- 4Sea Around Us, University of British Columbia, Vancouver, BC, Canada
- 5Bloom Association, Paris, France
Deep-sea fish species are targeted globally by bottom trawling. The species captured are often characterized by longevity, low fecundity and slow growth making them vulnerable to overfishing. In addition, bottom trawling is known to remove vast amounts of non-target species, including habitat forming deep-sea corals and sponges. Therefore, bottom trawling poses a serious risk to deep-sea ecosystems, but the true extent of deep-sea fishery catches through history remains unknown. Here, we present catches for global bottom trawling fisheries between years 1950–2015. This study gives new insight into the history of bottom trawled deep-sea fisheries through its use of FAO capture data combined with reconstructed catch data provided by the Sea Around Us- project, which are the only records containing bycatches, discards and unreported landings for deep-sea species. We illustrate the trends and shifts of the fishing nations and discuss the life-history and catch patterns of the most prominent target species over this time period. Our results show that the landings from deep-sea fisheries are miniscule, contributing less than 0.5% to global fisheries landings. The fisheries were found to be overall under-reported by as much as 42%, leading to the removal of an estimated 25 million tons of deep-sea fish. The highest catches were of Greenland halibut in the NE Atlantic, Longfin codling from the NW Pacific and Grenadiers and Orange roughy from the SW Pacific. The results also show a diversification through the years in the species caught and reported. This historical perspective reveals that the extent and amount of deep-sea fish removed from the deep ocean exceeds previous estimates. This has significant implications for management, conservation and policy, as the economic importance of global bottom trawling is trivial, but the environmental damage imposed by this practice, is not.
Introduction
The history of global fisheries is one of full- or over-exploitation, with a few exceptions (Pauly and Zeller, 2016). One of the most controversial fishing practices known to date is bottom trawling, which can be dated back to as early as 1376, when concerns and complaints were raised by fellow fishermen about a new destructive and wasteful fishing habit (Roberts, 2007). The extension of bottom trawling to the deep-sea occurred in the second half of the twentieth century, prompted by technological advances and a decline in shallow water fisheries (Koslow et al., 2000). The fisheries industry, particularly in Europe, North America, and the former Soviet Union, pushed into ever deeper water in search of more fish. In many cases, these fisheries were promulgated on the high seas where there were few, if any, regulations (Bensch et al., 2009a). Many of those fisheries, especially those targeting seamounts have been shown to be “boom and bust” fisheries, and lasting from less than a decade to a couple of decades (Clark et al., 2007) before they are no longer economically viable.
The deep sea is an ecosystem different from that of shallower water. Here organisms, including fish, generally live for long times, have low fecundity, mature at older ages, and have lowered metabolism and slow growth. Drazen and Haedrich (2012) found that for 41 shallow and deep dwelling fish species with sufficient life history data, there was a consistent trend of increasing longevity, decreasing fecundity, and decreasing potential rate of population increase with depth. In addition, deep-sea fish may be more vulnerable to the fishery by aggregating on seamounts for mating or taking advantage of trapping of vertically migrating nekton by seamount topography (Morato and Clark, 2007). Such is the case of the Orange roughy, where fisheries, in order to be economically viable, have targeted spawning and feeding aggregations (Clark, 1999; Roberts, 2002). It is, therefore, likely that deep-sea fisheries could easily and rapidly, over-exploit fish species living on seamounts and ridges, or along the continental slopes of the world.
Fishing in the deep is difficult, and requires large vessels with very heavy gear in order to reach species living at depths of as much as 2,000 m. Deep-sea fishing vessels are often of 80–100 m length, weighing in at 2,000 gross tons or more. In some distant water fisheries, the vessel may be much larger and house crew and capabilities for processing and freezing the catch while at sea. Deep trawl gear is usually in the form of an otter trawl which uses metal “doors” that can weigh up to 5,000 kg in order to get the net to the bottom and keep the net mouth open while being pulled across the seafloor. The trawl can be very wide, with total distance including the sweeps, bridles and ground gear amounting to 80–200 m. The ground gear of a deep-sea trawl is equipped with steel bobbins and/or stiff rubber discs that are designed to allow the net to move over rough bottom without getting “hung up” (Clark and Koslow, 2007). This equipment guarantees that bottom trawling is the most efficient fishing method in the deep-sea, but also the most destructive as it permanently removes the benthic habitats, typically comprising long-lived habitat-forming species, such as deep-sea corals and sponges (Clark et al., 2016). To date, no recovery over decadal time scales have been observed on seamounts targeted by bottom trawling (Williams et al., 2010).
Deep-sea fisheries have been summarized in general terms (Priede, 2017), for specific species (Shotton, 2016) and parts of the ocean, such as seamounts (Clark, 2009), FAO fishing regions, or for relatively short periods of time (Bensch et al., 2009a). However, a comprehensive historical analysis of bottom trawled fisheries describing the major trends with data beyond that provided by FAO, is currently missing. The purpose of this study is to produce a more complete global history of those fisheries promulgated primarily with bottom trawl gear below 400 m. This is achieved by complementing the data set produced by the FAO for the period of 1950–2015 (FAO, 2017), with unreported landings, bycatch and discards data for the period of 1950–2014 from the Sea Around Us research initiative. We document the history of the species targeted, the countries involved, and the parts of the global ocean that have supported these fisheries and highlight shifts in their patterns through the years covered by the data. In addition, we pinpoint discrepancies between the two data sets to show that the fishing pressure encountered by certain species has not been accounted for in current conservation efforts, which is potentially leading to the mismanagement of deep-sea trawl fisheries.
Methods
When we started this study, there was no comprehensive compilation of fish species caught as part of the deep-sea fisheries of the world (Bensch et al., 2009a). Therefore, we developed a list of fish species caught primarily by deep-sea bottom trawling either as target species or bycatch, using records from EU Annex 1 and 2, FishBase (Fishbase.org), the fisheries literature, and from the compilation by Priede (2017) (Table 1). This list of demersal species was reviewed by independent experts to be sure we had not overlooked any species known to be taken, at least in moderate to large numbers, primarily by bottom trawling. A small number of species within this list are also caught with a longline, along with bottom trawling and there is no differentiation between catches by gear types. Global capture data (in tonnage) for species was extracted from the Food and Agriculture Organization of the United Nations (FAO) capture data set using FishstatJ (v. 3.01) for the years 1950–2015. As the FAO data only includes the capture landings reported by national governments, a set of estimated unreported capture data for the same species for the years 1950–2014 was provided by the Sea Around Us (www.seaaroundus.org) at the University of British Columbia. The reconstructed catch data includes species for which FAO did not require reports in the past, as well as unreported landings and discards generated by deep-sea fisheries (Zeller et al., 2017). Both data series were also used to calculate the number of species caught per year.
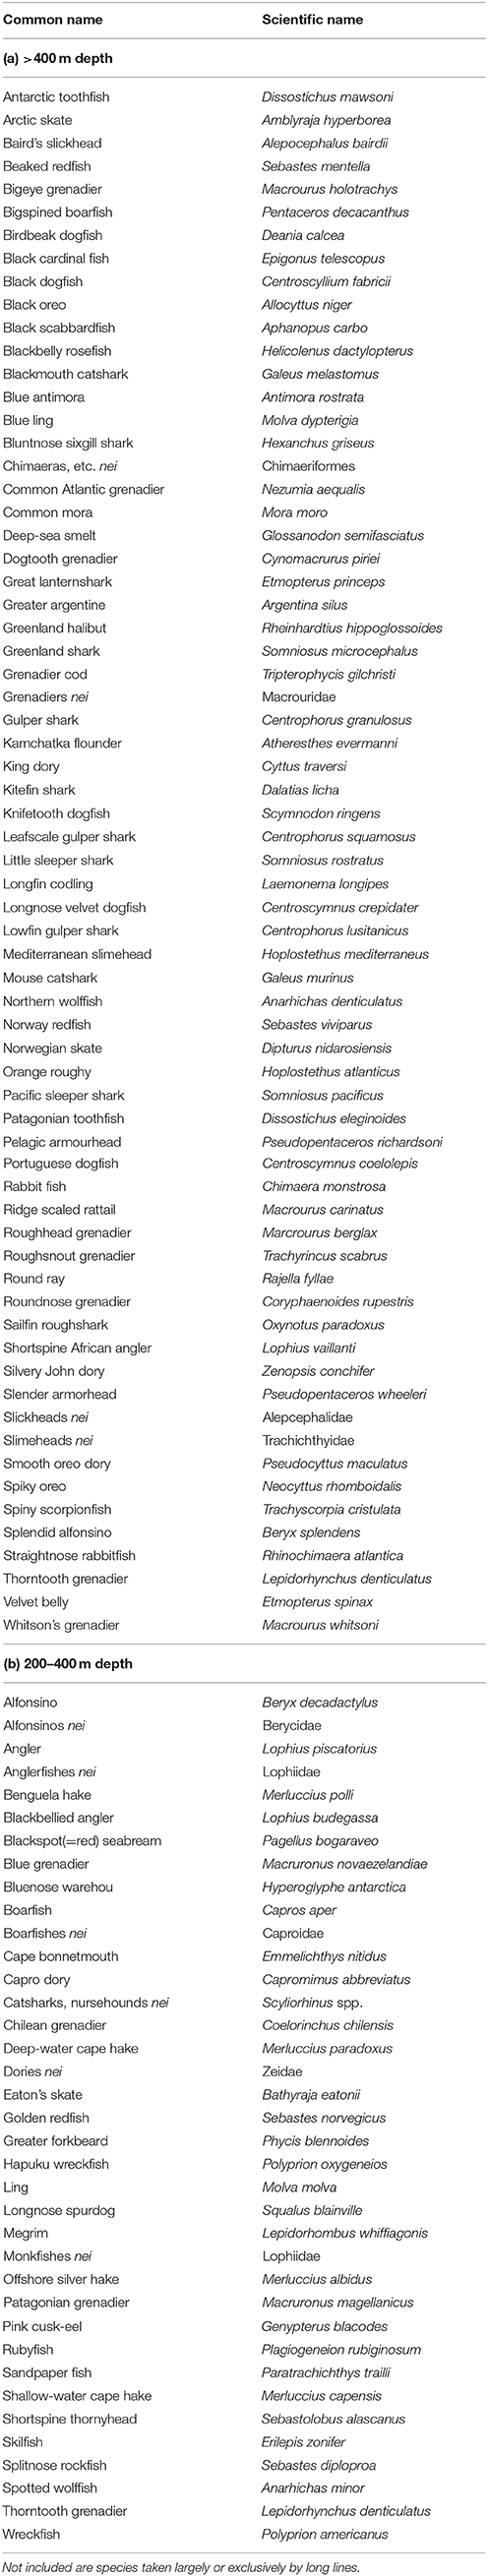
Table 1. List of species taken primarily by bottom trawls at depths greater than 400 m and for which there is data in the FAO FishStat J landings database (a) and also included are species whose trawl fisheries are primarily between 200–400 m (b).
The Sea Around Us reconstructed capture data is estimated using a seven-step methodology developed by Zeller et al. (2007) and recently modified and detailed in Zeller and Pauly (2016). The method includes sourcing data from reporting entities, in particular FAO, but also local agencies, identification of sectors not covered in the official reports, finding additional sources of information searching literature and archives, developing data anchor points in the time series, and consulting local experts to fill in the data gaps, then interpolating between anchor points for missing data components. Lastly, the uncertainty associated with each reconstruction is quantified.
Deep-sea fish species exhibit a continuously changing range of life-history traits with depth (Drazen and Haedrich, 2012). In order to make catch levels more comparable, we divided our list of deep-sea species into two groups. The shallower group comprises slope species that inhabit depths of ~200–400 m. These species typically mature faster and have higher fecundity resulting in life history characteristics that are more closely allied with species of the continental shelf. As such they provide more productive fisheries with higher magnitude of catches and will be considered in a future paper. The second group, which is the main focus of this study, comprises species living and being caught mostly by bottom trawls below 400 m. These species exhibit more typical deep-sea traits such as slow growth, late maturation and low fecundity, and by comparison have lower weights of catches. Data handling and analysis was conducted in the software “R” (R Core Team, 2016) or with Microsoft Excel®.
Long-term patterns of catch by country was illustrated using the Density Equalizing Cartogram routine implemented in the “Cartogram geoprocessing tool” in ArcGIS (v. 10.2.2). This routine uses a diffusion-based method (Gastner and Newman, 2004) and changes the shape of each polygon (in this case, country) in a manner that reflects the amount of an attribute (catch) associated with each polygon. The final product is a world-map of countries altered according to their deep-sea fishery catch in relation to that of all other countries. We constructed a cartogram for each year from 1950 to 2015.
We added a color gradient to the cartograms to give an indication of the magnitude of catches for each year. In the country analysis, we treated the data for Russian Federation and that of USSR as a single country whereas those formerly in the Soviet Union have their own entries in the FAO database after they became independent. Cartograms were generated separately for the two depth groups using both the reported data from FAO and the reconstructed total estimated catch. The cartograms for the 200–400 m depth group will be reported in a future paper.
Results
Global, Regional and Country Specific Trends
The total amount of deep-sea fish caught was ~14 million (FAO) and ~25 million tons (FAO + SAU) through the historical period of 1950–2015 (Table 2a). Unreported landings and discards contributed almost equally to the discrepancy between the two data sets (Table S1). Deep-sea bottom-trawled fisheries account for less than 0.5% of the global estimated catch of all fisheries. The first large-scale deep-sea fishery catches are from 1956 by the Soviets who, based on reconstructions, discarded an estimated ~84,000 t of Greenland halibut in the Northeast Atlantic (Tables S1). The discards were potentially bycatch of the more valuable cod and herring fisheries, which were the predominant target species at that time (Garfield, 1959). From here onwards, both reported landings and unreported catch steadily increased through the 1960s, after which there were three major periods of peak catches, reflected more in the total estimated catch than in the reported FAO data (Figure 1). These peaks represent sudden increases in catch of one or two species, such as Greenland halibut and Longfin codling, whose populations were newly discovered and rapidly exploited (Figure 2, and Supplementary Material, cartogram animation). While the early catches were dominated by just a few species from one or two areas, the deep-sea fisheries history becomes more complex adding more species and regions, with large estimated unreported catches between 1985 and 2010 and an estimated ~600,000 t of fish being caught in the mid-1970s late 1980s and early 2000s.
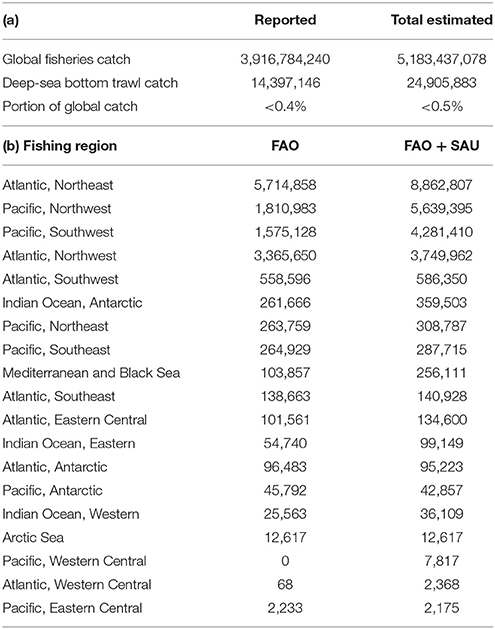
Table 2. Total reported (FAO data) and total estimated (FAO + SAU) catch (tons) for the period of 1950–2015 showing (a) the contribution of deep-sea bottom trawl fisheries to global landings, (b) a breakdown of total deep-sea (>400 m) fish landings by FAO fishing region.
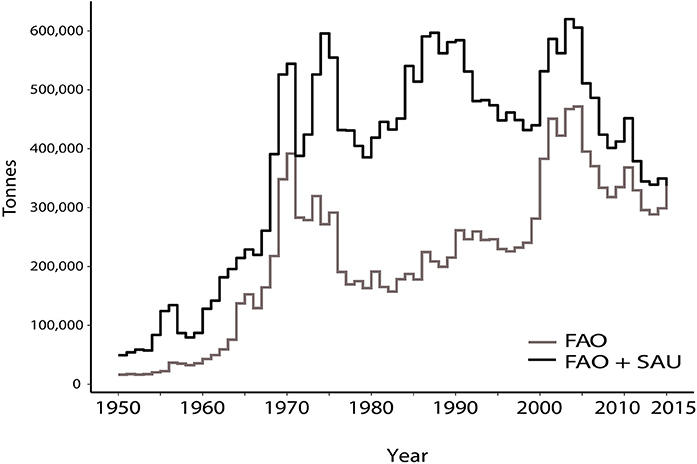
Figure 1. Total catches of deep-sea (>400 m) bottom trawled species by the FAO and Sea Around Us not data series for the period of 1950–2015.
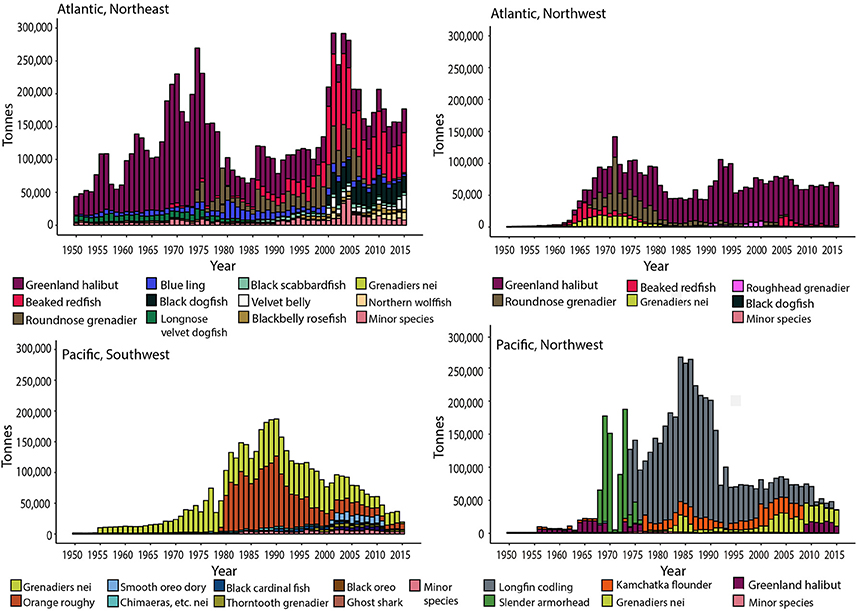
Figure 2. Estimated total catches (Sea Around Us data) of deep-sea fish caught primarily at depths >400 m for the major fishing regions showing species targeted. (A) Northeast Atlantic, (B) Northwest Atlantic, (C) Southwest Pacific, and (D) Northwest Pacific. Species under the Minor species category include those contributing less than 1% to the total landings of a region.
The total reported and estimated catch of each region is presented in Table 2b, from which it can be seen that four FAO regions are responsible for the majority of landings: the Northeast and Northwest Atlantic, and the Northwest and Southwest Pacific. These areas are more productive and have high amounts of organic matter falling to the deep sea floor (Lutz et al., 2002; Watling et al., 2013) and as such the deep-sea fish populations in those areas are also very productive. The time period between 1975–2000 includes a notable decrease in landings from the NE Atlantic, which is reflected in the FAO data; in this same period there was an increase in the estimated total catch from the SW and NW Pacific fisheries (Figure 2). Catches in the NW Pacific, however, showed an overall sudden peak followed by a trend to reduction in landings until recently, which is linked to the collapse of the once extremely abundant Longfin codling stocks (Figure 2). The SW Pacific fisheries rely on aggregating species, such as Orange roughy and Smooth oreo dories found on and around topographic features, such as offshore banks and mid-ocean ridges that provide a great amount of area at fishable depth within the region. However, as fishing grounds become depleted, there is an overall trend of reduction in catches (Figure 2) with productivity of the fisheries questioned leading to stricter management (Schlacher et al., 2014). For example, catch quotas for the Orange roughy were lowered in the 1990s once scientific evidence emerged showing slow growth, high longevity (Mace et al., 1990) and rapidly declining biomass for some of the stocks (Clark, 2001).
We have illustrated the changing patterns of catch for individual countries in a series of cartograms, one for each year for both reported landings and estimated total catches. The cartograms are presented in Figure 3, and the remainder have been made into an animation and are included as Supplementary Material. The FAO cartograms show the pattern of change of landings, first from the North Atlantic, where Greenland halibut, Longnose velvet dogfish, and Blue ling were the mainstay of the fishery. Initially these species were caught in relatively low numbers, with reported landings for the countries being 20,000 t or less. As of 1950 the countries landing any deep-sea fish were Ireland, Norway, and a few other European nations. Through the 1950s and 60s, catches steadily increased, mostly in the North Atlantic as those three species continued to be exploited.
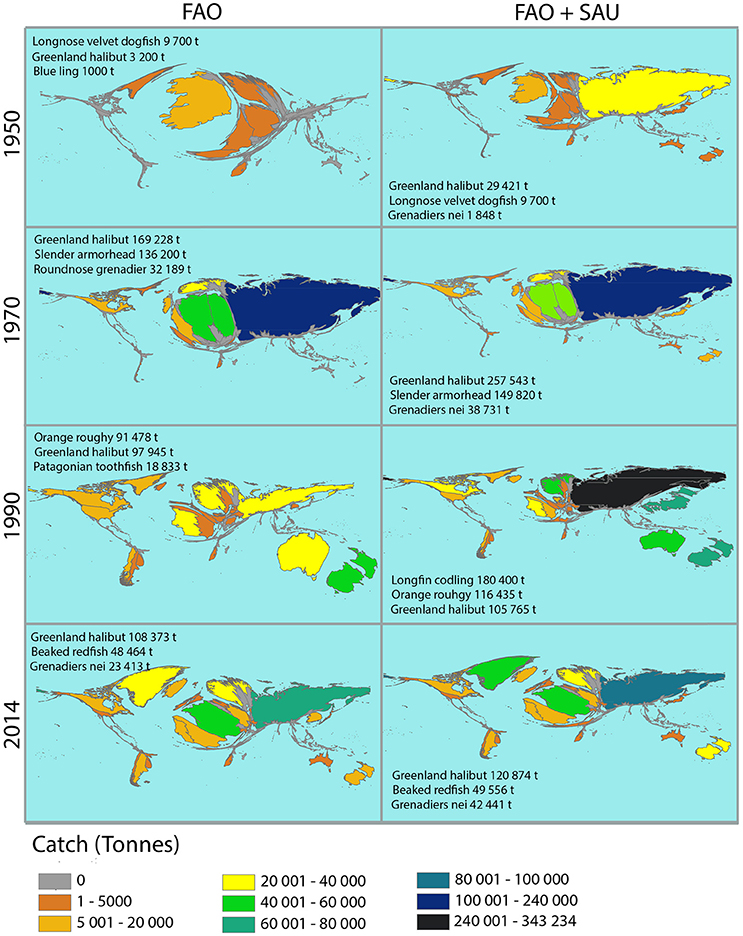
Figure 3. Selected cartograms illustrating the changing patterns of deep-sea (primarily >400 m) trawled fish catch by country for the years 1950, 1970, 1990, and 2014. Maps are based on FAO and FAO + SAU (Sea Around Us) catch data. The size of the country reflects the reported catch (tons) of deep-sea bottom-trawled species. Each country is also color-coded according to range of catch data. The species within the figure represent the top three species with catches in tons. A full set of cartograms for the period 1950–2015 is available as an animation in the Supplementary Material.
During this period the Soviet Union expanded into deep-sea fisheries. In 1969 Slender armorhead was discovered on the Hawaiian—Emperor Seamounts and in 1970 an estimated 149,820 t were caught (Figure 3). The Soviet Union was the primary country targeting Slender armorhead, and as a result it is the first country to report total deep-sea fishery landings in the range of 100,000–240,000 t. However, there are also records of the Japanese fleet targeting the Slender armorhead fishery during this time with catches of ~30,000 t (Clark et al., 2007). Unfortunately, the FAO and the reconstructed data sets used in this study have no record of this and overall provide poor records for the Japanese deep-sea fisheries.
From the late 1970s and through the 1980s other deep-sea fish species were targeted, in particular Orange roughy, Longnose grenadier and other miscellaneous grenadiers (listed by FAO as “Grenadiers nei”) and by 1990, the Patagonian toothfish. The 1980s and 90s also represent a period where the disparity between reported landings and total catch estimates was the largest. As will be noted below, these two decades saw very large landings of Longfin codling by Russia, and up to 50% under-reporting of Orange roughy by New Zealand, and systematic under-reporting of Greenland halibut being caught in the North Atlantic.
The diversification of countries fishing in the deep sea and of species landings being reported increase, while the trend for under-reporting decreases during the 1990s and into the 2000s. At the same time the global catch numbers decrease to about half of peak values seen in the 1980s. This pattern is correlated with a decrease in landings from the SW Pacific, which consisted mostly of Grenadiers and Orange roughy, and an increase in catches from the NE Atlantic where the diversity as well as the tonnage of the catch increased (Figure 2). In the NW Pacific the large reduction in catch, which buoyed the values in the 1980s and 90s, was due to the heavy exploitation of Longfin codling. This species was replaced by catches of Grenadiers (mostly Popeye and Giant, although not specifically reported) and Greenland halibut from the Bering Sea.
Comparisons between the FAO records and the reconstructed catches show a steady increase in both data series for the number of species being caught, or at least recorded (Figure 4). This can be expected in the FAO data series, as a large number of species were not reported in the past, because of different regulation or the species were often grouped under a category of “nei.” However, the reconstructions also show an increase in the diversity of species being caught, with an increase of up to 30 species from the 1950s to the modern era, where the data sets converge. This implies that a true diversification in the species targeted is likely and it is not simply an artifact caused by regulations leading to ungrouping of species.
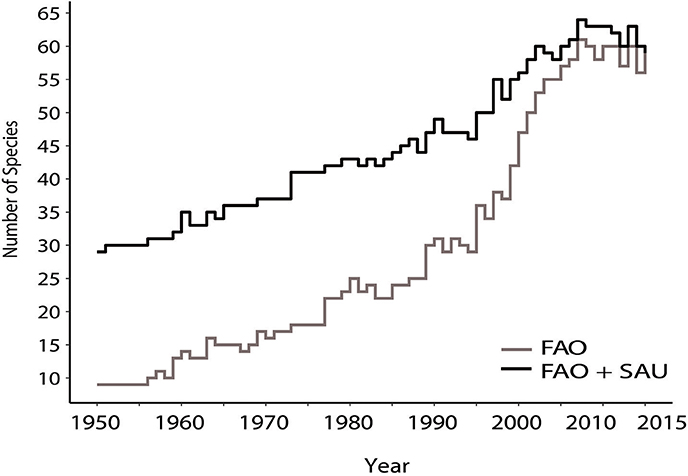
Figure 4. Number of deep-sea species primarily caught at depths >400 m by bottom trawling each year in the FAO and Sea Around Us data series for the period 1950–2015.
Individual Fisheries
The 72 species or species groups being caught primarily with bottom trawls mostly at depths greater than 400 m, their reported (FAO) catch data, and the total estimated catch (FAO+SAU) are presented in Table 3. In the following section we give more detail about the most fished and vulnerable deep-sea fishery species, the nations who fish them, and catch trends since 1950. Biological information on individual species not specifically cited has been taken from FishBase.org. and all the catch values described here can be found in the Supplementary Data Tables (Table S1).
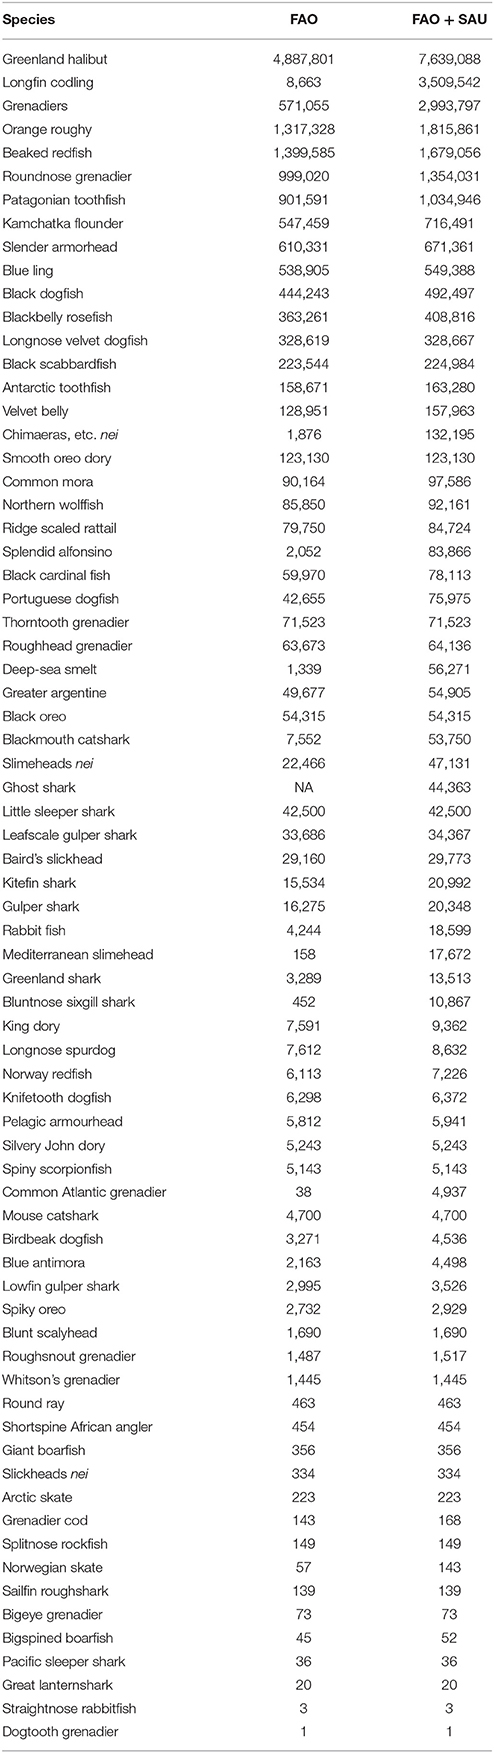
Table 3. A list of deep-sea bottom trawled species, including target and bycatch species caught primarily below 400 m depth, and their reported (from FAO database) and estimated total [FAO data with unreported estimates from the Sea Around Us (SAU)] in tons for the period of 1950–2015.
Greenland Halibut
Greenland halibut (Reinhardtius hippoglossoides Walbaum, 1792), also known as Turbot. The species is found in both the North Atlantic and North Pacific Oceans usually at depths of 500–1,000 m. This is a very old fishery in West Greenland, NW Atlantic, being fished commercially using line and hooks since the mid-1800s (Bowering and Brodie, 1995). For many years gill nets were used, but after 1966 large trawlers from Poland, German Democratic Republic and the USSR began taking Greenland halibut as trawl bycatch in the Redfish and Roundnose grenadier fisheries. Indeed, in 1966, the reconstructed data series reveals the Soviets discarding up to 47,000 t of Greenland halibut. Canada entered the directed fishery for this species in the mid-1960s (summarized in Bowering and Brodie, 1995), reporting landings of ~80,000 t over the decade. Portugal entered in the 1980s with minor catches and Spain in the 1990s reported landings of ~170,000 t. Spain's dominance in this fishery likely led to the Canada – Spain “turbot war” of 1993 (Haedrich et al., 2001). On the Newfoundland slope, most of the fish caught between 1991 and 1996 were below the size at 50% maturity (Haedrich et al., 2001). This species had, by far, the highest reported landings through the history of the FAO data set (~4.89 million tons), and also the highest total catches when unreported landings and discards are included (~7.64 million tons) (Table 3). The greater part of the catch was from the North Atlantic, first from the northeast, and later from the northwest, with smaller numbers from the North Pacific. Only about 60% of the total estimated catches were reported to FAO. In fact, the catches were likely under-reported by more than 75% for 39 of the 66 years considered here (Figure 5, Table S1). A major difference between the two data sets arises from the reconstructed discard estimates, which amount to a total of 2.5 million tons with ~1.8 million tons assigned to the Soviet/Russian fleet operating within the Barents Sea (Table S1). In the 1990s discards amounted to 350,000 t, of which 200,000 t were by the Russian fleet in the Barents Sea and 80,000 t in the Norwegian Sea. In comparison, the reported landings for Russia only amount to 47,000 t over the whole decade. The large quantities of discards within this period were likely caused by lowered quotas as the Greenland halibut stocks suffered a decline and became regulated in 1992 (Honneland and Nilssen, 2001; Nedreaas and Smirnov, 2004). The discard estimates made by Jovanović et al. (2008) use discard data between 1996 and 2006 and assume a similar discard policy for the species throughout the fishery's history potentially leading to an overestimation of the discard values.
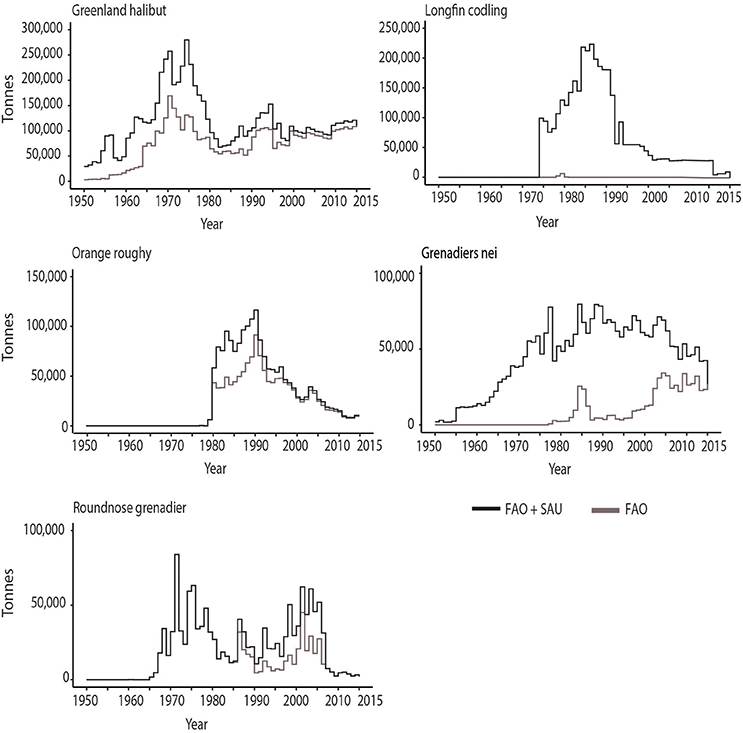
Figure 5. Catch data for some of the most abundantly deep-sea (>400 m) bottom-trawled species between 1950–2015, which show strong discrepancies between reported (FAO) and estimated total (FAO + Sea Around Us) values.
Longfin Codling
Longfin codling (Laemonema longipes Schmidt, 1938), also known as Forked hake in Japan, is a deep-water member of the Gadiformes, in the Family Moridae, primarily inhabiting the NW Pacific continental slope from Kamchatka to Hokkaido and into the Okhotsk Sea. Its depth distribution is 80–1,830 m, but the most abundant catches are at 800 m depth (Yokota and Kawasaki, 1990). The fishery is promulgated both by Japanese and Russian vessels, the latter sometimes in contract to Japan. Savin (2013) noted that the biomass of the species in the area where the fishery occurs can reach values as high as 360,000 t. The lowest stock values were recorded in 1984 (116,000 t) and 2006 (66,800 t). Savin (2013) noted that the fishery by Russian vessels started in 1974, followed by Japan in 1976. There seems to be no evidence of a fishery for Longfin codling before that. Even so, by the third year, the landings (unreported to FAO) in Russia were approximately 100,000 t. After the establishment of the EEZ by Japan, some Russian vessels were allowed to fish under contract in Japanese waters. For some reason, except for 3 years (1978–1980), neither country reports catches of Longfin codling under its own name and there are hardly any records of this fishery existing in the FAO database. Instead, the landings are most likely included under the category “marine fishes nei” (Alexei Orlov, personal communication). Thus, estimating the actual catches of this species has been difficult and rely heavily on reconstructed records from the Sea Around Us (Figure 5) and data recorded in Russian fishery reports (Savin, 2013). In the end, this species is estimated to have produced about 3.5 million tons of fish, making it the second most productive deep-sea fish caught by trawls and causing one of the biggest discrepancies between the reported landings and total catch estimates.
Orange Roughy
Orange roughy (Hoplostethus atlanticus Collett, 1889) has a very wide distribution, from NW and NE Atlantic, throughout much of the eastern Atlantic, south Central Indian, and SW and SE Pacific. It is one of the oldest commercially exploited fish species, reaching more than 100 years of age (Andrews et al., 2009). Orange roughy matures at the age of 20–35 (Horn et al., 1998) and spawning occurs in dense aggregations around topographic features such as seamounts, and rises as well as along the continental slope (Branch, 2001). These aggregations are fished and provide high catch rates, leading to rapid overexploitation. The long, slow growth and late maturity of this species, coupled with its low reproductive output, makes recovery slow. The first reported landings of Orange roughy occurred in 1977, by foreign trawlers off New Zealand, but the start of the fishery occurred in New Zealand in 1979 (Branch, 2001). In 1980, in the Chatham Rise area, which is the largest and oldest Orange roughy fishery, virgin catches were about 9–10 t/tow (Clark, 2001), but by the late 1990s catches had decreased to 2–3 t/tow. Also, in the 1990s the fishery moved out of New Zealand waters to the Louisville Ridge seamount chain where catches varied from 1.4 to 2.7 t/tow. Other Orange roughy fisheries include those off Australia, NE Atlantic in the mid-1980s and 1990s, off Namibia in the 1990s, and off Chile and in the Southern Indian Ocean in the late 1990s (Figures 4, 5). Virtually all these fisheries are operating on stocks that are less than 30% of virgin biomass, and several have lasted only a few years (Branch, 2001; Foley et al., 2011). The reconstructed data suggests that for this fishery, landings were under-reported by as much as 50% between the years of 1981–89. Overall, half a million tons of unreported Orange roughy have been caught in the period of 1950–2015, mainly by Japan (~225,000 t), New Zealand (~162,000 t) and South-Korea (~35,000 t). The FAO admits its records underestimate Orange roughy catches with trade analysis confirming at least a 30% underestimation in the year 2001 (Lack et al., 2003). Simmons et al. (2016) note that discrepancies in tray weights, conversion factors, and false reporting in order to avoid income tax liability have all contributed to under reporting of Orange roughy from New Zealand waters. Since 1986, the establishment of the Quota Management System, also gave incentive to under report due to quota restrictions and in order to avoid penalties. In the Chatham Rise fishery, after years of reduced TACs (total allowable catches), the stocks have shown signs of recovery (Doonan et al., 2015) and currently, the fishery is certified as sustainable by the Marine Stewardship Council (MSC) with TACs set at ~7,000 t/year. However, to date, the Orange roughy fishery remains contentious, with scientists and non-governmental organizations (NGOs) raising concerns about its sustainability (Watling, personal observation).
Grenadiers
Grenadiers (Macrouridae) nei (not elsewhere included) is a category consisting of grenadiers, whiptails and rattails, which are not recorded separately, or species that were not recorded separately until relatively recently. There are about 360 species in this group extending over a wide depth range of 110–7,000 m, making them widespread in the deep sea. Most species are caught as bycatch and are small or not edible so are either discarded or processed as fishmeal. A few of the larger species, with better quality meat, are targeted and their landings are recorded separately by FAO. FAO did not show any landings for Grenadiers nei, until 1977, with total landings now reaching 571,000 t, of which ~400,000 t has been reported by Russia from the NW Pacific. These commercially targeted fisheries, include species, such as the Giant, Popeye and Pacific grenadier (Tuponogov et al., 2008), whose landings are not yet recorded separately by the FAO. The Sea Around Us estimates the amount of caught but discarded grenadiers to be close to 2.5 million tons since 1950 (Figure 5). These numbers include some species that were discarded in the early years, but became a targeted fishery later, such as Roundnose grenadier. Two million tons of discards are assigned within the New Zealand EEZ (economic exclusive zone) mostly from the fishing entities of New Zealand (1 million tons) and Japan (0.5 million tons). Rattails are a common bycatch product of the Orange roughy, oreo, hoki, hake, ling and arrow squid fisheries and of the scampi trawling (Anderson, 2012; Ballara and O'Driscoll, 2015; Anderson et al., 2017). The bycatch estimates (% of total catch) made by observers on New Zealand vessels are 0.7% for Orange roughy, 6% for hoki and 30% for scampi fisheries of the total catch, with the majority discarded (Anderson, 2012; Anderson et al., 2017; Ballara and O'Driscoll, 2015). The contrasting discard rates between the official records and the reconstructions are potentially caused by the “observer” effect, in which fishing behavior is modified for the better due to the presence of observers (Simmons et al., 2016). The reconstructions also suggest that the discarding of Grenadiers remains relatively high, when taking into account the fact that the catches for target species have notably decreased (Figure 5).
Roundnose Grenadier
Roundnose grenadier (Coryphenoides rupestris Gunnerus, 1765), is a benthic to benthopelagic species found along the continental slopes and the Mid-Atlantic Ridge of the North Atlantic Ocean typically at 400–1,200 m depth. Russian trawlers first caught Roundnose grenadiers as bycatch in their cod and redfish fisheries on the Canadian eastern slope (Atkinson, 1995). It was soon suggested, due to the high numbers and high quality of the fish, that a targeted fishery could be developed in the North Atlantic, with the Danish, developing a fishery in the 1980s in the Skagerrak. The highest reported landings peaked in 1971 at 84,000 t, but declined steadily after 1975 (Figure 5). Haedrich et al. (2001) noted that important biological information for this species was not known until after 1975, by which time the fishery had begun to decline. Both the FAO reported landings and Sea Around Us estimated total catches show fluctuations in the catch, and from 1986 to 2006 the reported catch was from 78 to 26% of the estimated unreported catch (Figure 5). The discrepancy between the data sets arise from reconstructed discards from Denmark between early 1990s to 2006, which are estimated to 10,000–20,000 t per year amounting overall to 350,000 t. This species is a common bycatch and discard in the demersal mixed trawl fisheries in Skagerrak, Kattegat and North Sea (Gibson et al., 2010) with discard rates of 28% in weight in the NE Atlantic. As the juveniles and adults co-exist within the same area, trawls catch small, non-marketable fish, which are discarded at sea (Pawlowski and Lorance, 2009). The decline in stocks led to an agreement between the EU and Norway, setting the TAC to zero within the Norwegian waters since 2006 (ICES, 2016). Devine et al. (2006) noted that the steep drop in abundance would qualify C. rupestris as endangered under IUCN criteria.
Beaked Redfish
Beaked redfish (Sebastes mentella Travin, 1951) is an oceanic migratory fish inhabiting the waters of the northern North Atlantic at 300–1,400 m depth. It is worth noting that this fishery has been mixed, especially in early years, with the Golden redfish (Sebastes marinus) fishery. This was the second-most landed fish over the 66 years of the FAO database, even though the fishery started in the 1960s, and had landings that were quite modest through the 1960s to 1990s (Figure 6). Starting in 2000, however, landings increase, reaching 1.4 million t reported to FAO. Iceland and Russia caught the majority of this fish since 2000. The discrepancies between the reported and estimated total catches arise from 275,000 t of reconstructed discards starting from the late 1980s (Figure 6). The discards are mainly assigned to Iceland (197,000 t) and Norway (76,500 t), despite both countries having discard bans since 1989 and 1987, respectively (Condie et al., 2014). Nakken (1998) reported that high amounts of undersized redfish were discarded prior to the introduction of sorting grids in shrimp trawlers in 1995. Redfish is also a common bycatch of the cod and haddock fisheries in the Barents Sea (Little et al., 2015). The regulations for this fishery include over quota catches being withdrawn from the following year's quota and size limitations, in addition to bycatch limits with undersized fish landed being counted at 50% of the fish's weight against the annual quota (Moffat et al., 2009). Furthermore, temporary and permanent closures of fishing areas can occur when juvenile fish are caught in excess (Little et al., 2015) thus indirectly providing some incentive to discard undersized redfish.
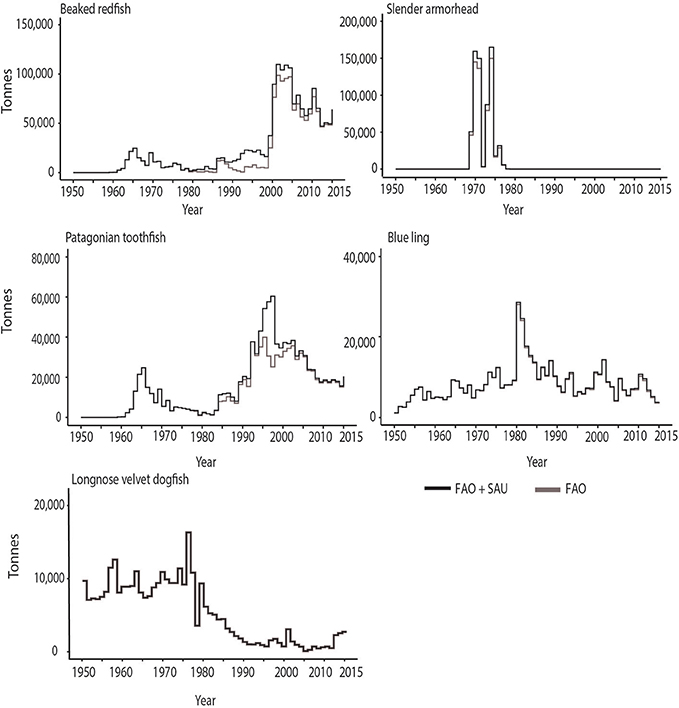
Figure 6. Catch data for some of the most captured deep-sea (>400 m) bottom-trawled species between 1950–2015, which have nearly similar reported (FAO) and estimated total (FAO + Sea Around Us) values.
Slender Armorhead
Slender armorhead (Pentaceros wheeleri Hardy, 1983), also sometimes known as Pelagic armorhead or Longfin armorhead, is a benthopelagic species of the North Pacific, typically at depths of 400–600 m. It forms spawning aggregations on the southern Emperor and northern Hawaiian Ridge seamounts (Boehlert and Sasaki, 1988). The fishery for Slender armorhead followed a classic “boom and bust” pattern, starting with its discovery by Soviet trawlers in 1967 (Humphreys et al., 1984). According to the FAO landings data, the Soviet fleet fished the area until the stock was exhausted in 1977 (Figures 2, 6). In the second year of the fishery, 145,000 t of fish were reported as landed, with a subsequent peak of 150,000 t in 1973. The catch steadily declined to 200 t in 1977. After years of no landings, fewer than 5 tons per year have been landed from these seamounts over the last decade (Table S1). Humphreys et al. (1984) also cite a series of Japanese works that show Japan having caught between 25,000 and 35,000 t of armorhead from the southern Emperor seamounts from 1970 to 1976. None of these catches are recorded in the FAO database (version 2016) or in the catch estimates reconstructed by the Sea Around Us.
Patagonian Toothfish
Patagonian toothfish (Dissostichus eleginoides Smitt, 1898), also known as Chilean seabass, is a benthopelagic species. It is widely distributed around the Southern Ocean, mostly outside the Antarctic Convergence, while its congener, Antarctic toothfish (D. mawsoni Norman, 1937) lives mostly on the Antarctic shelf and slope within the Convergence. The Patagonian toothfish is typically found between 50 and 1,500 m water depth. The toothfish fishery is both a longline and bottom trawl fishery, with the latter method becoming more common outside Antarctic waters where trawl usage is allowed. The bulk of the catch is from the FAO area in the SW Atlantic, that is, the Argentine shelf, Falkland Islands, and South Georgia, with Pacific, Southeast (Chile slope) and Indian Ocean, Antarctic (Kerguelen Plateau) not far behind. Chile, France, and Argentina, in that order, landed most of the catch. There was a ~10% difference in the 1990s between the reported and unreported estimate of total catches (Figure 6), although Collins et al. (2010) suggest that illegal, unreported, and unregulated (IUU) catches might be under-estimated by as much as 50% in some areas. The unreported landings amount to a total of 125,609 t, half of which were from the Prince Edward Islands in South-Africa. The reconstructions suggest that there were half a dozen nations under-reporting their landings. Some of these, such as Panama, are known for providing flags of convenience for other nations (Bialek, 2003). Since 1999, in response to high IUU fishing, the fishery has been managed using a Catch Documentation Scheme (CDS) by the CCAMLR, in which the fish are tracked from the point of landing and throughout the trade cycle (Bialek, 2003).
Blue Ling
Blue ling (Molva dypterygia Pennant, 1784) is a benthic, non-migratory species distributed within the NE and NW Atlantic and the western Mediterranean, typically between depths of 350–500 m. It aggregates for mating along the continental slope and on offshore banks and seamounts, which makes it vulnerable for serial depletion (ICES, 2017). Blue ling fisheries have been recorded in FAO landings data since 1950 with landings from Norway and Germany in the NE Atlantic. Faroe Islands entered the fishery in the early 1970s. Peak catches occurred in the 1980s (Figure 6), after which catches were strongly reduced, partly due to restricting catches to periods when mating aggregations were not occurring, and to management measures reducing total allowable catches in the NE Atlantic. In the NE Atlantic, two of the depleted spawning areas have remained closed since 1993 and since 2003 ICES has advised for no direct fishery and a reduction in bycatch (ICES, 2017).
Longnose Velvet Dogfish
Longnose velvet dogfish (Centroscymnus crepidater Barbosa du Bocage and de Brito Capello, 1864), also known under many other common names, such as Black shark and Deepwater dogfish in Australia, Pailona à long nez in France, and Sapata preta in Azores. This shark is benthic and widespread globally, being found on bathyal ridges and continental slopes at depths between 230 and 1,500 m, in all oceans, except the western Atlantic, central Pacific and polar waters. In the FAO database, Ireland was the only country reporting landings of this species until 2002 (Figure 2). Subsequently, France and United Kingdom entered the fishery, with France landing relatively large amounts, as high as 2,460 t in 2010. Estimated unreported landings exceed those reported to FAO by only minor amounts (Figure 6) due to some discarding of this species.
Discussion
Comparing Reported and Estimated Total Landings
This study complemented the FAO records with reconstructed unreported landings and discards from the Sea Around Us to estimate more accurate catch levels for deep-sea fisheries. The analysis reveals that overall deep-sea fisheries are likely to have captured 42% more fish than what was reported to FAO. Specifically, the period between years 1975 and 2000 was characterized by the highest catches, much of which were not reported to FAO (Figure 1). Catch data from FAO has often come under attack for being inaccurate at best, and unreliable at worst (Lobo and Jacques, 2017; Pauly and Zeller, 2017; Ye et al., 2017). It should be kept in mind, however, that FAO reports in its database only what is reported to it. For some areas of the world, at various time periods, the “official” landings reported to FAO closely parallel the best in-country records. An example of this is the NE Atlantic since the establishment of the European Union's Common Fishery Policy in 1983. Fish catches are managed through a variety of steps that begin with scientists from member countries contributing information to the ICES advisory working groups, after which total allowable catches (TACs) are designated for each species. The data ICES receives is based on each country's monitoring procedures and can reflect haul data and ship logs monitored by observers. Many countries use shipboard observers to verify catch numbers, but observer coverage is highly variable and spotty between nation, representing sometimes only 5% of the vessel trips (Auster et al., 1996; Lorance et al., 2010). The presence of the observers is known to lead to modified behavior by the fishermen, leading to better, more careful fishing and reporting (Simmons et al., 2016).
When observers are not present it is possible that catch data only reflects what was kept and landed at the dock, with fish that were discarded not being included. The unwanted fish were either not of high enough quality, not large enough, or not of interest or marketability or could not be landed due to restrictions in quotas (Zeller et al., 2017). It is improbable that deep-sea fish, once caught along with tens of thousands of other fish in a trawl net from the cold ocean, then deposited into the hold where the catch is sorted, would survive once returned to the ocean. Therefore, those dead fish should have been part of the catch levels reported, but they were not, although there are efforts now in some areas to record the discarded fish numbers (Pawlowski and Lorance, 2009). Indeed, our results indicate that one of the major discrepancies with FAO records and total estimates, arises from the high amount of discards involved in the deep-sea fisheries, totaling 6 million tons over the study period. The high amounts of discards is not unexpected, as bottom trawling is known to generate the highest discard rates in comparison to other fishing gear (Zeller et al., 2017). It is important to record this discard data, because ignoring it and using only landings data to model population dynamics, results in poor stock assessments and biased fishing patterns leading to mismanagement of deep-sea fisheries (Pawlowski and Lorance, 2009).
Another notable discrepancy between the data sets is the number of different species being caught. This difference might be expected as the FAO did not require the reporting of many of these species in the earlier time periods, but the increasing trend is also apparent in the FAO + SAU data set. This increase in species being caught, especially since the mid-1990s (Figure 4) suggests that fishing vessels no longer concentrate their efforts on only a few economically viable species. Instead, it is likely that as the most valuable fish stocks are depleted and are more heavily regulated, a broader range of species become targeted and markets developed for them.
It is evident that catch data from both FAO and the Sea Around Us, contains uncertainties. The Sea Around Us has engaged multiple teams of people in most fishing countries to try to estimate the unreported catches (Pauly and Zeller, 2016). The method of estimating can vary from country to country, so it is possible that the accuracy of the estimates will also vary according to country. In some areas, for example, the Russian Far East and Japan, estimates for the landings of some fish species were corrected as, we found, during the study, additional literature that indicated more precisely when certain fisheries began. One of the most extreme cases of unreported fish landings concerns the Longfin codling fishery, which as previously described had only minor landings in the FAO database, despite producing 100,000 t in the third year of the fisheries existence (Savin, 2013). Another case illustrating the uncertainty with both the FAO and Sea Around Us data sets, is the absence of landings for Japan's Slender armorhead fishery within the Hawaiian-Emperor seamount chain, despite records stating catches of 30,000 t (Clark et al., 2007). Despite these limitations, the FAO landings data complemented with the Sea Around Us reconstructions is the only data compilation available for estimating reported and unreported landings and discards for deep-sea fisheries.
Ecological Consequences of Deep-Sea Trawling
There are two long term consequences of the deep-sea bottom trawl fishery. Bottom trawling enables rapid exploitation of fish species and indiscriminately catches whatever fish are in the path of the trawl. It is also known to physically alter the benthic habitat (Haedrich et al., 2001) by removing or crushing habitat-forming species (Koslow et al., 2001; Williams et al., 2010; Clark et al., 2016). Merrett and Haedrich (1997) make two observations about the management of deep-sea fisheries that are still important today. First, they make the analogy of the distant-water trawler as a “roving predator” (p. 227) seeking prey throughout the world's ocean. Unfortunately, the predator has evolved far faster than the prey. The first distant-water trawler, the Fairtry, was built in the 1950s in England. It was a fully-developed floating fish factory, capable of both catching and processing fish. It became the model for vessels fishing far from ports where normally fish stored on ice would be landed. The capability of the predator to consume large numbers of fish was born, and then kept from extinction by the provision of financial subsidies, at least in some areas, to help allay the enormous costs of operating such large vessels at sea for long periods of time. Of the world's 13 biggest high seas bottom trawling nations, there is only one (New Zealand), which does not provide subsidies, suggesting that many deep-sea trawl fisheries would have ended much sooner in the absence of subsidies (Sumaila et al., 2010). In view of these developments, Merrett and Haedrich (1997) conclude that “the deep-sea fishery should not be considered a fishery at all. There is a much stronger analogy to a mining operation wherein an ore body is exploited to depletion and then new sources (mines, virgin stocks) are sought” (p. 228).
For many of the target species, recruitment and restoration of populations is a possibility if the level of exploitation is strongly reduced or eliminated, or the exploitation strategy is altered for a number of years, as was the case for Blue ling (Large et al., 2010). On the other hand, several other species have been fished to very low numbers, often in a decade or two. Patterns of depletion are apparent in the Slender armorhead fishery, where the population was reduced to a fraction of its virgin biomass in 8 years. Similarly Longfin codling estimated landings were as high as 200,000 t in 1986, and 55,000 t in 1994, and Roundnose grenadier estimated catches were greater than 60,000 t in 2001 but a rapid decline in stocks lead to a moratorium in 2006. We show that considerable fish biomass has been removed from the deep-sea, particularly in certain areas and while we do not understand the consequences of that removal yet, it is likely that the deep-sea ecosystem is being changed. For example, many of these fish species, such as the Greenland halibut, are top-predators within their habitats and removing them could cause trophic cascading as previously seen in cod fisheries (Frank et al., 2005). Others are mid-level predators and their removal may have more subtle consequences related to the removal of biomass that would otherwise recycle in the benthic ecosystem as these fish grow, reproduce and die.
The impact of trawling goes beyond the capture of fish populations since the benthic fauna gets removed from the seabed, thus comprising a large fraction of the bycatch (Probert et al., 1997; Anderson and Clark, 2003). The routine use of trawls in these fisheries results in considerable environmental modification, loss of habitat structure, and reduction of biodiversity, especially on seamounts (Clark et al., 2016). In addition, where these fisheries occur along the continental slope, re-suspended sediments can flow down-slope into deeper waters, covering organisms that would otherwise have been out of the way of the trawl (Pusceddu et al., 2014). In order to obtain 42% higher catches of deep-sea fish, it is likely that trawling has covered larger areas (even when considering that trawl fisheries often cover the same ground repetitively), resulting in unknown amounts of additional bycatch of benthic species.
Many of the largest bottom-trawled fisheries, such as Orange roughy and Slender armourhead fisheries occur also on topographic highs, such as seamounts and ridges. Their irregular topography offers a mosaic of habitats while influencing local current velocities and often delivering food particles at a slightly higher rate to fauna. These habitats are often heavily populated by suspensions feeders, such as habitat forming deep-sea corals and sponges that have been shown to be hundreds of years old, along with a variety of other species (Koslow et al., 2000; Duineveld et al., 2004; O'Hara et al., 2008; Watling et al., 2011). The deep-sea fish also take advantage of seamounts, where they often aggregate to feed, spawn and live (Clark et al., 2007). These aggregations make ideal candidates for deep-sea fisheries, resulting in deep-sea trawl fisheries targeting the summits and occasionally the sides of seamounts at depths shallower than 2,000 m (Clark et al., 2007).
All seamounts where bottom trawling occurred and that have been investigated with remotely operated vehicles (ROVs) or towed cameras show large cleared areas where communities of suspension feeders once lived (Koslow et al., 2001; Waller et al., 2007; Williams et al., 2010; Clark et al., 2016). Despite knowing that these species live for centuries, we do not know what their rate of reproduction and pattern of recruitment is, so we have no certain way of determining how long it will take for the community to recover.
Non-governmental organizations (NGOs) such as the Deep-Sea Conservation Coalition (www.savethehighseas.org/) and Bloom Association (www.bloomassociation.org/) have also argued against deep-sea bottom trawl fisheries because of the damage such fishing does to benthic communities. In Europe, these and other NGOs initiated a campaign to ban bottom trawling in deep water, culminating in legislation in 2016. The legislation is complex, but essentially bans bottom trawling in waters deeper than 800 m (European Parliament and the Council of the European Union, 2016) thus providing some protection to both bottom habitat and non-targeted deep-sea fish species.
Within this context, it is worth considering the economic importance of deep-sea fisheries. Our analysis reveals that deep-sea fisheries focusing on species caught primarily below 400 m contribute a mere ~0.5% to the total global capture fisheries (Table 2). While locally, deep-sea fisheries can be of economic importance, as for example in New Zealand, where in 2009 the Orange roughy fishery was estimated to be worth $282 million, globally their economic importance is trivial.
The Impact of Management on Deep-Sea Trawling Fisheries
Much of the reductions in catches reported, especially after 2000, are due to management measures that have been taken to reduce the possibility of species being over-fished. In some cases, such as with Blue ling, the problem of fishing on spawning aggregations was recognized and protection areas were introduced (Large et al., 2010). However, some of the NE Atlantic spawning aggregations have yet to recover and remain closed to date (ICES, 2017). In other cases, landings have been restricted as catch numbers declined e.g., for the NE Atlantic, see ICES-WGDEEP (2017) (see also Villasante et al., 2012). Sometimes these management measures might have come too late. In the NE Atlantic, for example, Roundnose grenadier landings were always much below the TAC set for them (ICES-WGDEEP, 2017, p. 374). Similarly, the allowable catch numbers for Orange roughy in the NE Atlantic have been set at zero for several years and the MSY at roughly 30% of virgin biomass in the SW Pacific (Francis and Clark, 2005). For most deep-sea fisheries, the lack of biological information combined with assumptions from shallow fisheries prevents them from being suitably regulated from the start. Combining this, with the much higher catches documented here and hence not officially accounted for, has led to regulations that might not have been strict enough to allow recovery, particularly in mixed-trawl fisheries. For fisheries, such as the Greenland halibut, concerns of depletion led to a reduction of quota which in turn caused high discards from 1992 onwards. Some nations have enforced discard bans, but Iceland among others has a record of discarding Beaked redfish, potentially because vessels are not able to acquire quota within the transferable quota system or the fish are undersized. The diversification of target species through time reveals that the indiscriminate nature of deep-sea trawling creates a market for new target species as the stocks of the previous species decline and/or become more tightly regulated.
Finally, there is the problem, of managing trawling in the high seas, that is, in areas of the ocean beyond any national jurisdiction. In 2006 an estimated 285 vessels were involved in high seas trawling, with the fisheries often occurring on isolated topographic structures, such as seamounts and ridges (Bensch et al., 2009b). Management of fisheries and habitats in these waters has been proposed through United Nations General Assembly (UNGA) Resolutions. These call for the formation of Regional Fisheries Management Organizations (RFMOs) who are responsible for setting allowable catches of species under their jurisdiction and for limiting damage to Vulnerable Marine Ecosystems (VME). The latter are defined on the basis of “indicator species” agreed to by all nations and listed in various FAO documents such as Thompson et al. (2016). As seamounts have extensive coverage of VME indicator species and are often trawled leading to high degree of environmental damage, Watling and Auster (2017) have proposed that seamounts as a whole should be considered as Vulnerable Marine Ecosystems. This would warrant seamounts a stronger set of protections as laid out by UNGA Resolutions (Bensch et al., 2009a; Rogers and Gianni, 2010) and potentially also limit or eliminate catches of seamount-associated fish species, thus limiting the associated environmental damage.
Conclusion
This study describes historical patterns in catches of deep-sea trawling fisheries since 1950–2015 by comparing and complementing the FAO landings data with reconstructed unreported landings and discards. The catches were shown to be underestimated by 42% with both unreported landings and discarding contributing equally to the discrepancy between the data sets. The major fisheries for this period include the Greenland halibut fishery in the North Atlantic, the Longfin codling in the NW Pacific and the Orange roughy in the SW Pacific. The reconstructed catches also suggest high discarding of Greenland halibut, Beaked redfish, Roundnose grenadier and the grouping Grenadiers nei. The new catch estimates suggest that much more biomass, encompassing both fish and habitat-forming species, has been removed from the deep-sea, altering this ecosystem in ways that have yet to be understood.
Author Contributions
LW and CN conceived the study. LV, LW, and MD analyzed and interpreted the data. LV prepared the figures. LV and LW prepared the animation. LV and LW drafted the text and all authors revised and approved the final version of the manuscript.
Funding
The participation in this project of LV was enabled by a grant from National Environmental Research Council in the form of a SPITFIRE Doctoral Training Partnership (grant number NE/L002531/1) with the University of Hawaii.
Conflict of Interest Statement
The authors declare that the research was conducted in the absence of any commercial or financial relationships that could be construed as a potential conflict of interest.
Acknowledgments
We would like acknowledge our many colleagues who have discussed this topic with us over the years, especially M. Gianni and D. Curry, and D. Pauly for establishing and maintaining the Sea Around Us. A. Orlov helped us understand details of the Russian fishery data for the NW Pacific. We would also like to acknowledge M. Clark and T. Morato for their help with the compilation of the deep-sea fish species list. The authors would also like to thank Sarah Popov for producing the cartograms with the Sea Around Us data. All data used within this study is available within the Supplementary Material.
Supplementary Material
The Supplementary Material for this article can be found online at: https://www.frontiersin.org/articles/10.3389/fmars.2018.00098/full#supplementary-material
References
Anderson, O. F. (2012). Fish and Invertebrate Bycatch and Discards in New Zealand Scampi Fisheries From 1990–91 Until 2009–10. Wellington: Ministry for Primary Industries.
Anderson, O. F., Ballara, S. L., and Edwards, C. T. T. (2017). Fish and Invertebrate Bycatch and Discards in New Zealand Orange Roughy and Oreo Trawl Fisheries From 2001 – 02 Until 2014 −15. Wellington: Ministry for Primary Industries.
Anderson, O. F., and Clark, M. R. (2003). Analysis of bycatch in the fishery for orange roughy, Hoplostethus atlanticus, on the South Tasman rise. Mar. Freshw. Res. 54, 643–652. doi: 10.1071/MF02163
Andrews, A. H., Tracey, D. M., and Dunn, M. R. (2009). Lead–radium dating of orange roughy (Hoplostethus atlanticus): validation of a centenarian life span. Can. J. Fish. Aquat. Sci. 66, 1130–1140. doi: 10.1139/F09-059
Atkinson, D. B. (1995). “The biology and fishery of the roundnose grenadier (Coryphenoides rupestris Gunnerus, 1765) in the North West Atlantic,” in Deep-Water Fisheries of the North Atlantic Oceanic Slope, ed A. G. Hopper (St. John's, NL: Kluwer Academic Publishers), 51–111.
Auster, P. J., Malatesta, R. J., Langton, R. W., Watling, L., Valentine, P. C., Donaldson, C. L. S., et al. (1996). The impacts of mobile fishing gear on seafloor habitats in the Gulf of Maine (Northwest Atlantic): implications for conservation of fish populations. Rev. Fish. Sci. 4, 185–202. doi: 10.1080/10641269609388584
Ballara, S., and O'Driscoll, R. L. (2015). Fish and Invertebrate Bycatch and Discards in New Zealand Hoki, Hake, or Ling Trawl Fisheries From 1990 – 91 Until 2012–13. Wellington: Ministry for Primary Industries.
Bensch, A., Gianni, M., Greboval, D., Sanders, J., and Hjort, A. (2009a). “Worldwide review of bottom fisheries in the high seas,” in FAO Fisheries and Aquaculture Technical Paper No. 522, Rev. 1. (Rome: FAO), 145.
Bensch, A., Gianni, M., Greboval, D., Sanders, J., and Hjort, A. (2009b). Worldwide Review of Bottom Fisheries in the High Seas. Available online at: http://www.fao.org/docrep/012/i1116e/i1116e00.htm
Bialek, D. (2003). Sink or swim: measures under international law for the conservation of the Patagonian toothfish in the Southern Ocean. Ocean Dev. Int. Law 34, 105–137. doi: 10.1080/00908320390209609
Boehlert, G. W., and Sasaki, T. (1988). Pelagic biogeography of the armorhead, Pseudopentaceros wheeleri, and recruitment to isolated seamounts in the North Pacific Ocean. Fish. Bull. 86, 453–465.
Bowering, W. R., and Brodie, W. (1995). “Greenland halibut (Reinhardtius hippoglossoides). A review of the dynamics of its distribution and fisheries off eastern Canada and Greenland,” in Deep-Water Fisheries of the North Atlantic Oceanic Slope, ed A. G. Hopper (St. John's, NL: Kluwer Academic Publishers), 113–160.
Branch, T. A. (2001). A review of orange roughy Hoplostethus atlanticus fisheries, estimation methods, biology and stock structure. South Afr. J. Mar. Sci. 23, 181–203. doi: 10.2989/025776101784529006
Clark, M. (1999). Fisheries for orange roughy (Hoplostethus atlanticus) on seamounts in New Zealand. Oceanol. Acta 22, 593–602. doi: 10.1016/S0399-1784(00)88950-1
Clark, M. (2001). Are deepwater fisheries sustainable? — the example of orange roughy (Hoplostethus atlanticus) in New Zealand. Fish. Res. 51, 123–135. doi: 10.1016/S0165-7836(01)00240-5
Clark, M. R. (2009). Deep sea seamount fisheries: a review of global status and future prospects. Lat. Am. J. Aquat. Res. 37, 501–512. doi: 10.3856/vol37-issue3-fulltext-17
Clark, M. R., Althaus, F., Schlacher, T. A., Williams, A., Bowden, D. A., and Rowden, A. A. (2016). The impacts of deep-sea fisheries on benthic communities: a review. ICES J. Mar. Sci. 73, i51–i69. doi: 10.1093/icesjms/fsv123
Clark, M. R., and Koslow, J. A. (2007). “Impacts of fisheries on seamounts,” in Seamounts Ecology Fisheries Conservation, eds T. J. Pitcher, T. Morato, P. J. B. Hart, M. R. Clark, N. Haggan, and R. S. Santos (Oxford: Blackwell), 413–441.
Clark, M. R., Vinnichenko, V. I., Gordon, J. D. M., Beck-Bulat, G. Z., Kukharev, N. N., and Kakora, A. F. (2007). “Large-scale distant-water trawl fisheries on seamounts,” in Seamounts Ecology Fisheries Conservation and Management. Fish and Aquatic Resources Series, eds T. J. Pitcher, T. Morato, P. J. B. Hart, M. R. Clark, N. Haggan, and R. S. Santos (Oxford: Blackwell), 361–399.
Collins, M. A., Brickle, P., Brown, J., and Belchier, M. (2010). The Patagonian Toothfish: Biology, Ecology and Fishery, 1st Edn. Stanley, ND: Elsevier Ltd.
Condie, H. M., Grant, A., and Catchpole, T. L. (2014). Incentivising selective fishing under a policy to ban discards; lessons from European and global fisheries. Mar. Policy 45, 287–292. doi: 10.1016/j.marpol.2013.09.001
Devine, J. A., Baker, K. D., and Haedrich, R. L. (2006). Fisheries: deep-sea fishes qualify as endangered. Nature 439:29. doi: 10.1038/439029a
Doonan, I. J., Fu, D., and Dunn, M. R. (2015). Harvest control rules for a sustainable orange roughy fishery. Deep. Res. Part I Oceanogr. Res. Pap. 98, 53–61. doi: 10.1016/j.dsr.2014.12.001
Drazen, J. C., and Haedrich, R. L. (2012). A continuum of life histories in deep-sea demersal fishes. Deep. Res. Part I Oceanogr. Res. Pap. 61, 34–42. doi: 10.1016/j.dsr.2011.11.002
Duineveld, G., Lavaleye, M., and Berghuis, E. (2004). Particle flux and food supply to a seamount cold-water coral community (Galicia Bank, NW Spain). Mar. Ecol. Prog. Ser. 277, 13–23. doi: 10.3354/meps277013
European Parliament and the Council of the European Union, T. (2016). Regulation (eu) 2016/2336 of the European Parliament and of the Council of 14 December 2016 Establishing Specific Conditions for Fishing for Deep-Sea Stocks in the North-East ATLANTIC and Provisions for Fishing in International Waters of the North-East At. Brussels.
FAO (2017). Fishery and Aquaculture Statistics. Global Capture Production 1950-2015 (FishstatJ). Rome: FAO.
Foley, N. S., van Rensburg, T. M., and Armstrong, C. W. (2011). The rise and fall of the Irish orange roughy fishery: an economic analysis. Mar. Policy 35, 756–763. doi: 10.1016/j.marpol.2011.01.003
Francis, R. I. C. C., and Clark, M. R. (2005). Sustainability issues for orange roughy fisheries. Bull. Mar. Sci. 76, 337–351.
Frank, K. T., Petrie, B., Choi, J. S., and Leggett, W. C. (2005). Trophic cascades in a formerly cod - dominated ecosystem. Science 308, 1621–1623. doi: 10.1126/science.1113075
Garfield, M. J. (1959). High-seas fisheries of the U.S.S.R. United States Department Inter Fish Wildlife Serv. High-Seas Fisheries Bur. Commer. Fish. Available online at: https://spo.nmfs.noaa.gov/Fishery%20Leaflets/leaflet482.pdf
Gastner, M. T., and Newman, M. E. (2004). From the cover: diffusion-based method for producing density-equalizing maps. Proc. Natl. Acad. Sci. U.S.A. 101, 7499–7504. doi: 10.1073/pnas.0400280101
Gibson, D., Uberschaer, B., Zylich, K., and Zeller, D. (2010). Preliminary Reconstruction of Total Marine Fisheries Catches for Denmark in the Kattegat, the Skagerrak and the North Sea (1950-2010) Darah. Vancouver, BC.
Haedrich, R. L., Merrett, N. R., and O'Dea, N. R. (2001). Can ecological knowledge catch up with deep-water fishing? A North Atlantic perspective. Fish. Res. 51, 113–122. doi: 10.1016/S0165-7836(01)00239-9
Honneland, G., and Nilssen, F. (2001). Quota allocation in Russia's northern fishery basin: principles and practice. Ocean Coast. Manag. 44, 471–488. doi: 10.1016/S0964-5691(01)00061-8
Horn, P. L., Tracey, D. M., and Clark, M. R. (1998). Between-area differences in age and length at first maturity of the orange roughy Hoplostethus atlanticus. Mar. Biol. 132, 187–194. doi: 10.1007/s002270050385
Humphreys, R. L., Tagami, D. T., and Seki, M. P. (1984). “Seamount fishery resources within the southern Emperor-Northern Hawaiian Ridge area,” in Proceedings of Resources Inventory NWHI (Honolulu: University of Hawaii Sea Grant Office MR-84-01), 283–327.
ICES (2016). ICES Advice on Fishing Opportunities, Catch, and Effort, Greater North Sea Ecoregion, 9.3.28 Roundnose Grenadier (Coryphaenoides rupestris) in Division 3.a (Skagerrak and Kattegat). Available online at: http://ices.dk/sites/pub/Publication%20Reports/Advice/2016/2016/rng-kask.pdf
ICES (2017). ICES Advice on Fishing Opportunities, Catch, and Effort Ecoregions in the Northeast Atlantic and Arctic Ocean ecoregions. Copenhagen: ICES.
ICES-WGDEEP. (2017). Report of the Working Group on the Biology and Assessment of Deep-sea Fisheries Resources (WGDEEP). Copenhagen: ICES-WGDEEP.
Jovanović, B., Divovich, E., Harper, S., Zeller, D., and Pauly, D. (2008). “Preliminary estimate of total Russian fisheries catches in the Barents Sea Region (ICES Subarea I) between 1950 and 2010,” in Fisheries Centre Working Paper Series #2015 - 59 (Vancouver, BC: University of British Columbia), 16.
Koslow, J. A., Boehlert, G. W., Gordon, J. D., Haedrich, R. L., Lorance, P., and Parin, N. (2000). Continental slope and deep-sea fisheries: implications for a fragile ecosystem. ICES J. Mar. Sci. 57, 548–557. doi: 10.1006/jmsc.2000.0722
Koslow, J., Gowlett-Holmes, K., Lowry, J., O'Hara, T., Poore, G., and Williams, A. (2001). Seamount benthic macrofauna off southern Tasmania: community structure and impacts of trawling. Mar. Ecol. Prog. Ser. 213, 111–125. doi: 10.3354/meps213111
Lack, M., Short, K., and Willock, A. (2003). Managing Risk and Uncertainty in Deep-Sea Fisheries: Lessons From Orange Roughy. TRAFFIC Oceania and WWF Australia.
Large, P. A., Diez, G., Drewery, J., Laurans, M., Pilling, G. M., Reid, D. G., et al. (2010). Spatial and temporal distribution of spawning aggregations of blue ling (Molva dypterygia) west and northwest of the British Isles. ICES J. Mar. Sci. 67, 494–501. doi: 10.1093/icesjms/fsp264
Little, A. S., Needle, C. L., Hilborn, R., Holland, D. S., and Marshall, C. T. (2015). Real-time spatial management approaches to reduce bycatch and discards: experiences from Europe and the United States. Fish Fish. 16, 576–602. doi: 10.1111/faf.12080
Lobo, R., and Jacques, P. J. (2017). SOFIA'S choices: discourses, values, and norms of the World Ocean Regime. Mar. Policy 78, 26–33. doi: 10.1016/j.marpol.2016.12.023
Lorance, P., Pawlowski, L., and Trenkel, V. M. (2010). Standarizing blue ling landigs per unit effort from industry haul-by-haul data using generalized additive model. ICES J. Mar. Sci. 67, 1650–1658. doi: 10.1093/icesjms/fsq048
Lutz, M., Dunbar, R., and Caldeira, K. (2002). Regional variability in the vertical flux of particulate organic carbon in the ocean interior. Global Biogeochem. Cycles 16, 11–1-11–18. doi: 10.1029/2000GB001383
Mace, P. M., Fenaughty, J. M., Coburn, R. P., and Doonan, I. J. (1990). Growth and productivity of orange roughy (Hoplostethus atlanticus) on the north chatham rise. New Zeal. J. Mar. Freshw. Res. 24, 105–119. doi: 10.1080/00288330.1990.9516406
Merrett, N. R., and Haedrich, R. L. (1997). Deep-Sea Demersal Fish and Fisheries. London: Chapman & Hall.
Moffat, C., Angot, V., Astudillo, A., Bailey, N., Benediktsdottir Brynhildur Brown, A., Emmerson, R., et al. (2009). Assessment of the Environmental Impact of Fishing Monitoring and Assessment Series. Available online at: https://qsr2010.ospar.org/media/assessments/p00465_JAMP_QSR_fisheries_assessment.pdf
Morato, T., and Clark, M. R. (2007). Seamount fishes: ecology and life histories. Seamounts Ecol. Fish. Conserv. 12, 170–188. doi: 10.1002/9780470691953.ch9
Nakken, O. (1998). Past, present and future exploitation and management of marine resources in the Barents Sea and adjacent areas. Fish. Res. 37, 23–35. doi: 10.1016/S0165-7836(98)00124-6
Nedreaas, K., and Smirnov, O. (2004). Stock Characteristics, Fisheries and Management of Greenland Halibut (Reinhardtius Hippoglossoides Walbaum) in the Northeast ARCTIC. Available online at: http://hdl.handle.net/11250/106709
O'Hara, T. D., Rowden, A. A., and Williams, A. (2008). Cold-water coral habitats on seamounts: do they have a specialist fauna? Divers. Distrib. 14, 925–934. doi: 10.1111/j.1472-4642.2008.00495.x
Pauly, D., and Zeller, D. (2016). Global Atlas of Marine Fisheries: A Critical Appraisal of Catches and Ecosystem Impacts. Washington, DC: Island Press.
Pauly, D., and Zeller, D. (2017). The best catch data that can possibly be? Rejoinder to Ye et al. “FAO's statistic data and sustainability of fisheries and aquaculture.” Mar. Policy 81, 406–410. doi: 10.1016/j.marpol.2017.03.013
Pawlowski, L., and Lorance, P. (2009). Effect of discards on roundnose grenadier stock assessment in the Northeast Atlantic. Aquat. Living Resour. 22, 573–582. doi: 10.1051/alr/2009040
Priede, I. G. (2017). Deep-Sea Fishes: Biology, Diversity, Ecology and Fisheries. Cambridge: Cambridge University Press.
Probert, P. K., McKnight, D. G., and Grove, S. L. (1997). Benthic invertebrate bycatch from a deep-water trawl fishery, Chatham Rise, New Zealand. Aquat. Conserv. Mar. Freshw. Ecosyst. 7, 27–40.
Pusceddu, A., Bianchelli, S., Martín, J., Puig, P., Palanques, A., and Masqué, P. (2014). Chronic and intensive bottom trawling impairs deep-sea biodiversity and ecosystem functioning. Proc. Natl. Acad. Sci. U.S.A. 111, 8861–8866. doi: 10.1073/pnas.1405454111
R Core Team (2016). R: A Language and Environment for Statistical Computing. Available online at: https://www.r-project.org
Roberts, C. M. (2002). Deep impact: the rising tool of fishing in the deep sea. Trends Ecol. Evol. 17, 242–246. doi: 10.1016/S0169-5347(02)02492-8
Rogers, A. D., and Gianni, M. (2010). The Implementation of UNGA Resolutions 61/105 and 64/72 in the Management of Deep-Sea Fisheries on the High Seas. Dscc, 97. Available online at: http://www.savethehighseas.org/publicdocs/61105-Implemention-ExecSummary.pdf
Savin, A. B. (2013). Pасчёт запасов лемонемы лемонемы (Laemonema Longipes, Moridae) северо-западной части Тихого океана методами хеева и по значению улавливаемости(Calculation of the stock in laemonemes (Laemonema longipes, Moridae) of the North-West part of the Pacific: The Известия Тинро. Proc. TINRO 175, 56–68. (In Russian).
Schlacher, T. A., Baco, A. R., Rowden, A. A., O'Hara, T. D., Clark, M. R., Kelley, C., et al. (2014). Seamount benthos in a cobalt-rich crust region of the central Pacific: Conservation challenges for future seabed mining. Divers. Distrib. 20, 491–502. doi: 10.1111/ddi.12142
Shotton, R. (2016). Global Review of Alfonsino (Beryx spp.), Their Fisheries, Biology and Management. Rome: FAO.
Simmons, G., Bremner, G., Whittaker, H., Clarke, P., Teh, L., Zylich, K., et al. (2016). Reconstruction of Marine Fisheries Catches for New Zealand. Vancouver, BC: Institute for the Oceans and Fisheries, The University of British Columbia.
Sumaila, U. R., Khan, A., Teh, L., Watson, R., Tyedmers, P., and Pauly, D. (2010). Subsidies to high seas bottom trawl fleets and the sustainability of deep-sea demersal fish stocks. Mar. Policy 34, 495–497. doi: 10.1016/j.marpol.2009.10.004
Thompson, A., Sanders, J., Tandstad, M., Carocci, F., and Fuller, J. (2016). Vulnerable Marine Ecosystems: Processes and Practices in the High Seas. Rome: FAO.
Tuponogov, V. N., Orlov, A. M., and Kolodov, L. S. (2008). “The most abundant grenadiers of the russian far east EEZ: distribution and basic biological patterns,” in Grenadiers of the World Oceans Biology Stock Assessment and Fisheries (Vladivostok), 285–318.
Villasante, S., Morato, T., Rodriguez-Gonzalez, D., Antelo, M., Österblom, H., Watling, L., et al. (2012). Sustainability of deep-sea fish species under the European Union Common Fisheries Policy. Ocean Coast. Manag. 70, 31–37. doi: 10.1016/j.ocecoaman.2012.07.033
Waller, R., Watling, L., Auster, P., and Shank, T. (2007). Anthropogenic impacts on the Corner Rise seamounts, north-west Atlantic Ocean. J. Mar. Biol. Ass. UK 87, 1075–1076. doi: 10.1017/S0025315407057785
Watling, L., and Auster, P. J. (2017). Seamounts on the high seas should be managed as vulnerable marine ecosystems. Front. Mar. Sci. 4:14. doi: 10.3389/fmars.2017.00014
Watling, L., France, S. C., Pante, E., and Simpson, A. (2011). Biology of deep-water octocorals. Adv. Mar. Biol. 60, 41–122. doi: 10.1016/B978-0-12-385529-9.00002-0
Watling, L., Guinotte, J., Clark, M. R., and Smith, C. R. (2013). A proposed biogeography of the deep ocean floor. Prog. Oceanogr. 111, 91–112. doi: 10.1016/j.pocean.2012.11.003
Williams, A., Schlacher, T. A., Rowden, A. A., Althaus, F., Clark, M. R., Bowden, D. A., et al. (2010). Seamount megabenthic assemblages fail to recover from trawling impacts. Mar. Ecol. 31, 183–199. doi: 10.1111/j.1439-0485.2010.00385.x
Ye, Y., Barange, M., Beveridge, M., Garibaldi, L., Gutierrez, N., Anganuzzi, A., et al. (2017). FAO's statistic data and sustainability of fisheries and aquaculture: Comments on Pauly and Zeller (2017). Mar. Policy 81, 401–405. doi: 10.1016/j.marpol.2017.03.012
Yokota, M., and Kawasaki, T. (1990). Population biology of the forked hake, Laemonema longipes (Schmidt), off the Eastern Coast of Honshu, Japan. Tohoku J. Agric. Res. 40, 65–80.
Zeller, D., Booth, S., Davis, G., and Pauly, D. (2007). Re-estimation of small-scale fishery catches for U.S. flag-associated island areas in the western Pacific: the last 50 years. Fish. Bull. 105, 266–277.
Keywords: deep-sea fisheries, deep-sea, fisheries management, global fisheries, bottom-trawling, habitat destruction, environmental impact
Citation: Victorero L, Watling L, Deng Palomares ML and Nouvian C (2018) Out of Sight, But Within Reach: A Global History of Bottom-Trawled Deep-Sea Fisheries From >400 m Depth. Front. Mar. Sci. 5:98. doi: 10.3389/fmars.2018.00098
Received: 27 October 2017; Accepted: 09 March 2018;
Published: 11 April 2018.
Edited by:
Jeroen Ingels, Florida State University, United StatesReviewed by:
Christopher Kim Pham, University of the Azores, PortugalXiaoshou Liu, Ocean University of China, China
Malcolm Ross Clark, National Institute of Water and Atmospheric Research (NIWA), New Zealand
Copyright © 2018 Victorero, Watling, Deng Palomares and Nouvian. This is an open-access article distributed under the terms of the Creative Commons Attribution License (CC BY). The use, distribution or reproduction in other forums is permitted, provided the original author(s) and the copyright owner are credited and that the original publication in this journal is cited, in accordance with accepted academic practice. No use, distribution or reproduction is permitted which does not comply with these terms.
*Correspondence: Lissette Victorero, lissette1901@hotmail.com