Method for Determining the Contribution of Fluorescence to an Optical Signature, with Implications for Postulating a Visual Function
 Charles Mazel
- NIGHTSEA, Lexington, MA, United States
The fluorescence of many marine organisms is a visually compelling phenomenon. Descriptions of the phenomenon have at times been accompanied by suggestions of a visual function, but with minimal supporting evidence. It is possible to make quantitative estimates of the contribution of fluorescence emission to a visual signal under arbitrary illumination conditions. This analysis can help in deciding whether further research into a visual function is warranted, or whether the fluorescence is an interesting epiphenomenon associated with biomaterials that are present for other purposes. This paper describes the concepts associated with visual signals consisting of both reflected and fluoresced light, and methods for determining the underlying optical properties and using that information to model visual signal under environmentally relevant illumination conditions.
Introduction
The fluorescence of many marine organisms is a visually compelling phenomenon. It is typically discovered and documented by illuminating the subject with an intense light source of appropriate wavelength and viewing it through a complementary barrier filter that blocks the reflected excitation light and transmits the fluorescence. The emitted colors are highly saturated and create a strikingly beautiful effect. There tends to be strong contrast against the background, especially since the exploration is generally done in darkness. It is natural to ask “Why does that happen?” This question can be interpreted either mechanistically (What is the physical source of the fluorescence?) or functionally (What, if any, is the purpose of the fluorescence?).
The equipment for locating and documenting fluorescence in situ or in vivo has become readily available in recent years, leading to an explosion of observations that in turn have led to an increase in scientific research. Much of this has focused on origin and possible ecophysiological roles of the fluorescing proteins in reef corals (Salih et al., 2000; Kelmanson and Matz, 2003; Ugalde et al., 2004; Bou-Abdallah et al., 2006; Palmer et al., 2009; Gittins et al., 2015; Smith et al., 2017), but some studies have touched on possible visual functions in fish and other marine organisms (Mazel et al., 2004; Haddock et al., 2005; Matz et al., 2006; Michiels et al., 2008; Gerlach et al., 2014; Sparks et al., 2014; Haddock and Dunn, 2015; Gruber et al., 2016). A few of these latter have had a strong foundation in measurement and analysis, while others have been more speculative and suggestive, based purely on observation and correlation.
When we view and photograph fluorescence in situ or in the laboratory we are almost always doing so under highly artificial conditions-in the dark, armed with an intense narrow-band excitation light source and an efficient barrier filter that rejects reflected light and isolates the fluorescence. Observations made in this way do not in themselves tell you anything about how the fluorescence might contribute to the appearance of the organism under natural environmental lighting conditions. And while it is always valid to ask “Why?” in the functional sense, there is no reason to presuppose a visual function. The existence of any characteristic in an organism is not a priori evidence of a functional role for that characteristic. It may simply be an epiphenomenon present in materials evolved for other purposes. For example, human teeth fluoresce quite strongly when excited and viewed under identical conditions to those used with marine organisms (Figure 1), but this emission is not noticeable under natural conditions and no one has yet suggested that this might be functional.

Figure 1. Fluorescence photograph of human teeth. Photograph made using the same methods as generally used for fluorescence images of marine organisms.
This paper describes a method for collecting and analyzing the data needed to investigate one of the criteria that must be satisfied to demonstrate a visual function for fluorescence—that the fluorescence is sufficiently intense to make a meaningful contribution to the optical signature under realistic illumination conditions. After describing the basis we go through the method with a test case for a fluorescent shark.
Background
The criteria to demonstrate a visual function for fluorescence are listed below. Note that there can be alternative ways of formulating these, but they will all include the same basic elements.
1. Fluorescence exists when the subject is illuminated at wavelengths that are naturally present in its habitat.
2. The organism for which a viewing function is postulated is physiologically capable of perceiving the wavelengths of the fluorescence emission.
3. There is enough energy transferred into the fluorescence band to make a meaningful contribution to the visual signal under relevant illumination conditions.
4. The viewing organism's behavior is influenced by the presence vs. absence of fluorescence in the subject.
Demonstrating #1 is straightforward. As noted above, the technology to explore for and document fluorescence is robust and readily available commercially. The excitation wavelengths most commonly used for exploration are typically in the mid-blue portion of the spectrum (~440–460 nm), a range that is transmitted well in seawater, is generally available in the environment, and has proved to be effective in exciting fluorescence in a wide range of organisms. There is, however, no “ideal” wavelength range for exciting all instances of fluorescence, and there is a potential for other naturally available wavelengths to be involved.
Demonstrating #2 takes more specialized equipment, but the requirements and techniques are known. You need to show that the fluorescence can reach the light-sensing cells and be absorbed by the visual pigments. The latter is typically determined by microspectrophotometry on receptor cells (e.g., Hanaoka and Fujimoto, 1957; Chung and Marshall, 2016). Incident light can also be affected by intraocular filters before it reaches the retina (Heinermann, 1983; Douglas and Marshall, 1999). The absorption properties of such filters can be measured with a spectrometer. Lens filters can potentially act as barrier filters to enhance the fluorescence relative to reflected light but could also block fluorescence wavelengths.
Demonstrating #3 requires specialized equipment and data analysis, and one methodological approach to this is the focus of this paper.
Demonstrating #4 is perhaps hardest of all. It can be extremely difficult to set up experimental conditions that eliminate the fluorescence while not affecting other visual factors at the same time but this has been done for several cases (Arnold et al., 2002; Gerlach et al., 2014; Haddock and Dunn, 2015).
There have been peer-reviewed publications that have strongly suggested, or even claimed, demonstration of a visual function based simply on criteria 1, or 1 and 2, combined with a hypothesis (untested) about the role the fluorescence might play in the organism's life (Sparks et al., 2014; Gruber et al., 2016). This is not sufficient. Considering the fluorescence of human teeth, the fluorescence certainly exists (#1), and humans certainly have the ability to see the emitted wavelengths (#2), but that does not mean that there is enough energy in the fluorescence to make a noticeable difference in appearance under natural lighting conditions (#3) nor is there any evidence to suggest that it influences our behavior (#4).
Before delving into the measurements needed to evaluate #3 it is worth thinking about what is involved in fluorescence constituting a meaningful visual signal. To be meaningful the fluorescence would have to make a material contribution to the organism's appearance in a way that is involved in behavior. This generally means that it either increases contrast against the viewing background such that the organism can be seen more easily (mating attraction, warning or threat displays, lures to attract prey, etc.) or reduces that contrast so that it can be seen less easily (camouflage to reduce the chance of being preyed upon, or to increase the chance of prey capture).
It has been noted (Lythgoe, 1979; Johnsen, 2011) that fluorescence has a greater potential to play a role in visual function in the marine than in the terrestrial environment. This is because the world above water is generally awash in broadband illumination (white light) and it is more of a challenge for fluorescence, which tends to be a relatively weak effect, to enhance coloration relative to simple reflectance. Water, by contrast, is an optical filter, selectively removing wavelengths of visible light exponentially as a function of depth. First to be absorbed are the long wavelength reds, then the oranges, then the yellows. Next are either the greens or the blues, depending on the water type. In clear tropical waters blue light penetrates the furthest, while in temperate coastal waters that contain high loads of blue-absorbing colored dissolved organic matter (CDOM) the water color tends more toward the green (Mobley, 1994).
Because fluorescence is a transformation of energy from one wavelength to another it is potentially a means of producing colors that would not otherwise be present in this spectrally limited environment. Moving energy from wavelengths that are naturally present to wavelengths that are not has the greatest potential to create visual contrast. Oranges and reds are a great “choice” for fluorescence contrast in the sea since those wavelengths are effectively not present in downwelling light once one reaches a depth of ~20 m, even in clear tropical waters. The coral that appears distinctly orange in the photograph on the left in Figure 2 attracted a diver's attention since it was encountered at a depth at which there is effectively no orange light and it stood out in strong contrast with the washed-out blue of its surroundings. This image was made with ambient light alone. When photographed again with an electronic flash (right) the coral is not particularly distinctive. Note that the coral must still be fluorescing in that image, and even more so than in the image on the left, since it is being illuminated by the same ambient light plus the light from the electronic flash. The orange fluorescence is completely overwhelmed by the reflected light from the flash.
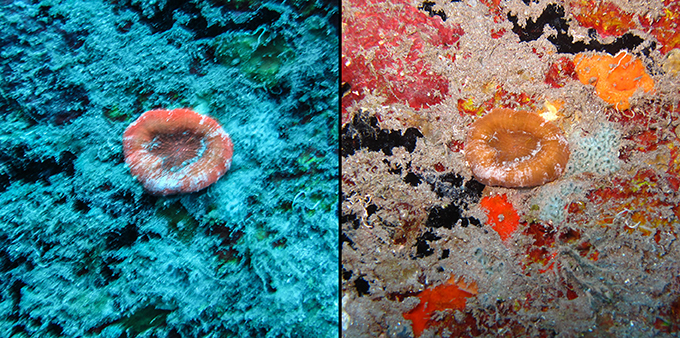
Figure 2. Coral (Scolymia sp.) at a depth of ~20 m photographed with ambient light (left) shows distinct natural fluorescence compared to image made with electronic flash (right), Saba, Lesser Antilles. Images © Conrad Blickenstorfer.
The most commonly encountered fluorescence color, both in corals and fish, is green. Transferring energy from the blue to the green has less potential to create contrast since green light generally travels quite well in water, so it is “available” to be reflected, and the fluorescence must be intense if it is to have an enhancement effect. There are many corals that appear quite intensely green under blue light excitation in the dark but that give no hint of that color under daylight illumination. There are others, however, in which the fluorescence energy transfer is great enough that the green fluorescence is evident (at least to a human) even in relatively shallow water. We can call the first type “covert fluorescence” in the sense that the fluorescence is present but not obviously visible, while in the latter case we can call it “overt fluorescence.” Examples of both types often coexist in the same habitat, so they are exposed to exactly the same downwelling light. The difference is in the efficiency of the fluorescence.
Diver observation like this (overt vs. covert) might give a hint of fluorescence contribution, but in the end the issue of factor #3–whether the process of fluorescence is contributing enough photons to feasibly make a contribution to appearance–must be considered from the point of view of whatever organism is hypothesized to view the fluorescence. What is covert to a human might be overt to another organism, possibly only at certain times of day or depth. It is possible to make quantitative measurements that enable modeling of the light leaving the surface of a fluorescing organism, including both the reflected and fluoresced components.
Optical Signature
The light leaving a fluorescing organism under any illumination condition will be a combination of two components—ambient light that has been reflected from the surface of the organism, without a change of wavelength, and light that has been absorbed and then re-emitted in a different wavelength band by the fluorescence. The totality of light leaving the surface is termed the exitance. It is possible, and indeed desirable, to make direct measurements of the exitance either in situ or in vivo under realistic lighting conditions. However, it is generally not practical to make those measurements under what is likely to be the very wide range of possible ambient lighting conditions that the subject might be exposed to through the course of the day and year, and as a function of depth, cloud cover, and other variables.
In this paper we outline the information needed to compute the exitance under arbitrary illumination conditions, and methods to collect the necessary data. In addition to providing the overall spectral signature, the results can also be used to calculate the extent to which fluorescence enhances the signal relative to the same system without fluorescence. The principles and methods are then illustrated with a case study of fluorescence in a shark. The methods to be described were originally developed to model the contribution of fluorescence to the perceived color of corals (Mazel and Fuchs, 2003), but can be applied to any subject.
Methods
We describe here a method for calculating the light that leaves a fluorescing surface under any illumination conditions. This is not the only possible way to do this, but it has been successfully applied to the analysis of fluorescing marine organisms (Mazel and Fuchs, 2003; Mazel et al., 2004). Alternative approaches are described, for example, in the analyses of the contribution of fluorescence to the appearance of flowers (Iriel and Lagorio, 2010), a frog (Taboada et al., 2017), and a red-fluorescent fish (Bitton et al., 2017).
The light leaving the surface is the exitance, which we will designate as E. This and other quantities to be discussed here, unless otherwise noted, vary with wavelength and are designated in the form E(λ). Exitance can be in energy or photon flux units, and for this discussion we will assume the latter.
The total exitance at any wavelength consists of photons produced by reflection without a change of wavelength, R, and photons resulting from fluorescence, F.
The reflected component is the product of the incident light, I0, and the true reflectance, RT, again on a wavelength by wavelength basis (Equation 2). Reflectance is a non-dimensional quantity designating the fraction of photons reflected at each wavelength. Measurement of reflectance from a fluorescing surface is complicated by the presence of both reflected and fluoresced photons, the exact question that we are addressing here. The “true reflectance” refers only to the reflected component.
The fluoresced photons will have a spectral distribution that corresponds to the shape of the emission spectrum, which we will designate by M(λ). When fluorescence arises from a single entity, such as a particular fluorescent protein in a coral, the spectral distribution of the emitted light is independent of the excitation wavelength. The processes of absorption and fluorescence are decoupled at the level of atomic transitions, with the result that at the time that the emission occurs the molecule does not “know” what wavelength produced the excited state. This is not the case when the fluorescence arises from a complex mixture of substances, such as CDOM (colored dissolved organic matter), but measurements of excitation/emission spectra for corals and fish so far indicate that this condition applies.
The emission spectrum is typically normalized to some value such as 1 or 100. The actual fluoresced component, F(λ), will have the same spectral distribution (shape) as the normalized emission spectrum, but we need to determine the magnitude of this spectrum. There will be some constant scaling factor S (not spectral) that we can apply to the prototype emission spectrum to convert it into photon flux units (Equation 3).
This factor S will be determined by how much useful light is available to excite the fluorescence, combined with the efficiency of conversion of incident energy to fluorescence. “Useful light” must be distinguished from the total incident light since not all wavelengths have the same potential to result in fluorescence. The relative ability of different wavelengths of light to excite fluorescence is described by the excitation spectrum, designated here by X(λ). Like the emission spectrum M this is typically normalized to some value. We can scale the incident light spectrum I0 by the excitation spectrum X to find the spectrum of “useful” incident light, U.
The greater the fraction of this useful incident light is re-emitted as fluorescence, the stronger the fluoresced component of exitance will be. The conventional quantity for describing fluorescence efficiency is the “quantum yield,” defined as the number of photons fluoresced divided by the number of photons absorbed. The measurement is typically done with isolated, extracted pigment. The process of extraction has the potential to alter the fluorescence properties, however, and in the real world in which the fluorescing organism exists the incident light will be striking a complex surface that may have multiple layers and closely situated molecules, not all of which are fluorescing. In the case of corals, for example, there are factors such as mucus layers, bacteria, symbiotic algae, and more involved. There is no way of knowing what portion of the incident light is being absorbed by the fluorescent substance and how much by other molecular entities. Fortunately, knowing this is not necessary. We are concerned with what is happening under real-world conditions, and for our prior work with corals (Mazel and Fuchs, 2003) we developed the concept of “practical fluorescence efficiency.” This is defined as the number of photons fluoresced divided by the number of photons available to be absorbed. This treats the organism as a “black box” and provides a useful means to make measurements and predictions based on intact organisms with all their associated complexity. We will designate the practical fluorescence efficiency here by ΦP. The method to determine it will be described below. With this methodology the total photons fluoresced will be the total photons available to be fluoresced times ΦP. The “total photons available to be fluoresced” is the integral of the potentially useful photons U.
Substituting from Equation (3) and rearranging, we have,
And we can find S as
So finally we have
where S is calculated for each case from Equation (7).
With the exitance spectrum and its components the change in the available optical signature due to fluorescence can be visualized, and the fractional contribution of fluorescence to the signal in any wavelength band can be computed.
To perform the modeling using the methodology described above we need five pieces of information:
◦ I0 - Incident (ambient) light spectrum
◦ RT - True reflectance spectrum
◦ X - Fluorescence excitation spectrum
◦ M - Fluorescence emission spectrum
◦ ΦP - Practical fluorescence efficiency
Note that other than I0, all of these quantities are inherent optical properties of the organism that only need to be determined once. All of the other quantities needed can be calculated from these for each case.
We will now describe how each of these pieces of information can be obtained. After that we will illustrate the procedure by going step by step through a recent exercise to determine the potential for fluorescence to contribute to the appearance of the chain catshark (Scyliorhinus retifer).
I0 – Incident Light Spectrum
The incident light used for modeling should be relevant to the organism's natural illumination conditions. If the fluorescence is postulated to have a visual function under particular constraints, such as depth or time of day, the spectrum should be appropriate to those conditions. Data may be measured in situ with an underwater spectrometer, or may be modeled with a radiance modeling program such as Hydrolight (Sequoia Scientific, Seattle, WA).
RT – True Reflectance Spectrum
Reflectance is a non-dimensional quantity specifying the fraction of incident light that is reflected at an interface. There is no change of wavelength in this process. If a surface is not fluorescent then the observable optical signal consists entirely of reflected light. The reflectance of a surface can also be a function of the angle of incidence of the light reaching the surface. For purposes of this discussion we assume that light is diffusely reflected, neglecting angular dependencies. While this may not be true of any given surface, it is not likely to affect the results significantly and there is no need to over-complicate the problem when primarily trying to sort out the potential contribution of fluorescence to the signal.
Reflectance is typically measured by providing broadband illumination (full visible spectrum) and making successive measurements of the light reflected from the subject of interest and from a diffusely reflecting reference surface with known reflectance properties, such as Spectralon™ (Labsphere, Sutton, NH). The reflectance is computed as the light reflected by the sample divided by the light reflected by the reference surface as a function of wavelength, after correcting for the reflectance of the reference surface itself. For a fluorescing surface this procedure is complicated by the fact that the broadband illumination source will itself excite fluorescence and the “reflected” light will include a fluorescence component. There is a measurement procedure for separating the reflected and fluoresced components of the light (Fuchs, 2001), but it is also possible to make the correction using the efficiency data, since the determination of efficiency (described below) does not require knowledge of the “true” reflectance.
X – Fluorescence Excitation Spectrum
As described above, the excitation spectrum is a measurement of the relative ability of different incident wavelengths to produce fluorescence. Measurement of the excitation spectrum requires specialized instrumentation, typically a laboratory spectrofluorometer. This instrument incorporates a means to illuminate the subject with a very narrow range of wavelengths (typically a few nanometers bandwidth) at a time, and scan that illumination through a defined wavelength range. At each excitation wavelength the intensity of the emission at a fixed wavelength is recorded, with corrections applied to account for variations in the excitation light source intensity as a function of wavelength. The result is a graph of the intensity of emitted light as a function of incident wavelength. As with the emission spectrum it is typically presented normalized to a maximum of 1 (or 100, as preferred).
M – Fluorescence Emission Spectrum
The emission spectrum is a measure of the distribution of emitted light as a function of wavelength. This can be measured with the same spectrofluorometer used to measure the excitation, this time fixing the excitation wavelength and recording the emission either with a scanning monochromator or by collecting the full spectrum at once with an array detector. The data must be corrected for the spectral sensitivity of the detector system as a function of wavelength. Such correction factors are often included with the instrument but can also be determined by measuring the output of a light source with known spectrum.
The emission spectrum can also be measured with a much simpler spectrometer. There are many small diode array spectrometers available on the market (e.g., Ocean Optics, Dunedin, FL). Excite the subject with a light source that emits in a wavelength range that produces reasonably strong fluorescence but does not overlap with the emission spectrum. A barrier filter can be used to prevent the excitation light from reaching the spectrometer, but it is usually possible to see the two separate wavelength bands simultaneously in the spectrometer readout.
ΦP – Practical Fluorescence Efficiency
To find the practical fluorescence efficiency ΦP we need three pieces of information, all of which can be measured:
◦ Incident light spectrum, I0 – controlled as described below
◦ Light leaving the surface
◦ Fluorescence excitation spectrum, X
Note that for this ΦP determination the incident light spectrum is not an arbitrary illumination I0. In this case it must be a light source that excites the fluorescence but does not overlap with the fluorescence emission. This is important, as otherwise it would be difficult to sort out what portion of the light in the emission band results from fluorescence and what portion from reflectance. Isolating the excitation and the emission for this measurement removes that difficulty.
We define the practical fluorescence efficiency ΦP as the number of photons fluoresced, NF, divided by the number of photons available to be absorbed, NA.
The number of photons available to be absorbed is the integral of the “useful” spectrum, the incident light spectrum scaled by the excitation spectrum,
while the number of photons fluoresced is found from a direct measurement of fluorescence emitted from the surface,
The procedure is as follows:
• Measurements
◦ Measure the incident spectral intensity (IO) produced by the excitation source. Direct the source at a non-fluorescent reference surface with known reflectance characteristics and direct the spectrometer fiber at that surface. This surface must either have uniform reflectance across the spectrum, or the actual reflectance spectrum must be accounted for. Position the light source and detector to avoid specular reflection.
◦ Measure the fluorescence (F) leaving the surface of the specimen. The surface should be positioned in the same relationship (distance and angle) to the light source and detector as the reference surface. There will be two peaks in the measured spectrum—one from reflected excitation light and the other from the fluorescence. For this efficiency measurement we are only concerned with the fluorescence portion. If the light leaving the surface is much weaker than that reflected from the reference surface it may be necessary to set the spectrometer to a longer integration time to acquire a useful signal, allowing the reflected portion of the signal to saturate. If so, this difference in integration time will have to be accounted for in the calculations that follow.
• Calculations
◦ Apply any spectrometer spectral correction factors to both of the measured spectra (reference surface and sample) and normalize them to the same integration time if different times were used.
◦ Account for the fact that not all of the incident wavelengths are as effective as others at exciting the fluorescence, as described by the excitation spectrum. Multiply the incident light spectrum by the normalized excitation spectrum at each wavelength, as in Equation (4). If the instruments used to collect the spectra do not provide data at the same wavelength intervals it will be necessary to interpolate data so that they match (typically to 1 nm intervals).
◦ If the spectrometers are calibrated in energy flux (intensity) units, as is often the case, convert both spectra to relative photon units by multiplying by wavelength.
◦ Integrate over the entire wavelength range in which there is measurable excitation or emitted light energy to compute the total number of photons contained in the incident light and the fluorescence spectra (Equations 10 and 11). The result for the incident light spectrum is the total number of photons available to be absorbed, NA, and for the emitted light spectrum the total of numbers fluoresced, NF.
◦ Take the ratio of the above numbers, NF/NA to find ΦP.
Sample Case
Example data dealing with all of the above can be found in the paper on the contribution of fluorescence to the perceived color of corals (Mazel and Fuchs, 2003) and example results of this kind of analysis can be found in the paper on the potential visual function of fluorescence in a stomatopod (mantis shrimp) (Mazel et al., 2004). Presented here is a data set recently collected to explore the potential significance of fluorescence in the chain catshark, Scyliorhinus rotifer. This was one of the two species that was discussed in a recent publication (Gruber et al., 2016) that argued strongly for a visual function. The data in that paper only demonstrated criteria 1 and 2 as outlined above—that fluorescence exists and that the shark visual system has the potential to respond to the fluorescence wavelengths. Here we address criterion #3, whether there is a significant amount of energy transferred into the fluorescence band.
Access to live specimens and a room that could be darkened was provided by the Seacoast Science Center (Rye, NH). For the measurements the sharks were kept in small plastic tubs of seawater lined with a black cloth to minimize stray light effects.
At a qualitative level these specimens appeared the same as those shown in Figure 5 of Gruber et al. (2016). The lower image of Figure 3 was made with broadband white light illumination while the top image was made with blue light excitation (Sola NIGHTSEA, Light and Motion, Marina, CA) and a Yellow #12 filter (Tiffen, Hauppauge, NY) to block the reflectance and reveal the fluorescence.
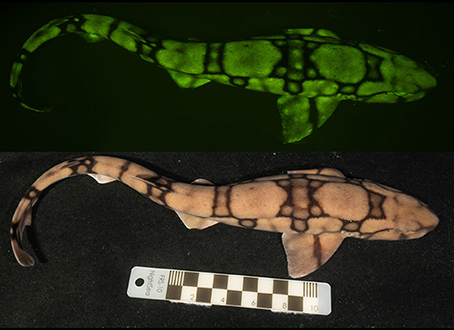
Figure 3. Photographs of a chain catshark under white light illumination (bottom) and fluorescing (top) under blue light illumination imaged through a yellow longpass filter. Scale in cm.
It can be seen in Figure 3 that areas of different shades of brown/beige in the white light image correspond to areas of different fluorescence intensity in the fluorescence image. The measurements described here were made from the lighter (higher reflectance) areas, which also exhibited the brighter fluorescence.
Fluorescence excitation and emission spectra were measured from two specimens with a Fluoromax 2 spectrofluorometer (SPEX Industries, Edison, NJ) fitted with a bifurcated fiber optic probe. The common end of the fiber was held with a laboratory clamp to maintain a fixed position relative to the shark. Figure 4 shows the fiber positioned next to the shark, with the excitation light illuminating the skin.
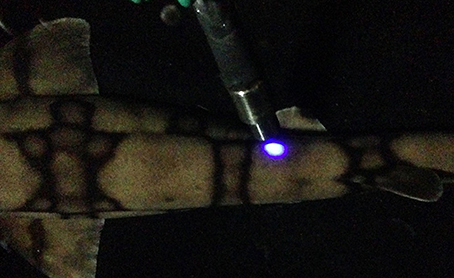
Figure 4. Bifurcated fiber optic probe of the Fluoromax-2 spectrofluorometer directed at a shark's skin, showing the excitation spot on the surface.
Figure 5 shows the excitation and emission spectra for the brightly fluorescent area of the skin. The results were identical for both specimens, showing an excitation maximum at ~450 nm and an emission maximum at ~520 nm.
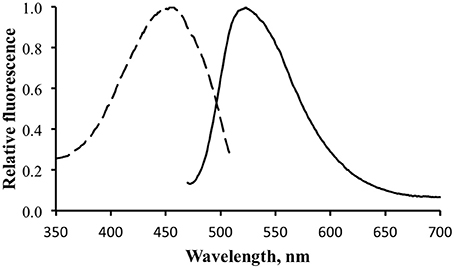
Figure 5. Fluorescence excitation (dotted line) and emission (solid line) for the shark fluorescence. Excitation measured with emission monochromator set at 530 nm. Emission measure with excitation monochromator set at 450 nm.
Incident light, reflected light, and total exitance were measured with a Model USB2000 fiber optic spectrometer (Ocean Optics, Dunedin, FL). For reflectance measurements illumination was provided by a halogen lamp. Reference measurements were made from a SpectralonTM disk with either nominal 50 or 99% reflectance across the visible spectrum. The nominal 50% reference surface was itself calibrated by measuring its reflectance relative to the 99% reference surface. The linearity of the spectrometer with respect to integration time was checked by measuring the same signal using different integration times and verifying that they matched after scaling.
Reflectance was computed as the ratio of the signal measured from the shark surface to that from the reference surface after the appropriate scaling factors (reference surface reflectance, integration time) were applied. Figure 6 shows a typical reflectance spectrum for a patch of skin with brighter fluorescence.
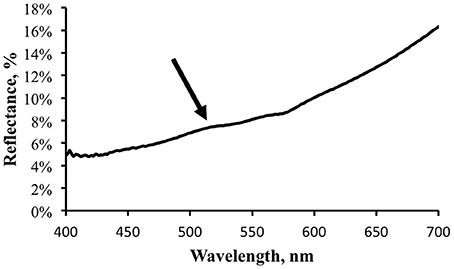
Figure 6. Reflectance spectrum, in percent, for the same light area of the shark skin for which the fluorescence was measured. Arrow indicates possible small increase in apparent reflectance due to fluorescence contribution.
There may be a small hint of a “bump” in the reflectance spectrum, indicated by the arrow in Figure 6. This corresponds to the location of the fluorescence emission peak and illustrates the point made above that when making reflectance measurements under broadband illumination the fluorescence component will be included. As more photons are absorbed at shorter wavelengths and transferred into longer wavelengths by fluorescence one expects to see a reflectance dip corresponding to the excitation spectrum and a reflectance peak corresponding to the emission spectrum. The stronger the fluorescence, the more accentuated these features would be. The reflectance measurement shown in Figure 6 indicates that the fluorescence does not contribute much to the apparent reflectance under this illumination. Note that this does not indicate that a fluorescence contribution will be inconsequential under all lighting conditions. Under narrow band blue illumination, for example, the fluorescence will comprise 100% of the exitance signal at the emission wavelengths. The significance of the fluorescence must always be analyzed relative to the total light field.
For the practical fluorescence efficiency determination the narrow band blue light source (Sola NIGHTSEA) was used for excitation. Figure 7 shows the measurement of the light leaving the surface of the shark. The measurement was made with an integration time selected to prevent the reflected blue light from saturating the detector. At this scale the fluorescence peak is barely visible. The data for the blue light reflected from the reference surface is not shown, but is essentially the same spectral distribution as the blue portion of the peak in Figure 7.
Figure 7. Normalized total exitance from the surface of the shark. The large peak at ~450 nm is reflected excitation light. The fluorescence is barely evident between 500 and 550 nm.
An additional measurement was made at a longer integration time to provide greater signal strength for the fluorescence portion of the exitance, elevating it above the noise floor (Figure 8). This caused the blue light signal to be saturated, but provided cleaner data for the fluorescence calculations. Note that the shape of the emission spectrum measured with the spectrometer is essentially identical to that measured with the spectrofluorometer (Figure 5).
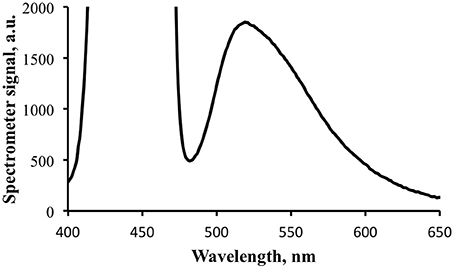
Figure 8. Fluorescence portion of the exitance signal shown in Figure 7. The signal for the reflected blue light is saturated at the integration time for this data collection.
The incident and emitted light spectral data were interpolated to 1 nm increments over the range of 400–700 nm. A spectral correction factor was then applied, determined separately by measuring the output of a light source with known spectral intensity distribution. The data were then converted to relative photon units by multiplying each data point by its corresponding wavelength. Note that it is not necessary for the data to be calibrated in absolute energy or photon units as long as the same processing procedure is used for all spectra. The incident blue light spectrum was further processed by multiplying by the excitation spectrum at corresponding wavelengths to find the “useful” incident light spectrum.
The processed data sets were then summed across the appropriate wavelength ranges to determine the total photons in the useful incident light and emitted fluorescence bands to find NA and NF, respectively. For the former this range was 420–470 nm, and for the latter it was 480–650 nm. While not perfect, these captured the bulk of the distribution under each curve. The practical fluorescence efficiency, ΦP. was then computed as NF/NA.
This procedure was followed for multiple measurements from three sharks and yielded ΦP values ranging from 0.1 to 0.4%, with one reading closer to 1%.
This information can be used to model the spectrum of light leaving the surface of the shark under arbitrary illumination conditions. We do this with downwelling light spectra previously computed (Mazel, 2005) using Hydrolight for two cases—relatively clear tropical waters (Bahamas) and temperate coastal water (New England). The Hydrolight spectra were computed with water optical property data measured in situ in these environments. The following is not intended as a comprehensive investigation, but rather to illustrate the modeling process and what can be learned from it.
The contribution of fluorescence to an optical signal will be maximized when (1) the downwelling light spectrum overlaps significantly with the excitation spectrum and (2) the fluorescence emission occurs at wavelengths that are not strongly present in the downwelling light. Satisfying these two conditions means maximizing “pumping” of fluorescence and minimizing competition from reflected photons. Figure 9 shows normalized downwelling light spectra at a depth of 21 m at 0800 local time, 50% cloud cover, and a flat sea surface for both the tropical (thick solid line) and temperate (thin solid line) cases. The normalized excitation (dashed line) and emission (dotted line) spectra are overlaid to show their relationship to the available light. The tropical case indicates a predominantly blue light field while the temperate case is strongly peaked in the green. The minimal energy at wavelengths longer than 600 nm in both cases results from absorption by water itself, while the strong attenuation of blue light in the temperate case results from dissolved organic matter. Note that these spectra are normalized, and the overall light level at this depth in temperate waters would be much lower than that in tropical. We can see from the plot that there is reasonable overlap between the available light and the excitation spectrum for the tropical water case, but not for the temperate. There is downwelling light that overlaps with the emission spectrum in both cases, indicating that any fluorescence will have to “compete” with reflected light.
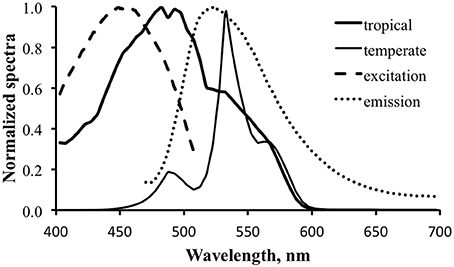
Figure 9. Normalized downwelling light spectra at a depth of 21 m at 0800 local time, 50% cloud cover, and a flat sea surface for tropical (thick solid line) and New England temperate (thin solid line) cases. Normalized excitation (dashed line) and emission (dotted line) spectra show their relationship to the available light.
Figure 10 shows the computed results for fluorescence enhancement for the tropical water case. The thick dark line is the downwelling light spectrum, identical to that in Figure 9. The thick dashed line is the “useful” spectrum, calculated by multiplying the downwelling spectrum by the excitation spectrum (Equation 4). This is the data that will be converted to relative photons and integrated to calculate total available photons (NA). This is in turn multiplied by the practical fluorescence efficiency (ΦP) to find the total fluoresced photons (NF). That number is used to calculate the scale factor, S, to be applied to the prototype fluorescence emission spectrum, M (Equation 7). For the purposes of generating Figure 10 an arbitrary value of 3% was used for ΦP. Note that this is about an order of magnitude greater than the actual ΦP determined for the shark fluorescence, but it was necessary to use a larger value for the spectrum to be evident in the figure.
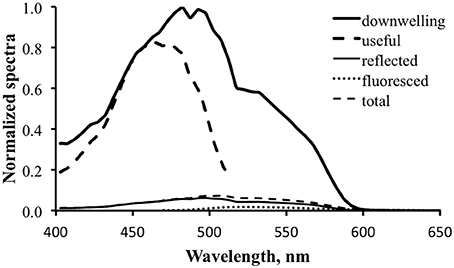
Figure 10. Fluorescence enhancement modeling for the tropical water case. Downwelling light—thick solid line; computed “useful” downwelling light—thick dashed line; computed reflectance—thin solid line; fluoresced light computed with 3% practical fluorescence efficiency—dotted line; modeled total exitance—thin dashed line.
Figure 11 is a detail of the lower portion of Figure 10. The calculated reflected light spectrum (Equation 2) is represented by the thin dark line, the scaled prototype fluorescence emission spectrum by the dotted line, and the total exitance, the sum of the reflected light spectrum and the scaled fluorescence emission spectrum, by the thin dashed line. If this were an actual efficiency value the fluorescence would indeed be boosting the available optical signal.
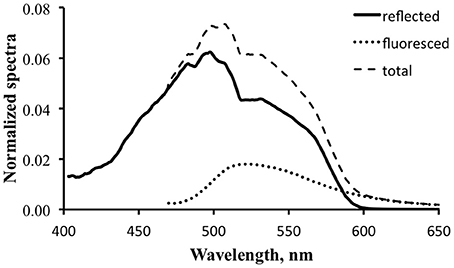
Figure 11. Detail of reflected light (solid line), fluorescence (dotted line), and computed total exitance (dashed line) for the tropical water case using a value of 3% for practical fluorescence efficiency.
We can use the data to explore the potential for a fluorescence contribution under any given illumination condition by holding everything else constant and varying ΦP. To generate the data for Figure 12 we used the tropical data and ΦP values of 0.5, 1, and 5%. The 0.5% value is closest to the actual measured values. The results indicate that it would require a fluorescence efficiency much larger than this to have a significant effect on the total exitance.
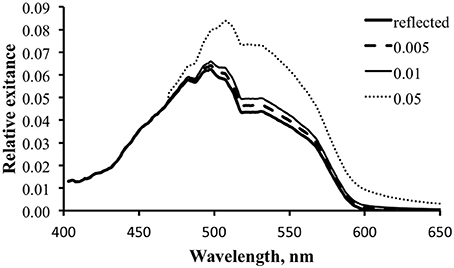
Figure 12. Modeled spectral exitance for the tropical water case with ΦP values of 0.5 (dashed line), 1 (thin solid line), and 5% (dotted line).
Figure 13 shows the results for fluorescence enhancement for the temperate water case. As with Figure 10, the thick dark line is the downwelling light spectrum and the thick dashed line is the computed “useful” spectrum. Note how wavelength-limited and weak this is relative to that for the tropical case. This is because of the poor overlap between the available downwelling light and the fluorescence excitation spectrum. The thin dark line is the computed reflected light. A value of 5% was used for ΦP to generate the data for this graph, but even at this enhanced level the fluorescence is essentially “invisible.”
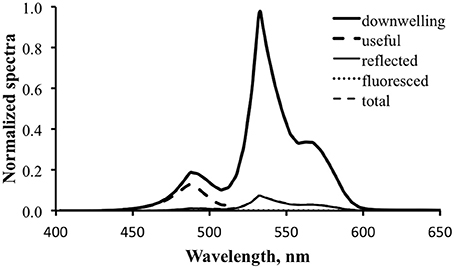
Figure 13. Fluorescence enhancement modeling for the tropical water case. Downwelling light—thick solid line; computed “useful” downwelling light—thick dashed line; computed reflectance—thin solid line; fluoresced light computed with 5% practical fluorescence efficiency—dotted line; modeled total exitance—thin dashed line. At this scale the fluorescence contribution is not visible.
Figure 14 is similar to Figure 12, exploring the effect of varying fluorescence efficiency on the potential for fluorescence to contribute to the optical signature for the temperate water case. The combination of the inefficient “pumping” of fluorescence and the significant competition from reflected light in these green-shifted temperate waters renders the fluorescence contribution insignificant for the visual signal.
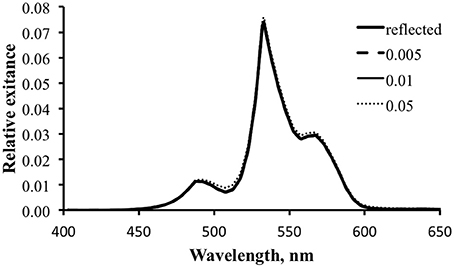
Figure 14. Modeled spectral exitance for the temperate water case with ΦP values of 0.5 (dashed line), 1 (thin solid line), and 5% (dotted line).
Discussion
Observations of fluorescence in nature are intriguing and each one potentially opens a new direction for research into visual ecology. The existence of fluorescence, however, is not in itself evidence that the fluorescence is visually functional. Fluorescence can only play a role in vision if it makes a material contribution to the exitance, the total light leaving the surface. The exitance from a fluorescent surface will include contributions from both light that has been reflected without a change in wavelength and light that has been absorbed and re-emitted at longer wavelengths by fluorescence. For the contribution of the latter to be “material” it must change the spectral signature relative to that which is produced only by the former. This will generally occur when either or both of the following are true: (1) the fluorescence intensity is intense due to a combination of good overlap of the available light with the fluorescence excitation spectrum and a high practical fluorescence efficiency; (2) the fluorescence wavelength is in a region of the spectrum that is either weak or not present under the relevant illumination conditions.
The methods described in this manuscript provide a framework and means for measuring optical properties quantitatively and using that data to compute the spectral distribution of light leaving the surface under arbitrary illumination conditions. The results can also be used to compute the signal enhancement resulting from the fluorescence, either as a function of wavelength or as a total photon contribution within a defined spectral band. Modeling over a range of conditions such as depth, time of day, and water optical properties can help in identifying scenarios in which the fluorescence has the potential to be a useful visual signal.
There are alternative ways to approach the measurement and modeling of fluorescence contribution (e.g., Bitton et al., 2017; Taboada et al., 2017). While these differ in detail from the approach described here they lead to the same end: an estimate of the contribution of fluorescence to the optical signal.
The results of quantitative measurement and modeling are not the complete story in regard to a visual function. As outlined in the introduction there are four conditions that must be satisfied for fluorescence to be demonstrated to play a role in vision:
1. Fluorescence exists when the subject is illuminated at wavelengths that are naturally present in its habitat.
2. The organism for which a viewing function is postulated is physiologically capable of perceiving the wavelengths of the fluorescence emission.
3. There is enough energy transferred into the fluorescence band to make a meaningful contribution to the visual signal under relevant illumination conditions.
4. The viewing organism's behavior is influenced by the presence vs. absence of fluorescence in the subject.
The work described here addresses condition #3. If fluorescence measurement and modeling indicate the potential for fluorescence to make a significant contribution it will still be necessary to determine if the exitance spectrum is further modulated by transmission through the medium between the subject and the putative viewer, and the nature of ocular filters (Heinermann, 1983; Douglas and Marshall, 1999) or preferential retinal spectral sensitivities in that viewer, as determined by microspectrophotometry (Hanaoka and Fujimoto, 1957; Chung and Marshall, 2016). This analysis also does not account for the background, whether open water or some variety of benthic habitat, against which the subject is situated. The background is important as the fluorescence can only be functional if it creates contrast (in the cases of intraspecific communication, mate attraction, display, warning coloration, and the like) or reduces contrast (in the case of camouflage) relative to the spectral signature in the absence of fluorescence. And finally, a behavioral response must be demonstrated.
It is also possible that measurement and modeling indicate that while a subject appears brightly fluorescent when viewed under intense excitation in the dark, the practical fluorescence efficiency is so low, or there is so much competition from reflected ambient light at the wavelengths of fluorescence, that the fluorescence contribution would be trivial under natural illumination conditions. This information would then be a factor in deciding whether further investigation of a visual function is warranted.
Differences in the way that the question of visual function of fluorescence is addressed can be seen in the literature. Arnold et al. (2002) demonstrated all criteria for a fluorescence function in a bird (budgerigar, Melopsittacus undulatus), including a behavioral response. The quantitative approaches of Mazel et al. (2004), Taboada et al. (2017), and Bitton et al. (2017) indicated the potential for fluorescence to play a visual role in a stomatopod (Lysiosquillina glabriuscula), frog (Hypsiboas punctatus) and fish (Trypterygion delaisi), respectively. Another quantitative treatment (Iriel and Lagorio, 2010) indicated that the fluorescence of the flowers investigated was too weak relative to reflected light to have a functional role.
In contrast, several recent papers either imply or ascribe a visual function based on conditions 1 and 2 alone, without a quantitative evaluation of fluorescence contribution (Sparks et al., 2014; Gruber et al., 2016; Wails et al., 2017). The lack of quantitative support does not mean there is not a visual function in these cases, just that it is premature to suggest that there is without also considering the possibility that the fluorescence may be a non-functional epiphenomenon. The conditions for demonstrating a fluorescence function are known, as are the tools and methods for performing the quantitative analyses. These should be brought to bear in any investigation of visual function of fluorescence.
Ethics Statement
Measurements on live sharks were made in cooperation with the Seacoast Science Center, Rye NH. These were non-contact optical measurements with no invasive procedures. The handling of the specimens in order to enable the research was carried out by Science Center staff and did not differ from their normal handling of the specimens.
Author Contributions
The author confirms being the sole contributor of this work and approved it for publication.
Funding
The original work in developing methods for analyzing the contribution of fluorescence to an optical signal was carried out with support from the Environmental Optics Program of the Office of Naval Research, award N0001402C0089. The more recent measurements of shark fluorescence were self-funded.
Conflict of Interest Statement
CM is the proprietor of NIGHTSEA, a company that designs and makes equipment for viewing fluorescence. Individuals pursuing marine or terrestrial fluorescence research utilizing the methods described here could potentially be purchasers of some of the equipment, but there are alternatives on the market.
References
Arnold, K. E., Owens, I. P. F., and Marshall, N. J. (2002). Fluorescent signaling in parrots. Science 295:92. doi: 10.1126/science.295.5552.92
Bitton, P. P., Harant, U. K., Fritsch, R., Champ, C. M., Temple, S. E., and Michiels, N. K. (2017). Red fluorescence of the triplefin Tripterygion delaisi is increasingly visible against background light with increasing depth. R. Soc. Open Sci. 4:161009. doi: 10.1098/rsos.161009
Bou-Abdallah, F., Chasteen, N. D., and Lesser, M. P. (2006). Quenching of superoxide radicals by green fluorescent protein. Biochimica Et Biophysica Acta General Subjects 1760, 1690–1695. doi: 10.1016/j.bbagen.2006.08.014
Chung, W. S., and Marshall, N. J. (2016). Comparative visual ecology of cephalopods from different habitats. Proc. R. Soc. B 283:20161346. doi: 10.1098/rspb.2016.1346
Douglas, R. H., and Marshall, N. J. (1999). “A review of vertebrate and invertebrate ocular filters,” in Adaptive Mechanisms in the Ecology of Vision, eds S. N. Archer, M. B. A. Djamgoz, E. R. Loew, J. C. Partridge and S. Vallerga (Dordrecht: Springer), 95–162. doi: 10.1007/978-94-017-0619-3_5
Fuchs, E. (2001). Separating the fluorescence and reflectance components of coral spectra. Appl. Opt. 40, 3614–3621. doi: 10.1364/AO.40.003614
Gerlach, T., Sprenger, D., and Michiels, N. K. (2014). Fairy wrasses perceive and respond to their deep red fluorescent coloration. Proc. R. Soc. B 281:20140787. doi: 10.1098/rspb.2014.0787
Gittins, J. R., D'Angelo, C., Oswald, F., Edwards, R. J., and Wiedenmann, J. (2015). Fluorescent protein-mediated colour polymorphism in reef corals: multicopy genes extend the adaptation/acclimatization potential to variable light environments. Mol. Ecol. 24, 453–465. doi: 10.1111/mec.13041
Gruber, D. F., Loew, E. R., Deheyn, D. D., Akkaynak, D., Gaffney, J. P., Smith, W. L., et al. (2016). Biofluorescence in catsharks (Scyliorhinidae): fundamental description and relevance for elasmobranch visual ecology. Sci. Rep. 6:24751. doi: 10.1038/srep24751
Haddock, S. H., and Dunn, C. W. (2015). Fluorescent proteins function as a prey attractant: experimental evidence from the hydromedusa Olindias formosus and other marine organisms. Biol. Open. 4, 1094–1104. doi: 10.1242/bio.012138
Haddock, S. H., Dunn, C. W., Pugh, P. R., and Schnitzler, C. E. (2005). Bioluminescent and red-fluorescent lures in a deep-sea siphonophore. Science 309, 263–263. doi: 10.1126/science.1110441
Hanaoka, T., and Fujimoto, K. (1957). Absorption spectrum of a single cone in carp retina. Jpn. J. Physiol. 7, 276–285. doi: 10.2170/jjphysiol.7.276
Iriel, A., and Lagorio, M. G. (2010). Is the flower fluorescence relevant in biocommunication? Naturwissenschaften 97, 915–924. doi: 10.1007/s00114-010-0709-4
Johnsen, S. (2011). The Optics of Life: A Biologist's Guide to Light in Nature. Princeton, NJ: Princeton University Press.
Kelmanson, I. V., and Matz, M. V. (2003). Molecular basis and evolutionary origins of color diversity in great star coral Montastraea cavernosa (Scleractinia: Faviida). Mol. Biol. Evol. 20, 1125–1133. doi: 10.1093/molbev/msg130
Matz, M. V., Marshall, N. J., and Vorobyev, M. (2006). Are corals colorful? Photochem. Photobiol. 82, 345–350. doi: 10.1562/2005-08-18-RA-653
Mazel, C. H. (2005). Underwater fluorescence photography in the presence of ambient light. Limnol. Oceanogr. Methods 3, 499–510. doi: 10.4319/lom.2005.3.499
Mazel, C. H., Cronin, T. W., Caldwell, R. L., and Marshall, N. J. (2004). Fluorescent enhancement of signaling in a mantis shrimp. Science 303:51. doi: 10.1126/science.1089803
Mazel, C. H., and Fuchs, E. (2003). Contribution of fluorescence to the spectral signature and perceived color of corals. Limnol. Oceanogr. 48, 390–401. doi: 10.4319/lo.2003.48.1_part_2.0390
Michiels, N., Anthes, N., Hart, N., Herler, J., Meixner, A., Schleifenbaum, F., et al. (2008). Red fluorescence in reef fish: a novel signalling mechanism? BMC Ecol. 8:16. doi: 10.1186/1472-6785-8-16
Mobley, C. D. (1994). Light and Water: Radiative Transfer in Natural Waters. San Diego, CA: Academic Press.
Palmer, C. V., Modi, C. K., and Mydlarz, L. D. (2009). Coral fluorescent proteins as antioxidants. PLoS ONE 4:e7298. doi: 10.1371/journal.pone.0007298
Salih, A., Larkum, A., Cox, G., Kuhl, M., and Hoegh-Guldberg, O. (2000). Fluorescent pigments in corals are photoprotective. Nature 408, 850–853. doi: 10.1038/35048564
Smith, E. G., D'Angelo, C., Sharon, Y., Tchernov, D., and Wiedenmann, J. (2017). Acclimatization of symbiotic corals to mesophotic light environments through wavelength transformation by fluorescent protein pigments. Proc. R. Soc. B Biol. Sci. 284:20170320. doi: 10.1098/rspb.2017.0320
Sparks, J. S., Schelly, R. C., Smith, W. L., Davis, M. P., Tchernov, D., Pieribone, V. A., et al. (2014). The covert world of fish biofluorescence: a phylogenetically widespread and phenotypically variable phenomenon. PLoS ONE 9:e83259. doi: 10.1371/journal.pone.0083259
Taboada, C., Brunetti, A. E., Pedron, F. N., Neto, F. C., Estrin, D. A., Bari, S. E., et al. (2017). Naturally occurring fluorescence in frogs. Proc. Natl. Acad. Sci. U.S.A. 114, 3672–3677. doi: 10.1073/pnas.1701053114
Ugalde, J. A., Chang, B. S. W., and Matz, M. V. (2004). Evolution of coral pigments recreated. Science 305:1433. doi: 10.1126/science.1099597
Keywords: fluorescence, vision, optical signature, visual signature modeling, fluorescence and marine life
Citation: Mazel C (2017) Method for Determining the Contribution of Fluorescence to an Optical Signature, with Implications for Postulating a Visual Function. Front. Mar. Sci. 4:266. doi: 10.3389/fmars.2017.00266
Received: 01 May 2017; Accepted: 02 August 2017;
Published: 21 August 2017.
Edited by:
Daniel Wangpraseurt, University of Cambridge, United KingdomReviewed by:
Jörg Wiedenmann, University of Southampton, United KingdomDaniel Osorio, University of Sussex, United Kingdom
Copyright © 2017 Mazel. This is an open-access article distributed under the terms of the Creative Commons Attribution License (CC BY). The use, distribution or reproduction in other forums is permitted, provided the original author(s) or licensor are credited and that the original publication in this journal is cited, in accordance with accepted academic practice. No use, distribution or reproduction is permitted which does not comply with these terms.
*Correspondence: Charles Mazel, mazelcharles@gmail.com